Abstract
T cell acute lymphoblastic leukemia (T-ALL) is a hematological malignancy with dismal overall prognosis, exhibiting up to a 25% relapse rate, mainly due to the absence of non-cytotoxic targeted therapy options. Despite the fact that drugs targeting the function of key epigenetic factors have been approved in the context of hematopoietic disorders1 and the recent identification of mutations affecting chromatin modulators in a variety of leukemias2,3, “epigenetic” drugs are not currently used for TALL treatment. Recently, we described a tumor suppressor role of the polycomb repressive complex 2 (PRC2) in this tumor4. Here we sought out to delineate the role of histone 3 lysine 27 (H3K27) demethylases, JMJD3 and UTX. We show that JMJD3 is essential for initiation and maintenance of disease, as it controls important oncogenic gene targets through the modulation of H3K27 methylation. In contrast, UTX acts a tumor suppressor and frequently genetically inactivated in T-ALL. Moreover, we demonstrate that the small molecule inhibitor GSKJ45 affects T-ALL growth, by targeting JMJD3 activity. These findings show that two proteins with similar enzymatic function can play opposing roles in the context of the same disease and pave the way for the use of a new category of epigenetic inhibitors in hematopoietic malignancies.
In recent studies others and we revealed a key tumor-suppressor function for PRC2 that catalyzes methylation of H3K272,4,29. Since net H3K27me3 levels are dictated by the balance between histone methylation and active demethylation, we hypothesized that removal of methyl groups from H3K27 is also an important process in T-ALL progression. We therefore investigated possible roles for H3K27 demethylases in T-ALL (see also Supplementary File 1 for extended Introduction); Ubiquitously transcribed tetratricopeptide Repeat X-linked Protein (UTX6,7, official symbol KDM6A) is a ubiquitously expressed protein that controls basal levels of H3K27me3 and induction of ectoderm and mesoderm differentiation8,9 and is essential for reprogramming10. Jumonji d3 (JMJD36,7, KDM6B) is induced upon inflammation11, viral and oncogenic stimuli12,13 controls neuronal and epidermal differentiation14,15 and inhibits reprogramming16. UTX is as a tumor suppressor in several solid tumors17,18,3,19,20. However, the roles of these two demethylases as direct modulators of the oncogenic state are largely uncharacterized12,13.
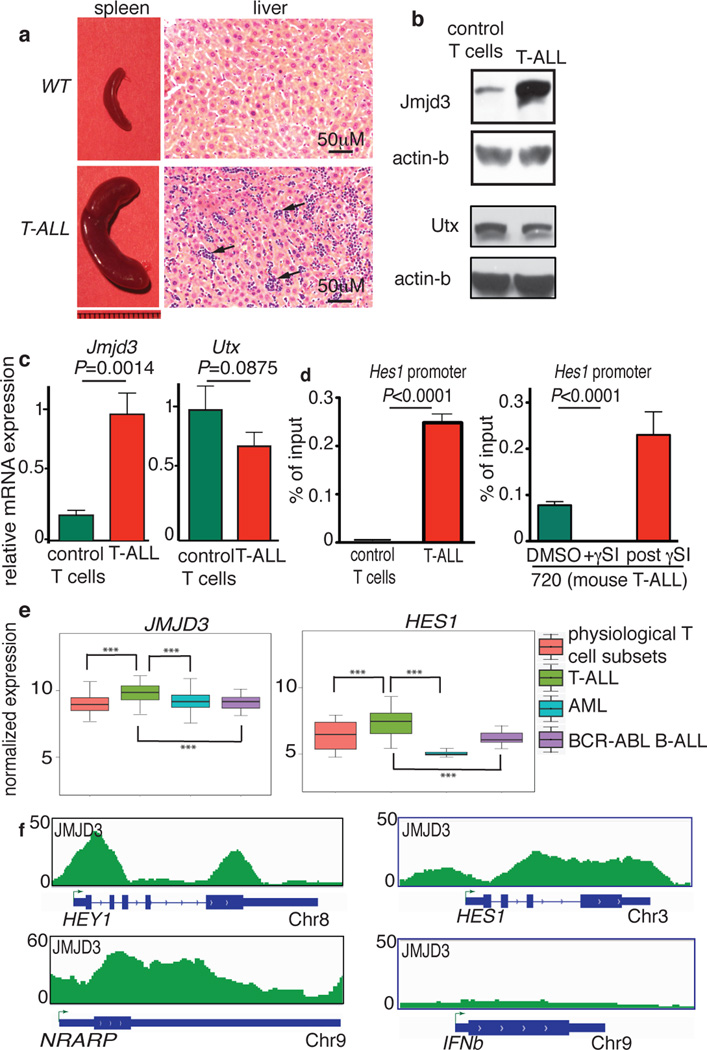
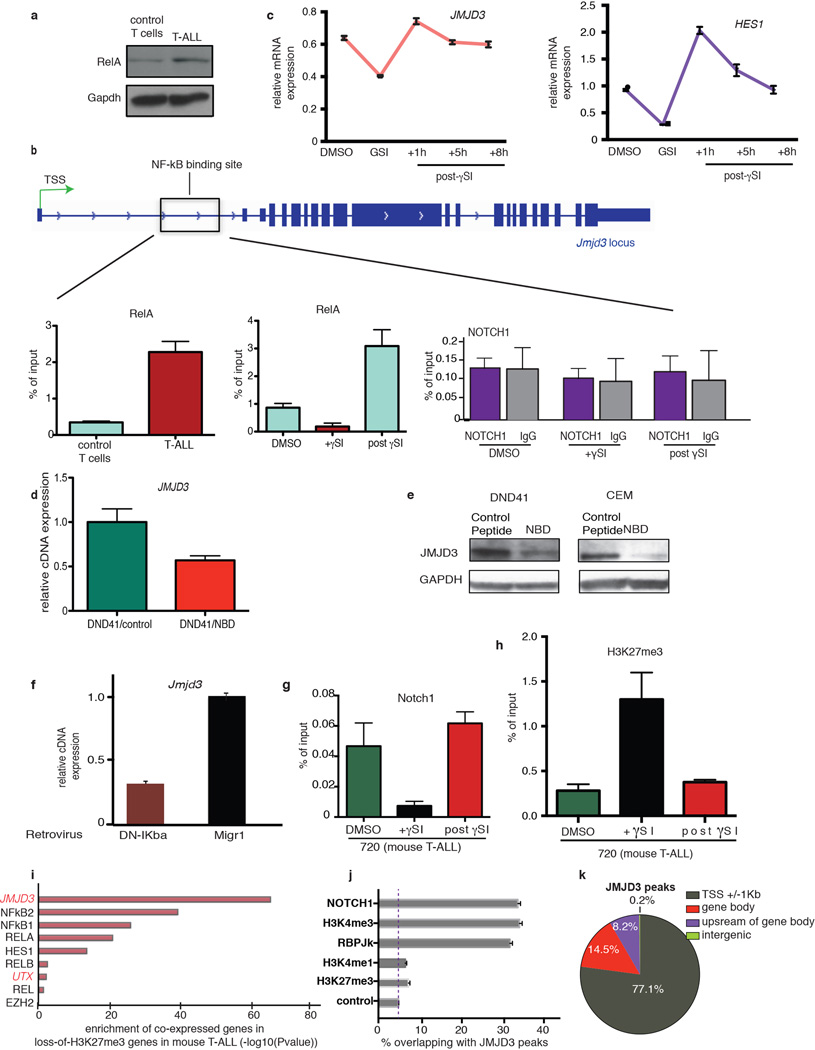
We have generated and studied NOTCH1-induced T-ALL animal models4 (Fig. 1a), as activating mutations of NOTCH1 are a defining feature of this disease21. Jmjd3 mRNA and protein expression levels were significantly higher in leukemic cells when compared to untransformed CD4+/CD8+ control T cells that exhibit low levels of active Notch1 whereas Utx (and Ezh24) expression did not change significantly (Fig. 1b, c and Supplementary File 2/Table 1) upon transformation. It was previously shown that NFkB controls JMJD3 expression during inflammation11 and that NOTCH1 induces the NFkB pathway in T-ALL22. Here, we were able to show increased expression of the p65 (Rela) subunit of NFkB and its binding-but not Notch1- on Jmjd3 control elements in T-ALL cells (Extended Data Fig. 1a, b). Modulation of the levels of intracellular NOTCH1 or activity of NFkB pathway decreased significantly the amounts of NFkB bound on the Jmjd3 elements, as well as Jmjd3 mRNA expression (Extended Data Fig. 1b–f). We then probed for Jmjd3 binding on specific oncogenic loci, previously shown to be important in T-ALL4. We found that Jmjd3 binding was highly enriched on the Hes1 promoter (Fig. 1d, left), depended on the activation of the Notch1 pathway and negatively correlated with H3K27m3 levels (Extended Data Fig. 1g, h).
Figure 1. JMJD3 is highly expressed in T-ALL and controls expression of important oncogenic targets.
a, Size comparison of the spleens (left) and hematoxylin and eosin staining of the liver (right) of healthy (WT, top) and leukemic (T-ALL, bottom) mice. Arrows denote leukemic infiltration in the liver of T-ALL mouse. b, c, Protein (b) and transcript (c) levels of Jmjd3 and Utx demethylases in control T cells (CD4+/CD8+ thymocytes) and T-ALL. Representative sample (a, b) or the average (c) of three mice is shown. d, ChIP for Jmjd3 on Hes1 promoter in control T cells and T-ALL (left panel) and upon γSI treatment in T-ALL (right panel) (n=3). e, Expression analysis of JMJD3 and HES1 amongst 595 primary samples of T (83 samples)- and B (23)-cell Leukemia, Myeloid leukemia (537) as well as physiological T cell subsets (24)23. P–values (Wilcoxon test), JMJD3: T-ALL vs T cells: 4.0×10⁻⁶, T-ALL vs AML: 1.1×10⁻¹³, T-ALL vs B-ALL: 2.2×10⁻⁵. Hes1: T-ALL vs T cells: 3.7×10⁻⁴, T-ALL vs AML: 3.5×10−43, T-ALL vs B-ALL: 1.3×10⁻⁶. f, Snapshots of JMJD3 binding in human T-ALL. Three NOTCH1 targets and the Interferon beta (IFNβ) gene (negative control) are shown.
Analyses of human leukemia cases2,23,24,25 showed that JMJD3 is more highly expressed in T-ALL compared to normal T cell progenitors23 and other types of leukemia24,25, similarly to the classical NOTCH1 target HES1 (Fig. 1e). Genes co-expressed with JMJD3 in human primary samples were found to exhibit loss of H3K27me3 during leukemia progression (Extended Data Fig. 1i), suggesting a connection between expression of JMJD3 and H3K27me3 levels on specific targets.
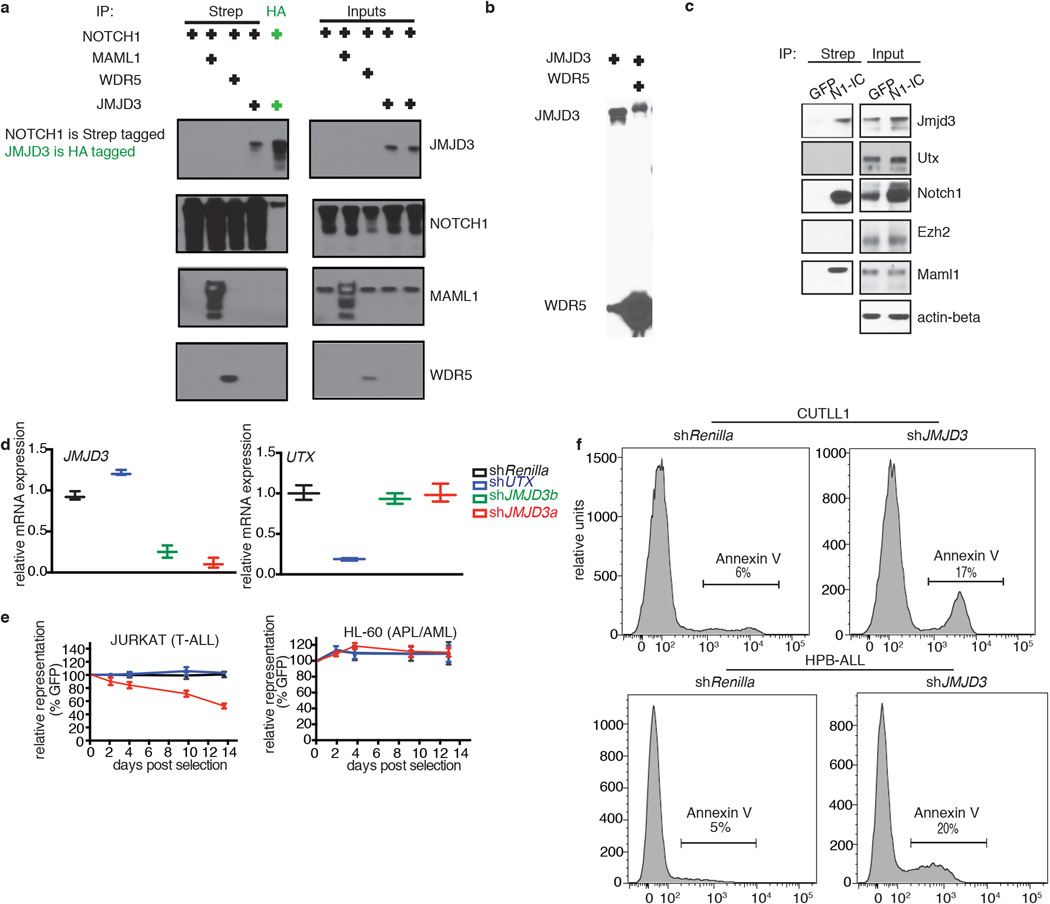
ChIP-Seq studies in T-ALL cells (CUTTL1) showed that JMJD3 binds to important NOTCH1 targets with oncogenic function (like HEY1, NRARP and HES1) (Fig. 1f). There is a statistically significant co-occupancy of JMJD3 with NOTCH126 (33% of top JMJD3 peaks are occupied by NOTCH1, 6.9-fold enrichment over control, P<10−3), the NOTCH1 partner RBPJk and the activating mark H3K4me326 (Extended Data Fig. 1j). The majority of JMJD3 binding sites were localized around the transcriptional start sites (TSSs) of genes (Fig. 1k) in a fashion similar to NOTCH126. These results suggest a key role for JMJD3 in oncogenic programs in T-ALL through interaction with NOTCH1. Protein immunoprecipitation studies in 293T cells as well as T-ALL lines showed that JMJD3 is part of the NOTCH1 transcriptional complex as it interacts directly with NOTCH1 and MAML1 whereas there was no NOTCH1 interaction with EZH2 or UTX (Extended Data Fig. 2a–c). As JMJD3 has been shown to be member of MLL complexes11, we tested whether it interacts with WDR5, a key subunit of MLL complex. We show here that JMJD3 interacts with WDR5 (Extended Data Fig. 2b), suggesting a potential NOTCH1:JMJD3:MLL complex on target promoters.
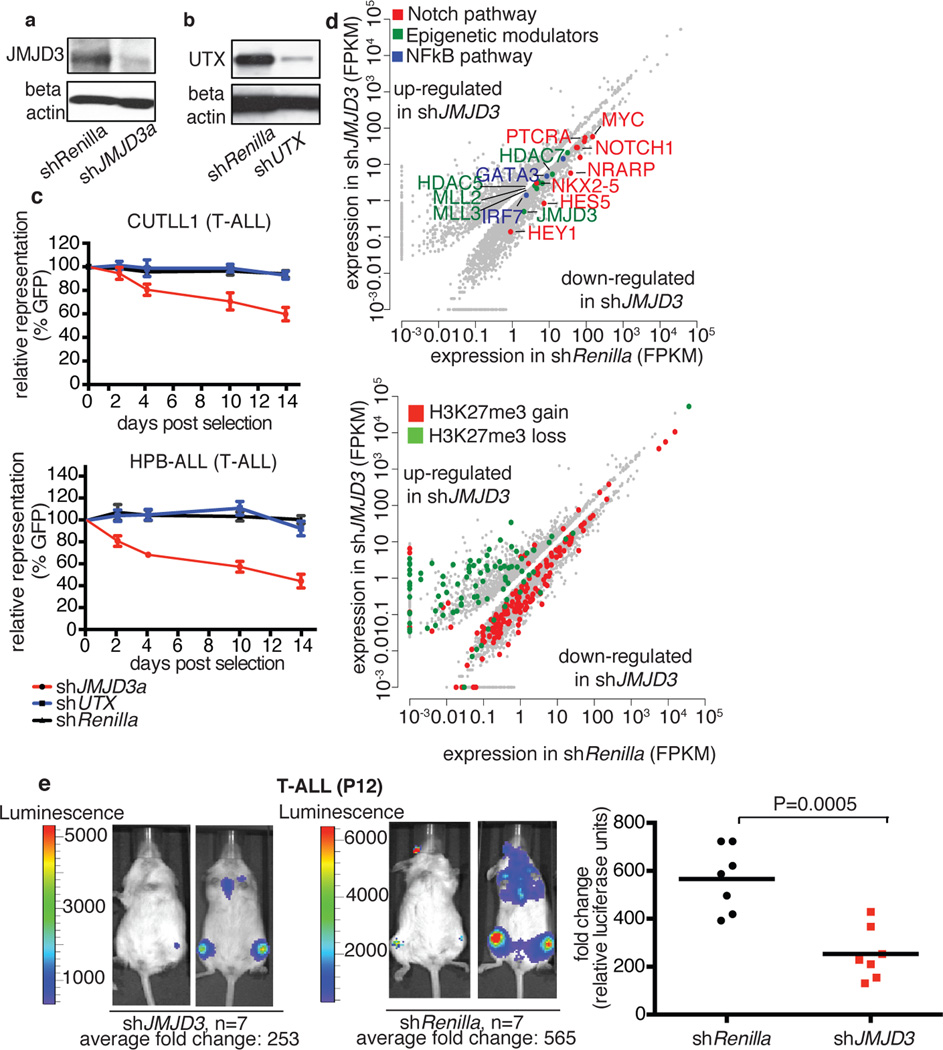
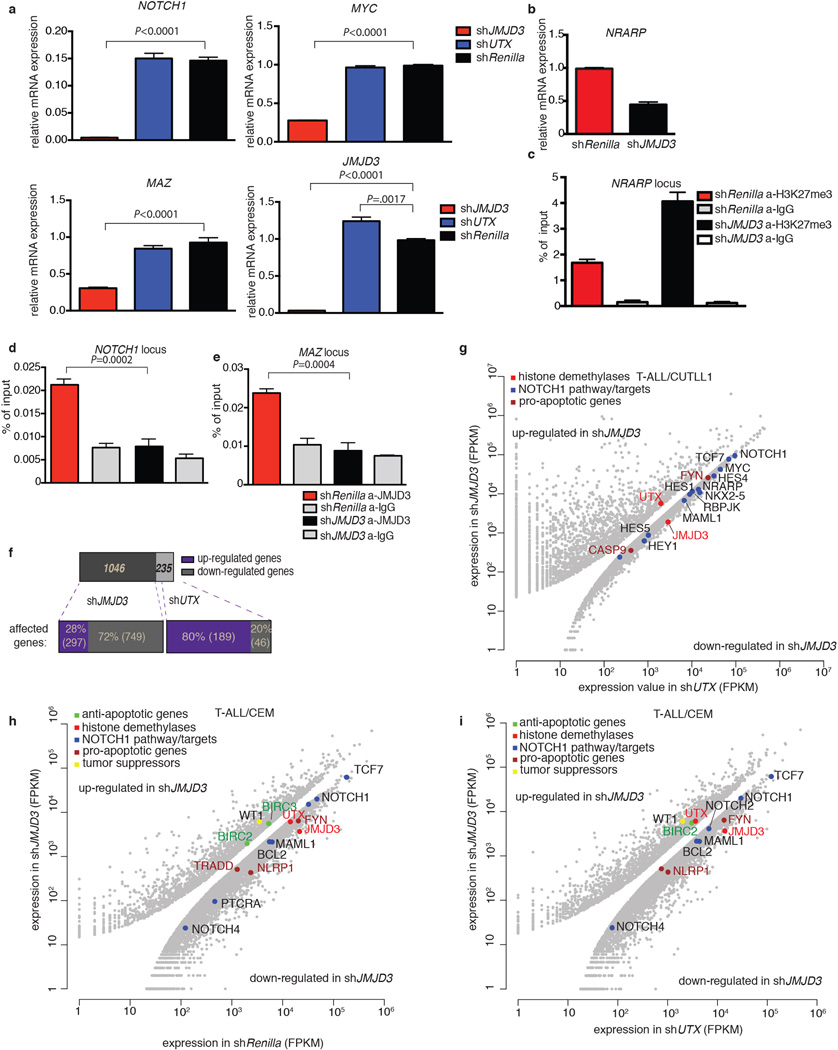
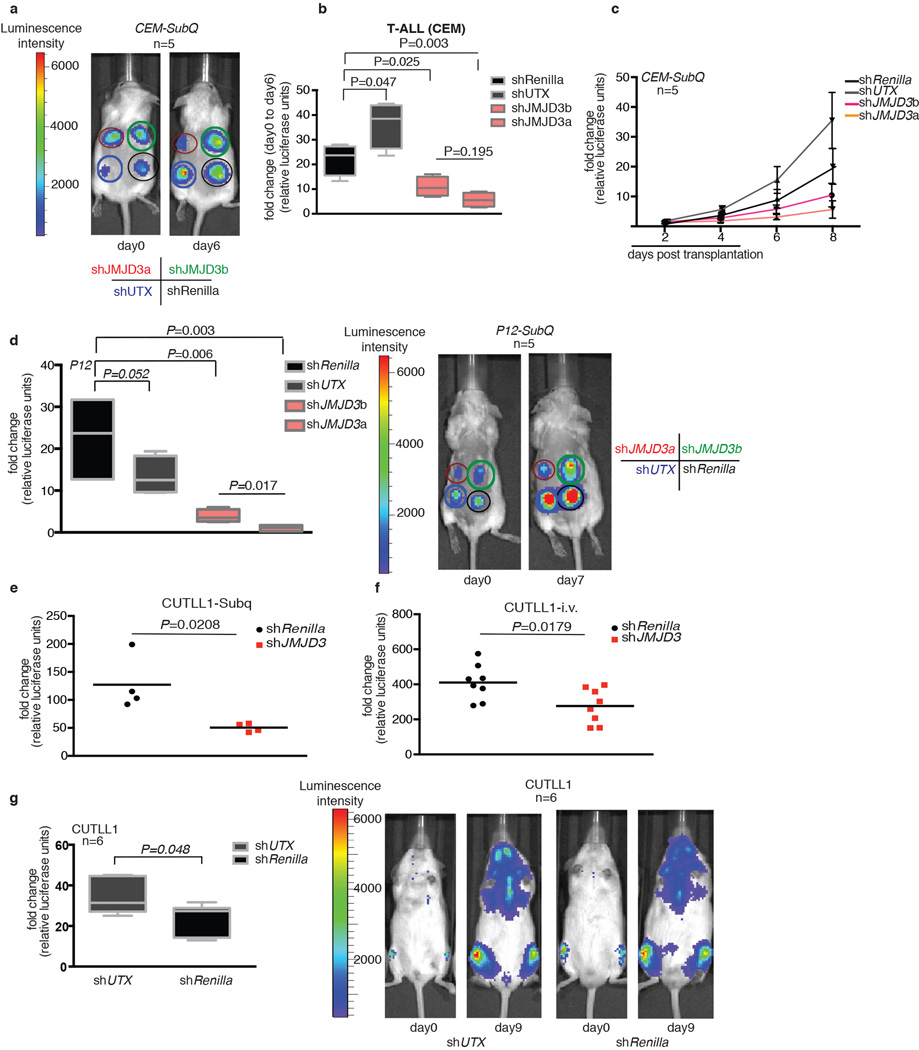
To clarify the role of JMJD3 and UTX in the maintenance of leukemia, we performed genomic knockdown of JMJD3 in human T-ALL using two different short hairpin RNAs (shRNAs, Fig. 2a, b and Extended Data Fig 2d). Treatment with shJMJD3 but not shUTX affected the viability of leukemic cells, as shown by loss of representation studies and apoptosis assays, in contrast to myeloid leukemia lines used as controls (Fig. 2c Extended Data Fig. 2e, f). Expression of NOTCH1 targets was negatively affected by shJMJD3, accompanied by loss of JMJD3 and gain of H3K27me3 on their promoters (Extended Data Fig. 3 a–e). Genome-wide expression analysis showed that more transcripts were significantly down-regulated than upregulated (749 protein-coding genes vs 297, Fig. 2d top panel and Extended Data Fig. 3f), in agreement with the JMJD3 role as a transcriptional activator. The down-regulated genes were found significantly enriched in genes that gained H3K27me3 on their promoters (Fig. 2d, bottom panel, P=1.015673e-07). shUTX downand up-regulated gene signatures were reversed in terms of gene numbers (46 down-regulated and 189 upregulated protein-coding genes, when compared to both shRenilla and shJMJD3). Intriguingly, JMJD3 expression itself is significantly upregulated upon UTX silencing (Extended Data 3a). Well-characterized NOTCH1 targets, as well as genes of the NFkB pathway were downregulated as part of the JMJD3 signature (Fig. 2d top and Extended Data Fig. 3g). These findings were confirmed using additional T-ALL lines with high levels of oncogenic NOTCH1 activity21 (Extended Data Fig. 3h, i). Subcutaneous (subq) or intravenous (i.v.) xenograft models of T-ALL cell lines (CUTLL1, CEM and P12) treated with either of the two shRNAs against JMJD3 (shJMJD3a and b) and transplanted into immuno-compromised mice (Rag2−/−γc−/−) showed a significant growth disadvantage (Fig. 2e and Extended Data Fig. 4a–f). Interestingly, silencing of UTX leads to enhanced proliferation in many cases, suggesting a possible tumor suppressor function in vivo (Extended Data Figure 4g).
Figure 2. Dissecting the oncogenic role of JMJD3 in T-ALL.
Protein levels of JMJD3 (a) and UTX (b) in T-ALL cells (CUTLL1), expressing corresponding shRNAs against the two demethylases. Representative plots of three independent studies (biological replicates) are shown. c, Effects on T-ALL cell proliferation as measured by loss of GFP-expressing hairpin. In all lines the average of three representative studies is shown. d, Differential expression analysis upon knockdown of JMJD3 in T-ALL (top panel). Loci of downregulated genes exhibit an increase of H3K27me3 (red dots in the bottom panel), while upregulated genes exhibit decrease in H3K27me3. Representation of three independent studies is shown. e, In vivo growth of P12 T-ALL cells in i.v. xenograft studies upon genomic ablation of JMJD3 and Renilla (control). One million P12 cells were injected into seven animals. Sublethally irradiated Rag γc−/− immuno-compromised mice were used as recipients and transplantation leukemic cell growth is compared to the baseline (day zero). Day zero is the first day when substantially detectable luciferase intensity was measured. The last day of the experiment was the day that either luciferase intensity reached saturation or the mice were euthanized for humanitarian reasons.
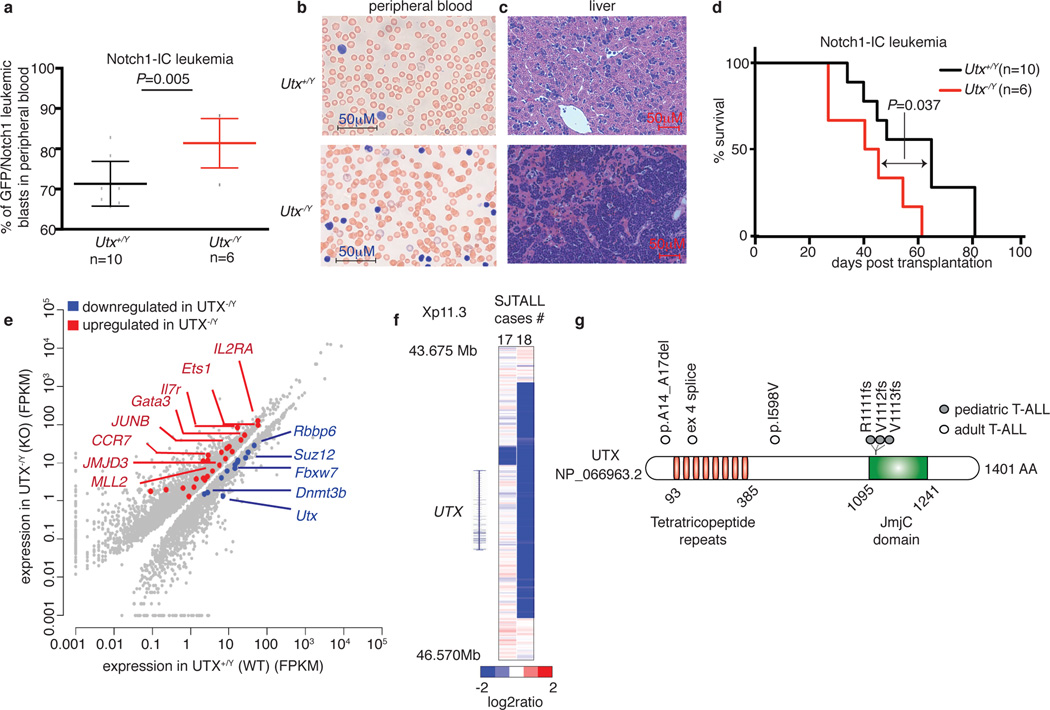
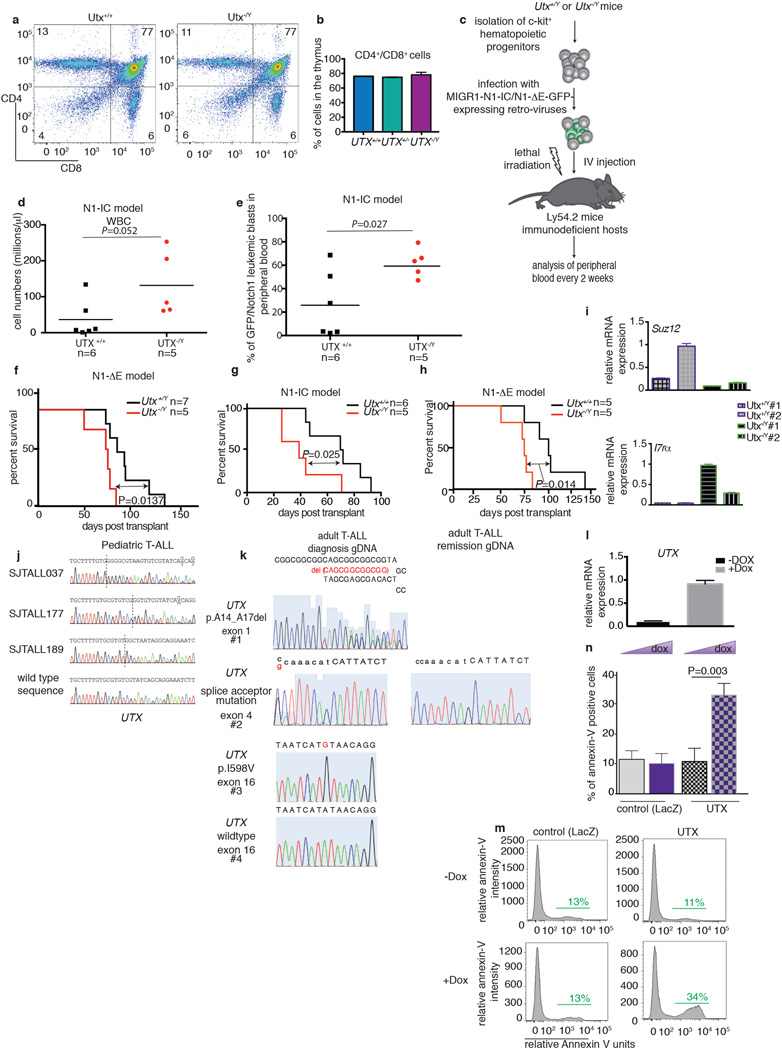
To examine the potential roles for Utx and Jmjd3 in the induction of T-ALL, we performed transplantation of bone marrow using hematopoietic stem cells from Utx and Jmjd3 germiline knockout mice. Although female Utx−/− mice die at E9.5 due to defects in mesoderm development, a small fraction of male Utx−/Y mice survive to adulthood, as a result of compensation by Uty27. Despite the fact that T cell development is largely unaffected (Extended Data Fig. 5a, b) T-ALL kinetics were significantly faster on the Utx−/Y background, as determined by leukemic burden quantification in the peripheral blood and infiltration into the spleen (not shown) and liver (Fig. 3a–c and Extended Data Fig. 5c–e). Moreover, mice succumb to the disease with significantly shorter latency in the absence of Utx compared to Utx+/y and Utx+/+ genotypes (Fig. 3d and Extended Data Fig. 5f–h). These experiments provide the first in vivo analysis of the tumor suppressor role of UTX in any tumor type.
Figure 3. UTX demethylase acts as a tumor suppressor in T-ALL.
a–c, Monitoring initiation and progression of T cell leukemia in a Notch1-overexpressing model of T-ALL. Leukemic blast (expressed as NOTCH1-IC/GFP positive cells) in the peripheral blood (a), blood smear analysis (b) and leukemic infiltration in the liver (c) of male wild-type (Utx+/+, n=10) and knock-out (Utx−/Y, n=6) mice is shown. d, Survival studies of the mouse recipients transplanted with hematopoietic progenitors of the wild-type (Utx+/Y, n=10) and knock-out (Utx−/Y, n=6) background expressing N1-IC model are shown. e, Scatterplot representation summarizing the major genomewide expression differences between T-ALL tumors of wild-type (Utx+/Y) and knock-out (Utx−/Y) background. RNA sequencing was performed using three pairs of wild-type and Utx knockout NOTCH1-IC tumors (spleen/bone marrow). f, g, Analysis of genetic status of UTX (KDM6A) locus in pediatric T cell leukemia (n=107). SNP6.0 microarrays (f) for genomic deletions. Illustration of the human UTX protein (g) depicting three frameshift mutations in pediatric T-ALL (grey circle) as well as one in-frame deletion (p.A14_A17del), one splice acceptor site mutation and one missense mutation in adult T-ALL (white circle), as identified by targeted Sanger sequencing. The Jumonji domain (JmjC) and the tetratricopeptide repeats are shown.
To delineate the potential mechanism behind Utx action we performed gene expression analysis in sorted leukemic blasts of wild-type (Utx+/y/Utx+/y) or knockout (Utx−/y) background from the spleen or bone marrow (Fig. 3e). This analysis showed that Utx positively controls important tumor suppressor genes, like the Retinoblastoma binding protein 6 (Rbbp6), the inhibitor of the Notch1 pathway activity Fbxw7 and the PRC2 member Suz12 whereas genes with oncogenic role in T-ALL-including Jmjd3-were up-regulated (Fig. 3e and Extended Data Fig 5i). These studies strongly suggested that UTX might act as a tumor suppressor in human T-ALL. We thus screened a panel of primary pediatric T-ALL samples2 for genetic alterations of the UTX locus. Analysis of primary human samples of pediatric T-ALL using single nucleotide polymorphism (SNP) arrays identified two patients with focal deletions of the UTX locus (Fig. 3f). Further targeted sequencing in pediatric and adult T-ALL led to identification of six more patient cases with UTX mutations (Fig. 3g, Extended Data Fig. 5j, k and Supplementary File 2/Table 2) including in-frame deletions, missense (I598V) mutations and frameshift alterations. Analysis of bone marrow remission genomic DNA confirmed the somatic origin of the UTX splice site mutation (Extended Data Fig. 5k). 7 out of 8 total alterations belong to male patients, further underlining the fact that UTX and UTY roles do not seem to be interchangeable. These genetic alterations are predicted to have an inactivating role19,20 and provide further evidence that UTX is a tumor suppressor in T-ALL. Indeed overexpression of UTX using a doxycycline-inducible lentiviral system in T-ALL cell lines (Extended Data Fig. 5l) led to suppression of tumor growth and significant increase of apoptosis (Extended Data Fig 5m).
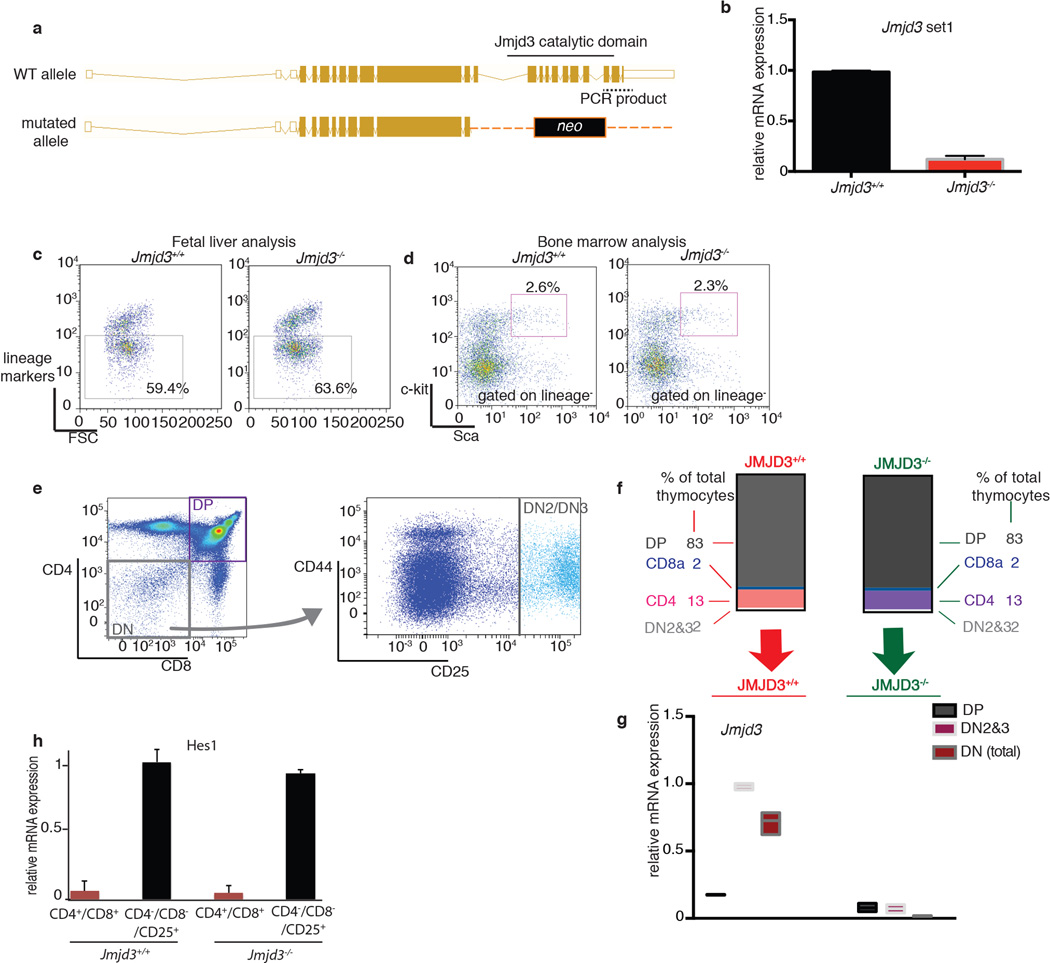
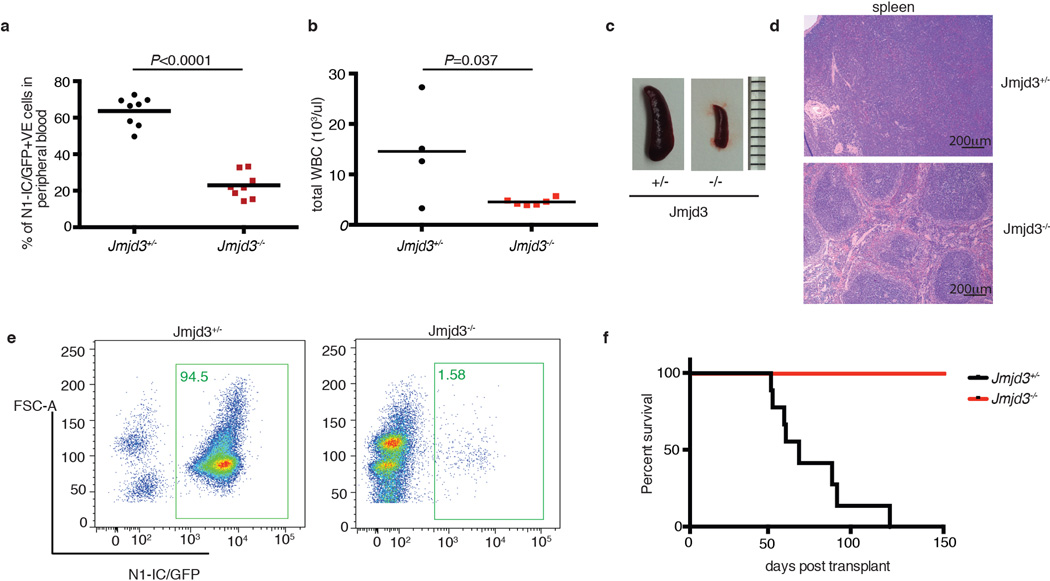
Jmjd3−/− mice28, in turn, lack the catalytic domain of the Jmjd3 protein (Extended Data Fig. 6a, b) and die perinatally28. Hematopoiesis and T cell development were largely unaffected by the absence of Jmjd3 (Extended Data Fig. 6c–h). Genetic ablation of Jmjd3 in T-ALL led to fewer leukemic blasts in the peripheral blood, significantly reduced leukemic infiltration into spleen and liver and improved survival rates in recipients (Extended Data Fig. 7a–f), consistent with an oncogenic role of Jmjd3. These striking phenotypes supported our previous in vitro and in vivo findings and led us to further explore the therapeutic potential of targeting Jmjd3 activity in T-ALL.
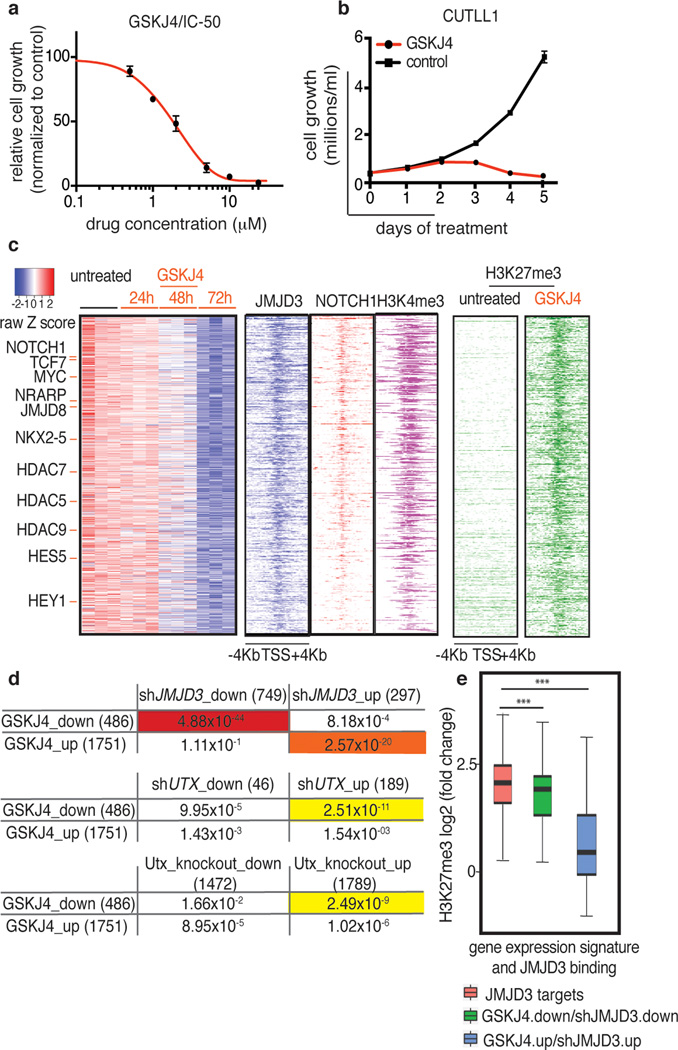
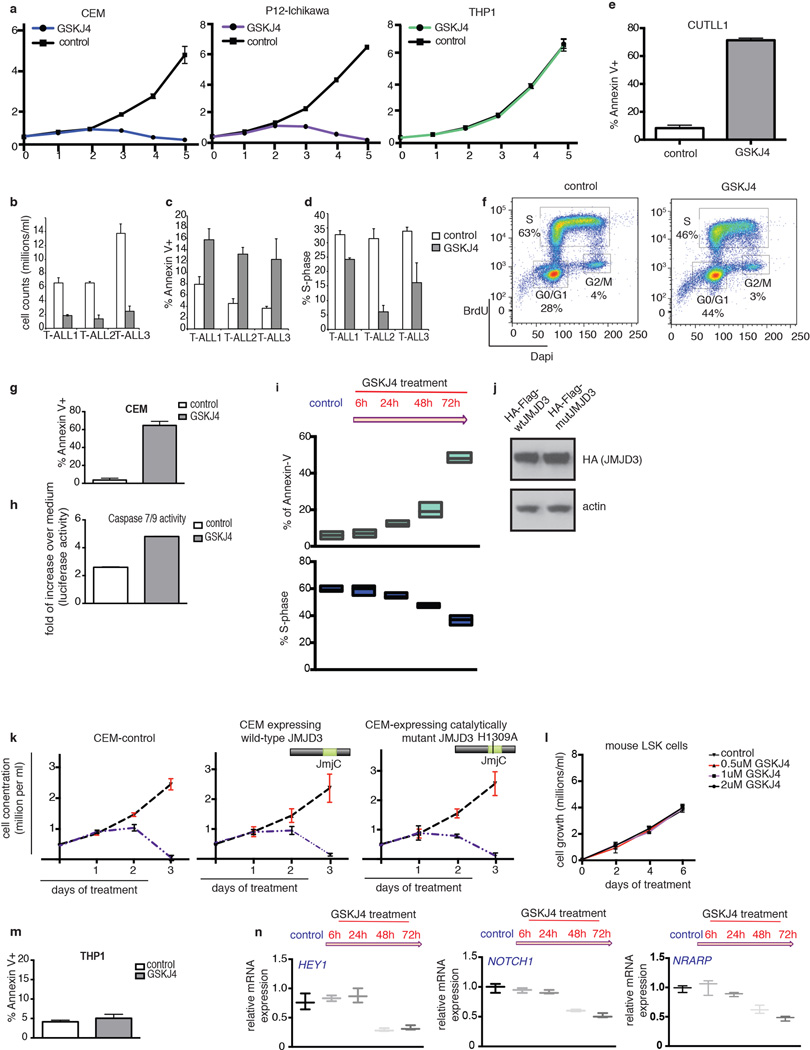
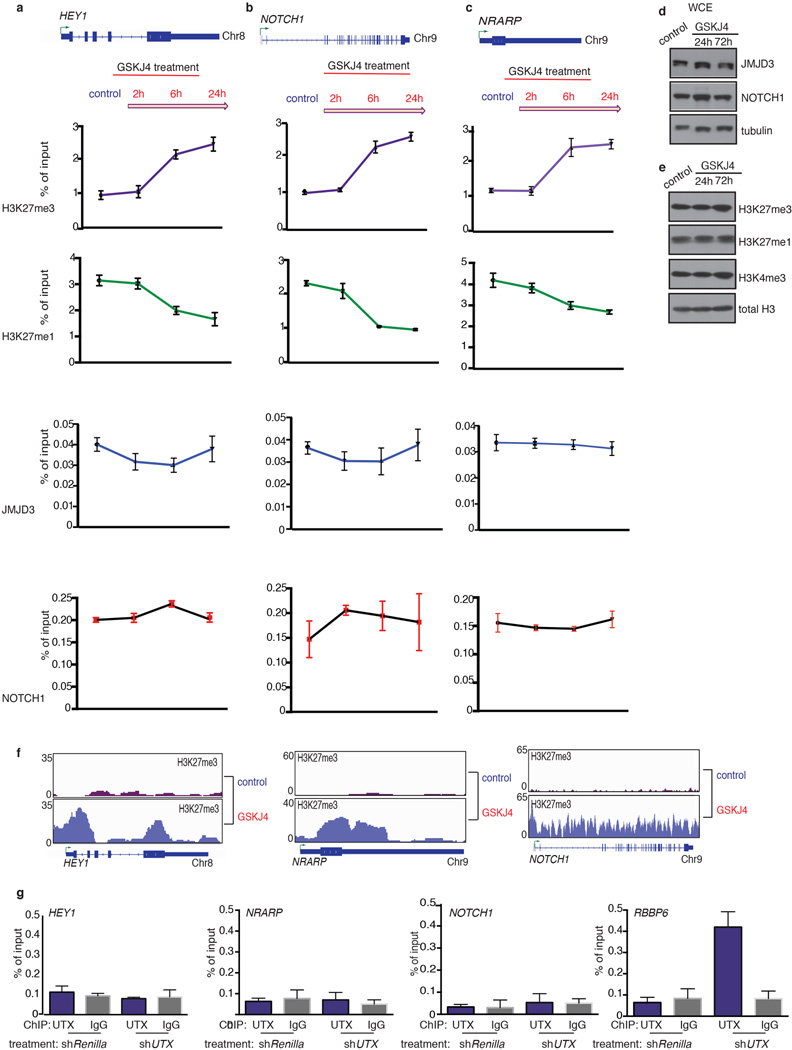
We next tested whether the small molecule GSKJ45 directed against JMJD3 and UTX (MALDI IC50s: JMJD3 18µM, UTX 56µM) can affect maintenance of the disease. We used GSKJ4 at its half-maximal inhibitory concentration (IC50, 2µM, Fig. 4a), to treat a panel of T-ALL lines. GSKJ4 significantly affected cell growth of T-ALL lines and primary human T-ALL cells (T-ALL1-3), leading to cell cycle arrest and increased apoptosis compared to control inhibitor-treated cells (Fig. 4b, Extended Data Fig. 8a–h). The first detectable changes started at 24h and we could see significant significantly altered phenotypes at 48 and 72h (Fig. 4b and Extended Data Fig. 8a, i). These GSKJ4 effects appear to be connected to the JMJD3 demethylase activity as overexpression of the catalytically inactive JMJD3 did not rescue the phenotype (Extended Data Fig. 8j, k). Growth of myeloid leukemia cells, stromal cells and hematopoietic progenitor cells (Extended Data Fig. 8l, m) were unaffected by GSKJ4, demonstrating specificity of function. Mechanistically, we detected gene expression changes starting at 24h post-GSKJ4 treatment and significant changes were noted at 48h and 72h (Extended Data Fig. 8n) coupled to an increase of H3K27me3 levels at repressed genes (Extended Data Fig. 9a–c). NOTCH1 and JMJD3 DNA occupancy at specific NOTCH1 targets tested as well as total cellular levels of NOTCH1 and JMJD3 or chromatin H3K27me3 levels did not significantly change over treatment (Extended Data Fig. 9d–e).
Figure 4. Pharmacological targeting of T-ALL through specific inhibition of the JMJD3 demethylase activity.
a, Dose dependent effect of GSKJ4 inhibitor (normalized to control inhibitor, GSKJ55) on CUTLL1 cells proliferation. b, Effect of GSKJ4 (at 2µM) on CUTLL1 T-ALL cells. c, Heatmap representation of GSKJ4-associated changes in gene expression (left panel, three biological replicates) and H3K27me3 changes (right) of 486 significantly down-regulated coding transcripts over a period of 72h. Middle: Occupancy of JMJD3, NOTCH1 and H3K4me3 marks in respective 4kb-flanked TSS regions. d, Comparison of the shJMJD3 and shUTX expression-based signatures with the GSKJ4-induced expression changes. Note the highly significant overlap between genes down-regulated in shJMJD3 and GSKJ4 including HEY1, NRARP and NOTCH1. e, Box-plots representing H3K27me3 changes upon GSKJ4 treatment in JMJD3 targets as well as in the commonly down-regulated genes in shJMJD3 and GSKJ4. Genes up-regulated in shJMJD3 and downregulated upon GSKJ4 treatment are negative control. P-values: JMJD3targets vs GSKJ4.down/shJMJD3.up: 2.7×10⁻³³, GSKJ4.down/shJMJD3.down vs GSKJ4.up/shJMJD3.up: 4.4×10⁻¹⁵.
Genome-wide studies identified 486 down-regulated genes after 72h of treatment with GSKJ4 (Fig 4c). There was significant overlap between shJMJD3 and GSKJ4 signatures for both down- (P = 4.88×10−44, Fig. 4d and Supplementary File 2/Table 3) and up-regulated genes (P = 2.57×10⁻²⁰). On the contrary, the shUTX up-regulated gene signature significantly overlapped with the GSKJ4 down-regulated gene signature, Furthermore there was a significant overlap between genes upregulated in Utx knockout blasts and downregulated by GSKJ4 treatment (P=2.49×10⁻⁹, Fig.3e and 4d, and Supplementary File 2/Table 3), suggesting once more that UTX and JMJD3 play opposing roles in T-ALL. Genome-wide study of H3K27me3 localization demonstrated that the GSKJ4 down-regulated genes experience gain of H3K27me3 upon GSKJ4 treatment and are marked by the presence of H3K4me3, NOTCH1 and JMJD3 in their promoters (Fig. 4c and Extended Data Fig. 1j). Well-characterized NOTCH1 and JMDJ3 targets are highlighted as representative examples of the GSKJ4.down/shJMJD3.down signature and show a significant gain of H3K27me3 upon GSKJ4 treatment (Fig. 4e and Extended Data Fig. 9f). UTX was not involved in the regulation of the oncogenic NOTCH1 targets as revealed by ChIP studies (Extended Data Fig. 9g).
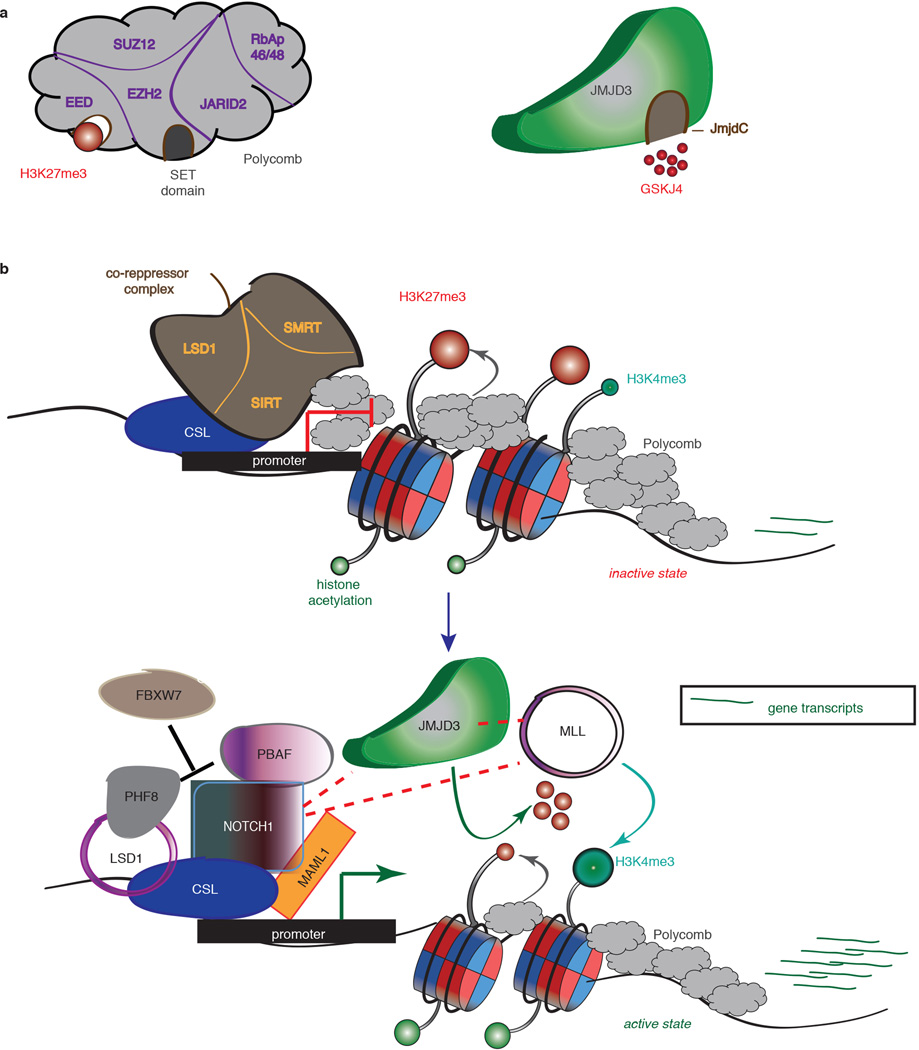
We propose here targeting of JMJD3 as a novel therapy option for pediatric and adult T-ALL. This proposal is based on recent studies2,4,29 that demonstrate that H3K27me3 catalyzed by PRC2 complex plays a key role in T-ALL, through antagonism with oncogenic NOTCH1. We demonstrate here that NOTCH1-mediated JMJD3 recruitment on promoters could explain this antagonism (Extended Data Fig. 10, see also Supplementary File 1 for extended discussion). We propose that NOTCH1 recruitment could lead to PRC2 eviction due to active demethylation of H3K27 through the catalytic activity of JMJD3 and the recruitment of JMJD3 to target promoters. On the other hand, the reported increased levels of the activating H3K4me3 mark on a large fraction of NOTCH1 targets30 (Fig. 4f) can be explained by the fact that NOTCH1 has the ability to participate in MLL complexes (Extended Data Fig. 2 and 10). Moreover we demonstrate antitumorigenic activities of the GSKJ4 inhibitor5 and specificity for T-ALL cells. Obviously, we cannot exclude the possibility that GSKJ4 could potentially affect other important epigenetic modulators or signaling pathways. Nevertheless, we believe that the main action of this inhibitor in T-ALL is channeled through the inhibition of JMJD3 activity and propose that such compounds should be tested either as single drugs or in combination to standard chemotherapy.
Methods
Mice, Cell culture and primary cell samples
The knockout mouse models of Jmjd331 and Utx27 as well as the corresponding genotyping strategy have been described in published studies. All animals used in this study were treated according to IACUC protocols for Aifantis, Ferrando and Jaenisch laboratories. The human T-ALL CUTLL1132, P12-Ichikawa, Loucy, DND41, CEM, Jurkat and myeloid leukemia (THP1, HL-60) lines as well as the mouse T-ALL line (“720”)33 were all cultured in RPMI 1640 medium supplemented with 20% FBS and penicillin, streptomycin. All cell lines were being tested for the presence of mycoplasma and only mycoplasma-free lines were used for these studies. Primary human samples were collected by collaborating institutions with inform consent and analyzed under the supervision of the Columbia University Medical Center and St Jude Children’s Hospital Institutional Review Board. The primary cells treated with GSKJ4 inhibitor (for more information on these cells please check King et al.34) were cultured in MEMα medium plus 10% fetal bovine serum (StemCell Technologies, Inc. #06400), 10% human AB+ serum (Invitrogen), 1% penicillin/streptomycin, 1% GlutaMAX, human IL-7 (R&D Systems; 10 ng/ml), human Flt3-ligand (Peprotech; 20 ng/ml), human SCF (Peprotech; 50 ng/ml) and insulin (Sigma; 20 nmol/L). Irradiated MS5 stromal cells overexpressing Delta-like 1 (DLL1) were used as a feeder layer, as previously described35.
In vitro Drug Treatment and short-hairpin treatment and cell growth, apoptosis and cell cycle analysis
T-ALL cells were infected two times with the short-hairpin-expressing retroviruses and selected using puromycin. Expression studies took place at different time point during selection period and we present results from day 4 during selection. In order to calculate the IC50 of GSKJ4 (by GlaxoSmithKline)5 normalized to control inhibitor GSKJ5 (GlaxoSmithKline), T-ALL lines were treated with different concentrations of the drug for 5 days. For cell growth, annexin V staining and cell cycle analysis cell lines and primary cultures were treated with 2mM GSKJ4 and GSKJ5 for various amounts of time (24 h-72 h). Gamma secretase inhibitor (γSI, specifically Compound E (Alexis Biochemicals)) was used at 500 nM concentration for various amounts of time. For the cell cycle analysis, BrdU (10 μM) was added for a 1 hr pulse, and incorporation into DNA was determined by using the BrdU Flow Kit (BD Biosciences). Apoptosis was studied by quantification of annexin V staining using the BD Biosciences kit and FACS according to standard protocol provided by the manufacturer. Doxycycline was used at 1µg/ml final concentration.
Intravenous and subcutaneous xenograft studies
Studies were conducted as before36. In both cases, CUTLL1, P12 or CEM T-ALL cells expressing luciferase (FUW-LUC) and the corresponding shRNA (shJMJD3, shUTX or shRenilla were used. For the intravenous studies, one million cells/type were injected retro-orbitally in sublethally irradiated NOD-SCID female mice. For subcutaneous studies 1 million cells/type were mixed with an equal volume of BD Matrigel basement membrane matrigel and injected into the flanks of NOD-SCID female mice. In both cases cell growth was monitored every 2 days using IVIS (Caliper, Perkin Elmer).
Transplantation for reconstitution of the hematopoietic system and for disease progression analysis
Fetal liver from Jmjd3+/+, Jmjd3+/− and Jmjd3−/− embryos (e13.5, Ly45.2 background) was provided by the Akira laboratory and 1 million of total (unfractionated) fetal liver was used for the reconstitution of the hematopoietic system of lethally irradiated recipients of Ly45.1 background. Bone marrow was isolated from the recipients followed by isolation of cells of Ly45.2 background using sorting. 2.5×10⁵ cells of total Ly45.2 bone marrow mononuclear cells were mixed with equal numbers of LY45.1 (wild type) bone marrow and transplanted into lethally irradiated recipients to study hematopoietic reconstitution in a competitive setting.
For the Utx+/+, Utx+/− and Utx−/Y (Ly45.2) background, 2.5×10⁵ cells of total Ly45.2 bone marrow mononuclear cells were mixed with equal numbers of Ly45.1 (wild type) bone marrow and transplanted into lethally irradiated recipients to study hematopoietic reconstitution in a competitive setting similarly to Jmjd3 study.
In both cases reconstitution of the hematopoietic system was monitored with analysis of peripheral blood for the main hematopoietic lineages. Isolation and analysis of thymus and spleen was performed for some of the recipients at 3 months post transplantation.
For analysis of leukemia progression, c-kit hematopoietic progenitors from the bone marrow of both Jmjd3- and Utx-knockout models, were magnetically selected (STEMCELL Technologies) using an antibody against CD-117 (c-Kit) and cultured overnight in the presence of 50 ng/ml SCF, 50 ng/ml Flt3 ligand, 10 ng/ml IL-3, and 10 ng/ml IL-6. Over-expression of oncogenic NOTCH1 mutants (intracellular part of NOTCH1 (N1-IC) and DeltaE (N1-DE)) in bone marrow hematopoietic progenitors followed by transplantation into mouse recipients lead to development of T-ALL, characterized by the presence of leukemic blasts in the peripheral blood that can infiltrate the peripheral lymphoid organs, progressively leading to death of the animals (Extended Data Fig. 5c). The cells were infected with Notch1-IC or -DE (and GFP) expressing retroviruses twice (24h and 48h post c-kit selection). Viral transduction efficiency was determined by reporter fluorescence over a total period of 4 days, and total populations were transferred via retro-orbital injection into lethally irradiated congenic recipients along with 2.5×10⁵ total (wild type) bone marrow mononuclear cells for hemogenic support. 45×104 GFP+ cells were transplanted in both Notch1-IC and –DE studies. Mantel-Cox test was used for the analysis of the survival data. No randomization/blinding method was used during these animal studies.
Antibodies, reagents, kits and virus production
The protein G-coated magnetic beads were purchased from Invitrogen. Antibodies used: monoclonal mouse H3K27me3 (histone H3 migrates at around 17kDa) (Abcam, ab6002), monoclonal mouse H3K27me1 antibody from Active Motif (61015), polyclonal rabbit H3K4me3 (Active Motif, 39159), rabbit polyclonal for NOTCH1 (the intracellular part of the protein migrates at around 110kDa), rabbit polyclonal JMJD3 (protein migrates at around 170kDa) (abgent, AP1022a (human) and AP1022b (mouse)) as well as polyclonal rabbit from Cell signaling (3457), rabbit polyclonal UTX (protein migrates at around 160kDa) from abcam (ab36938) and Bethyl (A302-374A), rabbit polyclonal NF-kB (p65, protein migrates at around 65kDa Santa Cruz, sc-109 and sc-372) and control IgG (Santa Cruz (mouse (sc-2025) and rabbit (sc-2027)). All FACS antibodies were from eBioscience. All antibodies used have been tested and proven specific for the purposes used by companies/providers. The acid extraction protocol by abcam was used for the characterization of histone mark levels upon GSKJ4. To generate the virus, we infected 293T cells with the plasmid expressing the corresponding hairpin (a miR-30-based system37) against JMJD3 (shJMJD3a: CAGGGAAGTTTCGAGAAGTCCTATAGTGAAGCCACAGA TGTATAGGACTCTCGAACTTCCCTT and shJMJD3b: ACACCAGCAGTAGCAACAGCA ATAGTGAAGCCACAGATGTATTGCTGTTGCTACTGCTGGTGG) and UTX (ACACAAGGTAG TCTACAGAATATAGTGAAGCCACAGATGTATATTCTGTAGACTA CCTTGTGG). We also used shRenilla (CTCGAGAAGGTATATTGCTGTTGACAG TGAGCGCAGGAATTATAATGCTTATCTATAGTGAAGCCACAGATGTATAGATAAGCATTATAATTCCTATGCC TACTGCCTCGGAATTC) as control and the retroviral packaging plasmid. Viral supernatant was collected over a period of 72 h and used for transduction of T-ALL cells. The cells were infected twice and got selected with puromycin starting 3 days after viral infection. Reporter fluorescence was used (FASC) for the quantification of hairpins.
Histopathology
Organs were harvested from the animals and immersion-fixed with 4% paraformaldehyde38 overnight at 4° C. Samples were washed with phosphate buffered saline (PBS) 3 times for 1 hour at room temperature and dehydrated in 70% ethanol. Samples were embedded in paraffin blocks. Sections (6 μm thick) were stained with hematoxylin and eosin (H & E) following the standard procedures. Peripheral blood smears were briefly fixed in methanol and stained with Wright-Giemsa solution (Fisher). Slides were rinsed with water, dried, mounted with Cytoseal 60 and coverslipped.
Protein Immunoprecipitation for Interaction Studies
For the interaction studies between NOTCH1 complex (NOTCH1, MAML1) with the epigenetic modulators (UTX, JMJD3, EZH2) we used standard protocols used elsewhere. In brief, cells were resuspended in TENT buffer (50mM Tris pH8.0, 5mM EDTA, 150mM NaCl and 0.05% (v/v) Tween-20) supplemented with the inhibitors at a concentration of 20 million cells/ml buffer. Cell lysates were passed through 25G syringe (5×) and incubated on ice for 30’, followed by spin to remove cell debris (5’, full speed). The cleared lysate was precleared with beads for 1h at 4C to decrease non-specific binding and incubated overnight with the corresponding antibody-beads complexes. 5 micrograms antibody were used for 3mg of extracts.
RNaseq Library Preparation and Analysis
Whole RNA was extracted from 1-5 million T-ALL (lines) cells or primary cells using the RNAeasy kit (Qiagen) according to the manufacturer’s protocol. Poly-A+ RNA was enriched using magnetic oligodT-containing beads (Invitrogen). cDNA preparation and strand-specific library construction was performed using the dUTP method as described in the past39. Libraries were sequenced on the Illumina HiS 2000 using 50bp single-read method.
Chromatin Immunoprecipitation and ChIP-Seq library preparation
ChIP experiments were performed as described in the past36. In brief, for analysis of histone marks we fixed the cells with 1% formaldehyde for 10 min at 25° C and lysed them by the addition of Nuclei Incubation Buffer (15 mM Tris pH 7.5, 60 mM KCl, 150 mM NaCl, 15 mM MgCl2, 1 mM CaCl2, 250 mM Sucrose, 0.3% NP-40) and incubation at 4° C for 10’. The nuclei were washed once with Digest buffer (10 mM NaCl, 10 mM Tris pH 7.5, 3 mM MgCl2, 1 mM Cacl2) and we used micrococcal nuclease (USB) in digest buffer to generate mononucleosomal particles. The reaction was stopped with the addition of EDTA (20 mM). The nuclei were lysed in “nuclei lysis” buffer (50 mM Tris-HCl (pH 8.0), 10mM EDTA (pH 8.0) and 1% SDS) followed by sonication using bioruptor (Diagenode) and chromatin was precleared by the addition of nine volumes of “IP dilution” buffer” (0.01% SDS, 1.1% Triton X-100, 1.2 mM EDTA (pH 8.0), 16.7 mM Tris-HCl pH 8.0 and 167 mM NaCl) and magnetic Dynal beads. 1% of the chromatin was kept as input. We coupled 2.5 mg antibody with 25 mg antibody for 4 h in reaction buffer and the complex was added to precleared chromatin (equivalent of 105–106 cells, depending on the antibody) followed by overnight incubation at 4° C rotating. We washed the complexes bound on the beads using buffers with increasing salt concentration: once with “wash A” (20 mM Tris-HCl pH 8, 150 mM NaCl, 2 mM EDTA, 1% w/v Triton, 0.1% w/v SDS, once with “wash B” (20 mM Tris-HCl pH 8.0, 500 mM NaCl, 2 mM EDTA, 1% w/v Triton, 0.1% w/v SDS), once with “wash C” (10 mM Tris-HCl pH8.0, 250 mM LiCl, 1 mM EDTA, 1% w/v Nonidet P-40, 1% w/v deoxycholic acid) and twice with TE, followed by treatment with RNAse, proteinase K, reverse the cross-links and precipitation of DNA using ethanol and glycogen.
For Jmjd3 ChIPs, the cells were fixed with 1% formaldehyde for 10 min at 25 °C and lysed on ice using 1ml “cell lysis” buffer (50 mM Hepes-KOH pH 7.5, 140 mM NaCl, 1 mM EDTA, 10% Glycerol, 0.5% NP-40, 0.25% Triton X-100)/107 cells. We resuspended the pellet in 1ml buffer II (10 mM Tris-HCl pH 8, 200 mM NaCl, 1 mM EDTA pH 8 and 0.5 mM EGTA)/107 cells. We further resuspended the nuclei in buffer III (10mM Tris-HCl pH 8, 100 mM NaCl, 1 mM EDTA, 0.5 mM EGTA, 0.1% sodium deoxycholate and 0.5% n-lauroylsarcosine) and sonicated with bioruptor (Diagenode) for 40’. Triton was added at a final concentration 1% and the chromatin preparation was precleared using magnetic beads. The antibody (5 mg) was coupled to the magnetic beads (50mls) as in the case of histone marks, the complex was added to the precleared chromatin (the equivalent of 10 million cells/reaction) and the reaction mix was incubated for 12–16 hours. The beads having the immunoprecipitated chromatin fragments were washed 8 times using “RIPA” buffer (50 mM Hepes-KOH pH 7.6, 300 mM LiCl, 1mM EDTA, 1% NP-40 (IGEPAL), 0.7% Na-Deoxycholate) and once with TE. The DNA was cleaned as in the case of the chromatin marks (see above). Libraries were generated as described before36, including end-repair, A-tailing, adapter (Illumina Truseq system) ligation and PCR amplification of the libraries. Ampure XP beads (Beckman Coulter, A63880) were used for DNA cleaning in each step of the process.
Sequence analysis of primary samples
Sequencing and analysis of pediatric T-ALL samples was conducted as described in previously published studies2,40. In brief, sequencing of UTX in the pediatric T-ALL cohort was performed by PCR of whole genome amplified DNA, followed by sequencing using 3730xl instruments (Applied Biosystems) as previously described41. Single nucleotide variations were detected by SNPdetector42 and PolyScan43, and validated by sequencing of both tumor and matched non-tumor samples. A total of 107 pediatric patients were screened including 64 cases with ETP ALL (25 females, 39 males) and 43 with ‘typical’ T-ALL (8 females, 35 males). So, UTX mutations were detected in 4.7% of total population and in 6.8% of the male population. No female samples were detected with UTX mutations. The two deletions and one of the frameshifts were found in patients with typical T-ALL, and the other two in ETPs.
Regarding the adult T-ALL case, all 83 samples were collected in the Eastern Cooperative Oncology Group (ECOG) clinical trials E299344 and C10403 and analyzed under the supervision of the Columbia University Medical Center IRB. Informed consent to use leftover material for research purposes was obtained from all the patients at trial entry according to the Declaration of Helsinki. All exon sequences from UTX/KDM6A were amplified from genomic DNA by PCR and analyzed by direct dideoxynucleotide sequencing. Primer sequences used for KDM6A sequencing have been previously described19.
Data sources and computational tools
Patient and physiological T cell expression data was obtained from2,23,45. Human assembly version hg19/GRCh37 and ENSEMBL annotations release 69 were used for the RNA-sequencing, ChIP-sequencing and data integration analyses. NOTCH1, RBPJ, H3K4me3 and H3K27me3 ChIP-sequencing data in CUTLL1 were obtained from Wang et al.26 For the functional enrichment analysis, MSigDB46 version 3.1 was used. Bowtie47 version 0.12.7 was used for alignment of sequenced reads. RNA-sequencing data analysis was performed using the DEGseq48. MACS49 version 2.0.10 was used for JMJD3 ChIP-sequencing peak discovery in conjunction with the Irreproducible Discovery Rate (IDR) method50.. GenomicTools51 version 2.7.2 was used for performing genomic interval mathematical operations, genomic interval annotation, H3K27me3 ChIP-sequencing comparisons (GSKJ4 versus control) and ChIP-sequencing heatmap generation.
Expression analysis of primary samples
Processed T-ALL and B-ALL patient microarray expression data were downloaded from Zhang et al.,2 (GEO accession GSE33315), physiological T-cell expression data from Dik et al.,23 (GEO accession GSE22601), and AML expression data from Verhaak et al.,45 (GEO accession GSE6891). Data was first converted to logarithmic scale when necessary, and then quantile normalized across samples. Wilcoxon two-sided unpaired test per gene probe was used to determine significant differences between sample categories (T-ALL, B-ALL, AML and physiological T cells; Fig. 1e). A gene was considered significantly over-expressed in T-ALL compared to the rest of the sample categories, if at least one of its associated probes was significantly over-expressed in T-ALL according to the statistical test.
Genes experiencing loss of H3K27me3 in TSS in our mouse NIC model compared to normal double positive (DP) mouse cells were obtained from our previous study36. Enrichment of human homologs of these genes in Jmjd3-correlating genes in the patient data described above was estimated as follows. First, Pearson’s correlation of Jmjd3 expression (separately for each Jmjd3 probe) against expression of each gene was computed. Then, the distribution of correlations of genes losing H3K27me3 (human homologs of the mouse genes) was compared to that of genes that do not lose H3K27me3 using Student’s T test (separately for each Jmjd3 probe, minimum p-value shown in the corresponding figure (1f)) or Wilcoxon one-sided unpaired test (not shown) yielding similar results. This analysis was repeated for NFκB1, NFκB2, REL, RELA, RELB, HES1, UTX, and EZH2 (Extended Data Fig. 1i).
Jmjd3 peak identification, characterization and overlap with published datasets
Jmjd3 ChIP-sequenced reads were aligned using bowtie (with default parameters, except for –m 1 so as to report only unique alignments) on human assembly version hg19. Peak discovery was performed with MACS (version 2) using default parameters except for using a fragment size of 300bp estimated by Agilent 2100 Bioanalyzer. Sonicated input was used as a control for peak discovery. Then, we used the Irreproducible Discovery Rate (IDR) method50, guidelines and pipeline available for narrow peaks at (https://sites.google.com/site/anshulkundaje/projects/idr) to determine highly reproducible peaks supported by both JMJD3 replicates.
Jmjd3 peaks were characterized according to their genome-wide distribution (Extended Data Fig. 1k) into: (a) 1kb TSS-flanking regions of transcript isoforms, (b) gene body regions (excluding any overlapping regions with (a)), and (c) upstream regions of minimum 10kb and up to a maximum of 100kb (excluding any overlapping regions with (a) or (b)).
Co-occurrence of JMJD3 peaks with H3K4me3, H3K27me3, NOTCH1 and RBPJ was computed as the percentage of such peaks (5,000 top-scoring peaks for each protein obtained from Wang et al.26; GEO accession GSE29600) that have some overlap with a JMJD3 peak. Statistical significance of these overlaps was determined using random resampling simulation (e.g. H3K4me3 peaks were randomly redistributed along the genome). As a control, we used the percentage of TSSs that have JMJD3 peaks (this is a rather conservative control since genome-wide JMJD3 occupancy is much lower, a result of JMJD3 being concentrated in TSSs), and, compared to this control, we obtain a ~7-fold enrichment of H3K4me3-JMJD3 (p-value <0.001 as determined by the random resampling scheme). Similar enrichments were obtained for NOTCH1-JMJD3 and RBPJ-JMJD3 co-occurrence, whereas no significant enrichment was observed for H3K27me3-silenced or H3K4me1 enhancer-related regions (Extended Data Fig. 1j).
RNA-sequencing analysis
Differential gene expression analysis was performed for each matched knockdown vs control pairs, separately in each biological or technical replicate in each of three cell lines (CUTLL1, and CEM). Three types of comparisons were tested: (a) Jmjd3 knockdown vs renilla, (b) Jmjd3 knockdown vs Utx knockdown, and (c) Utx knockdown vs renilla. Analysis was performed using DEGseq48 on (a) matched knockdown-renilla replicates in separate DEGseq runs, and (b) all replicates on a combined DEGexp run. For the mouse (Utx knockout) samples, spleen and bone marrow from a wildtype male (referred to as animal #9) as well as spleen from a wildtype female animal (#10) were compared to spleen and bone marrow from a knockout male (#23) and spleen from another male knockout animal (#27) (see also our GEO entry, GSE50906). For illustration, scatter plots (Figures 2e, 3e and Supplemental figures 5, 6) were created using values obtained from DEGseq analysis on merged biological and/or technical replicates. Gene RNA-sequencing FPKM values were computed using GenomicTools51. P-value cutoff for differential expression was set at 1e-5, with minimum absolute log2 fold-change at 0.5. However, all key results in this work (i.e. significance of overlaps of the various gene expression signatures demonstrating “contrasting roles” of JMJD3 and UTX) are robust to changes in these two parameters (data not shown).
The P-value of a gene set of size t (e.g. GSKJ4 down-regulated genes) containing k genes with a specific attribute (e.g. shJMJD3 down-regulation, or UTX knockout up-regulation) is determined against the null hypothesis that k or more such genes could have been observed merely by chance in an equal-size gene set, randomly drawn from the entire reference set of genes of size N (i.e. all down-regulated, up- regulated and constant genes). This P-value is obtained by using the hypergeometric cumulative distribution with parameters N, t, k and n, where n is the number of genes possessing the attribute in the entire reference gene set of size N.
H3K27me3 gain/loss analysis
Jmjd3-affected (up- or down-regulated) genes were defined as genes whose expression is significantly differentially expressed in Jmjd3 knockdown compared to both renilla and Utx knockdown. Changes in Jmjd3 binding and the H3K27me3 mark around gene TSSs between inhibitor GSKJ4 and control GSKJ5 and were determined using GenomicTools (“genomic_apps peakdiff” tool) as described in previous published study36. Epigenetic changes between the treatment (shJMJD3 or GSKJ4) and control samples were determined by evaluating sliding windows across the genome using the following protocol. First, enriched ChIP-seq windows were identified separately for each of the two samples under comparison using a window-based approach and the binomial probability distribution to compare signal reads to control reads in each window. Subsequently, for each genomic window enriched in at least one of the two samples, the total number of reads was determined, and the window read counts were normalized using quantile normalization across biological replicates and samples before comparison. Finally, for each window, the fold-change between the two samples was calculated (GSKJ4 versus control and vice versa). To estimate the false discovery rate, the distribution of observed H3K27me3 fold-changes was compared against the distribution of fold-changes between replicates of the same treatment. This comparison was performed independently at different H3K27me3 read density levels to control for artificially high fold-changes due to low read counts in the denominator. Significant epigenetic changes are reported at 5% false discovery.
JMJD3, NOTCH1, H3K4me3 and H3K27me3 heatmaps were generated using GenomicTools (“genomic_apps heatmap” utility) over log-transformed read counts in 200nt non-overlapping bins of 4kb-flanked TSSs. Boxplots of H3K27me3 log2 fold-changes (GSKJ4 vs control) show the distribution of values in (a) JMJD3 targets, (b) commonly down-regulated genes upon shJMJD3 and GSKJ4, and (c) intersection of GSKJ4 up-regulated with shJMJD3 up-regulated genes as a negative control. P-values are computed using a one-sided Wilcoxon unpaired test of (a) and (b) versus the control (c).
RNA-seq/ChIP-seq replicate reproducibilty
For RNA-seq experiments, we focused on the reproducibility of gene expression levels as measured by FPKMs. For each pair of replicates we computed the Spearman and Pearson correlations, as well as the Pearson correlation on log-transformed FPKM values. In general, Pearson correlations are much higher because higher values are dominant, and usually highly expressed genes tend to be more reproducible. Pearson correlation on log-transformed values attempt to balance the expression distribution and allow contributions from genes of lower expression, and therefore provides a more realistic genome-wide reproducibility metric. Spearman correlations focus on ranking of gene expression and in our experiments - in general - are a more conservative (i.e. lower) and consistent (lower variability across various settings, and when comparing different cell lines, i.e. CUTLL1 and CEM) estimate of reproducibility, therefore, for simplicity, we only report Spearman correlations.
For ChIP-seq “broad peak” experiments (H3K27me3) we also used Pearson, log-transformed Pearson and Spearman correlations on (a) TSSs, and (b) all genome-wide peaks. As before, Spearman correlation was the most conservative and consistent estimate of reproducibility.
For ChIP-seq “narrow peak” experiments (JMJD3), in addition to TSS-based and genome-based correlations, we used the Irreproducible Discovery Rate (IDR) method50, guidelines and pipeline available for narrow peaks at https://sites.google.com/site/anshulkundaje/projects/idr. Apart from determining reproducibility, we also used the IDR method to determined high-confidence peaks supported by both JMJD3 replicates.
Extended Data
Extended Data Figure 1. MJD3 is induced through activation of the NFkB pathway in a Notch1-dependent mode in T-ALL and binds to NOTCH1 targets.
a, Levels of p65 (Rela) protein in control T cells and T-ALL tumor. A representative sample of three mice is shown. b, Schematic representation of the Jmjd3 locus showing the Rela binding site (left panel) and ChIP analysis for p65 (Rela) binding on Jmjd3 locus in mouse control T and T-ALL tumor cells as well as T-ALL cells upon treatment with gSI which affects Notch1 levels (middle panel). NOTCH1 binding to this area upon γSI treatment in T-ALL cells is also shown (right panel). c, mRNA analysis for JMJD3 and HES1 levels upon γSI treatment in CUTLL1. The average of three independent studies is shown. d, e, Expression levels of JMJD3 transcript (d) and protein (e) upon treatment of human T-ALL lines (DND41 and CEM) with NEMO binding domain (NBD) inhibitor of the NFkB pathway. f, Jmjd3 levels in T-ALL cells upon inhibition of the NFkB pathway using a dominant negative form of IkBalpha (DN-IkBa). g, h, ChIP for Notch1 (g) and H3K27me3 (h) on Hes1 promoter upon γSI treatment in murine T-ALL cells. In d and f–h the average of three studies is shown. In e a representative example of three studies is shown. i, Genes correlated with selected human genes (JMJD3, NFkB1, etc) were tested for enrichment in lossof-H3K27me3 genes during the transition to T-ALL in the mouse model. j, Overlap of JMJD3 peaks with peaks of important activating (H3K4me3 and H3K4me1) and repressive (H3K27me3) epigenetic marks as well as members of the NOTCH1 complex. The percentage of TSSs containing JMJD3 peaks is used as a conservative control, alternative to much lower genome-wide JMJD3 occupancy. k, Genome-wide distribution of JMJD3 peaks in human T-ALL.
Extended Data Figure 2. JMJD3 is vital for T-ALL growth through participation in NOTCH1 transcriptional programs.
a, NOTCH1 interaction analyses for JMJD3, MAML1 and WDR5 proteins in 293T cells. Interaction with JMJD3 was confirmed in a reciprocal way (right-most lane, IP using HA). b, Expression of JMJD3 and WDR5 in 293T cells, followed by immunoprecipitation using the HA antibody against HA-JMJD3. Flag antibody was used for the detection of both proteins. c, NOTCH1 interaction studies for JMJD3 and MAML1 proteins in mouse T-ALL cells expressing a Flag/Strep form of intracellular NOTCH1. Streptactin beads were used for NOTCH1 precipitation in the absence of detectable intracellular NOTCH1 and different antibodies were used for the detection of JMJD3, MAML1, EZH2 and UTX. Extracts from GFP-expressing cells were used as negative control. All experiments were repeated three times (biological replicates) and a representative example is shown. d, mRNA expression of JMJD3 and UTX upon treatment with short hairpin against JMJD3 and UTX. Expression from two hairpins against JMJD3 and one hairpin against UTX and Renilla in CEM cells is shown. e, Effects on cell proliferation as measured by loss of GFP-expressing hairpin. HL-60 is an acute promyelocytic leukemia cell line (APL, subtype of acute myeloid leukemia (AML)), used as control in this study. In both lines the average of three representative studies is shown. f, Annexin V staining upon shJMJD3 and shRenilla in CUTLL1 (upper panel) and HPB-ALL (lower).
Extended Data Figure 3. JMJD3 binds to genes with important oncogenic function and is vital for T-ALL growth.
a, JMJD3-but not UTX-genetic inactivation impairs the expression of important oncogenic genes. NOTCH1, MYC and MAZ, as well as JMJD3 expression levels are shown. shUTX shows a significant up-regulation of JMJD3 compared to shRenilla (control) cells. The average of three studies is shown. b, Significant expression changes of NRARP transcript upon JMJD3 knockdown. c, ChIP for H3K27me3 on NRARP locus. d, e, Binding of JMJD3 on NOTCH1 (d) and MAZ (e) promoter upon shJMJD3 and shRenilla (control). The average of three studies is shown. f, Numbers of up- and down-regulated genes are shown for shJMJD3 and shUTX compared to shRenilla. g, Scatterplot showing the expression levels of important genes in shJMJD3 and shUTX in CUTLL1 T-ALL cells. Emphasis is given to NOTCH1 pathway and apoptosis-related genes. This is a scatterplot representation of expression analysis comparing three independent studies for shJMJD3 and two for shUTX. h, i, Scatterplots showing the expression levels of important genes on shJMJD3 and shRenilla (h) and shUTX (i) in CCRF-CEM T-ALL cells. CEM exhibit increased NOTCH1 levels through mutations in the heterodimerization (HD) domain of NOTCH1 and in the NOTCH1-associated ligase FBXW7. Emphasis is given to NOTCH1 pathway and apoptosis-related genes. This is a scatterplot representation of expression analysis comparing two studies for shJMJD3, two for shUTX and two for shRenilla.
Extended Data Figure 4. In vivo studies of the role of JMJD3 in T-ALL using luciferase analysis of CEM, P12- and CUTLL1-based xenograft models in Rag γc−/− recipients.
a, b, In vivo growth of CEM T-ALL cells in subq xenograft studies upon genomic ablation of JMJD3 and UTX (red and green circles denote shJMJD3 -expressing cells (two different hairpins), blue denotes shUTX–expressing cells and black circle denotes shRenilla -expressing cells, a). One million CEM cells were injected into the animals and representative graphs from five mouse recipients and photo of a representative mouse in days 0 and 6 are shown. Representative graphs from five mouse recipients and the average luciferase intensity in days 0 and 6 are shown (b). c, Representation of growth of CEM cells at different time points post transplantation in Subq studies (n=5). d, Comparison of in vivo cell growth in subcutaneous model of shJMJD3-, shUTX- and shRenilla expressing P12 cells (n=5). One million P12 cells were injected into sublethally irradiated Rag γc−/− immunecompromised recipients and the mice were monitored every day for luciferase activity. Day zero is the first day that substantially detectable luciferase intensity was measured. The last day of the experiment was the day that either luciferase intensity reached saturation or the mice were euthanized for humanitarian reasons. Red and green circles denote shJMJD3 -expressing cells (two different hairpins, shJMJD3a and shJMJD3b correspondingly), blue denotes shUTX–expressing cells and black circle denotes shRenilla-expressing cells). e, Monitoring change in luciferase intensity over a period of seven days in Subq xenograft model using CUTLL1 T-ALL cells (n=4). f, g, i.v. xenograft studies using CUTLL1 cells injected into sublethally irradiated Rag γ−/−c−/− immune-compromised recipients (n=8 or 6, as indicated in the figure). In all e–g cases half a million CUTLL1 cells were transplanted and the mice were monitored every day for luciferase activity.
Extended Data Figure 5. Utx is a tumor suppressor and genetically inactivated in T-ALL Utx whereas is dispensable for physiological T cell development.
a, b, Study of lymphoid development on Utx−/Y compared to Utx+/+ (or UTX+/Y, not shown) background. FACS analyses for CD4+ and CD8+ expression (a) and the relative proportions of CD4+, CD8+ double positive thymocytes across different genotypes (b) are shown. A representative example of three independent samples (biological replicates) is shown. c, Illustration of the transplantations scheme for the in vivo leukemia studies. d, e, T-ALL progresses faster in the male knockout background for Utx (Utx−/y) compared to female wildtype background (Utx+/+), in Notch1-IC/GFP, as it is demonstrated by white blood counts (d) in the peripheral blood as well as GFP+ cells representation upon transplantation of wild type progenitors (e) from female mice (Utx+/+) compared to the corresponding knock-out cells (Utx−/y). f, Survival study of the recipients for male wild-type (Utx+/Y, n=7) and knock-out (Utx−/Y, n=5) mice expressing Notch1-deltaE(ΔE)/GFP (the allele with the weaker oncogenic action compared to Notch1-IC). g, h, Survival analysis of recipients upon transplantation of wild type progenitors from female mice (Utx+/+) compared to the corresponding knock-out cells (Utx−/y) infected with N1-IC (g) or N1-ΔE (h). i, qPCR validation of expression levels of one down-regulated (Suz12) and one up-regulated (Il7ra) gene in Utx−/Y (compared to UTX+/Y). The average of three independent samples/studies is presented. j, Targeted Sanger sequencing in pediatric led to identification of three cases with frameshift mutations. The positions of mutations are indicated by dashed lines in the electropherograms. k, Identification of one in-frame deletion (p.A14_A17del, #1, top panel), one splice acceptor site (#2, second panel) and one missense mutation (#3, third panel) in adult T-ALL. #4 is an adult T-ALL case with wild-type UTX (control, bottom panel). Mutations are indicated by red-colored characters. l, Levels of UTX in CUTLL1 T-ALL cells in the absence (−dox) or presence (+dox) of doxycycline. m, n, Apoptosis analysis through measuring annexin-V staining using control LacZ-expressing and UTX-expressing CUTLL1 in the absence (−dox) or presence (+dox) of doxycycline. Representative plots (l, n) as well as average representation (l, m) of three independent experiments are shown.
Extended Data Figure 6. Physiological development of the hematopoietic system in the absence of Jmjd3.
a, b, Targeting scheme for the generation of Jmjd3−/− allele (a) and PCR-based quantification of the wild-type and mutant transcripts (b) using a specific primer set for the 3’ end of Jmjd3 cDNA. c, d, Analysis of the fetal liver for lineage markers (c) as well as bone marrow (d) of recipients for hematopoietic progenitors (lineage−, c-kit+, sca+ (LSK) population) for the Jmjd3+/+ and Jmjd3−/− genotypes. Representative plots of three independent experiments are shown. e–g, Analysis of major thymic subsets in Jmjd3+/+ (n=7) and Jmjd3−/− (n=7). Schematic representation of FACS analysis performed (e). Relative proportions of major cell populations in the thymi of Jmjd3+/+ and Jmjd3−/− background (f). mRNA expression of Jmjd3 gene in different stages of thymic development (g). h, and expression of Notch1 target (like Hes1, n=7) in CD4+/CD8+ double positive and CD4− CD8−CD25+ lymphocyte progenitor cells. Representative plots (e) as well as average representation (g, h) of seven independent thymi are shown.
Extended Data Figure 7. JMJD3 is necessary for disease initiation in an animal model of T-ALL.
Initiation of the disease was studied using a transplantation scheme of c-kit hematopoietic progenitors. a, b, Blood analysis of the recipients for Notch1-IC/GFP leukemic blasts (Jmjd3+/− (n=8) and Jmjd3−/− (n=8), a) and white blood cells (WBC, Jmjd3+/− (n=4) and Jmjd3−/− (n=6), b). Comparison of the organs size (c) and histochemistry (H&E) (d) and FACS-based (e) analysis of the leukemic infiltration in the spleen. f, Survival studies of recipients. Eight recipients for Jmjd3+/− and eight for Jmjd3−/− background were used in panels c–f.
Extended Data Figure 8. GSKJ4 inhibitor induces apoptosis and cell cycle arrest of T-ALL-but not myeloid leukemia or physiological LSK-cells.
a, Effect of GSKJ4 (at 2µM concentration) on a panel of T-ALL and myeloid lines. The average of three representative studies is shown. b–d, Effects on cell growth (b), apoptosis (c) and cell cycle (d) in three primary T-ALL lines. The average of three representative studies is shown. e, f, Measurement of apoptosis (e, n=3) and cell cycle effects (f, representative study of three experiments) in CUTLL1 cells 72 hours post treatment with the inhibitor. g, h, Apoptosis assays using Annexin V staining of CEM (g) after a period of 72 hours of treatment and measuring caspase 7/9 activity upon treatment of CUTLL1 (h) T-ALL cells with GSKJ5 and GSKJ4 over a period of 24 hours. i, Timecourse studies of Annexin V (upper panel) and cell cycle (lower panel) analysis of CUTLL1 cells over a period of 72h during GSKJ4 treatment according to the scheme on top of the figure. j, Expression of wild-type and catalytic mutant of JMJD3 in T-ALL (CEM) cells. k, Cell growth analysis of T-ALL cells overexpressing wild type and catalytically mutant JMJD3 upon GSJ4 treatment over a period of 72h. Average representation of three independent experiments is shown. l, Cell growth of LSK upon treatment with control (2uM) and different concentrations of GSKJ4 inhibitor. m, Annexin V staining of THP1 cells after a period of 72 hours of GSKJ4 and GSKJ5 (control) treatment at 2mM concentration. Average representation of three independent experiments is shown. n, mRNA levels are shown for three classical NOTCH1 targets (HEY1, NRARP and NOTCH1) over a period of 72h during GSKJ4 treatment. Average representation of three independent experiments is shown.
Extended Data Figure 9. GSKJ4 treatment leads to increased H3K27me3 levels on NOTCH1 targets through specific inhibition of JMJD3 activity.
Analysis of the promoter area of HEY1 (a), NRARP (b) and NOTCH1 (c) for H3K27me3, H3K27me1, NOTCH1 and JMJD3 enrichment over a period of 24h during GSKJ4 treatment. Average representation of three independent experiments is shown. d, Analysis of total protein extracts from CUTLL1 cells for JMJD3 and NOTCH1. e, Analysis of chromatin fraction from CUTLL1 cells for the repressive mark H3K27me3, the activating marks H3K27me1 and H3K4me3 as well as total histone H3 levels. Representative plots of three independent experiments are shown. f, Snapshots of GSKJ4-associated H3K27me3 changes in major NOTCH1 and JMJD3 targets. g, ChIP-qPCR analyses for UTX binding on NOTCH1 targets HEY1, NRARP and NOTCH1 (RBBP6 is used as positive control). The average of three independent experiments is shown.
Extended Data Figure 10. JMJD3 as a pivotal factor in NOTCH1-mediated oncogenic activation in T cell leukemia.
a, Schematic representation of the H3K27me3 writer (polycomb complex, right panel) and eraser JMJD3 (left panel). EZH2 entails the catalytic subunit of the complex through its SET domain, whereas EED subunit recognizes the H3K27me3 mark and helps polycomb binding. JmjC domain activity is inhibited by the small molecule inhibitor GSKJ4. b, Main notion of the key role of JMJD3 in the NOTCH1 transcriptional complex’ Before activation of the NOTCH1 signaling pathway the promoters of classical NOTCH1 targets are bound by RBBJk together with components of the co-repressor complexes and poycomb repressive complex 2 (PRC2), leading to low gene expression. After binding of NOTCH1 and its co-activator MAML1 the genes are activated through recruitment of JMJD3 and MLL complex, with simultaneous eviction of PRC2, which leads to demethylation of H3K27me3 and methylation of H3K4me3.
Supplementary Material
Acknowledgements
We would like to thank the members of the Aifantis laboratory and Jasmin Siegle for helpful discussions throughout the duration of the project. S. Shen for valuable discussions on the analysis of sequencing data. Glaxo Smith Kline for the GSKJ4 and GSKJ5 inhibitory compounds. Dr. A. Heguy and the NYU Genome Technology Center (supported in part by NIH/NCI P30 CA016087-30 grant) for assistance with sequencing experiments. The NYU Flow Cytometry facility (supported in part by NIH/NCI 5 P30CA16087-31) for cell sorting, the NYU Histology Core (5P30CA16087-31), and the Mouse facility (NYU Cancer Institute Center Grant (5P30CA16087-31). G. Natoli for providing the Jmjd3 antibody. Also, J. Zhang for help with the analysis of the mutation data. Finally we thank I. Rigo for technical support. I.A. was supported by the National Institutes of Health (1RO1CA133379, 1RO1CA105129, 1RO1CA149655, 5RO1CA173636, and 5RO1CA169784). J.N was supported by Damon Runyon Cancer Research foundation. B.K. was supported by the NYU Cell and Molecular Biology Training Program. P.N. was supported by fellowships from Lady Tata Memorial Trust for leukemia and the American Society of Hematology (ASH). T.T. is supported by the NIH training grant 5 T32 CA009161-37. P.V.V. was supported by the Research Foundation Flanders and an Odysseus type II grant. Moreover this study was supported by a National Institutes of Health (NIH) grant R37-HD04502 to R.J.; the ECOG tumor bank; the National Institutes of Health (R01CA120196 to A.A.F.; U24 CA114737 and NCI U10 CA21115 to E.P.); the Stand Up To Cancer Innovative Research Award (A.A.F.). I.A. was also supported by the William Lawrence and Blanche Hughes Foundation, The Leukemia & Lymphoma Society and the Ralph S. French Charitable Foundation Trust. The Chemotherapy Foundation, The V Foundation for Cancer Research and the St. Baldrick’s Foundation. I.A. is a Howard Hughes Medical Institute Early Career Scientist. AT carried out part of this work while at the Computational Biology Center, IBM Research, Yorktown Heights, NY.
Footnotes
Supplementary Information is provided as two separate .pdf files.
Author Contributions I.A. and P.N. designed the experiments and wrote the manuscript. P.N. performed most of the experiments. A.T. designed and performed the analysis of genome-wide data and wrote the manuscript. T.T, E.L., A.S., J.M., B.K., S.B. and J.N. performed experiments and contributed with ideas. A.A.F. and L.X. designed and performed xenograft luciferase experiments and helped with ideas and concepts. P.V.V, E.P., M.S.T., J.M.R. and A.A.F. performed and analyzed mutational studies in adult T-ALL. G.G.W., R.J., T.S. and S.A. provided mouse tissues and helped with ideas and concepts. L.K. and R.P. helped with guidance on the biology and use of GSKJ inhibitors and with manuscript preparation. L.H., J.B. and C.G.M. performed and analyzed mutational studies in pediatric T-ALL.
High-throughput data presented in this study has been deposited to Gene Expression Omnibus with accession number: GSE56696
References
- 1.Baylin SB, Jones PA. A decade of exploring the cancer epigenome - biological and translational implications. Nature reviews. Cancer. 2011;11:726–734. doi: 10.1038/nrc3130. [DOI] [PMC free article] [PubMed] [Google Scholar]
- 2.Zhang J, et al. The genetic basis of early T-cell precursor acute lymphoblastic leukaemia. Nature. 2012;481:157–163. doi: 10.1038/nature10725. [DOI] [PMC free article] [PubMed] [Google Scholar]
- 3.Jankowska AM, et al. Mutational spectrum analysis of chronic myelomonocytic leukemia includes genes associated with epigenetic regulation: UTX, EZH2, and DNMT3A. Blood. 2011;118:3932–3941. doi: 10.1182/blood-2010-10-311019. [DOI] [PMC free article] [PubMed] [Google Scholar]
- 4.Ntziachristos P, et al. Genetic inactivation of the polycomb repressive complex 2 in T cell acute lymphoblastic leukemia. Nature medicine. 2012;18:298–301. doi: 10.1038/nm.2651. [DOI] [PMC free article] [PubMed] [Google Scholar]
- 5.Kruidenier L, et al. A selective jumonji H3K27 demethylase inhibitor modulates the proinflammatory macrophage response. Nature. 2012;488:404–408. doi: 10.1038/nature11262. [DOI] [PMC free article] [PubMed] [Google Scholar]
- 6.Hubner MR, Spector DL. Role of H3K27 Demethylases Jmjd3 and UTX in Transcriptional Regulation. Cold Spring Harbor symposia on quantitative biology. 2011 doi: 10.1101/sqb.2010.75.020. [DOI] [PubMed] [Google Scholar]
- 7.Kooistra SM, Helin K. Molecular mechanisms and potential functions of histone demethylases. Nature reviews. Molecular cell biology. 2012;13:297–311. doi: 10.1038/nrm3327. [DOI] [PubMed] [Google Scholar]
- 8.Morales Torres C, Laugesen A, Helin K. Utx Is Required for Proper Induction of Ectoderm and Mesoderm during Differentiation of Embryonic Stem Cells. PloS one. 2013;8:e60020. doi: 10.1371/journal.pone.0060020. [DOI] [PMC free article] [PubMed] [Google Scholar]
- 9.Wang C, et al. UTX regulates mesoderm differentiation of embryonic stem cells independent of H3K27 demethylase activity. Proceedings of the National Academy of Sciences of the United States of America. 2012;109:15324–15329. doi: 10.1073/pnas.1204166109. [DOI] [PMC free article] [PubMed] [Google Scholar]
- 10.Mansour AA, et al. The H3K27 demethylase Utx regulates somatic and germ cell epigenetic reprogramming. Nature. 2012;488:409–413. doi: 10.1038/nature11272. [DOI] [PubMed] [Google Scholar]
- 11.De Santa F, et al. The histone H3 lysine-27 demethylase Jmjd3 links inflammation to inhibition of polycomb-mediated gene silencing. Cell. 2007;130:1083–1094. doi: 10.1016/j.cell.2007.08.019. [DOI] [PubMed] [Google Scholar]
- 12.Agger K, et al. The H3K27me3 demethylase JMJD3 contributes to the activation of the INK4A-ARF locus in response to oncogene-and stress-induced senescence. Genes & development. 2009;23:1171–1176. doi: 10.1101/gad.510809. [DOI] [PMC free article] [PubMed] [Google Scholar]
- 13.Barradas M, et al. Histone demethylase JMJD3 contributes to epigenetic control of INK4a/ARF by oncogenic RAS. Genes & development. 2009;23:1177–1182. doi: 10.1101/gad.511109. [DOI] [PMC free article] [PubMed] [Google Scholar]
- 14.Jepsen K, et al. SMRT-mediated repression of an H3K27 demethylase in progression from neural stem cell to neuron. Nature. 2007;450:415–419. doi: 10.1038/nature06270. [DOI] [PubMed] [Google Scholar]
- 15.Sen GL, Webster DE, Barragan DI, Chang HY, Khavari PA. Control of differentiation in a self-renewing mammalian tissue by the histone demethylase JMJD3. Genes & development. 2008;22:1865–1870. doi: 10.1101/gad.1673508. [DOI] [PMC free article] [PubMed] [Google Scholar]
- 16.Zhao W, et al. Jmjd3 inhibits reprogramming by upregulating expression of INK4a/Arf and targeting PHF20 for ubiquitination. Cell. 2013;152:1037–1050. doi: 10.1016/j.cell.2013.02.006. [DOI] [PMC free article] [PubMed] [Google Scholar]
- 17.Wang JK, et al. The histone demethylase UTX enables RB-dependent cell fate control. Genes & development. 2010;24:327–332. doi: 10.1101/gad.1882610. [DOI] [PMC free article] [PubMed] [Google Scholar]
- 18.Thieme S, et al. The histone demethylase UTX regulates stem cell migration and hematopoiesis. Blood. 2013;121:2462–2473. doi: 10.1182/blood-2012-08-452003. [DOI] [PubMed] [Google Scholar]
- 19.van Haaften G, et al. Somatic mutations of the histone H3K27 demethylase gene UTX in human cancer. Nature genetics. 2009;41:521–523. doi: 10.1038/ng.349. [DOI] [PMC free article] [PubMed] [Google Scholar]
- 20.Mar BG, et al. Sequencing histone-modifying enzymes identifies UTX mutations in acute lymphoblastic leukemia. Leukemia. 2012;26:1881–1883. doi: 10.1038/leu.2012.56. [DOI] [PMC free article] [PubMed] [Google Scholar]
- 21.Weng AP, et al. Activating mutations of NOTCH1 in human T cell acute lymphoblastic leukemia. Science. 2004;306:269–271. doi: 10.1126/science.1102160. [DOI] [PubMed] [Google Scholar]
- 22.Espinosa L, et al. The Notch/Hes1 pathway sustains NF-kappaB activation through CYLD repression in T cell leukemia. Cancer cell. 2010;18:268–281. doi: 10.1016/j.ccr.2010.08.006. [DOI] [PMC free article] [PubMed] [Google Scholar]
- 23.Dik WA, et al. New insights on human T cell development by quantitative T cell receptor gene rearrangement studies and gene expression profiling. The Journal of experimental medicine. 2005;201:1715–1723. doi: 10.1084/jem.20042524. [DOI] [PMC free article] [PubMed] [Google Scholar]
- 24.Van Vlierberghe P, et al. ETV6 mutations in early immature human T cell leukemias. The Journal of experimental medicine. 2011;208:2571–2579. doi: 10.1084/jem.20112239. [DOI] [PMC free article] [PubMed] [Google Scholar]
- 25.Valk PJ, et al. Prognostically useful gene-expression profiles in acute myeloid leukemia. The New England journal of medicine. 2004;350:1617–1628. doi: 10.1056/NEJMoa040465. [DOI] [PubMed] [Google Scholar]
- 26.Wang H, et al. Genome-wide analysis reveals conserved and divergent features of Notch1/RBPJ binding in human and murine T-lymphoblastic leukemia cells. Proceedings of the National Academy of Sciences of the United States of America. 2011;108:14908–14913. doi: 10.1073/pnas.1109023108. [DOI] [PMC free article] [PubMed] [Google Scholar]
- 27.Welstead GG, et al. X-linked H3K27me3 demethylase Utx is required for embryonic development in a sex-specific manner. Proceedings of the National Academy Of Sciences of the United States of America. 2012;109:13004–13009. doi: 10.1073/pnas.1210787109. [DOI] [PMC free article] [PubMed] [Google Scholar]
- 28.Satoh T, et al. The Jmjd3-Irf4 axis regulates M2 macrophage polarization and host responses against helminth infection. Nat Immunol. 2010;11:936–944. doi: 10.1038/ni.1920. doi:ni.1920 [pii] 10.1038/ni.1920. [DOI] [PubMed] [Google Scholar]
- 29.Simon C, et al. A key role for EZH2 and associated genes in mouse and human adult T-cell acute leukemia. Genes & development. 2012;26:651–656. doi: 10.1101/gad.186411.111. [DOI] [PMC free article] [PubMed] [Google Scholar]
- 30.Wang H, et al. Genome-wide analysis reveals conserved and divergent features of Notch1/RBPJ binding in human and murine T-lymphoblastic leukemia cells. Proceedings of the National Academy of Sciences of the United States of America. 2011;108:14908–14913. doi: 10.1073/pnas.1109023108. [DOI] [PMC free article] [PubMed] [Google Scholar]
- 31.Satoh T, et al. The Jmjd3-Irf4 axis regulates M2 macrophage polarization and host responses against helminth infection. Nature immunology. 2010;11:936–944. doi: 10.1038/ni.1920. [DOI] [PubMed] [Google Scholar]
- 32.Palomero T, et al. CUTLL1, a novel human T-cell lymphoma cell line with t(7;9) rearrangement, aberrant NOTCH1 activation and high sensitivity to gamma-secretase inhibitors. Leukemia. 2006;20:1279–1287. doi: 10.1038/sj.leu.2404258. [DOI] [PubMed] [Google Scholar]
- 33.Sharma VM, et al. Notch1 contributes to mouse T-cell leukemia by directly inducing the expression of c-myc. Molecular and cellular biology. 2006;26:8022–8031. doi: 10.1128/MCB.01091-06. doi:MCB.01091-06 [pii] 10.1128/MCB.01091-06. [DOI] [PMC free article] [PubMed] [Google Scholar]
- 34.King B, et al. The Ubiquitin Ligase FBXW7 Modulates Leukemia-Initiating Cell Activity by Regulating MYC Stability. Cell. 2013;153:1552–1566. doi: 10.1016/j.cell.2013.05.041. [DOI] [PMC free article] [PubMed] [Google Scholar]
- 35.Armstrong F, et al. NOTCH is a key regulator of human T-cell acute leukemia initiating cell activity. Blood. 2009;113:1730–1740. doi: 10.1182/blood-2008-02-138172. [DOI] [PubMed] [Google Scholar]
- 36.Ntziachristos P, et al. Genetic inactivation of the polycomb repressive complex 2 in T cell acute lymphoblastic leukemia. Nature medicine. 2012;18:298–303. doi: 10.1038/nm.2651. [DOI] [PMC free article] [PubMed] [Google Scholar]
- 37.Dickins RA, et al. Probing tumor phenotypes using stable and regulated synthetic microRNA precursors. Nature genetics. 2005;37:1289–1295. doi: 10.1038/ng1651. [DOI] [PubMed] [Google Scholar]
- 38.Adams MD, et al. The genome sequence of Drosophila melanogaster. Science. 2000;287:2185–2195. doi: 10.1126/science.287.5461.2185. doi:8392 [pii] [DOI] [PubMed] [Google Scholar]
- 39.Zhong S, et al. High-throughput illumina strand-specific RNA sequencing library preparation. Cold Spring Harbor protocols. 2011;2011:940–949. doi: 10.1101/pdb.prot5652. [DOI] [PubMed] [Google Scholar]
- 40.Mullighan CG. Single nucleotide polymorphism microarray analysis of genetic alterations in cancer. Methods in molecular biology. 2011;730:235–258. doi: 10.1007/978-1-61779-074-4_17. [DOI] [PubMed] [Google Scholar]
- 41.Mullighan CG, et al. CREBBP mutations in relapsed acute lymphoblastic leukaemia. Nature. 2011;471:235–239. doi: 10.1038/nature09727. [DOI] [PMC free article] [PubMed] [Google Scholar]
- 42.Zhang J, et al. SNPdetector: a software tool for sensitive and accurate SNP detection. PLoS computational biology. 2005;1:e53. doi: 10.1371/journal.pcbi.0010053. [DOI] [PMC free article] [PubMed] [Google Scholar]
- 43.Chen K, et al. PolyScan: an automatic indel and SNP detection approach to the analysis of human resequencing data. Genome research. 2007;17:659–666. doi: 10.1101/gr.6151507. [DOI] [PMC free article] [PubMed] [Google Scholar]
- 44.Marks DI, et al. T-cell acute lymphoblastic leukemia in adults: clinical features, immunophenotype, cytogenetics, and outcome from the large randomized prospective trial (UKALL XII/ECOG 2993) Blood. 2009;114:5136–5145. doi: 10.1182/blood-2009-08-231217. [DOI] [PMC free article] [PubMed] [Google Scholar]
- 45.Verhaak RG, et al. Prediction of molecular subtypes in acute myeloid leukemia based on gene expression profiling. Haematologica. 2009;94:131–134. doi: 10.3324/haematol.13299. [DOI] [PMC free article] [PubMed] [Google Scholar]
- 46.Subramanian A, et al. Gene set enrichment analysis: a knowledge-based approach for interpreting genome-wide expression profiles. Proceedings of the National Academy of Sciences of the United States of America. 2005;102:15545–15550. doi: 10.1073/pnas.0506580102. [DOI] [PMC free article] [PubMed] [Google Scholar]
- 47.Langmead B, Trapnell C, Pop M, Salzberg SL. Ultrafast and memory-efficient alignment of short DNA sequences to the human genome. Genome biology. 2009;10:R25. doi: 10.1186/gb-2009-10-3-r25. [DOI] [PMC free article] [PubMed] [Google Scholar]
- 48.Wang L, Feng Z, Wang X, Wang X, Zhang X. DEGseq: an R package for identifying differentially expressed genes from RNA-seq data. Bioinformatics. 2010;26:136–138. doi: 10.1093/bioinformatics/btp612. [DOI] [PubMed] [Google Scholar]
- 49.Zhang Y, et al. Model-based analysis of ChIP-Seq (MACS) Genome biology. 2008;9:R137. doi: 10.1186/gb-2008-9-9-r137. [DOI] [PMC free article] [PubMed] [Google Scholar]
- 50.Li Q BJ, Huang H, Bickel PJ. Measuring reproducibility of high-throughput experiments. The Annals of Applied Statistics. 2011;5:1699–2264. [Google Scholar]
- 51.Tsirigos A, Haiminen N, Bilal E, Utro F. GenomicTools: a computational platform for developing high-throughput analytics in genomics. Bioinformatics. 2012;28:282–283. doi: 10.1093/bioinformatics/btr646. [DOI] [PubMed] [Google Scholar]
Associated Data
This section collects any data citations, data availability statements, or supplementary materials included in this article.


