Significance
This work describes a simple waveguide that not only carries fluid waves, but also performs a spectral analysis. When driven by a complex input that contains several frequency components, it will spatially separate those components, in analogy to the separation of white light by a prism. The frequency tuning of the waveguide is not based on resonance, but on wave dispersion: Each wave has its own region in which it undergoes a steep deceleration, causing it to focus its energy and deliver it. This method of spectral analysis has not been described before. The waveguide bears a striking resemblance to the inner ear of mammals, both in terms of structure and behavior.
Keywords: avoided crossing, tonotopy, group velocity, hydrodynamics, auditory filter
Abstract
This study analyzes a waveguide consisting of two parallel fluid-filled chambers connected by a narrow slit that is spanned by two coupled elastic beams. A stiffness gradient exists in the longitudinal direction. This simple linear system, which contains no lumped mass, is shown to act as a spectral analyzer. Fluid waves traveling in the waveguide exhibit a distinct amplitude peak at a longitudinal location that varies systematically with frequency. The peaking is not based on resonance, but entirely on wave dispersion. When entering its peak region, the wave undergoes a sharp deceleration associated with a transition in which two propagation modes exchange roles. It is proposed that this mode shape swapping underlies the frequency analysis of the mammalian cochlea.
In this study I explore the following question: How can a waveguide act as a spectral analyzer which spatially separates the frequency components of a wideband input? This question has been debated since Bekesy's observation of traveling waves in the mammalian inner ear (1), the cochlea. On their way from base to apex, these fluid waves exhibit an amplitude peak at a frequency-dependent place. The peaking underlies our ability to identify and separate sounds.
The most common explanation of cochlear frequency selectivity invokes local resonances coupled to the traveling wave (2). This approach requires a form of mass loading of the cochlear partition in addition to the mass loading by the surrounding fluid. The amount of mass needed in such models has been criticized for being unrealistically large given the cochlear anatomy (3). Even when sidestepping these objections, it has proved difficult to formulate models that reproduce both the amplitude and phase data of sensitive cochleae. On their way to the amplitude peak, cochlear traveling waves accumulate only 1–2 cycles (4, 5). Resonance-based models that produce sharp amplitude peaking tend to systematically overestimate the phase accumulation (6, 7). The resonance point acts as a cutoff, and a hypothetical frictionless wave would accumulate an infinite number of cycles when approaching it (8). Although damping will temper this singular behavior, too much of it also spoils the amplitude peaking.
In active cochlear models (9, 10) this problem is circumvented by postulating a limited region of mechanical amplification (“negative damping”) basal to the resonance point. This creates a sufficiently sharp amplitude peak at a more basal location (safely away from the singularity), while still allowing ordinary damping to temper the phase accumulation near the resonance point (7).
The present study explores an alternative approach which rejects resonance as the mechanism producing the peaking. In this scenario the peaking of traveling waves is created by a form of wave dispersion that is characterized by a steep deceleration of the energy transport. The deceleration produces a densification (focusing) of the energy that creates the peaking. This approach was motivated by neural data revealing a steep deceleration of cochlear waves near their peak (5, 11). Rather than building an elaborate biophysical model, the aim was to find the simplest possible fluid waveguide exhibiting steep deceleration and peaking.
Model Overview
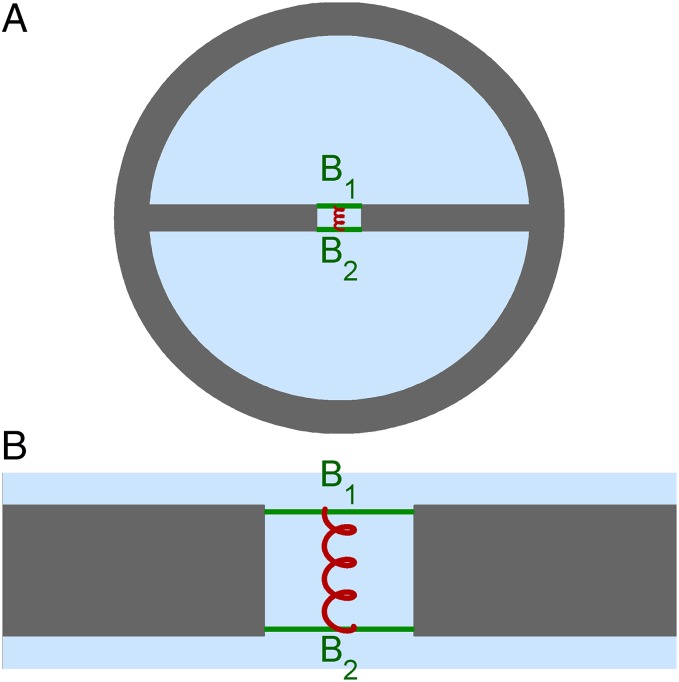
A cross-section of the model (Fig. 1A) shows its basic features. Its parameters are motivated by data from the gerbil cochlea; a detailed description is given in SI Text. Two fluid-filled half-cylinders are enclosed in rigid walls. The chambers are connected by a narrow slit spanned by two parallel elastic beams (“membranes”) B1 and B2. The beams are massless and have comparable stiffness. The motion of the elastic beams is described by a simple unimodal deformation. The distance between the beams is comparable to their width. The space between the beams is filled with fluid. There is an elastic coupling between the beams (Fig. 1B). All fluid in the model is incompressible. The geometry is constant along the longitudinal axis (the propagation direction, perpendicular to the plane of Fig. 1A), but all stiffness values (both of the individual beams and their coupling) jointly vary according to an exponential map. This stiffness gradient is chosen to be sufficiently slow to justify the Wentzel–Kramers–Brillouin (WKB) approximation (12). In the analysis of dispersion damping will be ignored at first; light damping, dominated by out-of-phase beam motion, is introduced later.
Fig. 1.
Layout of the double-beam waveguide. (A) Cross-section showing the half-cylindrical, fluid-filled chambers, the elastic beams B1 and B2 (green), and the fluid trapped in the slit between them. Fluid: light blue. Wave propagation is perpendicular to the plane of view. (B) Zoom-in showing the slit between the chambers and elastic coupling (red) between the beams.
Analysis of the Behavior
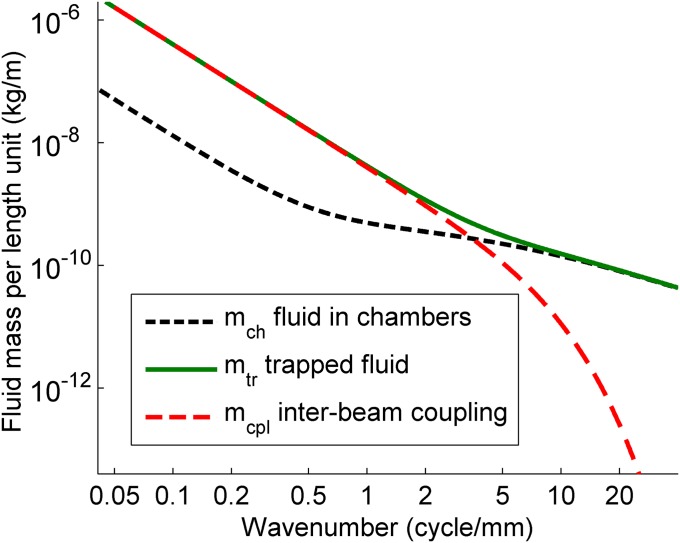
The behavior of the model will be analyzed by introducing its features one by one. Detailed derivations are provided in SI Text. In the absence of a stiffness gradient, and with only one chamber filled with fluid, the reduced waveguide supports 3D fluid waves (13) characterized by a fanning pattern of fluid motion (Fig. S1). The wavelength dependence of the effective mass mch of the fluid in the chamber (Fig. 2) gives rise to strongly dispersive effects: the phase velocity c varies considerably with wavelength, and U/c (the ratio of group velocity U to phase velocity c) assumes values as low as 0.16 (Fig. S2). These dispersion properties are analyzed further on.
Fig. 2.
Effective fluid masses as a function of wavenumber. The three contributions to the mass matrix (see text following Eq. 1) are the effective fluid mass of the half-cylindrical chambers (mch), that of the fluid trapped between the beams (mtr), and the coupling between the beams mediated by the trapped fluid (mcpl).
Next consider the case in which both chambers and the slit between the beams are filled with fluid, but the beams are not yet elastically coupled. The system now has two degrees of freedom, represented by the vector η =(η1,η2)T, holding η1 and η2, the displacements of the two beams. Its dynamics is described in terms of the 2 × 2 matrices M and S representing mass and stiffness per unit length, respectively (14). Because the model has no lumped mass, M consists exclusively of contributions from the fluid:
| [1] |
with k the wavenumber, mch the effective mass of the fluid in each chamber, mtr the effective mass of the fluid trapped between the beams, and mcpl the mutual coupling between the beams mediated by the trapped fluid. Each of these effective fluid masses depends on k. The functions mch(k), mtr(k), and mcpl(k) were calculated by numerically solving the Laplace equation for the velocity potential describing the irrotational fluid motion (Eqs. S8 and S16). The result is shown in Fig. 2. For k < 0.2 cycle per mm, the wavelength λ = 1/k is large compared with the dimensions of the model, and the waves are shallow; the direction of the fluid motion is predominantly longitudinal. In this range, all masses are proportional to 1/k2, leading to a constant phase velocity (no dispersion). For k > 0.2 cycle per mm, the penetration depth of the fluid motion (15), which equals λ/2π, becomes comparable to the radius of the chambers. This is the fanning-wave range (Fig. S2): the 3D wave motion in the chambers causes a much shallower dependence of mch on k than the 1/k2 behavior for small k (13). For k > 2 cycles per mm, the penetration depth becomes smaller than the distance between the elastic beams, and the coupling term mcpl rapidly declines with increasing k. In this range, the two beams are virtually uncoupled, and fluid motion on either side of a beam is confined to small regions remote from any rigid boundaries, leading to a convergence of mch and mtr.
The dispersion behavior is determined by the effective fluid masses. The dispersion relation is (14)
| [2] |
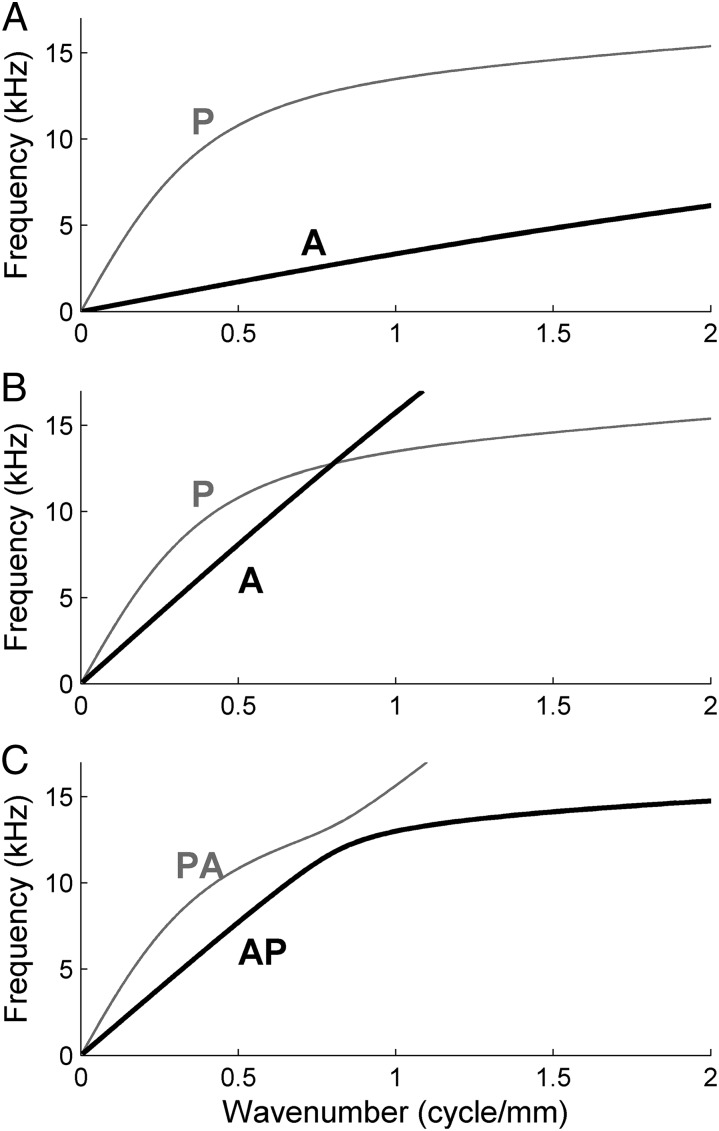
where ω is the angular frequency of the wave. In the absence of elastic coupling between the beams, S is diagonal, leading to the two modes shown in the dispersion diagram of Fig. 3A. Because the stiffness of the two beams is comparable (s1/s2 = 3), the two wave modes correspond to a parallel motion of the beams (P mode; gray line in Fig. 3A) and an antiparallel motion (A mode; black line in Fig. 3A), respectively. In the P mode, the mass is dominated by the fluid in the chambers; in the A mode, the mass is dominated by the trapped fluid, which is squirted in the longitudinal direction. The fanning P waves are faster than the squirting A waves.
Fig. 3.
Dispersion diagrams of the two waveguide modes. (A) Without elastic coupling between the beams. P and A modes (see text following Eq. 3) indicated. (B) Hypothetical dispersion diagram after introducing the elastic coupling, which selectively speeds up the A mode. The A and P modes cross. Stiffness ratio s1:s2:s12 = 1:3:14. (C) The actual dispersion diagram of the system with coupled beams, obtained by solving Eq. 2, shows avoided crossing, creating the AP and PA modes as indicated.
Mode Shape Swapping and Deceleration
Next introduce the elastic coupling between the beams, which causes S to become
| [3] |
with s12 the elastic coupling (Eq. S18). This hardly affects the P mode, in which the beams move together, but it increases the effective stiffness of the A mode, in which the beams move against each other. Propagation in the A mode will thus become faster, and its dispersion curve steeper. For sufficiently large s12, then, the dispersion curve of the A mode may be expected to intersect that of the P mode, as depicted in Fig. 3B. This expectation is not fulfilled. In fact, solving Eq. 2 leads to the situation depicted in Fig. 3C. The curves show a behavior known as avoided crossing, which was first observed and explained in the context of quantum-mechanical eigenvalue problems (16). The dispersion curves act as if they repel each other, and switch roles at the expected intersection point. As a result, neither mode is purely parallel or antiparallel. At the transition point, the A mode turns into a P mode and vice versa. This transition will be referred to as mode shape swapping, and the frequency at which it occurs will be called the transition frequency. The two modes depicted in Fig. 3C will be called the AP and PA modes. The term “mode shape” refers to a particular combination of beam motion; the term “mode,” to a set of mode shapes connected by a single dispersion curve.
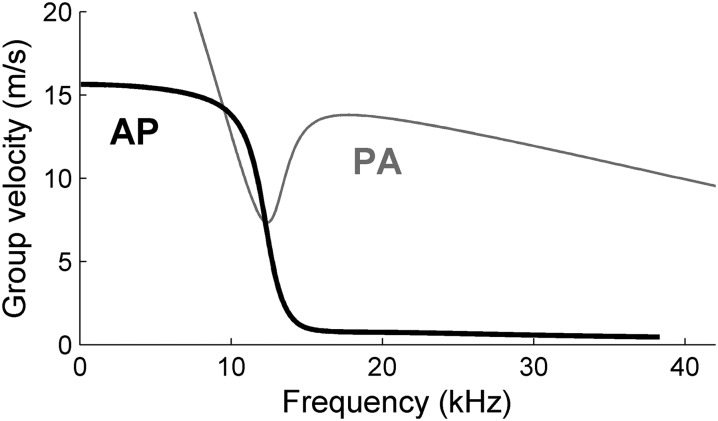
A key consequence of mode shape swapping is the rapid change in the slopes of the dispersion curves, i.e., a jump-like change of the group velocity U = dω/dk. This transition is illustrated by plotting group velocity versus frequency for the AP and PA modes. The AP mode (black line in Fig. 4) shows a sharp transition. Below the transition frequency (12 kHz in Fig. 4), its group velocity is nearly constant at ∼15 m/s. Within a few kHz, group velocity drops to ∼1 m/s. Further increments of the frequency produce relatively little additional change in the group velocity.
Fig. 4.
Group velocity versus frequency for the AP and PA modes of Fig. 3C.The group velocity of the AP mode, but not the PA mode, undergoes a steep drop near the transition frequency, 12 kHz.
Spatial Response Patterns
We next introduce the longitudinal stiffness gradient and analyze how it affects wave propagation. The variation of S(x) with longitudinal location x has two consequences. First, it causes the wavenumbers kAP and kPA of the two eigenmodes to vary with position in addition to their frequency dependence. Second, it makes the eigenmodes themselves x-dependent, particularly in the transition region where the modes exchange shapes. This raises the possibility of mode conversion, the coupling of one mode into another during propagation (17). Let Θ(ω,x) be the 2 × 2 matrix that decomposes the displacement vector η into local eigenmodes. Then the x dependence of η can be expressed in the known propagation of the eigenmodes, leading to
| [4] |
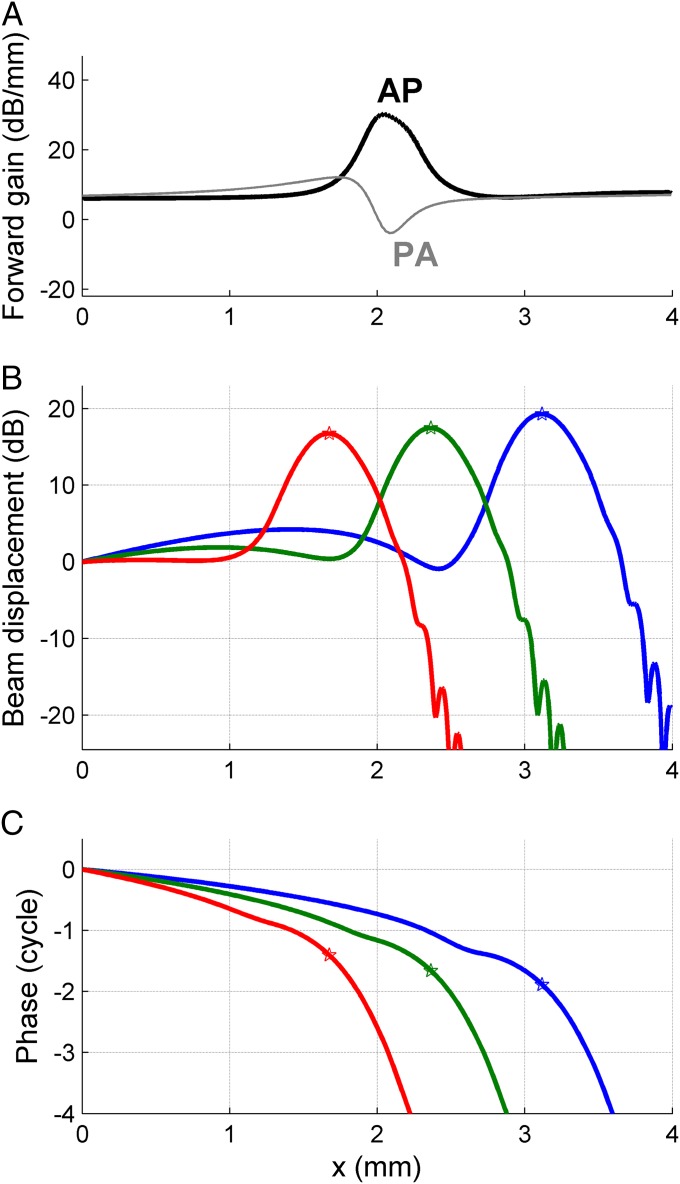
Here K is the diagonal wavenumber matrix that describes the phase accumulation of the two eigenmodes, and G is the diagonal forward gain matrix that describes their local amplitude variation dictated by the gradients in stiffness and group velocity. G ensures energy conservation in the WKB approximation (18). Θ, K, and G depend on x. In the transition region, where the group velocity of the AP mode plummets, the element of G corresponding to the AP mode shows a sharp peak (Fig. 5A). In physical terms, this amplitude boost is a consequence of the energy focusing (densification) following the steep deceleration of energy transport. Because only the AP mode has this sharp local boost, the steepness of amplitude peaking in a solution of Eq. 4 critically depends on the initial condition at x = 0. Sharp peaking requires the wave to be predominantly in the AP mode when entering its transition region. Owing to potential mode conversion, this requirement is not fully equivalent to the wave starting off (at x = 0) in the AP mode (Fig. S3).
Fig. 5.
Spectral analysis by the double-beam waveguide. (A) Local amplitude gain from gradients in group velocity and stiffness for the two modes at 24 kHz. (B) Solid lines: spatial profiles of displacement amplitude of beam B1 in response to equal-amplitude sinusoids at x = 0. Frequencies: 17 kHz (blue), 24 kHz (green), 33 kHz (red). (C) Companion phase profiles. The stars mark the location of the peak of the corresponding amplitude profile.
The final model ingredient to be introduced is damping. Light damping causes the wavenumber k to pick up a small imaginary part that creates an exponential decay of the wave amplitude. Importantly, the spatial rate of decay is inversely proportional to group velocity (Eq. S23). Consequently, the waves are hardly affected by damping before they decelerate, whereas they decay over a relatively short distance after decelerating. The steepness of the deceleration contributes to creating a well-localized amplitude peak. If the deceleration were too gradual, the amplitude boost created by the deceleration would not only be shallower, but also counteracted by the increased susceptibility to damping following the deceleration.
The response of the model to sinusoidal stimulation at x = 0 (Fig. 5 B and C) exhibits mode shape swapping and subsequent amplitude peaking at a frequency-dependent location. The three sinusoids were presented in the same mode shape at x = 0. Thus, their spatially separated peaks show that the model waveguide depicted in Fig. 1 acts as a spectral analyzer. The peak widths of Fig. 5B correspond with a quality factor Q10dB of 3, matching the tuning of low-intensity basilar-membrane data in sensitive gerbil cochleae (19, 20). Importantly, the model does not owe its frequency selectivity to resonance, because its beams are massless. It has no cutoff or transition to evanescent waves, phenomena that are inevitable in resonance-based models (8). In contrast, the waves shown in Fig. 5 propagate well beyond their peak, even though they decay rapidly. Mode conversion has little impact on the peaking shown in Fig. 5. The AP mode dominates the wave from its start at x = 0, and this dominance persists throughout the peak region. Only well beyond the peak does the PA mode become dominant, putting an end to the steep decay. This is further analyzed in Fig. S3, where the spatial profiles of Fig. 5 are decomposed into the contributions from the two modes.
Discussion
The waveguide analyzed in this study is a physical contraption capable of spectral analysis that, to the best of the author’s knowledge, is new. It is neither based on resonance, nor on standing waves, nor on geometric periodicity (as in a grating), but on an abrupt exchange of shapes between propagating wave modes. Such mode shape swapping has previously been described in the context of vibration modes in structural dynamics (21) and atomic spectra (16). Surprisingly, it has not been applied to propagating wave modes, even though the analyses of vibration modes and propagation modes are mathematically equivalent. Briefly, the waveguide demonstrates a new physical effect based on well-known physics.
The geometry depicted in Fig. 1 is not the only realization of a spectral analyzer based on mode shape swapping. Variations are possible, as long as the following essentials are included: two degrees of freedom; a strongly dispersive fanning-wave mode shape (generalizing the P mode); a squirting mode shape (generalizing the A mode); internal stiffness speeding up the squirting mode but not the fanning mode (generalizing the spring in Fig. 1B); light damping. The crucial contrast between fanning and squirting waves is that the former conserve the cross-sectional area of the trapped fluid whereas the latter involve a periodic change of this area. Fig. S4 depicts a number of alternative waveguide geometries that support these two wave types.
In terms of structural requirements, the fanning mode needs a narrow elastic structure facing a wide and deep chamber; the squirting mode needs a narrow tunnel in which fluid is trapped; the internal stiffness must be associated with deformations of the tunnel. These three structural properties are present in all mammalian inner ears (despite strong anatomical variation both along the cochlear length and across species). The basilar membrane is narrow compared with the scalae on both sides, and the organ of Corti has a tunnel-like structure supported by a V-shaped constellation of structurally stiff pillar cells (22). Thus, the basic requirements for mode shape swapping are in place. Whether it actually occurs is an empirical question. There is indirect evidence for multiple cochlear vibration modes (23, 24), but the most direct test is the in vivo measurement of the internal motion of the organ of Corti in sensitive cochleae. Mode shape swapping predicts a drastic change (polarity inversion) in internal motion upon varying stimulus frequency. Intriguingly, recent in vivo measurements of the internal motion of the mouse organ of Corti (25), obtained using optical coherence tomography (OCT), do show the steep polarity inversion predicted by mode shape swapping. The OCT data in figures 5 and 9 of that study (25) reveal a 180-degree phase shift in the relative motion of different parts within the organ of Corti. The steep phase shift occurred within a narrow range of frequencies and persisted postmortem, indicating that it reflects a passive mechanical property of the cochlea.
Viewed as a preliminary cochlear model, the waveguide described here shares some features with previous models, but differs from them in essential aspects. In passive resonant models the deceleration of energy transport contributes to amplitude peaking (8), but it is realized by resonance. This leads to a cutoff and overestimation of phase accumulation (6, 7). In contrast, resonance plays no role in the current work. The wave decelerates, but not indefinitely: it switches gears only once (Fig. 4), keeping the phase accumulation within realistic bounds. Active cochlear models (9, 10) postulate motile processes that inject mechanical energy into the wave. In contrast, the current model creates amplitude peaking by entirely passive means. Curiously, mode shape swapping appears to mimic the behavior of active models. Over a narrow spatial region the wave amplitude is boosted, and this region of forward gain (Fig. 5A) shifts with frequency. The amplitude boost, however, is not created by motile activity, but by the rapid transfer of power from a stiff and inert vibration mode into a compliant and light one. However, an observer watching one beam, but unaware of the other, would be tempted to attribute the sudden boost to a local power source. Finally, previous dual-compartment (“sandwich”) models of the cochlea share the use of two degrees of freedom with the current work, but differ from it in their reliance on resonance (14, 26) and motility (26) to explain frequency selectivity.
The mode shape swapping does not require any mechanical nonlinearity and is exhaustively described by linear equations. The linearity of the model suggests its use in explaining the subnanometer cochlear responses to low-intensity sounds. In its current linear form the model cannot describe the multiband dynamic range compression performed by the living cochlea. That would require the incorporation of automatic gain control, for instance by adjusting the amount of local damping to the local displacement amplitude (27, 28) or through directing high-intensity waves into the nonpeaking mode. Both mechanisms require an intensity-dependent control of the local mechanical properties of the organ of Corti. Outer hair cells are the obvious candidates for performing this task: they are sensors and actuators at the same time (29), and the attachment of their cell bodies and hair bundles allows them to control mechanical properties of surrounding structures. The refinement of OCT techniques will undoubtedly deepen the knowledge of inner ear vibrations in unprecedented ways. The waveguide model and the concept of mode shape swapping described in the current study provide a clear and straightforward theoretic framework that can guide the interpretation of such data. The author expects that these new data and ideas will help us to understand the basis of cochlear frequency selectivity and gain control in the near future.
Supplementary Material
Acknowledgments
I thank Natalie Cappaert for feedback on a preliminary version of this paper. This work is supported by Netherlands Organization for Scientific Research Grant 823.02.018 (Earth and Life Sciences).
Footnotes
The author declares no conflict of interest.
*This Direct Submission article had a Prearranged Editor.
This article contains supporting information online at www.pnas.org/lookup/suppl/doi:10.1073/pnas.1412412111/-/DCSupplemental.
References
- 1.Von Bekesy G. Experiments in Hearing. McGraw-Hill; New York: 1960. [Google Scholar]
- 2.Zweig G, Lipes R, Pierce JR. The cochlear compromise. J Acoust Soc Am. 1976;59(4):975–982. doi: 10.1121/1.380956. [DOI] [PubMed] [Google Scholar]
- 3.Steele CR, Taber LA. Comparison of WKB and finite difference calculations for a two-dimensional cochlear model. J Acoust Soc Am. 1979;65(4):1001–1006. doi: 10.1121/1.382569. [DOI] [PubMed] [Google Scholar]
- 4.Robles L, Ruggero MA. Mechanics of the mammalian cochlea. Physiol Rev. 2001;81(3):1305–1352. doi: 10.1152/physrev.2001.81.3.1305. [DOI] [PMC free article] [PubMed] [Google Scholar]
- 5.Kim DO, Molnar CE, Matthews JW. Cochlear mechanics: Nonlinear behavior in two-tone responses as reflected in cochlear-nerve-fiber responses and in ear-canal sound pressure. J Acoust Soc Am. 1980;67(5):1704–1721. doi: 10.1121/1.384297. [DOI] [PubMed] [Google Scholar]
- 6.Siebert WM. Ranke revisited—a simple short-wave cochlear model. J Acoust Soc Am. 1974;56(2):594–600. doi: 10.1121/1.1903296. [DOI] [PubMed] [Google Scholar]
- 7.Kolston PJ. The importance of phase data and model dimensionality to cochlear mechanics. Hear Res. 2000;145(1-2):25–36. doi: 10.1016/s0378-5955(00)00067-8. [DOI] [PubMed] [Google Scholar]
- 8.Lighthill J. Energy flow in the cochlea. J Fluid Mech. 1981;106:149–213. [Google Scholar]
- 9.Neely ST, Kim DO. An active cochlear model showing sharp tuning and high sensitivity. Hear Res. 1983;9(2):123–130. doi: 10.1016/0378-5955(83)90022-9. [DOI] [PubMed] [Google Scholar]
- 10.de Boer E, Nuttall AL. The mechanical waveform of the basilar membrane. III. Intensity effects. J Acoust Soc Am. 2000;107(3):1497–1507. doi: 10.1121/1.428436. [DOI] [PubMed] [Google Scholar]
- 11.van der Heijden M, Joris PX. Panoramic measurements of the apex of the cochlea. J Neurosci. 2006;26(44):11462–11473. doi: 10.1523/JNEUROSCI.1882-06.2006. [DOI] [PMC free article] [PubMed] [Google Scholar]
- 12.Elmore WC, Heald MA. Physics of Waves. Dover; New York: 1985. [Google Scholar]
- 13.Steele CR, Taber LA. Comparison of WKB calculations and experimental results for three-dimensional cochlear models. J Acoust Soc Am. 1979;65(4):1007–1018. doi: 10.1121/1.382570. [DOI] [PubMed] [Google Scholar]
- 14.Lamb JS, Chadwick RS. Dual traveling waves in an inner ear model with two degrees of freedom. Phys Rev Lett. 2011;107(8):088101. doi: 10.1103/PhysRevLett.107.088101. [DOI] [PMC free article] [PubMed] [Google Scholar]
- 15.Lighthill J. Waves in Fluids. Cambridge Univ Press; Cambridge, UK: 1978. [Google Scholar]
- 16.Von Neumann J, Wigner EP. Über das Verhalten von Eigenwerten bei adiabatischen Prozessen. Physik Z. 1929;30:467–470. [Google Scholar]
- 17.Kaufman AN, Friedland L. Phase-space solution of the linear mode-conversion problem. Phys Lett A. 1987;123:387–389. [Google Scholar]
- 18.Whitham GB. Linear and Nonlinear Waves. Wiley; New York: 1974. [Google Scholar]
- 19.Ren T, Nuttall AL. Basilar membrane vibration in the basal turn of the sensitive gerbil cochlea. Hear Res. 2001;151(1-2):48–60. doi: 10.1016/s0378-5955(00)00211-2. [DOI] [PubMed] [Google Scholar]
- 20.Versteegh CPC, van der Heijden M. Basilar membrane responses to tones and tone complexes: Nonlinear effects of stimulus intensity. J Assoc Res Otolaryngol. 2012;13(6):785–798. doi: 10.1007/s10162-012-0345-0. [DOI] [PMC free article] [PubMed] [Google Scholar]
- 21.Kung LE, Soedel W, Yang TY, Charek LT. Natural frequencies and mode shapes of an automotive tire with interpretation and classification using 3-D computer graphics. J Sound Vibrat. 1985;102(3):329–347. [Google Scholar]
- 22.Edge RM, et al. Morphology of the unfixed cochlea. Hear Res. 1998;124(1-2):1–16. doi: 10.1016/s0378-5955(98)00090-2. [DOI] [PubMed] [Google Scholar]
- 23.Recio A, Rich NC, Narayan SS, Ruggero MA. Basilar-membrane responses to clicks at the base of the chinchilla cochlea. J Acoust Soc Am. 1998;103(4):1972–1989. doi: 10.1121/1.421377. [DOI] [PMC free article] [PubMed] [Google Scholar]
- 24.Lin T, Guinan JJ., Jr Auditory-nerve-fiber responses to high-level clicks: Interference patterns indicate that excitation is due to the combination of multiple drives. J Acoust Soc Am. 2000;107(5 Pt 1):2615–2630. doi: 10.1121/1.428648. [DOI] [PubMed] [Google Scholar]
- 25.Gao SS, et al. Vibration of the organ of Corti within the cochlear apex in mice. J Neurophysiol. 2014;112(5):1192–1204. doi: 10.1152/jn.00306.2014. [DOI] [PMC free article] [PubMed] [Google Scholar]
- 26.Hubbard AE, Mountain DC, Chen F. In: Biophysics of the Cochlea: From Molecule to Models. Gummer AW, editor. World Scientific; Singapore: 2003. pp. 351–358. [Google Scholar]
- 27.Allen JB. Cochlear micromechanics—a physical model of transduction. J Acoust Soc Am. 1980;68(6):1660–1670. doi: 10.1121/1.385198. [DOI] [PubMed] [Google Scholar]
- 28.Versteegh CPC, van der Heijden M. The spatial buildup of compression and suppression in the mammalian cochlea. J Assoc Res Otolaryngol. 2013;14(4):523–545. doi: 10.1007/s10162-013-0393-0. [DOI] [PMC free article] [PubMed] [Google Scholar]
- 29.Brownell WE. Vertebrate Hair Cells. Springer Handbook of Auditory Research. Springer; New York: 2006. pp. 313–347. [Google Scholar]
Associated Data
This section collects any data citations, data availability statements, or supplementary materials included in this article.


