Proc. R. Soc. B 281, 20140034 (22 April 2014; Published online 5 March 2014) (doi:10.1098/rspb.2014.0034)
It has been brought to our attention that the data analysis for figures 1 and 2 is not appropriate. The colleague who contacted us correctly remarked that we should have compared the mean frequencies of the two genotypes, instead of all calls of all animals in the genotypes, because the genotype is the decisive parameter (‘The decisive number for calculating the mean ± s.e.m. for each column is the number of animals, not the number of calls. Therefore, the calculations and the statistics are misleading’.).
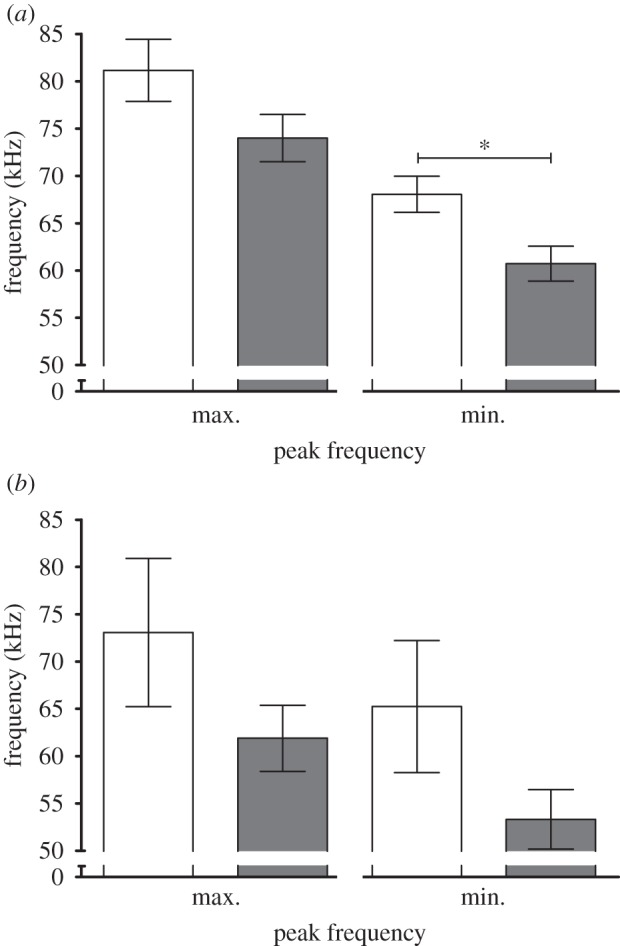
Figure 1.

The bar graph shows minimal and maximal peak frequencies of WT (white bars) and Per1−/− (grey bars) mice. (a) Mean peak frequency of male ultrasonic vocalizations (USV) at day 2 in WT (N = 6 animals) and Period1-deficient (Per1−/−; N = 16 animals) mice. Both maximal and minimal frequency was lower in Per1−/− compared to WT mice. (b) Mean peak frequency of male USV at day 10 in WT (N = 6 animals) and Period1-deficient (Per1−/−; N = 16 animals) mice. Both maximal and minimal frequency was lower in Per1−/− mice compared with WT mice. Genotype comparison was done by t-test (*p ≤ 0.05). All values are given as mean ± s.e.m.
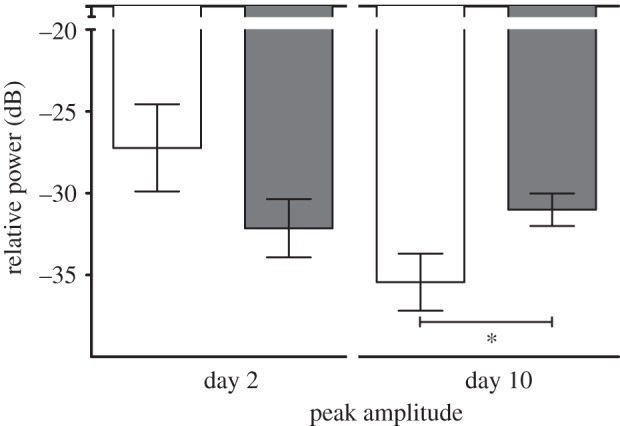
Figure 2.

Shown is the relative power (dB) of the mean peak max amplitude of male USV at day 2 and 10 in WT (N = 6 animals; white bars) and Period1-deficient (Per1−/−; N = 16 animals; grey bars) mice. The peak amplitude was not different in Per1−/− mice compared with WT mice at day 2. By contrast, the mean peak amplitude was significantly higher at day 10 in Per1−/− mice compared with WT mice. Genotype comparison was done by t-test (*p ≤ 0.05). All values are given as mean ± s.e.m.
All ultrasound vocalization (USV) data regarding frequency and amplitude have therefore been re-analysed accordingly, the figures were revised and corrected and all frequency and amplitude data are now provided together with the statistical data and the analysis procedure. In brief, we first took the data from the automated analysis provided by AviSoft SASLabPro for USV parameters (start-, peak-, end-frequency, start-, peak-, end-amplitude, etc.) and calculated a mean value for each parameter of each individual mouse (see the electronic supplementary material, tables S1–S3). These mean values were then tested for Gaussian distribution (normality) with the Kolmogorov–Smirnov test with Lilliefors-modification. If the normality-test was passed, we compared the genotypes by Student's t-test, if not by an appropriate non-parametric test, e.g. Mann–Whitney U-test. All p-values are ‘given per comparison’.
3. Results
(a). Ultrasound vocalization frequency and amplitude
WT (N = 6) and Per1−/−(N = 16) mice showed differences in the maximal and minimal peak frequencies (figure 1) and the peak amplitude of USV (figure 2) when confronted to a WT female. At day 2 (figure 1a), the mean maximal peak frequencies of each entire element (USV call) that was detected of the WT (81.1 ± 8.0 kHz) differed from the Per1−/− (74.0 ± 9.9 kHz) animals. The minimal peak frequencies were significantly different and, similar to the maximal frequencies, lower in Per1−/− compared to WT (WT: 68.0 ± 4.7 kHz; Per1−/−: 60.7 ± 7.3 kHz; p ≤ 0.02 t-test).
At day 10, there was still a difference in mean maximal (WT: 73.1 ± 19.2 kHz; Per1−/−: 61.9 ± 13.1 kHz) and minimal (WT: 65.2 ± 17.1.8 kHz; Per1−/−: 53.3 ± 11.8 kHz) peak frequencies between WT and Per1−/− animals (figure 1b).
This trend towards lower frequency in USV calling in male Per1−/− mice occurred despite their lower body weight, compared with WT controls (electronic supplementary material, figure S1).
Already 3 days after birth, pup isolation calls (USV emitted by the offspring when separated from their mother) displayed a lower maximal peak frequency in the Per1−/− animals compared with WT (WT: 88.0 ± 6.7 kHz; Per1−/−: 76.7 ± 3.9 kHz; p ≤ 0.0001 t-test; electronic supplementary material, figure S2).
In adult males, peak maximal amplitudes of each entire element (figure 2) exerted a difference between WT and Per1−/− animals at day 2 (WT: −27.2 ± 6.5 dB; Per1−/−: −32.1 ± 7.1 dB) as well as at day 10 (WT: −35.3 ± 4.6 dB; Per1−/−: −31.0 ± 3.7 dB; p ≤ 0.05; t-test).
Supplementary Material
Supplementary Material
Acknowledgement
We thank Prof. Dr Alexander Lerchl, Jacobs-University, Bremen for bringing the mistaken analysis in former figures 1 and 2 to our awareness and Dr Hanns Ackermann, Institute for Biostatistics and Mathematical Modelling, Goethe-University, Frankfurt for careful advice and encouragement as well as supervision of the statistical re-analysis.
Associated Data
This section collects any data citations, data availability statements, or supplementary materials included in this article.


