Abstract
We have examined the network of connected internal cavities in cytochrome c oxidase along which water produced at the catalytic center is removed from the enzyme. Using combination of structural analysis, molecular dynamics simulations, and free energy calculations we have identified two exit pathways that connect the Mg2+ ion cavity to the outside of the enzyme. Each pathway has a well-defined bottleneck, which determines the overall rate of water traffic along the exit pathway, and a specific cooperative mechanism of passing it. One of the pathways is going via Arg 438/439 (in bovine numbering) toward the CuA center, approaching closely its His204B ligand and Lys171B residue; and the other is going toward Asp364 and Thr294. Comparison of the pathways among different aa3-type enzymes shows that they are well conserved. Possible connections of the finding to redox-coupled proton pumping mechanism are discussed. We propose specific mutations near the bottlenecks of the exit pathways that can test some of our hypotheses.
1. Introduction
Cytochrome c oxidase (CcO) is the terminal enzyme of the respiratory electron transport chain, which pumps protons across the inner mitochondrial or bacterial plasma membrane using energy derived from the reduction of O2 to H2O [1–6]. Water molecules continuously generated (at the rate of the order of 1000 s−1 under 1:2 stoichiometry with the pumped protons) at the binuclear catalytic center (BNC) inside of the enzyme must escape from there at an appropriate rate to ensure the enzyme’s high turnover. An EPR study [7] finds that most, if not all, of the generated water molecules upon exit pass through the cavity right above heme a3, which contains the Mg2+ ion and many experimentally observable water molecules [8, 9]; however, neither the details of the exit pathways nor the mechanism of transport along them have been identified.
Whether Mg-cavity is already “outside” of the enzyme or not has been an issue of debate [10–14]. The notion that Mg-cavity is virtually outside obviously creates a problem for the proton pumping mechanism. Namely, if water molecules could move freely between that region and the outside of the protein, there would be nothing to prevent the backflow of protons from the P-side of the membrane to the Proton-Loading Site (PLS), which is most likely located in the region just above heme a3 and exposed to Mg-cavity [15]. If there were a free connection to the P-side, then when the PLS is set to accept a proton, a leaked proton in the Mg2+ region could occupy the PLS before the pumped proton, which would prevent the proton pumping. Although the proton backflow from Mg-cavity to the N-side through the D-channel could be blocked by a proposed Glu242 “valve” [16, 17] (all numbering is for bovine enzyme unless otherwise indicated), additional blockade for proton backflow between the P-side and Mg-cavity is still necessary for CcO to function as an effective proton pump. In order to have such a blockade, there should be something special about the flow of water molecules between Mg-cavity and the outside that prevents an easy access of the protons on the P-side to the PLS. Since water exit pathways could also serve as the proton exit pathways [18], their identification is crucial for a complete understanding of the proton pumping mechanism of the enzyme.
In this paper we investigate the possible water exit pathways in CcO, and examine the mechanism of water traffic along them. The analysis is based on combination of geometrical analysis of internal cavities in the enzyme and the network of their connectivities, molecular dynamics (MD) simulations of water traffic, and free energy calculations of energy profiles along the putative exit pathways. We find that there are only two well-defined plausible exits from Mg-cavity; each exit path has a bottleneck, which opens up a possibility of specific mutations to check the proposed hypotheses. The analysis is extended to one mammalian and three bacterial enzymes.
The structure of the paper is as follows. First, we describe the methodology we have used to identify and verify the exit paths. We then present the MD and free energy results to show the plausibility of the proposed pathways and discuss the mechanism of water traffic along them. A comparison of the exit pathways among different species is made next. We then discuss implications of our finding for the mechanism of CcO, and an unexpected possible connection of our findings to the uncoupling mutations in the D-channel [19].
2. Theory and Methodology
2.1 Internal Cavity Detection and Visualization
The structure of the first two subunits of bovine CcO by Tsukihara et al. [8] (PDB code 1V55, all redox centers reduced), is used for the analysis. The definitions of the internal cavities and the methods for their detection are the same as described previously [15]. In short, we determine the space available for water molecules using hard-sphere model; the radii set for protein atoms is parameterized on the basis of experimentally observed water molecules in the x-ray structures (1V54 and 1V55). After obtaining the coordinates of the centers of cavity-defining spheres, they are visualized by VMD software [20] with MSMS algorithm [21]. (The cavities shown in the figures are reduced slightly in volume for better presentation of internal topology of the cavities.) The external surface of the cavities generated with this scheme are equivalent to the reverse of Connolly surface [22] of internal protein atoms.
2.2 Molecular Dynamics
The reference protein structure is the same as that for internal cavities detection. The partial charges of the redox centers and their surrounding residues are taken from the work of Johansson et al. [23]. The bonding parameters for non-standard residues such as hemes and copper complexes are the same as in our previous work [24]. For other standard residues, the default values from AMBER-03 force field [25] are used. The protonation states of the titratable residues are determined by the electrostatic continuum method [26], and the resulting assignments are the same as in the ref. [24] with the exception of Glu242 being deprotonated (as explained below). Since the R state of BNC is the most relevant state for water exit process, the MD system is modeled as such. Namely, heme a3 and CuB are reduced, and CuA and heme a are oxidized. Glu242 is initially faced “down” in order to comply with the state that is observed in the x-ray structures [8, 9]. In the deprotonated form, Glu242 is stabilized in the “down” conformation, as observed in a recent MD study [16].
For the initial configuration, water molecules observed in the x-ray structure (1V55) are used. The exceptions are for the number of water molecules in certain cavities such as the hydrophobic cavity near the BNC (with four water molecules) and Mg-cavity (with various numbers as explained in the results section). No explicit membrane is incorporated in the MD simulations, but all Cα atoms are restrained by a harmonic potential with force constant of 200 kJ/mol·nm2 (allowing ~3Å of standard deviation in fluctuation) in order to avoid severe deviation from the experimental structure. The exceptions are for the residues that have noticeably different geometry between two redox states (such as Asp50, Asp51, Leu381, and Leu382), the prolines that compose the proposed pathways (Pro130, 131, 228, and 437), and one residue before and after them. Heme Fe and CuB atoms are restrained more strongly (K = 8000 kJ/mol·nm2) in order to retain the core part of the enzyme. The other metals (CuA, Mg2+, Na+) are also restrained (K = 2000 kJ/mol·nm2).
In some simulations, water molecules are “confined” within a certain spherical region in order to keep the system in a consistent designated state. Such a confinement is achieved by a restraint harmonic potential (K = 8000 kJ/mol·nm2) centered at a reference point in space and acting on the oxygen atom of water, and applies only when the deviation from the reference point is larger than certain threshold value. (This restraint is appropriately set so it applies only in rare occasions when the water molecule is close to escaping from a certain compartment in the cavity.)
MD simulations are performed with version 3.3.1 of the GROMACS simulation package [27] (compiled in single-precision mode) with ported ffamber03 force field [28]. The system is solvated with about 16000 TIP3P [29] water molecules. A periodic boundary condition of a rectangular unit cell with initial minimum margin of 5.5Å between the exterior of the protein and the border is applied. The Lennard-Jones interactions smoothly switched off between 8 and 10Å, and Coulomb interactions are calculated using the smooth particle-mesh Ewald method [30, 31] with real-space cutoff of 10Å. Simulations in NPT ensemble are achieved by Nosé-Hoover thermostats [32] at 310K with coupling constants of 1 ps (with separate coupling for the protein and the solvent) and Parrinello-Rahman (isotropic) barostat [33] at 1 bar with coupling constant of 2 ps. Bonds involving hydrogen are constrained with SETTLE [34] and LINCS [35] for the water molecules and the protein respectively. An integration time-step of 2 fs is used. After the hydrogen atoms are attached with GROMACS, 5000 steps of steep-descent energy-minimization are employed; this is followed by series of gradual steps of equilibrations with total of 2 ns; 10 ns of production phase is sampled for each trajectory. The coordinates of the whole system are recorded every 0.5 ps. The MD simulations are used both to trace possible water traffic in the 10 ns time interval, and for the averaging in free energy calculations.
2.3 Potential of Mean Force
The potential of mean force (PMF) W (ξ)along some “reaction coordinate” ξ, is related to the distribution function ρ(ξ) as
| (1) |
where ξ* is an arbitrary reference point. For adequate sampling of water distribution along the pathways, the umbrella sampling method of Taurrie and Valleau [36] is used. We introduce the harmonic biasing potentials of the form
| (2) |
to constrain the probe water molecule near ξi in order to enhance its sampling in that window. For each window potential wi, MD simulations are performed to obtain the biased water distribution. To combine and unbias these distributions, weighted histogram analysis method (WHAM) [37] is employed.
The above method is used to study energy profile along a given section of a putative exit pathway; the coordinate ξ is taken approximately parallel to the direction of a pathway, which is illustrated by the arrows in the corresponding figures (Fig 2a, 4a, and 5a). (The details for each pathway are described in the results section.) Umbrella sampling on each window is done by GROMACS with modifications to allow one-dimensional harmonic potential restraint along any given direction. A window size of Δξ= 0.6 Å and force constant of K = 5600 kJ/mol·nm2 are used for exits-R and T; for exit-P, Δξ = 0.5 Å and K = 8000 kJ/mol·nm2 are used. (The force constants are chosen in such a way that one standard deviation in the distribution overlaps with the center of the adjacent windows under a flat potential surface.) In PMF calculations, the statistics for each window is collected from a 2.5 ns MD trajectory for every time-step (2 fs), which is preceded by 2.5 ns of equilibration. To handle modified GROMACS output files, WHAM is performed by our in-house program.
Fig 2.
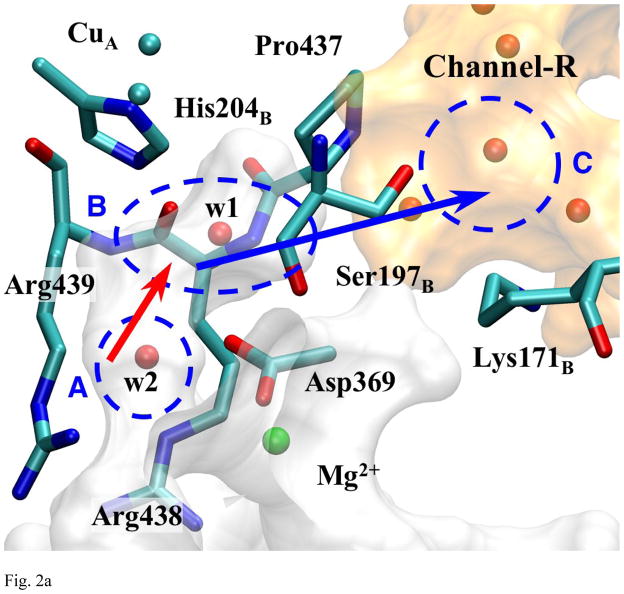
Fig. 2a Detailed View of Pass-R
The residues and the water molecules are shown at the position of the crystal structure (1V55). The blue and red arrows indicate the primary and the secondary bottleneck of this exit pathway respectively.
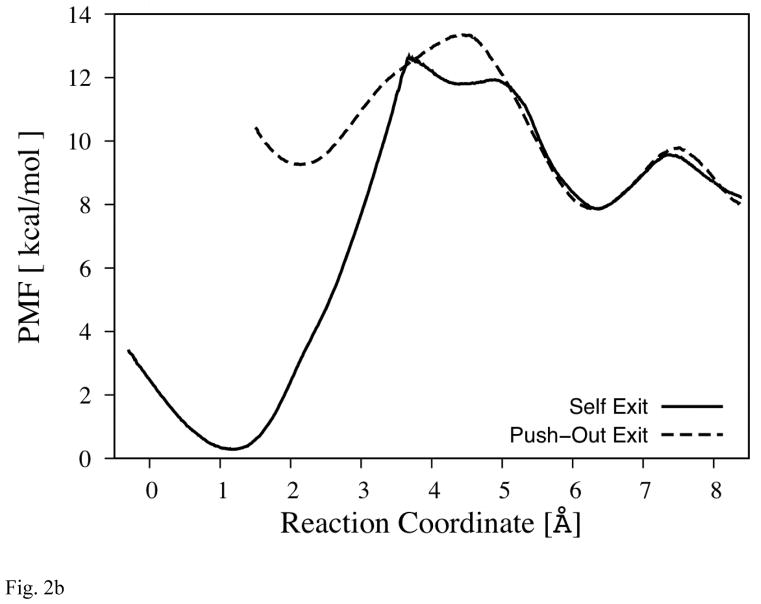
Fig. 2b The PMF of the Primary Bottleneck of Exit-R
The reaction coordinate is illustrated by the blue arrow (between area B and C) in Fig. 2a. (The profiles are set to overlap at the second local minima near 6Å.) Note that the distance between two minima is longer than hydrogen bond distance in both profiles.
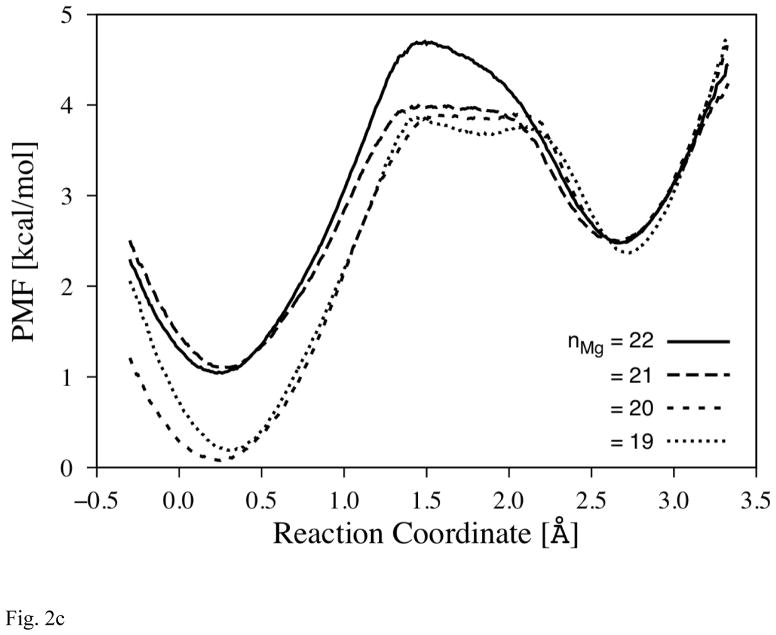
Fig. 2c PMF of the Secondary Bottleneck of Exit-R
The reaction coordinate is illustrated by the red arrow (between area A and B) in Fig. 2a. (The profiles are set to overlap at the second local minima near 2.7Å.) Each profile is differed by the number of water molecules in Mg-cavity (nMg) where 20 is the number found in the crystal structure (1V55).
Fig 4.
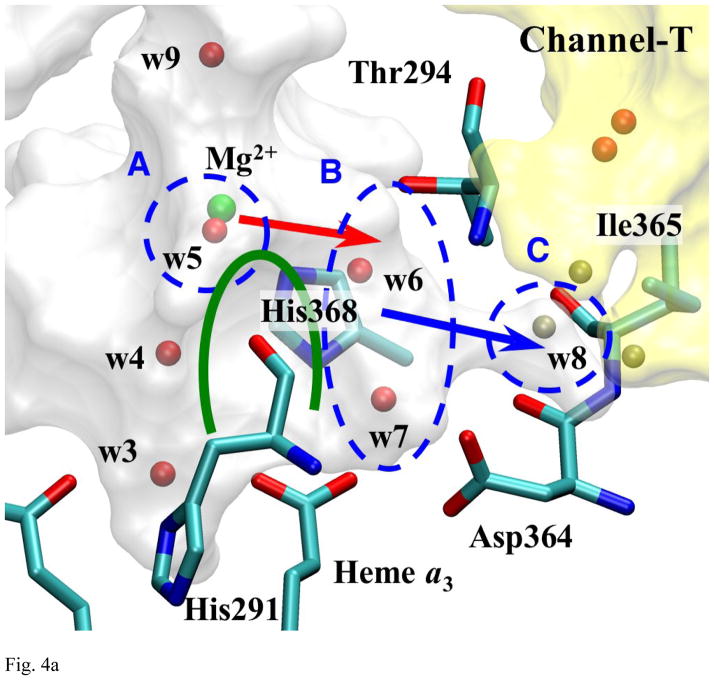
Fig. 4a Detailed View of Pass-T
The green arc indicates the steric barrier created by His291 and His368, which separates w6 and w7 from the rest of water molecules in Mg-cavity. w7 is at hydrogen bond orientation with Asp364, but not with propionate a of heme a3. The pass between area B and C are blocked mainly by Thr294 and Phe293 (not shown). The three spheres near area C show the typical positions occasionally occupied by water molecules in MD simulations (especially when Ile365 isomerizes away from area C).
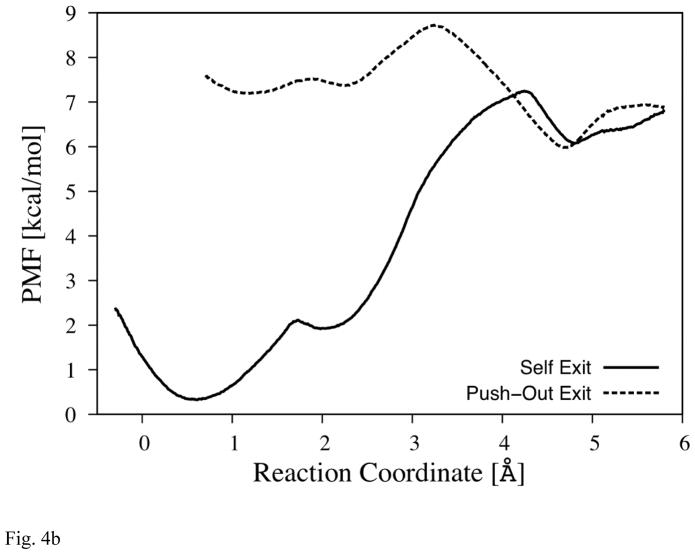
Fig. 4b The PMF of Pass-T
The reaction coordinate is illustrated by the blue arrow (between area B and C) in Fig. 4a. (The profiles are set to overlap at the second local minima near 4.8Å.)
Fig 5.
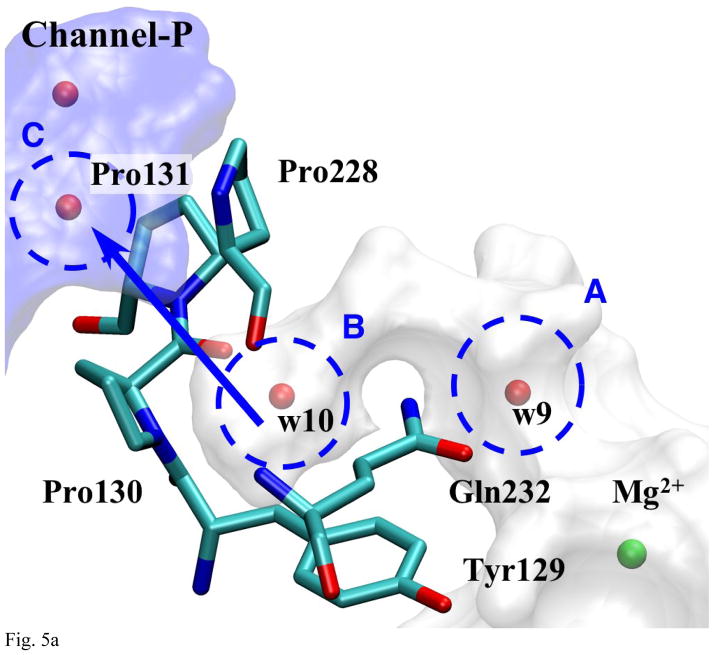
Fig. 5a Detailed View of Pass-P
The bottleneck is created by three prolines (Pro 130, 131, and 228). Area B of this pathway is so small that two water molecules cannot coexist.
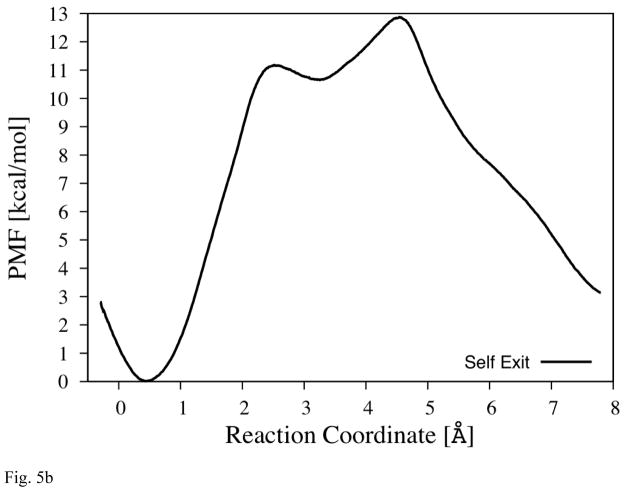
Fig. 5b The PMF of Pass-P
The reaction coordinate is illustrated by the blue arrow (between area B and C) in Fig. 5a.
The transfer rates estimated from the PMFs profiles are obtained by the transition state theory,
| (3) |
where ΔG* is the free energy barrier height obtained from the PMFs and κ is the transmission coefficient which is set to 1.0 (classical upper limit). Since our analysis here is only semi-quantitative, we did not pursue more sophisticated methods [38–42]; in principle, the transmission coefficient which depends on the rate of diffusion along the channel can be obtained more accurately.
3. Results
3.1 Internal Cavities and the Network of Their Connectivities
Although there are programs that are intended to detect and visualize internal cavities in proteins [43, 44], they are not suitable for the description of narrow and intricately-shaped internal cavities of CcO because they are grid-based and use standard radii set (which we find to be too large for CcO). Our own in-house built program [15] instead uses random points and smaller radii set optimized for CcO; with this program we are able to detect virtually all of its internal cavities relevant to the functions of the enzyme.
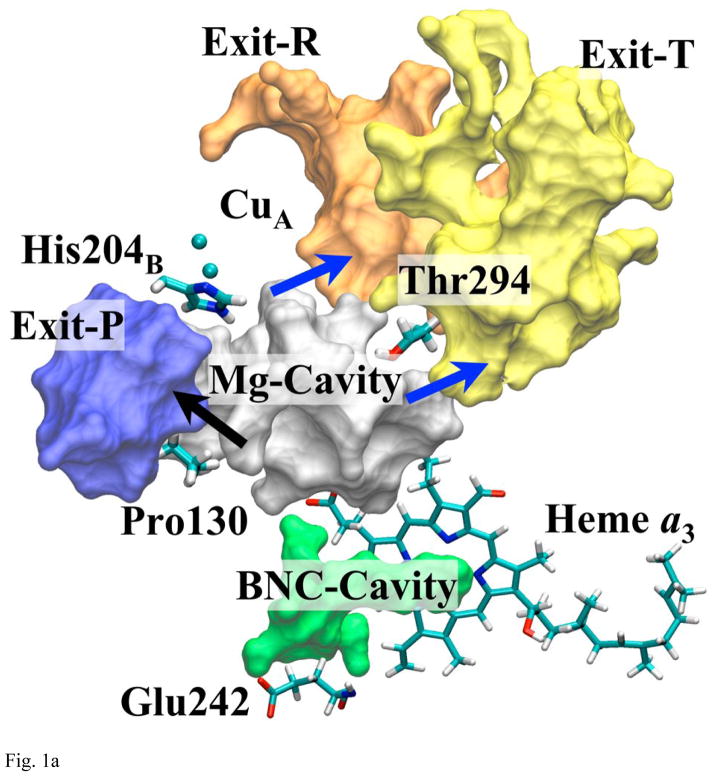
Fig. 1a shows all the internal cavities that are relevant to water exit process. The arrows indicate most likely paths between the cavities suggested by MD and PMF simulations or geometrical analysis. The cavity right above Glu242, shown in green, is the hydrophobic BNC-cavity, which is believed to contain water molecules to form hydrogen bond chains between Glu242 and propionate-d of heme a3 or the BNC [14, 45, 46]. Right above BNC-cavity and heme a3, there is another cavity (shown in silver in Fig. 1a), which contains numerous water molecules that are observed in the x-ray [8, 9]. It also contains a Mg2+ ion ligated by His368, Asp369, Glu198B1, and by three water molecules. This cavity will be called Mg-cavity.
Fig 1.
Fig. 1a Overview of the All Three Putative Exit Pathways
The blue arrows indicate the passes that are found to be plausible under this study. The representative residues on the bottleneck of each pathway are shown. (Arg438 and 439 are right below His204B.)
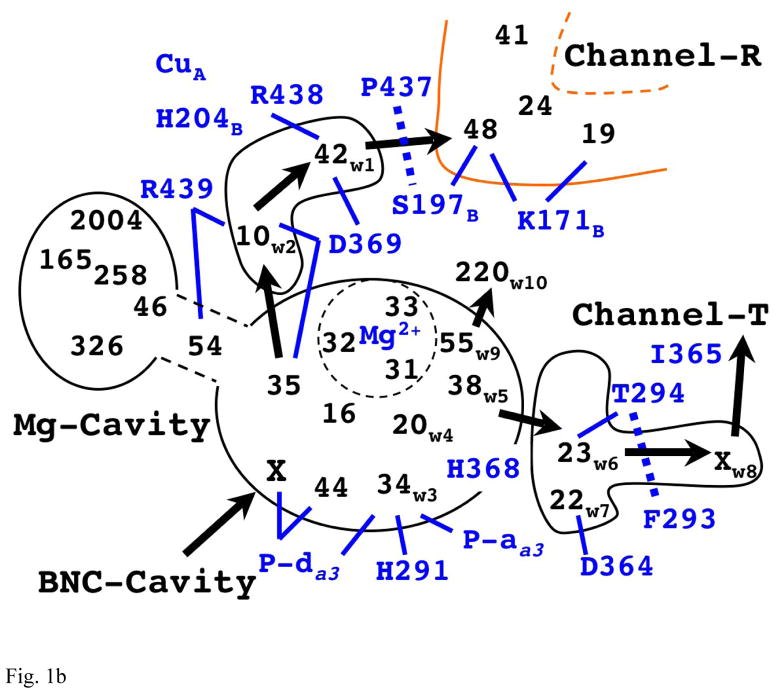
Fig. 1b The Schematics for Organization and Putative Exit Flow of Water Molecules in Mg-Cavity.
The integers indicate the relative position of water molecules in Mg-cavity found in the x-ray structure (1V55). (The number corresponds to their residue index in the original PDB file.) Subscripts in some water molecules show the notation used in explanations in the main text. (X’s indicate the water molecules seen only in MD simulations.) The arrows show the plausible putative directions for water exit pathways. The lines between the protein residues and the water molecules show some of possible hydrogen bond connections. The thick dotted lines indicate the likely bottlenecks in each putative exit pathway. (Note that the number of water molecules in the black contour (excluding the two X’s) adds up to 20 as described in the main text.)
Stemming out from the center of Mg-cavity, there are three branches extending toward three other internal cavities or channels (shown on Fig. 1a). Those cavities are directly accessible from (or have direct exit to) the surface of the enzyme on the P-side and can be considered as possible terminals of water exit pathways. Using the names of the important residues along the respective pathways, they will be called channel-R (after Arg438 and 439), channel-T (after Thr294), and channel-P (after Pro130, 131, and 228) throughout the paper. Similarly, the bottlenecks that connect each branch of Mg-cavity to their nearby external channel will be called pass-R, T, P respectively. (The whole exit pathways from Mg-cavity to the P-side are called exit-R, T, P respectively.)
Although there are many other small internal cavities in the upper half of CcO, the result of networking analysis based on geometry indicates that only those three described above can connect Mg-cavity to the outside without a gap greater than 4.0Å2. Therefore, we will focus our discussion only on the three exit pathways shown in Fig. 1a as exit-R, exit-T, and exit-P. The overall schematics of the exit pathways are shown in Fig. 1b. More details on how each of the pathways is constructed are given below.
3.2 Examining Water Exit Pathways with MD Simulations and Free Energy Calculations
This section presents the analysis of the putative pathways identified in the previous section using MD and free energy calculations.
In order to examine whether water molecules can escape along a given pathway on a short timescale (here 10ns) we performed MD simulations and monitored the behavior of water. (For previous MD studies of water in Mg-cavity, see refs. [47–50]. None of them was long enough, however, to monitor water exit.) In order to check if the exit rate has any dependency on the number of water molecules in Mg-cavity (nMg), we vary it from 19 to 22. (In the crystal structure 1V55, nMg is 20.)
To explore the timescales not accessible to MD simulation (i.e. well beyond 10ns), the free energy profiles are calculated in the region of the bottleneck of each exit path (, the details of which are shown in Fig. 2a, 4a, and 5a).
Exit-R
Fig. 2a shows a detailed picture of pass-R. The schematics of this exit pathway are also shown in Fig. 1b. The branch of Mg-cavity along this pathway is going through space between Arg438 and Arg439. It ends at a small oval pocket (area B in Fig. 2a) near the carbonyl group of Arg438, which can fit at most two water molecules, although only one is observed in the crystal structures. The water molecule in this pocket (w1, Fig. 2a) is also within hydrogen bond distance from Asp369 and a CuA-ligand, His204B (one of the CuA atoms is also only ~6Å away). In order to access this pocket, water molecules in the body of Mg-cavity need to go through a certain route indicated by the red arrow connecting area A to B in Fig. 2a. From their positioning, w1 and w2 can form a hydrogen bond occasionally, but they cannot form a hydrogen bond chain to the water molecules in channel-R except for special occasions, which will be described later. The gap between this pocket and channel-R (area C) is relatively short (~2Å), but it appears to be blocked by Pro437, Ser197B, Asp369, and backbone carbonyl group of Arg438. Right at the end of this bottleneck, there is Lys171B, which has been suggested as one of the steps in a possible proton exit pathway in our previous study [18].
MD simulations suggest that water molecules can escape via this pathway within very short time (several ns) with various nMg. (See Table 1.) For all of the observed exit instances, a water molecule (w2) comes into the oval pocket (area B) and coexists with the frontier water molecule (w1) for at least several hundreds of ps, and then w1 gets pushed out of area B to the entrance of channel-R, which leads to the surface of the protein. This transition between the tip of a branch of Mg-cavity and channel-R is indicated by the blue arrow in Fig. 2a.
Table 1.
Summary of MD results for each water exit pathway and nMg
| nMg | Exit-R | Exit-T | Exit-P |
|---|---|---|---|
| 19 | --- | 1 (8.1ns) | --- |
| 20 | 1 (1.4ns) | 1 (7.8ns) | --- |
| 21 | 1 (4.7ns) | --- | --- |
| 22 | 1 (2.1ns) | 1 (0.5ns) | --- |
The number in each cell shows the number of trajectories (out of four for each nMg) that has observed water exit within 10ns. The time in parenthesis indicates the time (from the beginning of the simulation) when it occurred. The blank cells with a dash indicate no escape is observed.
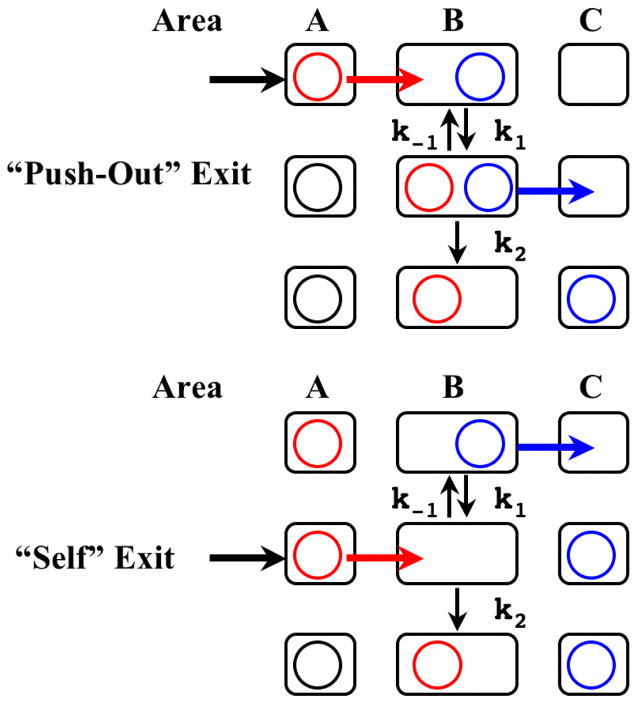
The PMF of the frontier water molecule along this pathway (Fig. 2b) confirms this observation. The results concerning the energy barriers and the estimated rates are summarized in Table 2. The solid line shows the PMF of the probe water molecule (w1) along this pathway when w2 is confined within area A. This mechanism will be called “self exit”. Under self exit mechanism, ΔG*forward is ~12.5 kcal/mol, which corresponds to the transfer rate (expressed as the inverse lifetime) of the order of (100μs)−1. On the other hand, when PMF (dotted line) is taken while w2 stays at area B, ΔG*forward lowers significantly to ~4 kcal/mol (rate of (~100ps)−1). In this mechanism, called the “push-out exit”, the first molecule is pushed out by the second molecule entering the transition compartment B. This change in PMF (thus ΔG*forward) by the presence of w2 in area B suggests that the push-out mechanism is dominant, if not exclusive, form of water exit through pass-R. As will be shown below, a similar mechanism is operating for the second possible exit channel. The mechanisms of escape are shown schematically in Fig. 3
Table 2.
Summary of PMF results
| Descriptions | ΔG*forward | ΔG*backward | ΔG | τforward | τbackward | Sf / Si | |
|---|---|---|---|---|---|---|---|
| Pass-R | (Self) | 12.4 | 4.8 | 7.6 | 80μs | 400ps | 1/ 2×10⁵ |
| (Push-Out) | 4.1 | 5.5 | −1.4 | 100ps | 1ns | 10 | |
| Pass-R (A → B) | nMg = 22 | 3.7 | 2.2 | 1.4 | 60ps | 6ps | 1/10 |
| 21 | 2.9 | 1.5 | 1.4 | 20ps | 2ps | 1/10 | |
| 20 | 3.8 | 1.4 | 2.4 | 80ps | 2ps | 1/50 | |
| 19 | 3.7 | 1.5 | 2.2 | 60ps | 2ps | 1/30 | |
| Pass-T | (Self) | 6.9 | 1.2 | 5.8 | 10ns | 1ps | 1/104 |
| (Push-Out) | 1.5 | 2.7 | −1.2 | 2ps | 10ps | 7 | |
| Pass-P | (Self) | 12.9 | 9.7 | --- | 200μs | --- | --- |
Units of energy are in kcal/mol. The lifetimes that are estimated from transition state theory are shown up to the first significant figure. The dashes indicate that they cannot be determined due to the lack of local minimum at the end.
Fig. 3.
The Schematics for the Two Water Exit Mechanisms Over the Bottlenecks.
The spheres indicate water molecules and the rectangles represent the regions near the bottleneck shown in Fig. 2a, 4a, and 5a. “Push-out” mechanism initiates the exit by the transfer from A to B whereas “self” mechanism starts from the transfer from B to C.
The distinction between the self- and push-out exit mechanisms appears to be important because under the push-out mechanism, a hydrogen bond chain could be transiently formed between water molecules that bridge Mg-cavity and the external channels, while the self-exit mechanism can not have such a chain. Since water w1 does not come within a hydrogen bond distance (~3.4Å) to the water molecules in channel-R when it is not crossing the barrier, as indicated in the PMF and observation of MD trajectories, the only time the water molecules in Mg-cavity can form a hydrogen bond chain to the exit channel-R is when water molecules cross over the barrier (in both directions).
In order to complete characterization of water transport via the push-out mechanism, in Fig. 2c we show the PMF for the second water molecule (w2) that enters the transition compartment B from the preceding area A. In order to check whether nMg can change the overall rate of water exit from Mg-cavity, the PMF is calculated for different nMg (varying from 19 to 22). The results indicate that transfer of w2 occurs on the time-scale of tens of ps, given the barrier in PMF ΔG*forward about 3–4 kcal/mol; thus, it confirms that the push-out mechanism is plausible.
For a quick consistency check, we can now make a rough estimate of the overall exit rate along this pathway using results of PMF calculations and compare it with what is observed in MD simulations. Let the forward and backward rates of the first transition be k1 and k−1 respectively, and the rate of forward reaction of the second transition be called k2, as indicated in Fig. 3, then the overall exit rate k can be estimated as k = k1 k2 /(k−1+ k2) ≈ (k1/ k−1) k2 (because k2 ≪ k−1). If we use the forward rate k2 ~(100ps)−1 and the ratio of k1/k−1 ~ (1/10 − 1/50), the overall rate k is on the order of (10ns)−1. Despite the simplicity of this estimate, it agrees very well with the observation from MD simulations.
Exit-T
At the other end of Mg-cavity, there is a second branch, see Fig. 4a and 1b, which can be described as half-arc (shown in green in Fig. 4a) that begins at the water molecule (w3), which is located in between the two propionates of heme a3. The arc goes over His291 and His368, via water molecules w4 through w7, and ends at a small pocket (area B) near propionate-a of heme a3 and Asp364. The two water molecules in that terminal pocket (w6 and w7) are separated from other water molecules in Mg-cavity by the wall of the cavity along this arc (mainly formed by His291 and His368), and do not form hydrogen bonds (except for between w5 and w6 in rare occasions) or exchange positions with them according to the observation of MD trajectories.
This branch has a further “stick-out” that is going through a gate made by Thr294 and Phe293, and extending toward channel-T. A water molecule (w8) can occupy the position at the tip of this stick-out (area C), but it oscillates between there and the border of channel-T frequently, which explains why it is invisible in the x-ray structures. Although this water molecules is usually not within hydrogen-bonding distance with w6, occasionally it can come down to area B and stay there for a while with w6 (up to hundreds of ps) before it gets bounced back to area C. The border between area C and channel-T is blocked mainly by Ile365, but the frequent exchange of water molecules between them indicates its energy barrier is lower than one between area B and C. Therefore, the actual bottleneck of water exit through this branch lies on the path through this stick-out.
MD results in Table 1 show that this pathway also can be used for water exit with various nMg. For all of the observed exit instances, a water molecule from the body of Mg-cavity (w5 in area A) comes over to the pocket (area B) which contains the frontier water molecule (w6), and then eventually pushes it out, similar to the mechanism described for exit-R.
Fig. 4b shows the result of PMF analysis. The scheme and the results are very similar to those for exit-R. The solid line indicates the PMF of “self” exit (moving w6 from B to C while confining w5 within A), and the dotted line indicates the PMF of “push-out” exit (confining w5 in area B while moving w6). As in exit-R, the self-exit mechanism has higher barrier (~7kcal/mol) than that of the push-out mechanism (~1.5kcal/mol), although the estimated rate in the former mechanism is of the order of (10ns) −1 and does not seem to be as prohibitive as the one in exit-R. However, since ΔG*backward is low (~1 kcal/mol), the frontier water molecule (w6) most likely need to make many attempts until w5 comes over to fill the space and complete the evacuation, which would make the effective exit rate much slower than (10ns) −1. Estimated from MD simulations, the push-out mechanism again is dominant in exit-T, although may not be as much as in exit-R.
Exit-P
The third branch (Fig. 5a, also shown as the arrow between water w9 and w10 in Fig. 1b) is stemming out from the position near the Mg2+ ion and reaches out to a water molecule (w9) before it makes a hook-like arc that ends at a small pocket (area B), which contains a water molecule (w10). (Both water molecules are observable in the x-ray structures.) This pocket appears to be isolated from the rest of Mg-cavity, but our MD simulations suggest that, when it is empty, w9 can come over to occupy it, although no exchange is observed when it is filled already. Thus, despite of its remoteness, this small pocket can be considered as a part of Mg-cavity. This pocket is about 3Å away from channel-P through pass-P, which is blocked mainly by three prolines (130, 131, and 228).
In MD simulations, we did not observe any escape of water molecules from exit-P as shown in Table 1. In order to check further whether this is because MD simulations are not long enough to capture the escape or this really means there is no water exit through this pathway at a meaningful rate, we calculate PMF along this pathway; the results are shown in Fig. 5b. For this pathway, only the “self” exit mechanism is analyzed because the pocket for exit-P (area B) is so small that only one water molecule can exist at a time in it. Another reason is due to the hook-like shape of the connection between area A and B, which inhibits another water molecule (w9) from approaching the pocket while the frontier water molecule (w10) is still in area B. The results from Fig. 5b shows that ΔG†forward is ~13kcal/mol and estimated rate is of the order of (100μs)−1, which is much slower than that of exit-R and T (through “push-out” mechanism) and within an order of magnitude to the rate of water generation ((~1 ms) −1). Therefore, we conclude that this pathway is most likely not used for water escape.
3.3 Comparisons Among Different Species
We have examined next whether the pathways we obtained are conserved among different species; for that we have analyzed internal cavities in CcO from Paracoccus denitrificans (PDB code = 1AR1) [51], Rhodobacter sphaeroides (PDB code = 2GSM) [9], and also ba3-type cytochrome c oxidase of Thermus thermophilus (PDB code = 1XME) [52]. For the first two bacterial species, the interfaces between Mg-cavity and each external channel (R, T and P) turn out to be qualitatively equivalent. Nevertheless, channel-R for the two bacterial enzymes is shorter than mammalian one. (More detailed differences will be discussed in the next section.) For exit-T, a noticeable difference in the bacteria is that arginine is in place for Ile365, which is located at the border of Mg-cavity and channel-T.
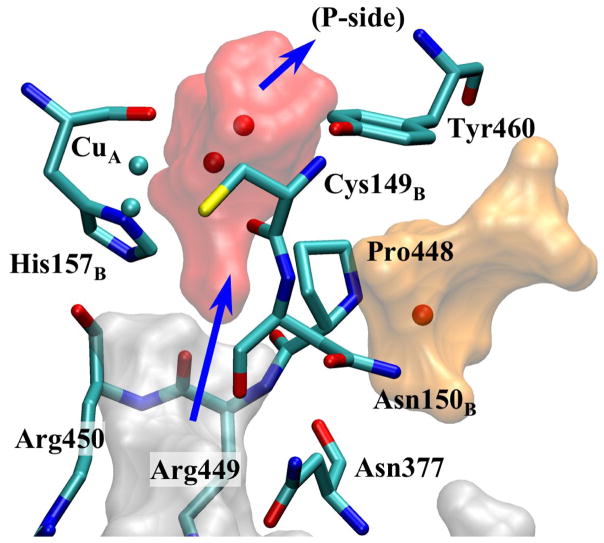
Unlike the other two bacterial species, ba3-type CcO of Thermus thermophilus exhibits a striking difference in both of the plausible pathways. As can been seen in Fig. 7, exit-R continues up to the region near water w1 (in Fig. 2a), and some of its key surrounding residues (His204B, Pro437, Arg438 and Arg439) are conserved; however, for this enzyme, the pathway toward Lys171B is strongly disrupted. (There is even no Lys171B homologue.) Instead, it has a pass toward a different external channel (with two structural water molecules) that lies “above” His204B, which has much shorter path to the outside than channel-R of the other species. From its topological resemblance, this pathway is probably used as exit-R for this specie. Even more surprisingly, exit-T in ba3 oxidase is also strongly disrupted, but without any alternative exit route. Although it requires further verifications with MD simulations and PMF calculations, it is likely that there is no exit-T for this enzyme.
Fig. 7.
Alternative Exit-R for ba3 Oxidase of Thermus thermophilus
The pathway toward the region where Lys171B is located (shown in orange) for mitochondrial CcO is disrupted. Alternatively, there is another small channel (with two structural water molecules) “above” His157B (shown in red) that leads to the outside. This external channel is enclosed also by Gln158B, Asn159B, Met160B, Phe161B, and Val456 (not shown). Note that Tyr460 is equivalent to Tyr447 of eukaryotes (in channel-R).
It appears at least some parts of channel-R are well conserved. We therefore proceed to describe channel-R in greater detail for different species: mitochondiral CcO (1V55), Rhodobacter sphaeroides (2GSM) and Paracoccus denitrifcans (3EHB).
Channel-R of Mitochondrial CcO
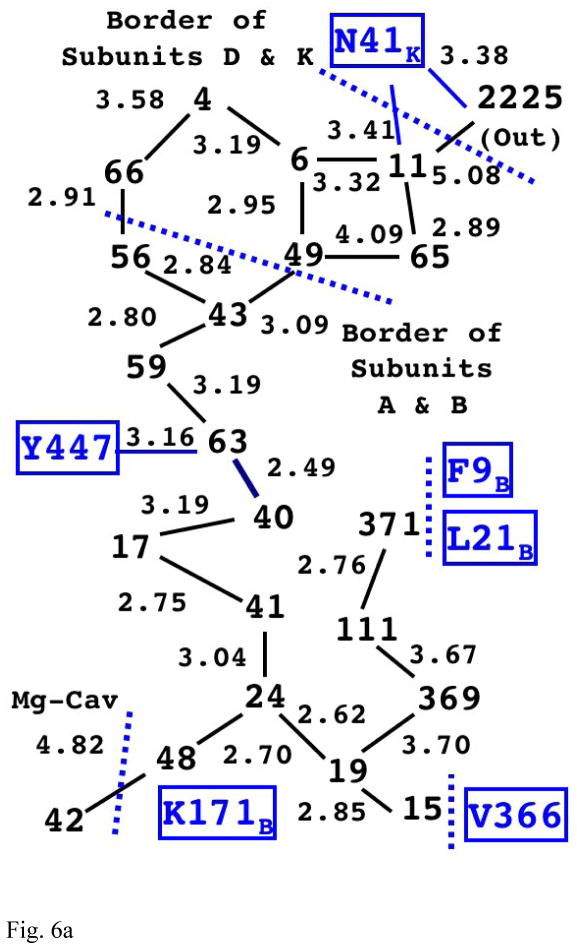
The structure of internal water molecules in channel-R of bovine enzyme is schematically shown in Fig. 6a. The integers represent the water molecules with corresponding residue index number found in the original PDB file. The links between them show their connectivities with distance (in Å) shown on the side. The channel starts at the water molecule closest to Mg-cavity (48) and the pathway branches at the next water molecule (24) into three directions to the outside, which are suggested by the structural water molecules as well as the geometrical internal cavities. As can been seen from the diagram (and also from Fig. S1 in Supplementary Information), the structural water molecules form complete single-file hydrogen bond chains (up to some point) toward the outside, which suggests existence of specific routes for transfer of water (and possibly of protons) even within channel-R.
Fig 6.
Fig. 6a The Structure of Internal Water Molecules in Channel-R of Mitochondrial CcO (1V55)
The integers represent the water molecules observed in the x-ray structure (with the value indicating their residue index number in the original PDB file). The lines between them show the possible hydrogen bond links between them with the distance (in Å) shown on the side. Note that there is a complete chain of hydrogen bonding (with gaps less than 3.4Å) from water 48 all the way up to water 11. (Also see Fig. S1 in Supplementary Information for actual positioning of the water molecules with the cavity.)
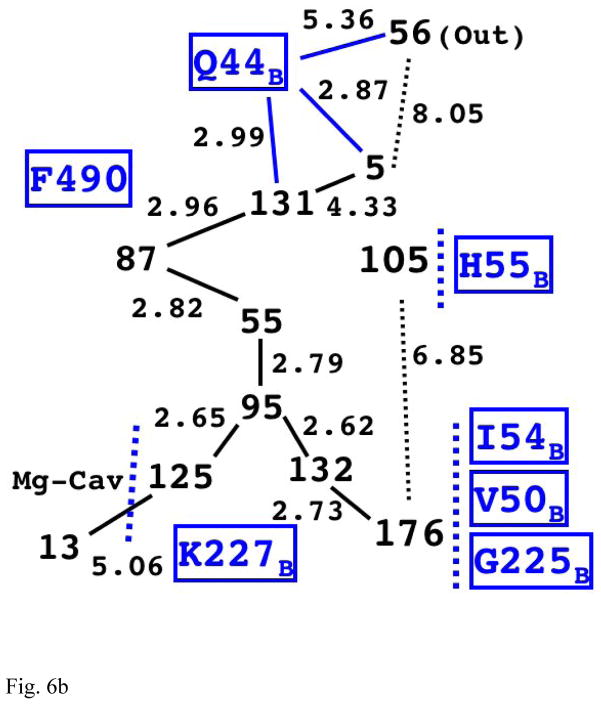
Fig. 6b The Structure of Internal Water Molecules in Channel-R for CcO of Rhodobacter sphaeroides (2GSM)
The first four water molecules on the longest chain (125, 95, 55, and 87) are structurally very similar to the corresponding chain in the eukaryotic enzyme (Fig. 6a).
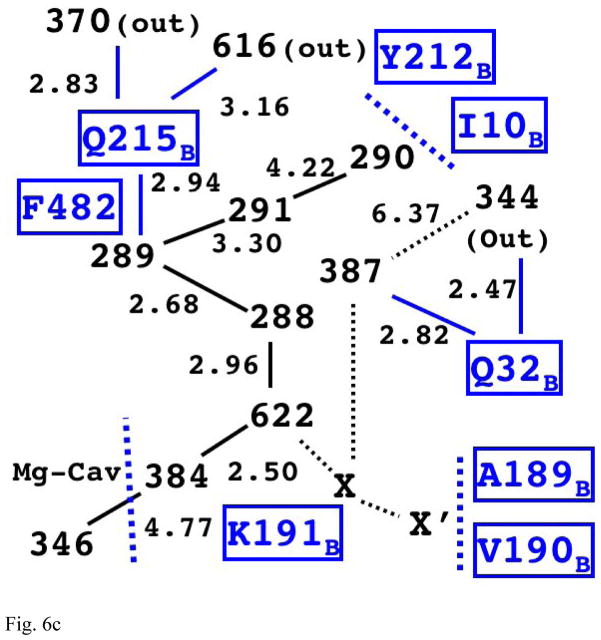
Fig. 6c The Structure of Internal Water Molecules in Channel-R for CcO of Paracoccus denitrificans (3EHB, N131D mutant)
The relative positions of water molecules on the main chain is equivalent to the one in Rhodobacter sphaeroides; however, it appears to have a different possible exit for proton via Q215B.
Among the three paths, the longest one is the most noteworthy because the relative position of the first four water molecules on it appears to be conserved among the three species. (See Table S1 in Supplementary Information for more detailed information.) Along this path (or any paths in channel-R), there is no side chain of titratable residues facing toward the water molecules except for Lys171B (in all three species) and Tyr447 (only in eukaryote). Interestingly, the water molecules near Tyr447 (40 and 63) are only 2.49Å apart, which indicate possible presence of an excess proton shared between them as expected in the D-channel of Rhodobacter sphaeroides [53]. Since the bacterial species (with shorter path) do not have this Tyr-water complex (they have phenyl alanine instead), it might be serving an important function in either proton pumping or backflow blocking required for this longer pathway of the mammalian enzyme, and would be an interesting site for mutagenesis study to verify its role as well as the plausibility of channel-R as a proton exit pathway. This long chain of water continues up to a compartment with eight observable water molecules enclosed by the two main subunits and subunits D and K. (Subunit K is a small (54 residues) subunit found only in mitochondrial CcO which appears eleventh in 1V55; the role of this subunit is still unknown.) Structurally, most probable way to the outside is through water 11 toward the external water 2225 where Asn41K is placed in between.
Between the remaining paths, the shortest one leads to Val366 and the other one leads to Leu21B and Phe9B. Those residues are separating channel-R from the outside, but MD simulation shows the water molecules can escape through them (regardless of the occurrence of water exit through pass-R). However, these holes may be covered by the membrane if its position is at where it provides consistent interpretations of an experiment [15, 54]; thus, plausibility of their use for water or proton exit depends on the actual membrane position, which is yet to be determined.
Channel-R of Bacterial CcO’s3
Channel-R of Rhodobacter sphaeroides (2GSM) [9] is similarly shaped to the eukaryotic one except that the length of the longest path is much shorter. Fig. 6b shows the relative position of the observed water molecules in channel-R of this species. It also has three branches, and the longest one leads to water 5 before it gets to external water 56 with Gln44B in between. (It may require a mobile water molecule or two in between to conduct protons.) The shortest path leads to a dead end, which is blocked by many residues including Ile54B, Val50B, and Gly225B. Although the intermediate water molecules are not resolved in this structure, geometrical cavity shows the third path, which leads to His55B. Since the width of the bacterial membrane is thinner than mitochondrial one [55–57], there is a higher chance of water escaping from this route.
For Paracoccus denitrificans, we used N131D mutant structure (3EHB) [58] for the analysis because there is no native one with water molecules. (Because the conformations of most residues are almost equivalent between the wildtype and the mutant, this structure should have very close water organization of channel-R as the wildtype.) This species also has the first four water molecules on the longest path (384, 622, 288, 289 as shown in Fig. 6c) in conserved relative position as the other species and two more water molecules (291 and 290) in equivalent relative positions as Rhodobacter sphaeroides. Despite the structurally equivalence to Rhodobacter sphaeroides, the longest path appears to have a different exit route, which is from the fourth water molecule (289) toward external water molecules (370 or 616) through Gln215B. Its shortest path also appears to be blocked by many residues including Ala189B and Val190B. The third path is also similar to the other two species, and leads to a water molecule (387) nearby Gln32B.
Besides Tyr447 of bovine, mutagenesis studies on the residues at the end of the water chains in channel-R such as Asn41K of bovine, Gln44B and His55B of Rhodobacter sphaeroides, Gln 215B and 32B of Paracoccus denitrificans would be interesting because it may be able to elucidate each path’s plausibility as proton exit.
4. Discussion
We have identified two exit pathways, R and T, by which water molecules produced in the catalytic cavity of CcO can escape the enzyme. These pathways are remarkably conserved in their key features across a diverse range of species. Each exit path has a bottleneck, or “pass”, at the position where Mg-cavity is connected to the exit channels, which lead directly to the surface of the protein. Each bottleneck has a well-defined structural organization that suggests specific mutational probes. We find that the passage of water molecules through these bottlenecks occurs by a special cooperative mechanism, in which a frontier molecule at the transition compartment gets a “push” by another water molecule from behind, which allows formation of a transient hydrogen-bond chain between the inside of Mg-cavity and the external channel. From our MD and PMF simulations, the rate of water transfer in the forward direction is approximately (10ns) −1. The backward rate was not estimated directly in our calculations, but is likely to be comparable to the forward rate due to the thermal equilibrium water occupation of the Mg-cavity, which is indicated from lack of dramatic change in exit rate upon the change of nMg.
Proton transfer inside of the protein requires a path of hydrogen bonds. Our results indicate that the water pathways presented here are also likely places where a chain of hydrogen bonds can be formed that could connect the Mg-cavity and “outside”, which makes them strong candidates for proton exit pathways. Although other possibilities cannot be excluded, it is worthwhile to discuss the implications of these water pathways being also proton exits to the mechanism of proton pumping in CcO.
4.1 Regulation of Proton Backflows
For a proper function of CcO, it is crucial to prevent the backflow of protons from the P-side to Mg-cavity, where the so-called proton loading site (PLS) is most likely located; it was suggested that PLS is His291 [26], or propionates of heme a3 [59], or a group nearby [15].
According to present analysis, a critical residue that is located near the bottleneck of exit-R that can block proton entrance from outside would be Lys171B. It is interesting that this residue was also singled out previously on the basis of completely different type of analysis [18]. For exit-T, Ile365 appears to be capable of preventing the formation of a hydrogen bond chain from the outside to Mg-cavity. In the bacterial species the residue at this position is arginine, so its positive charge may serve the same function as that of Lys171B. Mutations of Thr294 in exit-T was reported to disable the pumping [60]. This residue appears to hold a water molecule (w6, in Fig. 4a) in position that prohibits formation of hydrogen bond with the water molecules in Mg-cavity, which would be needed for a proton to leak back through this path. This data suggests that Thr294 could also be a part of putative proton backflow blockage.
Mutation of Lys171B, Ile365 (or homologous arginine in the bacteria), and Thr294 that can interfere with the flow of protons according to our model appear to be interesting to probe further experimentally.
4.2 Proton Pumping Beyond Mg2+ Region?
The apparent difference in the rates (by an order of magnitude) of proton exit in different phases of the cycle [61] could lead to a possibility that the exit of pumped protons may be somehow regulated, or even occurs via a secondary pumping step [11]. It is interesting to consider our results in the context of these ideas.
A particular section of exit-R (w1 and w2 in Fig. 2a) is running rather closely to CuA center, and its ligands His204B and Glu198B. This raises a possibility of electrostatic coupling of redox state of CuA to the passage of protons along channel-R in this section. In principle, it is possible that this part of the protein is receiving the pumped proton from the PLS upon the reduction of CuA and releasing them upon the oxidation of CuA. The involvement of CuA and Glu198B in proton exit was indeed suggested by a recent EPR study [62]. Lys171B, which is suggested as one of the steps in proton exit pathway in our previous study [18] also might be mediating this proton transfer. Tyr447 in mitochondrial enzyme could be another possible element for such process. A somewhat similar model was recently discussed by Sharpe et al. [62, 63].
4.3 Implications from ba3 Oxidase
We have already mentioned that ba3 oxidase of Thermus thermophilus has an altered version of exit-R. Since this exit is in proximity to CuA site, the possible involvement of CuA and His204B in mediating the exiting protons is expected to be more pronounced here than in aa3 oxidases. Also Tyr460 in Fig. 7, which is equivalent to the Tyr447 in the eukaryotic enzyme but facing towards different orientation, is within hydrogen bond distance of one of the structural water molecules in the alternative channel-R, and may play some role in proton exit or proton backflow blockage. Therefore, it is also a promising target for experimental verifications.
4.4 Uncoupling Mutations in the D-channel May Produce Allosteric Perturbations in the Proton Exit Channel That Disrupt the Proton Blockade from the P-side
Some mutations of the residues near the entrance of the D-channel are known to selectively disable the enzyme’s pumping function while retaining its oxidization capability [19, 58, 64–66]. The most notable example of this kind of mutation is N98D [19], which not only uncouples the pumping but also enhances the turnover rate. Although many hypotheses to explain this phenomenon have already been proposed [17, 58, 59, 65, 67–69], the consensus is still far from being reached. Here we discuss one additional possibility that connects mutations in the D-channel to the putative proton exit channels suggested by the present study.
The new possibility is that the mutations can compromise the proton blockade from the P-side and allow an unregulated proton leak into Mg-cavity. As we mentioned in the introduction, a leaked proton in Mg-cavity can occupy the PLS before the pumped proton from the D-channel, which effectively skips the pumping step; thus, it not only blocks the pumping but also can enhance the rate of turnover because the time needed for the pumping protons is saved in this model.
The question is how a remote perturbation induced by the mutation of Asn98 can propagate in the enzyme, given that the electrostatic effects appear to be insignificant? The mutation site is more than 20Å away from any of the three pathways we have mentioned, yet there is a possible allosteric connection. We notice that the mutation should induce instability between helices II and III, which are held together on one end (near the entrance of the D-channel) by Asn80 and Asn98 respectively. As can be seen in the x-ray structures, especially of the bovine enzyme [8], the amide groups of two Asn residues form a staggering double hydrogen bond pair, which stabilizes the helices; this stabilizing interaction can be weakened by the mutation.
The destabilization between the two helices induced by the mutation could cause instability at the other end (near the P-side) of the helices, where the shift of residues composing our exit-P (Pro130 and Pro131) could lead to proton-leakage through this pathway to Mg-cavity. This proton leakage can result in protonation of PLS by a proton from the “wrong” P-side of the membrane, which would disrupt the pumping. Even though the destabilization of the interaction between Asn98 and Asn80 could be a minor one (as suggested from little structural differences on those two residues observed in the recent x-ray structure of N98D mutant of Paracoccus denitrificans [58]), the effect on the other end could be larger because those asparagines are at the “hinge” of these two helices. As a matter of fact, there are apparent distortions in Gly153 and Gly154 (in Paracoccus denitrificans numbering where Pro168 and Pro169 are two of the three prolines on pass-P), which indicates some strains on this region. The proposed leakage of Mg-cavity induced by mutation on the “other end” of the enzyme can be also subtle and be revealed only by more extensive computational dynamics studies.
This hypothesis can also help to rationalize the results of other mutations near the entrance of the D-channel. For example, another uncoupling mutant, N163D [66] would destabilize interaction between Asn163(on helix IV)’s side chain and Phe94 (on helix III)’s backbone carbonyl group. The restoration of the pumping function by double mutation of D91N/N98D [70] could be also explained by formation of extra interaction betweens Asn91 (on helix III) and Thr10(on helix I, which overlaps with helix II)’s backbone carboxyl group and Asn11(also on helix I)’s side chain. The results from different mutations on Asn98 [58] also appear to be in accordance with this hypothesis.
5 Conclusions
The cavity containing the Mg2+ ion in CcO is connected to the outside (the P-side) only through two well-defined pathways, which are likely to serve for both water and proton exit. One of them (exit-R) is going through Arg438/439 toward His204B, a CuA ligand, and Lys171B, and the other (exit-T) is going toward Asp364 and Thr294. Each exit pathway has a well defined bottleneck, which invites a mutational study.
A chain of hydrogen bonds between the water molecules in Mg-cavity and the “outside” can be formed only transiently when water molecules cross the bottleneck of a given pathway; this occurs via a special mechanism in which one water molecule in the transition compartment gets a “push” through a barrier by another water molecule incoming from Mg-cavity. The lack of permanent connectivity supports the notion that Mg-cavity is “inside” of CcO.
Lys171B/Tyr447 and Thr294/Ile365 (and corresponding arginines for bacteria) are potential elements for proton backflow blockage for exit-R and T respectively. Mutation of these residues would be meaningful to verify their possible roles as well as the plausibility of respective exit pathway.
The proximity of the bottleneck of the proposed water and proton exit-R indicates the possible involvement of CuA and/or its ligands (such as His204B and Glu198B) in redox-coupled proton pumping beyond the Mg2+ region.
The described pathways are well conserved for aa3-type CcO among different species except for certain detail in the structure of channel-R. For ba3-type CcO of Thermus thermophilus, exit-R is altered and exit-T is strongly disrupted. Its Tyr460 (homologous to Tyr447 of eukaryote) is also another prospective site for mutation.
Supplementary Material
Acknowledgments
This work was supported by grants from NSF grant PHY 0646273, and NIH GM054052 to AAS. Some of computational resource used in this research was generously donated privately by Tomohiro Kadota. The authors are grateful to T. W. Allen and his group members for assistance with PMF calculation and WHAM analysis. Lastly, we would like to thank our colleagues, especially D. M. Popović for their support and discussion at various stages of the research.
Footnotes
Subscript B is used to indicate the residue number on the subunit B (or II). The residues on the other subunits are indicated in the same manner, except for the residues of the subunit A (or I), which are listed without subscripts.
There is one additional pathway identifiable on the basis of the distances between the cavity walls, which is passing near Arg439; however, due to strongly negative MD and PMF probes (barrier greater than 20 kcal/mol), we will disregard it in this study without further analysis and discussion.
In this section, the residue numbering refers to those of corresponding species.
Publisher's Disclaimer: This is a PDF file of an unedited manuscript that has been accepted for publication. As a service to our customers we are providing this early version of the manuscript. The manuscript will undergo copyediting, typesetting, and review of the resulting proof before it is published in its final citable form. Please note that during the production process errors may be discovered which could affect the content, and all legal disclaimers that apply to the journal pertain.
References
- 1.Wikström M. Proton pump coupled to cytochrome c oxidase in mitochondria. Nature. 1977;266:271–273. doi: 10.1038/266271a0. [DOI] [PubMed] [Google Scholar]
- 2.Babcock GT, Wikström M. Oxygen activation and the conservation of energy in cell respiration. Nature. 1992;356:301–308. doi: 10.1038/356301a0. [DOI] [PubMed] [Google Scholar]
- 3.Ferguson-Miller S, Babcock GT. Heme/copper terminal oxidases. Chem Rev. 1996;96:2889–2907. doi: 10.1021/cr950051s. [DOI] [PubMed] [Google Scholar]
- 4.Gennis RB. How does cytochrome oxidase pump protons? Proc Natl Acad Sci USA. 1998;95:12747–12749. doi: 10.1073/pnas.95.22.12747. [DOI] [PMC free article] [PubMed] [Google Scholar]
- 5.Michel H, Behr J, Harrenga A, Kannt A. Cytochrome c oxidase: Structure and spectroscopy. Annu Rev Biophys Biomol Struct. 1998;27 doi: 10.1146/annurev.biophys.27.1.329. [DOI] [PubMed] [Google Scholar]
- 6.Wikström M. Proton translocation by bacteriorhodopsin and heme-copper oxidases. Curr Opin Struct Biol. 1998;8:480–488. doi: 10.1016/s0959-440x(98)80127-9. [DOI] [PubMed] [Google Scholar]
- 7.Schmidt B, McCracken J, Ferguson-Miller S. A discrete water exit pathway in the membrane protein cytochrome c oxidase. Proc Natl Acad Sci USA. 2003;100:15539–15542. doi: 10.1073/pnas.2633243100. [DOI] [PMC free article] [PubMed] [Google Scholar]
- 8.Tsukihara T, Shimokata K, Katayama Y, Shimada H, Muramoto K, Aoyama H, Mochizuki M, Shinzawa-Itoh K, Yamashita E, Yao M, Ishimura Y, Yoshikawa S. The low-spin heme of cytochrome c oxidase as the driving element of the proton-pumping process. Proc Natl Acad Sci USA. 2003;100:15304–15309. doi: 10.1073/pnas.2635097100. [DOI] [PMC free article] [PubMed] [Google Scholar]
- 9.Qin L, Hiser C, Mulichak A, Garavito RM, Ferguson-Miller S. Identification of conserved lipid/detergent-binding sites in a high-resolution structure of the membrane protein cytochrome c oxidase. Proc Natl Acad Sci USA. 2006;103:16117–16122. doi: 10.1073/pnas.0606149103. [DOI] [PMC free article] [PubMed] [Google Scholar]
- 10.Mills DA, Florens L, Hiser C, Qian J, Ferguson-Miller S. Where is ‘outside’ in cytochrome c oxidase and how and when do protons get there? Biochim Biophys Acta. 1999;1458:180–187. doi: 10.1016/s0005-2728(00)00067-0. [DOI] [PubMed] [Google Scholar]
- 11.Michel H. The mechanism of proton pumping by cytochrome c oxidase. Proc Natl Acad Sci USA. 1998;95:12819–12824. doi: 10.1073/pnas.95.22.12819. [DOI] [PMC free article] [PubMed] [Google Scholar]
- 12.Iwata S, Ostermeier C, Ludwig B, Michel H. Structure at 2.8Å resolution of cytochrome c oxidase from Paracoccus denitrificans. Nature. 1995;376:1995. doi: 10.1038/376660a0. [DOI] [PubMed] [Google Scholar]
- 13.Verkhovsky MI, Jasaitis A, Verkhovskaya ML, Morgan JE, Wikstrom M. Proton translocation by cytochrome c oxidase. Nature. 1999;400:480–483. doi: 10.1038/22813. [DOI] [PubMed] [Google Scholar]
- 14.Hofacker I, Schulten K. Oxygen and proton pathways in cytochrome c oxidase. Proteins. 1998;30:100–107. [PubMed] [Google Scholar]
- 15.Sugitani R, Medvedev ES, Stuchebrukhov AA. Theoretical and computational analysis of the membrane potential generated by cytochrome c oxidase upon single electron injection into the enzyme. Biochim Biophys Acta. 2008;1777:1129–1139. doi: 10.1016/j.bbabio.2008.05.006. [DOI] [PMC free article] [PubMed] [Google Scholar]
- 16.Kaila VRI, Verkhovsky MI, Hummer G, Wikstrom M. Glutamic acid 242 is a valve in the proton pump of cytochrome c oxidase. Proc Natl Acad Sci USA. 2008;105:6255–6259. doi: 10.1073/pnas.0800770105. [DOI] [PMC free article] [PubMed] [Google Scholar]
- 17.Fadda E, Yu CH, Pomés R. Electrostatic control of proton pumping in cytochrome c oxidase. Biochim Biophys Acta. 2008;1777:277–284. doi: 10.1016/j.bbabio.2007.11.010. [DOI] [PubMed] [Google Scholar]
- 18.Popovic DM, Stuchebrukhov AA. Proton exit channels in bovine cytochrome c oxidase. J Phys Chem B. 2005;109:1999–2006. doi: 10.1021/jp0464371. [DOI] [PubMed] [Google Scholar]
- 19.Pawate AS, Morgan J, Namaslauer A, Mills D, Brzezinski P, Ferguson-Miller S, Gennis RB. A mutation in subunit I of cytochrome oxidase from Rhodobacter sphaeroides results in an increase in steady-state activity but completely eliminates proton pumping. Biochemistry. 2002;41:13417–13423. doi: 10.1021/bi026582+. [DOI] [PubMed] [Google Scholar]
- 20.Humphrey W, Dalke A, Schulten K. VMD - Visual Molecular Dynamics. J Mol Graph. 1996;14:33–38. doi: 10.1016/0263-7855(96)00018-5. [DOI] [PubMed] [Google Scholar]
- 21.Sanner MF, Olson AJ, Sphener J-C. Proc. 11th Annu. ACM Sympos. Comput. Geom; 1995. pp. C6–C7. [Google Scholar]
- 22.Connolly ML. Solvent-accessible surfaces of proteins and nucleic acids. Science. 1983;221:709–713. doi: 10.1126/science.6879170. [DOI] [PubMed] [Google Scholar]
- 23.Johansson MP, Kaila VRI, Laakkonen L. Charge parameterization of the metal centers in cytochrome c oxidase. J Comput Chem. 2008;29:753–767. doi: 10.1002/jcc.20835. [DOI] [PubMed] [Google Scholar]
- 24.Tashiro M, Stuchebrukhov AA. Thermodynamic properties of internal water molecules in the hydrophobic cavity around the catalytic center of cytochrome c oxidase. J Phys Chem B. 2005;109:1015–1022. doi: 10.1021/jp0462456. [DOI] [PubMed] [Google Scholar]
- 25.Duan Y, Wu C, Chowdhury S, Lee MC, Xiong G, Zhang W, Yang R, Cieplak P, Luo R, Lee T, Caldwell J, Wang J, Kollman P. A point-charge force field for molecular mechanics simulations of proteins based on condensed-phase quantum mechanical calculations. J Comput Chem. 2003;24:1999–2012. doi: 10.1002/jcc.10349. [DOI] [PubMed] [Google Scholar]
- 26.Popovic DM, Stuchebrukhov AA. Electrostatic study of the proton pumping mechanism in cytochrome c oxidase. J Am Chem Soc. 2004;126:1858–1871. doi: 10.1021/ja038267w. [DOI] [PubMed] [Google Scholar]
- 27.Lindahl E, Hess B, Spoel Dvd. GROMACS 3.0: A package for molecular simulation and trajectory analysis. J Mol Model. 2001;7:306–317. [Google Scholar]
- 28.Sorin EJ, Pande VS. Empirical force-field assessment: The interplay between backbone torsions and noncovalent term scaling. J Comput Chem. 2005;26:682–690. doi: 10.1002/jcc.20208. [DOI] [PubMed] [Google Scholar]
- 29.Mahoney MW, Jorgensen WL. A five-site model for liquid water and the reproduction of the density anomaly by rigid, nonpolarizable potential functions. J Chem Phys. 2000;112:8910–8922. [Google Scholar]
- 30.Darden T, York D, Pedersen L. Particle mesh Ewald: An Nlog(N) method for Ewald sums in large systems. J Chem Phys. 1993;98:10089–10092. [Google Scholar]
- 31.Essmann U, Perera L, Berkowitz M, Darden T, Lee H, Pedersen LG. A smooth particle mesh Ewald method. J Chem Phys. 1995;103:8577–8593. [Google Scholar]
- 32.Hoover WG. Canonical dynamics: equilibrium phase-space distributions. Phys Rev A. 1985;31:1695–1697. doi: 10.1103/physreva.31.1695. [DOI] [PubMed] [Google Scholar]
- 33.Parrinello M, Rahman A. Polymorphic transitions in single crystals: A new molecular dynamics method. J Appl Phys. 1981;52:7182–7190. [Google Scholar]
- 34.Miyamoto S, Kollman PA. Settle: An analytical version of the SHAKE and RATTLE algorithm for rigid water molecules. J Comput Chem. 1992;13:952–962. [Google Scholar]
- 35.Hess B, Bekker H, Berendsen HJC, Fraaije JGEM. LINCS: A linear constraint solver for molecular simulations. J Comput Chem. 1997;18:1463–1472. [Google Scholar]
- 36.Torrie GM, Valleau JP. Nonphysical sampling distributions in Monte Carlo free-energy estimation: Umbrella sampling. J Comp Phys. 1977;23:187–199. [Google Scholar]
- 37.Kumar S, Bouzida D, Swendsen RH, Kollman PA, Rosenberg JH. The weighted histogram analysis method for free-energy calculations on biomolecules. I. The method. J Comput Chem. 1992;13:1011–1021. [Google Scholar]
- 38.Berne BJ, Borkovec M, Straub JE. Classical and modern methods in reaction rate theory. J Phys Chem. 1988;92:3711–3725. [Google Scholar]
- 39.Frauenfelder H, Wolynes PG. Rate theories and puzzles of hemeprotein kinetics. Science. 1985;229:337–345. doi: 10.1126/science.4012322. [DOI] [PubMed] [Google Scholar]
- 40.Crouzy S, Woolf TB, Roux B. A molecular dynamics study of gating in dioxolane-linked Gramicidin A channels. Biophys J. 1994;67:1370–1386. doi: 10.1016/S0006-3495(94)80618-6. [DOI] [PMC free article] [PubMed] [Google Scholar]
- 41.Hummer G. Position-dependent diffusion coefficients and free energies from Bayesian analysis of equilibrium replica molecular dynamics simulations. New J Phys. 2005;7:1–14. [Google Scholar]
- 42.Mamonov AB, Kurnikova MG, Coalson RD. Diffusion constant of K+ inside Gramicidin A: A comparative study of four computational methods. Biophys Chem. 2006;124:268–278. doi: 10.1016/j.bpc.2006.03.019. [DOI] [PMC free article] [PubMed] [Google Scholar]
- 43.Petrek M, Otyepka M, Banás P, Kosinová P, Koca J, Dambrosky J. CAVER: a new tool to explore routes from protein clefts, pockets, and cavities. BMC Bioinform. 2006;7:316–324. doi: 10.1186/1471-2105-7-316. [DOI] [PMC free article] [PubMed] [Google Scholar]
- 44.Ho BK, Gruswitz F. HOLLOW: Generating accurate representation of channel and interior surfaces in molecular structures. BMC Struct Biol. 2008;8:1–6. doi: 10.1186/1472-6807-8-49. [DOI] [PMC free article] [PubMed] [Google Scholar]
- 45.Zheng X, Medvedev DM, Swanson Jessica, Stuchebrukhov AA. Computer simulation of water in cytochrome c oxidase. Biochim Biophys Acta. 2003;1557:99–107. doi: 10.1016/s0005-2728(03)00002-1. [DOI] [PubMed] [Google Scholar]
- 46.Wikstrom M, Verkhovsky MI, Hummer G. Water-gated mechanism of proton translocation by cytochrome c oxidase. Biochim Biophys Acta. 2003;1604:61–65. doi: 10.1016/s0005-2728(03)00041-0. [DOI] [PubMed] [Google Scholar]
- 47.Cukier RI. Quantum molecular dynamics simulation of proton transfer in cytochrome c oxidase. Biochim Biophys Acta. 2004;1656:189–202. doi: 10.1016/j.bbabio.2004.03.006. [DOI] [PubMed] [Google Scholar]
- 48.Olkhova E, Hutter MC, Lill MA, Helms V, Michel H. Dynamic water networks in cytochrome c oxidase from Paracoccus denitrificans Investigated by molecular dynamics simulations. Biophys J. 2004;86:1873–1889. doi: 10.1016/S0006-3495(04)74254-X. [DOI] [PMC free article] [PubMed] [Google Scholar]
- 49.Seibold SA, Mills DA, Ferguson-Miller S, Cukier RI. Water chain formation and possible proton pumping routes in Rhodebacter sphaeroides cytochrome c oxdiase: A molecular dynamics comparison of the wild type and R481K mutant. Biochemistry. 2005;44:10475–10485. doi: 10.1021/bi0502902. [DOI] [PubMed] [Google Scholar]
- 50.Wikström M, Ribacka C, Molin M, Laakkonen L, Verkhovsky M, Puustinen A. Gating of proton and water transfer in the respiratory enzyme cytochrome c oxidase. Proc Natl Acad Sci USA. 2005;102:10478–10481. doi: 10.1073/pnas.0502873102. [DOI] [PMC free article] [PubMed] [Google Scholar]
- 51.Harrenga A, Michel H. The cytochrome c oxidase from Paraccocus denitrificans does not change the metal center ligation upon reduction. J Biol Chem. 1999;274:33296–33299. doi: 10.1074/jbc.274.47.33296. [DOI] [PubMed] [Google Scholar]
- 52.Hunsicker-Wang LM, Pacoma RL, Chen Y, Fee JA, Stout CD. A novel cryoprotection scheme for enhancing the diffraction of crystals of recombinant cytochrome ba3 oxidase from Thermus thermophilus. Acta Cryst. 2005;D61:340–343. doi: 10.1107/S0907444904033906. [DOI] [PubMed] [Google Scholar]
- 53.Xu J, Sharpe MA, Qin L, Ferguson-Miller S, Voth GA. Storage of an excess proton in the hydrogen-bonded network of the D-pathway of cytochrome c oxidase: Identification of a protonated water cluster. J Am Chem Soc. 2007;129:2910–2913. doi: 10.1021/ja067360s. [DOI] [PMC free article] [PubMed] [Google Scholar]
- 54.Belevich I, Bloch DA, Wikström M, Verkhovsky MI. Exploring the proton pump mechanism of cytochrome c oxidase in real time. Proc Natl Acad Sci USA. 2007;104:2685–2690. doi: 10.1073/pnas.0608794104. [DOI] [PMC free article] [PubMed] [Google Scholar]
- 55.Brookes PS, Rolfe DFS, Brand MD. The proton permeability of liposomes made from mitochondrial inner membrane phospholipids: Comparison with isolated mitochondria. J Membr Biol. 1996;155:167–174. doi: 10.1007/s002329900168. [DOI] [PubMed] [Google Scholar]
- 56.Lancaster CRD, Michel H. The coupling of light-induced electron transfer and proton uptake as derived from crystal structures of reaction centres from Rhodopseudomonas viridis modified at the binding site of the secondary quinone. QB, Structure. 1997;15:1339–1359. doi: 10.1016/s0969-2126(97)00285-2. [DOI] [PubMed] [Google Scholar]
- 57.Nagle JF, Tristram-Nagle S. Structure of lipid bilayers. Biochim Biophys Acta. 2000;1469:159–195. doi: 10.1016/s0304-4157(00)00016-2. [DOI] [PMC free article] [PubMed] [Google Scholar]
- 58.Dürr KL, Koepke J, Hellwig P, Müller H, Angerer H, Peng G, Olkhova E, Richter OMH, Ludwig B, Michel H. A D-pathway mutation decouples the Paracoccus denitrificans cytochrome c oxidase by altering the side-chain orientation of a distant conserved glutamate. J Mol Biol. 2008;384:865–877. doi: 10.1016/j.jmb.2008.09.074. [DOI] [PubMed] [Google Scholar]
- 59.Wikström M, Verkhovsky MI. Mechanism and energetics of proton translocation by the respiratory heme-copper oxidases. Biochim Biophys Acta. 2007;1767:1200–1214. doi: 10.1016/j.bbabio.2007.06.008. [DOI] [PubMed] [Google Scholar]
- 60.Brzezinski P, Ädelroth P. Design principles of proton-pumping haem-copper oxidases. Curr Opin Struct Biol. 2006;16:465–472. doi: 10.1016/j.sbi.2006.06.012. [DOI] [PubMed] [Google Scholar]
- 61.Faxén K, Gilderson G, Ädelroth P, Brzezinski P. A mechanistic principle for proton pumping by cytochrome c oxidase. Nature. 2005;437:286–289. doi: 10.1038/nature03921. [DOI] [PubMed] [Google Scholar]
- 62.Sharpe MA, Krzyaniak MD, Xu S, McCracken J, Ferguson-Miller S. EPR Evidence of Cyanide Binding to the Mn(Mg) Center of Cytochrome c Oxidase: Support for CuA-Mg Involvement in Proton Pumping. Biochemistry. 2009;48:328–335. doi: 10.1021/bi801391r. [DOI] [PMC free article] [PubMed] [Google Scholar]
- 63.Sharpe MA, Ferguson-Miller S. A chemically explicit model for the mechanism of proton pumping in heme-copper oxidases. J Bioenerg Biomembr. 2008;40:541–549. doi: 10.1007/s10863-008-9182-6. [DOI] [PMC free article] [PubMed] [Google Scholar]
- 64.Pfitzner U, Odenwald A, Ostermann T, Weingard L, Ludwig B, Richter OM. Cytochrome c oxidase (heme aa3) from Paracoccus denitrificans: Analysis of mutations in putative proton channels of subunit I. J Bioenerg Biomembr. 1998;30:89–97. doi: 10.1023/a:1020515713103. [DOI] [PubMed] [Google Scholar]
- 65.Lepp H, Salomonsson L, Zhu JP, Gennis RB, Brzezinski P. Impaired proton pumping in cytochrome c oxidase upon structural alteration of the D pathway. Biochim Biophys Acta. 2008;1777:897–903. doi: 10.1016/j.bbabio.2008.04.013. [DOI] [PMC free article] [PubMed] [Google Scholar]
- 66.Han D, Namslauer A, Pawate A, Morgan JE, Nagy S, Vakkasoglu AS, Brzezinski P, Gennis RB. Replacing Asn207 by aspartate at the neck of the D-channel in the aa3-type cytochrome c oxidase from Rhodobacter sphaeroides results in decoupling the proton pump. Biochemistry. 2006;45:14064–14074. doi: 10.1021/bi061465q. [DOI] [PMC free article] [PubMed] [Google Scholar]
- 67.Olsson MHM, Warshel A. Monte Carlo simulations of proton pumps: On the working principles of the biological valve that controls proton pumping in cytochrome c oxidase. Proc Natl Acad Sci USA. 2005;103:6500–6505. doi: 10.1073/pnas.0510860103. [DOI] [PMC free article] [PubMed] [Google Scholar]
- 68.Xu J, Voth GA. Free energy profiles for H+ conduction in the D-pathway of cytochrome c oxidase: A study of the wild type and N98D mutant enzymes. Biochim Biophys Acta. 2006;1757:852–859. doi: 10.1016/j.bbabio.2006.05.028. [DOI] [PubMed] [Google Scholar]
- 69.Olkhova E, Helms V, Michel H. Titration behavior of residues at the entrance of the D-pathway of cytochrome c oxidase from Paracoccus denitrificans investigated by continuum electrostatic calculations. Biophys J. 2005;89:2324–2331. doi: 10.1529/biophysj.105.062091. [DOI] [PMC free article] [PubMed] [Google Scholar]
- 70.Bränden G, Pawate AS, Gennis RB, Brzezinski P. Controlled uncoupling and recoupling of proton pumping in cytochrome c oxidase. Proc Natl Acad Sci USA. 2006;103:317–322. doi: 10.1073/pnas.0507734103. [DOI] [PMC free article] [PubMed] [Google Scholar]
Associated Data
This section collects any data citations, data availability statements, or supplementary materials included in this article.


