

Abstract
The study of N-linked glycans is among the most challenging bioanalytical tasks because of their complexity and variety. The presence of glycoform families that differ only in branching and/or linkage position makes the identification and quantitation of individual glycans exceedingly difficult. Quantitation of these individual glycans is important because changes in the abundance of these isomers are often associated with significant biomedical events. For instance, previous studies have shown that the ratio of α2-3 to α2-6 linked sialic acid (SA) plays an important role in cancer biology. Consequently, quantitative methods to detect alterations in the ratios of glycans based on their SA linkages could serve as a diagnostic tool in oncology, yet traditional glycomic profiling cannot readily differentiate between these linkage isomers. Here, we present a liquid chromatography-selected reaction monitoring (LC-SRM) approach that we demonstrate is capable of quantitating the individual SA linkage isomers. The LC method is capable of separating sialylated N-glycan isomers differing in α2-3 and α2-6 linkages using a novel superficially porous particle (Fused-Core) Penta-HILIC (hydrophilic interaction liquid chromatography) column. SRM detection provides the relative quantitation of each SA linkage isomer, and minimizes interferences from coeluting glycans that are problematic for UV/Fluorescence based quantitation. With our approach, the relative quantitation of each SA linkage isomer is obtained from a straightforward liquid chromatography-mass spectrometry (LC-MS) experiment.
Glycosylation is one of the most common and complex protein post-translational modifications. The glycosylation pattern of proteins depends on multiple factors, including enzyme activity, nucleotide sugar availability, kinetics of glycoconjugate transport, and cell type/stage. Alterations in glycan structures are associated with various pathologies such as cancer and inflammation,1 and thus the detection of these changes offers the potential of being used for diagnostic and prognostic purposes.
A family of acidic 9-carbon sugars, which are known as sialic acids (SAs),2 have attracted great attention due to the recognition of their biological functions.3 Previous studies have shown that the degree of sialylation affects the half-lives of many circulating glycoproteins and plays critical roles in a variety of biological processes, such as cell–cell communication, cell matrix interaction, adhesion, and protein targeting.4−6 Usually, SAs are found as terminal sugars on many of the oligosaccharides attached to proteins or lipids. In mammalian cells, the most common SAs are N-acetylneuraminic acid (Neu5Ac) and N-glycolylneuraminic acid (Neu5Gc); of these, only the former is present in normal human cells.7,8 The structural diversity of SAs arises not only from different types of SAs but also from their linkage to the underlying glycan residues. Typically, SAs can be attached to a galactose (Gal) residue via α2-3 or α2-6 linkages or attached to N-acetylgalactosamine (GalNAc) via an α2-6 linkage.9 In addition, SAs can also be attached to another SA residue via an α2-8 linkage.10 These linkage configurations are regulated by the transferring enzymes, sialyltransferases (STs).
There are approximately 20 different STs, which can be classified into four groups according to the linkages through which they attach SAs to the glycan residue, including ST3Gal, ST6Gal (α2,6-ST), ST6GalNAc, and ST8Sia (α2,8-ST).10 The abbreviated key for this ST nomenclature is the linkage position (i.e., 3, 6, 8) followed by the monosaccharide onto which the SA is transferred (i.e., Gal, GlcNAc, SA). In other words, ST3Gal would be the term for a transferase that attaches a SA via an α2-3 linkage to a galactose residue. Among the STs, ST6Gal-1 is probably the most studied due to its biological significance and its relationship to cancer.11 Evidence shows that the proteins on the cell surface undergo an increased level of α2-6 linked sialylation on galactose residues during tumor progression,12 which is correlated to the increased expression of ST6Gal-1.13-16 Hence, the altered ratio of α2-3/2-6 can be used as an indicator for diagnostic purposes.
Mass spectrometry (MS) has been an enabling technology in glycomics.17,18 Although mass spectrometry can provide extensive information on structure and quantity, MS glycomics profiling has difficulty quantitating linkage isomers, such as those resulting from SA α2-3/2-6 linkages, particularly when multiple species are present.19 The MSn spectra of the sialylated glycans are typically dominated by the loss of the labile SAs, which makes assigning the SA linkage assignment difficult and precludes the ability to quantitate the amounts of the linkage isomers when multiple species are present at the same mass.20 Several groups have proposed techniques to overcome this issue with quantitation of SA linkage isomers. To differentiate these linkage isomers, Mechref et al. have described the formation of diagnostic ions by tandem MS of permethylated oligosaccharides specific to SA with α2-6 linkage.21 Alley and Novotny have reported a method that involves the selective amidation of α2-6 linked SAs, which causes the α2-3 linked SAs to undergo spontaneous lactonization. Followed by permethylation, the α2-6 linked SA gives a mass shift of 13 Da over SA attached via α2-3 linkage, which can be easily distinguished by MS.19 These methods require extensive chemical derivatization for sample preparation.
Liquid chromatography (LC) is a useful addition to the MS-based glycomics techniques due to its ability to separate glycan isomers, and thus offers great potential for the characterization/quantitation of individual glycans. Various separation techniques have demonstrated the ability to resolve isomeric N-glycans, both in their native and derivatized forms, using normal-phase,22 porous graphitized carbon (PGC)23 and reversed-phase24 liquid chromatography. Recently, Hincapie has reported the separation of isomeric sialylated N-glycans by hydrophilic interaction liquid chromatography (HILIC) combined with a linkage specific derivatization.25 In this work, the derivatization of SAs is not only essential to identify the isomers due to the linkage specific reactions but also important to separate the linkage specific subpopulations of those highly sialylated N-glycans by HILIC. The routine chromatographic separation of SA linkage isomers has not currently been achieved without linkage specific chemistry.
Here, we present an LC-selected reaction monitoring (SRM) approach that enables quantitation of the individual SA linkage isomers. We have developed a chromatographic method capable of separating the sialylated N-glycan α2-3 and α2-6 linkage isomers using a novel superficially porous particle (Fused-Core) Penta-HILIC column. Exoglycosidase digestion confirmed the identity of each N-glycan isomer from a standard glycoprotein. Quantitation of the linkage isomers is provided by interfacing the LC to a Q-Trap MS detector that was operated in SRM mode, which minimized interferences from the coeluting glycans that caused problems with UV/Fluoresence based quantitation. This straightforward LC-MS experiment provides the relative quantitation of each SA linkage isomer.
Experimental Section
Materials
Bovine fetuin, human serum, trypsin (TPCK treated), procainamide hydrochloride, and dimethyl sulfoxide (DMSO) were purchased from Sigma. Ammonium bicarbonate, ammonium formate, formic acid (for LC-MS), and sodium cyanoborohydride were purchased from Fluka. PNGase F (Glycerol free) was purchased from New England Biolabs (NEB). Sialidase S (recombinant from Streptococcus pneumonia expressed in Escherichia coli) was purchased from Prozyme. Acetonitrile (ACN, HPLC grade) was purchased from Fisher. Octadecyl (C18) disposable extraction columns were purchased from J.T. Baker. PD MiniTrap G-10 was purchased from GE Healthcare. Other reagents were analytical grade.
N-Glycan Release and Purification
Bovine fetuin (200 μg) was dissolved in 200 μL of 50 mM ammonium bicarbonate, pH = 7.8. For human serum, a 50 μL aliquot was mixed with 50 mM ammonium bicarbonate, pH = 7.8. Both sample solutions were heated at 100 °C for 5 min to denature the protein. Trypsin digestion was carried out at 37 °C overnight with an adjusted enzyme amount (a 10 μL aliquot for fetuin or 100 μL aliquot for serum of a 1 μg/μL trypsin in the buffer solution). The trypsin was then deactivated by heating at 100 °C for 10 min. For N-glycan release, a l μL and 4 μL aliquot of PNGase F (used as received from NEB at 500 000 U/mL) was added to the fetuin sample and the human serum sample, respectively. After incubation at 37 °C overnight, the released N-glycans were separated from peptides and undigested proteins by reverse-phase liquid chromatography with a C18 SPE column. Specifically, the PNGase F digests were loaded onto a C18-Sep-Pac, which had been pre-equilibrated in 5% acetic acid. The column was washed with 3 mL of 5% acetic acid; the N-glycans were present in the flow-through, which was collected, frozen, and lyophilized to dryness.
Procainamide (ProA) Labeling of Free N-Glycans
The labeling of the glycans was carried out by following Klapoetke’s procedure26 with a modification for the sialylated glycans.27 The labeling solution was prepared fresh with 108 mg/mL procainamide hydrochloride, and 63 mg/mL sodium cyanoborohydride (NaBH3CN) in DMSO/acetic acid at a ratio of 7:3 by volume. A 20 μL aliquot of the labeling solution was added to the fetuin sample and 40 μL to the serum sample. The mixtures were incubated at 37 °C overnight in darkness. Excess labeling reagent was removed using the MiniTrap G-10 size exclusion columns following the user’s guide of this product. The fraction containing the fluorescently labeled N-glycans was lyophilized and stored at −20 °C pending analysis.
HILIC Separation of ProA Labeled N-Glycans
This study utilized a Nexera UFLC (Shimadzu) LC system and Halo Penta-HILIC columns (Advanced Materials Technology, 2.1 mm × 15 cm, 2.7 μm particle size, Wilmington, DE). The separation was carried out at a flow rate of 0.4 mL/min at 60 °C with a mobile phase A consisting of 95% H2O/ACN with 50 mM ammonium formate (adjusted to pH 4.4 with formic acid) and mobile phase B being pure ACN. A linear gradient of 78% mobile phase B to 48% mobile phase B in 75 min was utilized. The UV absorbance signal for the ProA tag was detected at a wavelength of 300 nm. In most cases, the absorbance detector was operated in series with the MS detector. A small ID (50 μm × 20 cm PEEK-Sil) tube connected the flow cell to the MS interface. One fiftieth of the sample dissolved in 78% ACN was injected for each experiment. With the fetuin sample, fractions were collected based on individual peaks observed from an UV detector. After the samples were dried in a Speed-vac (Thermo/Savant), the fractions were stored at −20 °C pending exoglycosidase study to determine the isomer linkages of SAs.
SRM Detection of Chromatographically Resolved Isomers
MS analysis was performed on a 4000 Q-Trap (AB SCIEX) mass spectrometer. An initial LC-MS experiment, where ions were detected across the 700–2000 m/z range, was performed on each sample to determine the most abundant molecular ion species for each glycan. These values, listed in Table 1, were used as the precursor ions for the SRM experiments. MS/MS experiments performed on the ProA-labeled N-glycans revealed that each of these glycans produced an intense fragment ion at m/z 441.4, which corresponded to the GlcNAc derivatized with the ProA tag. This fragment ion was used in the SRM experiment for all of the labeled N-glycans. As a side note, the high abundance of this fragment ion was expected because of the high gas-phase basicity associated with the tertiary amine on the ProA tag. A series of experiments was performed and led to the conclusion that a collision energy (CE) of 70 V and declustering potential (DP) of 40 V were optimal. The dwell time was set at 100 ms with unit resolution in both Q1 and Q3 mass selectors.
Table 1. SRM Quantitation of Sialylated N-Glycan Linkage Isomers from Human Serum.
| relative ratio
(%) |
||||
|---|---|---|---|---|
| m/z | glycan | RT (min) | average | STD |
| 1076.50 | Bi-SA(3) | 29.2 | 9.11 | 1.64 |
| Bi-SA(6) | 30.6 | 90.9 | 1.56 | |
| 1222.20 | Bi-2SA(3,3) | 33.3 | 0.59 | 0.22 |
| Bi-2SA(3,6) | 34.8 | 21.3 | 2.96 | |
| Bi-2SA(6,6) | 36.2 | 78.2 | 2.91 | |
| 1259.08 | Tri-SA(3) | 33.8 | 67.2 | 4.31 |
| Tri-SA(6) | 34.8 | 32.7 | 4.38 | |
| 937.05 | Tri-2SA(3,3) | 37.9 | 2.62 | 0.88 |
| Tri-2SA(3,6) | 39.2 | 54.5 | 6.88 | |
| Tri-2SA(6,6) | 40.2 | 46.5 | 3.70 | |
| 1034.10 | Tri-3SA(3,3,3) | 42.5 | 0.62 | 0.19 |
| Tri-3SA(3,3,6) | 43.7 | 16.8 | 3.81 | |
| Tri-3SA(3,6,6) | 44.8 | 61.6 | 1.63 | |
| Tri-3SA(6,6,6) | 46.0 | 20.8 | 2.96 | |
| 1155.49 | Tetra-3SA(3,3,3) | 44.3 | 3.07 | 0.54 |
| Tetra-3SA(3,3,6) | 45.6 | 36.2 | 4.15 | |
| Tetra-3SA(3,6,6) | 46.7 | 50.0 | 2.21 | |
| Tetra-3SA(6,6,6) | 47.8 | 10.7 | 2.41 | |
Exoglycosidase Digestion for SA Linkage Identification with Fetuin N-Glycans
To confirm the separation of SA linkage isomers, fractions collected from the fetuin sample were digested with sialidase S, an exoglycosidase that specifically releases α2-3 linked SA residues. For this digestion, each of the dried fractions was dissolved in 14 μL of Nanopure water, then 4 μL of 5× Reaction Buffer B (as received) and 2 μL of sialidase S (at 5 U/mL) were added to the mixture to give a total volume of 20 μL. The digestions were carried out at 37 °C for 2 h. After digestion, each reaction solution was frozen and lyophilized to dryness and then redissolved in 78% ACN/H2O for LC/MS analysis with the same experimental conditions described above.
Results and Discussion
Fetuin N-Glycan Separation with the Penta-HILIC Columns
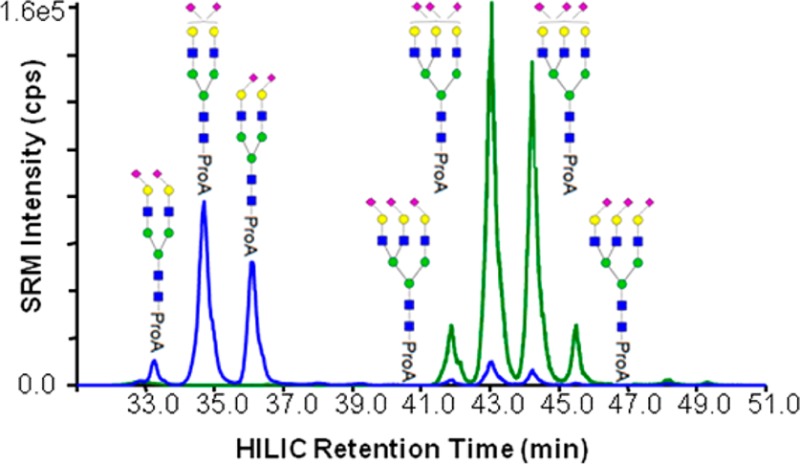
Fetuin is a standard glycoprotein that has a variety of well-characterized glycoforms, which consists predominantly of bi-, tri-, and tetra-antennary N-glycans possessing variable degrees of sialylation.20,28,29 The HILIC separation of the ProA-labeled N-glycans from fetuin contained 21 abundant chromatographically resolved peaks (Figure 1A). Comparing the observed masses from the LC-MS experiment to those reported previously,30,31 glycan compositions could be assigned for each peak (Table S-1, Supporting Information). For example, the m/z value obtained over peak 1 corresponds with a biantennary N-glycan with two SAs, which is abbreviated as Bi-2SA. LC-MS analysis identified 8 unique compositions in 21 chromatographic peaks. Four compositions (Bi-2SA, Tri-2SA, Tri-3SA, and Tri-4SA) are found in 13 individual peaks, which are represented in blue, red, green, and gray, respectively in the SRM traces (Figure 1B). It is noteworthy that there are some minor peaks in blue and red underneath the most abundant green peaks, which presumably result from the loss of SAs by in-source fragmentation. A reasonable explanation for the observation of multiple peaks with the same composition was that the SA α2-3/α2-6 linkage isomers were being resolved with the HILIC separation. To confirm our hypothesis, each of these peaks was collected and further characterized by exoglycosidase digestion with subsequent LC-MS analysis.
Figure 1.
Major ProA-labeled N-glycans from fetuin. (A) UV trace of the fetuin sample denoting the peak/fraction number. Fractions were collected for peaks 1 through 21 and subjected individually to exoglycosidase digestion, LC-SRM analysis. (B) LC-SRM traces for the major N-glycan compositions from the same fetuin sample, indicating the Bi-2SA (blue), Tri-2SA (red), Tri-3SA (green), and Tri-4SA (gray).
A series of exoglycosidase digestion studies were performed to confirm that the multitude of chromatographic peaks from glycans with the same apparent composition resulted from different linkage isomers. Each of the isolated fetuin fractions was subjected to digestion with Sialidase S, which should exclusively cleave α2-3 linked SA from the nonreducing termini. Each digested fraction was analyzed by LC-SRM using the same LC gradient as the original separation and the SRM transitions listed in Table S-2 (Supporting Information). For instance, the extracted LC-SRM trace for the Bi-2SA N-glycans (m/z at 1222.1) from whole fetuin sample includes three individual peaks at 33.2, 34.8, and 36.3 min (Figure 2A). LC-SRM analysis of the earliest eluting Bi-2SA glycoform after exoglycosidase digestion revealed that the original peak at 33.2 min had disappeared and was replaced by a new peak at 24.3 min (Figure 2B). The SRM data indicated that the glycan in this new peak corresponded to a biantennary structure with no SAs. This result indicates that both of the SAs on this N-glycan have attachment through α2-3 linkages. Analysis of the second Bi-2SA fraction after digestion once again revealed the disappearance of the original peak, the appearance of a new peak at 31.5 min (Figure 2C), and the mass of the new glycan corresponding to a Bi-SA structure. Consequently, the N-glycan present in this fraction was found to have one SA attached through an α2-3 linkage (released by sialidase S digestion) and one SA attached through an α2-6 linkage (resistant to sialidase S digestion). The glycan in the last Bi-2A fraction was not affected by the Sialidase S digestion (Figure 2D), which indicated that both SAs are attached via α2-6 linkages. Combined, these results indicate that each of the fractions contains a different SA linkage isomer(s) and the three fractions correspond to Bi-2SA(3,3), Bi-2SA(3,6), and Bi-2SA(6,6) listed in order from the shortest to longest retention time. Similar experiments were conducted on the fractionated Tri-2SA, Tri-3SA, and Tri-4SA N-glycans, and the SA linkage identifications also demonstrated the retention pattern of the SA α2-3 isomer eluting before the corresponding an α2-6 isomer. The three isomeric structures observed from the Tri-2SA N-glycans corresponded to Tri-2SA(3,3), Tri-2SA(3,6), and Tri-2SA(6,6) in the order of the shortest to longest retention time (Figure S-1, Supporting Information). The 4 isomeric structures detected from the Tri-3SA N-glycan corresponded to Tri-3SA(3,3,3), Tri-3SA(3,3,6), Tri-3SA(3,6,6), and Tri-3SA(6,6,6) (Figure S-2, Supporting Information). The Tri-4SA N-glycans have more SAs than their antenna, and the fourth SA has been found to be attached to the nonreducing end GlcNAc through α2-6 linkage.20 The exoglycosidase digestions revealed that the SA linkage sites for glycans eluting in these peaks were Tri-4SA(3,3,3,6), Tri-4SA(3,3,6,6), and Tri-4SA(3,6,6,6) (Figure S-3, Supporting Information), where the italicized numbers indicate the linkage of the SA not attached to the terminal Gal residue. These experiments clearly demonstrate that the glycans are being resolved based on the ratio of their SA α2-3-to-α2-6 linkages.
Figure 2.
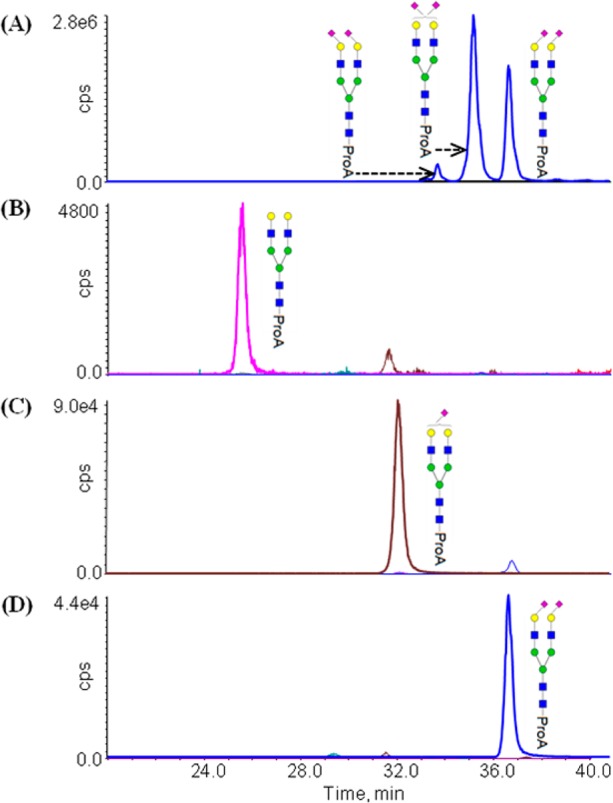
Sialidase S digestions for Bi-2SA fractions by SRM detection. (A) LC-SRM trace for Bi-2SA (m/z at 1222.1) from analysis of the fetuin N-glycans. LC-SRM analysis illustrates (B) the disappearance of the blue peak (Bi-2SA) and the appearance of the pink peak (Bi-0SA) after Sialidase S digestion for the first fraction; (C) the disappearance of the blue peak (Bi-2SA) and the appearance of the brown peak (Bi-SA) after Sialidase digestion for the second fraction; and (D) no change of the blue peak (Bi-2SA) after Sialidase S digestion for the third fraction. Panels B–D contain SRM traces for all three possible glycans resulting from this treatment, i.e., the Bi-0SA, Bi-SA, and Bi-2SA; however, the low levels make these difficult to see in all of the panels.
It is worth noting that there is a minor peak observed in the LC-SRM traces after the sialidase S digestion that corresponds to incomplete SA release. For example, Figure 2B contains a dominant peak corresponding to the biantennary structure with no SAs (Bi-0SA with a pink trace), and a minor peak corresponding to the biantennary structure with one SA (Bi-SA with a brown trace). An explanation is that these minor peaks result from the incomplete SA release. We feel that a more likely explanation is that minor amounts of the other linkage isomers are present in the collected fractions. For instance, the fraction containing the earliest eluting Bi-2SA is dominated by the Bi-2SA(3,3) but a small amount of Bi-2SA(3,6) was copurified in this sample. Similar discussions can be made for the analysis of the other fraction after sialidase S digestion, shown in Figures 2 and S1–S3 (Supporting Information). This rational leads us to infer that the sialidase S digestion of the SA with α2-3 linkage can be completed under the described experiment conditions, and that this treatment does not release detectable amounts of 2-6 linked SA.
A conclusion from these results is that the substitution of an α2-3 linked SA with an α2-6 linked SA on biantennary glycans (Bi-SA and Bi-2SA) increases the retention time by a constant value, in this case, approximately 1.4 min. The shift in retention time with such substitution for triantennary glycans (Tri-2SA, Tri-3SA, and Tri-4SA) is about 1.1 min under the described experimental conditions. It is possible that the shift in glycan retention by the isomeric substitution is altered by the overall retention of the glycan, which is determined by the overall size of the glycan (number of sugar units).
Even with the ability to resolve α2-3/α2-6 linkage isomers, many of these fractions likely contain multiple glycoforms. For instance, there are two branching isomers that correspond to the composition Bi-2SA(3,6) found in the second LC fraction. One of these has the α2-6 linked SA on the antennae originating on the 6 branch of the core pentasaccharide, whereas the other has the α2-6 linked SA on the antennae originating on the 3 branch (Figure S-4A, Supporting Information). Because both of these structures have been reported attached to fetuin, it does not appear that the chromatographic conditions here are capable of resolving these two branching isomers. Analogous discussions can be made concerning the three possible Tri-2SA(3,3) branching isoforms (Figure S-4B, Supporting Information). Many of the other compositions have the potential to have multiple branching isomers, in particular, the compositions indicated by Tri-2SA(3,6), Tri-2SA(6,6), Tri-3SA(3,3,6), Tri-3SA(3,6,6), and all 3 of the Tri-4SA combinations, which if present, are not resolved with these conditions. The triantennary structures of fetuin are also known to have Gal β1-3/Gal β1-4 linkage isomers.20,32 The chromatographic conditions in the current study do not appear to resolve these linkage isomers. Further study will be required to define conditions that may allow resolution of these additional linkage isomers either. Despite these limitations, the ability to resolve glycans based on their SA α2-3/α2-6 linkages offers the potential to quickly isolate/quantitate these linkage isomers. This capacity is expected to advance biomedical research as it will facilitate the study of disease conditions wherein the ratio of α2-3 to α2-6 SA linkages is expected to change.
UV and SRM Quantitation of Isomeric N-Glycans with Different SA Linkages from Fetuin
The ProA tag of N-glycans added through reductive amination chemistry gives nonselective labeling on the reducing end in a 1:1 ratio, which makes it possible to achieve quantitation by UV absorbance or fluorescence detection. However, the UV/fluorescence quantitation requires that all the peaks are resolved from each other in order to obtain individual peak area measurements, which can be challenging with complex glycomic samples. Alternatively, SRM has been widely employed for quantitative purposes, due to its excellent selectivity, sensitivity, and ability to quantitate individual components in complex mixtures. However, with the SRM approach, each glycan may have a different response because of changes in parameters such as the precursor charge states/adducts, ionization/fragmentation efficiencies, etc. For example, in positive ion mode, the ionization efficiency may decrease with increasing number of SA residues. In the fetuin sample, the 3 isomers of Bi-2SA, 3 isomers of Tri-2SA, 4 isomers of Tri-3SA, and 3 isomers of Tri-4SA were well-resolved from other detectable glycans. Thus, the relative ratio of each structure could be obtained without bias from UV detection, which enabled the exploration of the SRM detection response for each of these glycans. In this study, the most abundant ions for these derivatized N-glycans were the doubly and triply protonated species. The most abundant molecular ion in MS 1 for each composition was selected as the precursor for SRM quantitation, as shown in Table S-1 (Supporting Information).
The relative quantity of each resolvable species was calculated by dividing the peak area, obtained either by UV or SRM detection, obtained for each glycan, with the sum of the peak areas from all identifiable glycans. The standard deviations from triplicate measurements were less that 1% for the results using UV and SRM detection, indicating the high reproducibility of both detection methods. However, the relative quantities obtained by UV detection are different from those obtained by SRM (Figure 3). For example, the relative quantity of Bi-2SA(3,6) was 7.8% with UV detection, whereas it was 14.5% by SRM detection. Conversely, the relative ratio of Tri-3SA(3,3,6) was 34.5% by UV detection but only 26.2% by SRM detection. In general, the relative quantities of Bi-2SA and Tri-2SA by SRM detection would result in overestimation of the amounts, and the relative ratios of Tri-3SA and Tri-4SA would be underestimated. In order to determine whether the measurement differences between the UV and MRM detection were significant, standard t-tests were performed. For those 13 individual glycans, 11 glycans were found at p < 0.001 (Table S-3, Supporting Information). The results indicated that there were statistically significant differences between the UV and SRM detection for the relative quantitation of individual structure across different glycan compositions. The values obtained from UV detection were assumed to be correct because (1) UV detection should not be affected by glycan structure/composition and (2) MS analysis of each chromatographic peak demonstrated that each contained a single glycan species. A possible explanation is that the MS response in positive ion mode decreases with the addition of negatively charged SA residues. Increased SA residues may also lead to a shift in the charge state distribution of the glycans and thus a decrease in the observed response when comparing the SRM signal at a selected charge state for glycans with differing SA compositions. Another explanation is that the SRM response decreases with increasing MW of the glycan, which could result from decreased ionization efficiency, ion transmission, and/or fragmentation efficiency. Yet another possibility is that the organic/aqueous composition of the chromatographic solvent changes during the gradient elution, and that ionization efficiency is dependent on the composition at elution for each component. Of course, there are multiple other explanations, all of which may be correct, but the important point is simply that the SRM response changes with the composition of the glycan.
Figure 3.

Relative quantitation of the major glycan linkage isomers of fetuin by UV and LC-SRM detection. The response for each glycoform is relative to the summed response for all identified glycans.
The SRM responses for isomeric glycans were then evaluated by comparing the relative quantitation of isomeric structures for glycans of a given composition. For instance, the relative ratios of each Bi-2SA isomer were calculated from the total amount of all the 3 isomers for both UV absorbance and SRM detection, and so forth. Comparisons of the relative responses for each of the glycan to the other glycans having the same compositions demonstrate that the relative quantitation obtained by SRM detection are in very good agreement with those obtained by UV detection (Figure 4), which suggests that there are negligible differences in the SRM responses for linkage isomers. The t-tests were again used to determine the significance of these differences and various levels of significance were tested. With the same 13 glycans, only 2 glycans were found at p < 0.05 and none of them was found at p < 0.001 (Table S-3, Supporting Information). Hence, reliable relative quantitation of individual isomers can be achieved by comparing the SRM responses to other N-glycans with the same composition.
Figure 4.

Relative quantitation of the major glycan linkage isomers of fetuin with UV and LC-SRM detection. The response for each glycoform is relative to the summed response for all glycoforms with the same composition.
SRM Quantitation of SA Linkage Isomers from Human Serum
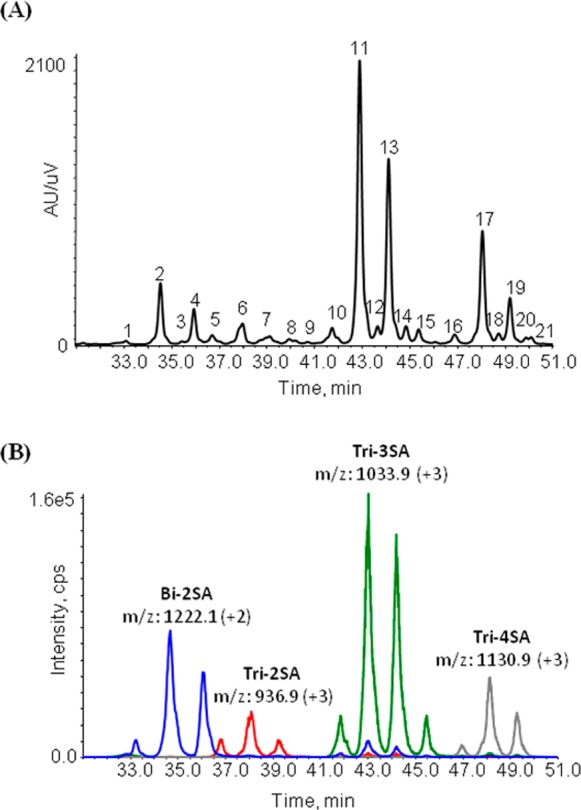
Human serum has received considerable attention in the glycomic field as a rich source of structurally and functionally diverse glycoproteins,33−37 which are potential biomarkers for numerous conditions. The released glycan pool from human serum contains over 120 different N-glycan structures;38 consequently, many glycans coelute. For instance, the Q1MS full scan showed that the Bi-SA glycan (m/z at 1076.5) and the Man-9 glycan (m/z at 1052.0, which represents the glycan composition of Man9GlcNAc2) are coeluting at a retention time of 30.5 min with the LC conditions used in this study (Figure 5). However, due to the difference of their molecular weights, these two glycans produce two different SRM traces, enabling quantitation of both species. The use of MS detection also adds a level of confidence in the identity of the species being quantitated, as well as indicating peaks that result from overlapping glycans, where the quantitative results will be suspect. For the human serum sample, identity of the SA linkage isomers was determined based on a combination of mass and retention time. The relative quantity of the individual glycan isomers was calculated relative to the SRM response for glycans with the same composition, as shown in Table 1. The ability to chromatographically resolve SA linkage isomers coupled with SRM detection permits the identification and relative quantitation of N-glycan SA α2-3/2-6 linkage isomers.
Figure 5.

(A) UV Chromatogram for detection of ProA-labeled N-glycans from human serum; (B) MS spectrum for the selected peak (indicated by the star), showing the coelution of several different glycans. Man9 corresponds to the high mannose glycan with a composition of Man9GlcNAc2.
Conclusions
A novel hydroxylated Fused-Core silica material has high utility for HILIC separation of reducing terminus labeled N-linked glycans. With the developed method, baseline separation was achieved for N-glycan isomers with α2-3/2-6 SA linkages, which facilitated the structure identification and quantitation of each isomer via LC-SRM analysis. The current method has been used for relative quantitation of SA linkage isomers of individual glycoproteins, and for N-glycans from human serum. Resolution and quantitation of these glycans may assist in early diagnosis of certain pathologies, based on previous observations of altered α2-3 and α2-6 SA linkage quantities.
Acknowledgments
Research reported in this publication was supported by the National Institute of General Medical Sciences of the National Institutes of Health under Award Numbers P41RR018502 (RO), R41GM104631-01 (RO) and R44GM093747-02 (BB). The content is solely the responsibility of the authors and does not necessarily represent the official views of the National Institutes of Health.
Supporting Information Available
Chromatograms from Sialidase S digestions for Tri-2SA, Tri-3SA, and Tri-4SA fractions by SRM detection; diagrams depicting the glycan linkage/branching isomers; tables of SRM transitions for sialidase S digestion of fetuin N-glycan studies and the p-values obtained from independent two-tailed Student’s t-test of the difference between the relative quantitation using UV and SRM detection. This material is available free of charge via the Internet at http://pubs.acs.org.
The authors declare no competing financial interest.
Funding Statement
National Institutes of Health, United States
Supplementary Material
References
- Marino K.; Bones J.; Kattla J. J.; Rudd P. M. Nat. Chem. Biol. 2010, 610713–723. [DOI] [PubMed] [Google Scholar]
- Chen X.; Varki A. ACS Chem. Biol. 2010, 52163–176. [DOI] [PMC free article] [PubMed] [Google Scholar]
- Varki A. Proc. Natl. Acad. Sci. U. S. A. 2010, 107Suppl 28939–8946. [DOI] [PMC free article] [PubMed] [Google Scholar]
- Bertozzi C. R.; Freeze H. H.; Varki A.; Esko J. D.. Glycans in Biotechnology and the Pharmaceutical Industry. In Essentials of Glycobiology, 2nd ed.; Varki A.; Cummings R. D., Esko J. D., Freeze H. H., Stanley P., Bertozzi C. R., Hart G. W., Etzler M. E.; Eds.; Cold Spring Harbor Laboratory Press: Cold Spring Harbor, NY, 2009; Chapter 51. [PubMed] [Google Scholar]
- Varki N. M.; Varki A. Lab. Invest. 2007, 879851–857. [DOI] [PMC free article] [PubMed] [Google Scholar]
- Varki A.; Schauer R.. Sialic Acids. In Essentials of Glycobiology, 2nd ed.; Varki A.; Cummings R. D., Esko J. D., Freeze H. H., Stanley P., Bertozzi C. R., Hart G. W., Etzler M. E.; Eds.; Cold Spring Harbor Laboratory Press: Cold Spring Harbor, NY, 2009; Chapter 14. [Google Scholar]
- Kahlert C.; Lahes S.; Radhakrishnan P.; Dutta S.; Mogler C.; Herpel E.; Brand K.; Steinert G.; Schneider M.; Mollenhauer M.; Reissfelder C.; Klupp F.; Fritzmann J.; Wunder C.; Benner A.; Kloor M.; Huth C.; Contin P.; Ulrich A.; Koch M.; Weitz J. Clin. Cancer Res. 2011, 17247654–7663. [DOI] [PubMed] [Google Scholar]
- Chen F.; Puig M.; Yermilov I.; Malin J.; Schneider E. C.; Epstein A. M.; Kahn K. L.; Ganz P. A.; Gibbons M. M. Cancer 2011, 117153311–3321. [DOI] [PubMed] [Google Scholar]
- Tsuji S. J. Biochem. 1996, 12011–13. [DOI] [PubMed] [Google Scholar]
- Wang P. J. Cancer Mol. 2005, 1273–81. [Google Scholar]
- Hedlund M.; Ng E.; Varki A.; Varki N. M. Cancer Res. 2008, 682388–394. [DOI] [PubMed] [Google Scholar]
- Lin S.; Kemmner W.; Grigull S.; Schlag P. M. Exp. Cell Res. 2002, 2761101–110. [DOI] [PubMed] [Google Scholar]
- Pousset D.; Piller V.; Bureaud N.; Monsigny M.; Piller F. Cancer Res. 1997, 57194249–4256. [PubMed] [Google Scholar]
- Dall’Olio F.; Chiricolo M.; Lau J. T. Int. J. Cancer 1999, 812243–247. [DOI] [PubMed] [Google Scholar]
- Wang P. H.; Lee W. L.; Lee Y. R.; Juang C. M.; Chen Y. J.; Chao H. T.; Tsai Y. C.; Yuan C. C. Gynecol. Oncol. 2003, 893395–401. [DOI] [PubMed] [Google Scholar]
- Recchi M. A.; Hebbar M.; Hornez L.; Harduin-Lepers A.; Peyrat J. P.; Delannoy P. Cancer Res. 1998, 58184066–4070. [PubMed] [Google Scholar]
- Zaia J. OMICS 2010, 144401–418. [DOI] [PMC free article] [PubMed] [Google Scholar]
- Wuhrer M. Glycoconjugate J. 2013, 30111–22. [DOI] [PMC free article] [PubMed] [Google Scholar]
- Alley W. R. Jr.; Novotny M. V. J. Proteome Res. 2010, 963062–3072. [DOI] [PMC free article] [PubMed] [Google Scholar]
- Ali L.; Kenny D. T.; Hayes C. A.; Karlsson N. G. Metabolites 2012, 24648–666. [DOI] [PMC free article] [PubMed] [Google Scholar]
- Mechref Y.; Kang P.; Novotny M. V. Rapid Commun. Mass Spectrom. 2006, 2081381–1389. [DOI] [PMC free article] [PubMed] [Google Scholar]
- Forsman H.; Andreasson E.; Karlsson J.; Boulay F.; Rabiet M. J.; Dahlgren C. J. Immunol. 2012, 1892629–637. [DOI] [PubMed] [Google Scholar]
- Jensen P. H.; Karlsson N. G.; Kolarich D.; Packer N. H. Nat. Protoc. 2012, 771299–1310. [DOI] [PubMed] [Google Scholar]
- Afifi H.; Karlsson G.; Heenan R. K.; Dreiss C. A. J. Colloid Interface Sci. 2012, 3781125–134. [DOI] [PubMed] [Google Scholar]
- Alwis G.; Karlsson C.; Stenevi-Lundgren S.; Rosengren B. E.; Karlsson M. K. Calcif. Tissue Int. 2012, 903174–185. [DOI] [PubMed] [Google Scholar]
- Klapoetke S.; Zhang J.; Becht S.; Gu X.; Ding X. J. Pharm. Biomed. Anal. 2010, 533315–324. [DOI] [PubMed] [Google Scholar]
- Melmer M.; Stangler T.; Schiefermeier M.; Brunner W.; Toll H.; Rupprechter A.; Lindner W.; Premstaller A. Anal. Bioanal. Chem. 2010, 3982905–914. [DOI] [PubMed] [Google Scholar]
- Townsend R. R.; Hardy M. R.; Cumming D. A.; Carver J. P.; Bendiak B. Anal. Biochem. 1989, 18211–8. [DOI] [PubMed] [Google Scholar]
- Nakano M.; Saldanha R.; Gobel A.; Kavallaris M.; Packer N. H. Mol. Cell Proteomics 2011, 1011M111.009001. [DOI] [PMC free article] [PubMed] [Google Scholar]
- Anumula K. R.; Dhume S. T. Glycobiology 1998, 87685–94. [DOI] [PubMed] [Google Scholar]
- Nakano M.; Kakehi K.; Tsai M. H.; Lee Y. C. Glycobiology 2004, 145431–41. [DOI] [PubMed] [Google Scholar]
- Bendiak B.; Harris-Brandts M.; Michnick S. W.; Carver J. P.; Cumming D. A. Biochemistry 1989, 28156491–6499. [DOI] [PubMed] [Google Scholar]
- Kyselova Z.; Mechref Y.; Al Bataineh M. M.; Dobrolecki L. E.; Hickey R. J.; Vinson J.; Sweeney C. J.; Novotny M. V. J. Proteome Res. 2007, 651822–1832. [DOI] [PMC free article] [PubMed] [Google Scholar]
- Kirmiz C.; Li B.; An H. J.; Clowers B. H.; Chew H. K.; Lam K. S.; Ferrige A.; Alecio R.; Borowsky A. D.; Sulaimon S.; Lebrilla C. B.; Miyamoto S. Mol. Cell. Proteomics 2007, 6143–55. [DOI] [PubMed] [Google Scholar]
- Leiserowitz G. S.; Lebrilla C.; Miyamoto S.; An H. J.; Duong H.; Kirmiz C.; Li B.; Liu H.; Lam K. S. Int. J. Gynecol. Cancer 2008, 183470–475. [DOI] [PMC free article] [PubMed] [Google Scholar]
- Chen C. C.; Engelborghs S.; Dewaele S.; Le Bastard N.; Martin J. J.; Vanhooren V.; Libert C.; De Deyn P. P. Rejuvenation Res. 2010, 134439–444. [DOI] [PubMed] [Google Scholar]
- Kamiyama T.; Yokoo H.; Furukawa J.; Kurogochi M.; Togashi T.; Miura N.; Nakanishi K.; Kamachi H.; Kakisaka T.; Tsuruga Y.; Fujiyoshi M.; Taketomi A.; Nishimura S.; Todo S. Hepatology 2013, 5762314–2325. [DOI] [PubMed] [Google Scholar]
- Aldredge D.; An H. J.; Tang N.; Waddell K.; Lebrilla C. B. J. Proteome Res. 2012, 1131958–1968. [DOI] [PMC free article] [PubMed] [Google Scholar]
Associated Data
This section collects any data citations, data availability statements, or supplementary materials included in this article.