

Abstract
Mycobacterium tuberculosis has a remarkable ability to persist within the human host as a clinically inapparent or chronically active infection. Fatty acids are thought to be an important carbon source used by the bacteria during long term infection. Catabolism of fatty acids requires reprogramming of metabolic networks, and enzymes central to this reprogramming have been targeted for drug discovery. Mycobacterium smegmatis, a nonpathogenic relative of M. tuberculosis, is often used as a model system because of the similarity of basic cellular processes in these two species. Here, we take a quantitative proteomics-based approach to achieve a global view of how the M. smegmatis metabolic network adjusts to utilization of fatty acids as a carbon source. Two-dimensional liquid chromatography and mass spectrometry of isotopically labeled proteins identified a total of 3,067 proteins with high confidence. This number corresponds to 44% of the predicted M. smegmatis proteome and includes most of the predicted metabolic enzymes. Compared with glucose-grown cells, 162 proteins showed differential abundance in acetate- or propionate-grown cells. Among these, acetate-grown cells showed a higher abundance of proteins that could constitute a functional glycerate pathway. Gene inactivation experiments confirmed that both the glyoxylate shunt and the glycerate pathway are operational in M. smegmatis. In addition to proteins with annotated functions, we demonstrate carbon source-dependent differential abundance of proteins that have not been functionally characterized. These proteins might play as-yet-unidentified roles in mycobacterial carbon metabolism. This study reveals several novel features of carbon assimilation in M. smegmatis, which suggests significant functional plasticity of metabolic networks in this organism.
The genus Mycobacterium comprises more than 100 known species of obligate and opportunistic pathogens as well as nonpathogenic saprophytes such as Mycobacterium smegmatis, which shares many characteristics with its pathogenic relatives (1, 2). Because of its similarity in basic cellular processes and the ease and safety in handling nonpathogenic bacteria, M. smegmatis is widely used as a model system for pathogenic Mycobacterium tuberculosis. These organisms share a common framework of carbon metabolism that is complemented with additional reactions and pathways suiting their pathogenic and saprophytic lifestyles. Although the M. smegmatis genome has been sequenced, understanding the many cellular processes is limited by the fact that a large number of genes, many of which are unique to mycobacteria, have not been functionally annotated. Furthermore, genes encoding proteins that mediate specialized functions may be expressed only in response to specific environmental cues. These gaps in our current understanding of mycobacterial metabolism warrant genome-scale studies aimed at delineating the adaptive mechanisms employed under specific growth conditions (3–6).
Comparative proteome profiling is a powerful tool for investigating differences in global protein abundance that occur in response to different environmental stimuli (7, 8), and it can provide new insights into the metabolic and regulatory pathways involved in adaptation to the associated stimuli (9–11). Stable isotope dimethyl labeling is a technique that allows precise quantitative mass spectrometry-based analysis of proteome-wide changes within an organism (12, 13). Here, we demonstrate that this technique can also be exploited for deep mining of mycobacterial proteomes and simultaneous comparative analysis of proteomes originating from up to three different experimental conditions. We demonstrate this comparative approach by quantitative analysis of the M. smegmatis proteome in bacterial cells grown with one of three different carbon sources representing glycolytic (glucose) or gluconeogenic (acetate and propionate) substrates. Acetate and propionate are the immediate downstream products of fatty acid β-oxidation, a committed pathway for entry of long-chain fatty acids into the central carbon-metabolizing network.
Using this approach, we identified 3,067 proteins in M. smegmatis with high confidence using at least two unique peptides per protein. Among the proteins that we identified, 162 proteins showed differential abundance in cells grown with either acetate or propionate as the carbon source compared with glucose-grown cells. The majority of these proteins clustered within the functional category related to energy metabolism, providing new insights into how these carbon sources are assimilated in M. smegmatis. An interesting feature that emerges from this study is the plasticity of metabolic networks in M. smegmatis, where multiple pathways can be co-utilized for assimilation of the same metabolite. This finding, along with the recent demonstration that mycobacteria can co-catabolize multiple carbon sources (14), underscores the flexibility and metabolic potential of M. smegmatis. In the future, this approach could be used to explore the metabolic adaptations that play a role in growth of M. tuberculosis on fatty acid substrates, which are thought to be an important carbon source for the bacteria in the lungs of the infected host (5, 6, 15, 16).
EXPERIMENTAL PROCEDURES
Bacterial Strains and Culture Conditions
M. smegmatis mc2155 (wild type) and derivative strains were cultured to late exponential phase (A600nm 1.0–1.3) in M9 minimal media containing 6.78 g/liter Na2HPO4, 3 g liter−1 NaH2PO4, 0.5 g liter−1 NaCl, 1 g liter−1 NH4Cl, and glucose or acetate or propionate as the carbon source using standard protocols (17). Carbon equivalency was maintained by using 25 mm glucose, 75 mm sodium acetate, and 50 mm sodium propionate as the carbon source. Antibiotics were used at the following concentrations: kanamycin (15 μg ml−1) and hygromycin (50 μg ml−1). All reagents, unless specified, were from Sigma-Aldrich.
Construction of Mutant and Complemented Strains of M. smegmatis
In-frame unmarked (nonpolar) deletions of msmeg_3640 (glcB) and msmeg_5476 (gcl) ORFs were constructed in the M. smegmatis chromosome by a two-step (insertion-excision) homologous recombination strategy. The suicide plasmid for generating the ΔglcB strain contained the glcB allele with an in-frame deletion in the glcB ORF and the flanking ∼500-bp sequences (18). The Δgcl deletion strains were constructed on the wild-type and ΔglcB genetic backgrounds; the upstream and downstream recombination regions were constructed by PCR amplification using oligonucleotide combinations 126 + 127 and 128 + 129, respectively (supplemental Table S1). The upstream arm was cloned with PacI and AvrII sites, and the downstream arm was cloned with AvrII and AscI sites. The fragments were ligated together into the unique PacI and AscI sites of pJG1111 (19) to generate pTC223. pTC223 was inserted into the M. smegmatis chromosome by electroporation, and transformants were selected on LB agar containing hygromycin (50 μg ml−1), kanamycin (15 μg ml−1), and X-Gal (40 μg ml−1). Blue colonies were individually picked and subcultured in 7H9 medium (no antibiotics) to allow plasmid excision, and serial dilutions of the cultures were plated on LB plates containing X-Gal (40 μg ml−1) and 5% sucrose. White colonies were individually picked and amplified in 7H9 medium for genomic DNA isolation and PCR analysis to screen for gene deletion strains. Deletion strains were confirmed by PCR analysis and Southern blotting (GE Healthcare) following the manufacturer's instructions (supplemental Figs. S1 and S2). The complementation strain (ΔglcB Δgcl attB::pgcl) was generated by introducing the single-copy integrating plasmid pTC224 into the ΔglcB Δgcl strain by electroporation, followed by selection of transformants on LB agar containing hygromycin. Plasmid pTC224 contains the gcl ORF (PCR-amplified using oligonucleotide combination 134 + 135, supplemental Table S1) cloned in the unique NheI and ScaI restriction sites and expresses gcl from a tetracycline-inducible promoter. For experiments involving expression of gcl from pTC224, anhydrotetracycline (10 ng ml−1) was included in the culture medium.
Protein Extraction and Quantification
Cells were collected by centrifugation (3,500 × g for 15 min), and cell pellets were washed with Tris-buffered saline + 0.02% tyloxapol, followed by a single wash with Tris-buffered saline alone at 4 °C. Washed cell pellets were resuspended in 50 mm Tris-HCl, pH 8.0, 10% glycerol, 1× protease inhibitor (Roche Applied Science), 1× phosphatase inhibitor (Pierce) and disrupted at 4 °C by six 15-s sonication cycles (Vibracell 75186, Bioblock Scientific) at amplitude 60% with 30-s rests between cycles. Urea was added to a final concentration of 2 m, and lysates were incubated at 4 °C for 1 h and then clarified by centrifugation at 15,000 × g for 20 min at 4 °C. Protein concentration was estimated with a BCA protein quantification kit (Thermo Scientific) with BSA standards prepared in the same buffer. Integrity of the samples was checked by SDS-PAGE before proceeding to LC-MS/MS analysis. This was done by resolving 10 μg of all lysates on an SDS-polyacrylamide gel, followed by visual confirmation of the accuracy of protein quantification after Coomassie staining. Absence of protein degradation, sharpness of protein bands, and uniform intensity of major bands across all lysates were considered as indicators of sample integrity.
In-solution Digestion
Each sample (10 μg) was reconstituted in 50 μl of 4 m urea + 10% acetonitrile (Biosolve) and buffered with Tris-HCl, pH 8.5, at a final concentration of 30 mm. Reduction was performed with 10 mm dithioerythritol (Merck-Millipore) at 37 °C for 1 h with constant shaking (600 rpm). Samples were again buffered to pH 8.5 with Tris, pH 10–11, and alkylation was performed with 40 mm iodoacetamide at 37 °C for 45 min with constant shaking in a light-protected environment. Reactions were quenched by addition of dithioerythritol to a final concentration of 10 mm. A first digestion step was performed using Lys-C (Wako; 1:50 enzyme/protein) for 2 h at 37 °C. Samples were then diluted 5-fold with 50 mm ammonium bicarbonate, and a second digestion was performed overnight at 37 °C using modified mass spectrometry grade trypsin gold (Promega; 1:50 enzyme/protein) and 10 mm CaCl2. Reactions were stopped by addition of 2 μl of pure formic acid (Merck-Millipore), and samples were concentrated by vacuum centrifugation to a final volume of about 70 μl.
Dimethyl Labeling of Peptides
Samples were dimethyl-labeled using a previously described protocol (12) with minor modifications. In the “forward” experiments (two experimental repeats), the sample from acetate-grown cells was labeled with light dimethyl reactants (CH2O + NaBH3CN); the sample from glucose-grown cells was labeled with medium dimethyl reactants (CD2O (Cambridge Isotope Laboratories) + NaBH3CN), and the sample from propionate-grown cells was labeled with heavy dimethyl reactants (13CD2O (Cambridge Isotope Laboratories) + NaBD3CN). All labeling reagents were prepared in phosphate buffer. In the “reverse” experiments (two experimental repeats), the labeling of the acetate and propionate samples was reversed, and the labeling of the glucose sample was kept the same. Labeling was achieved using a variation of the protocol based on the Stage Tip procedure (20). Briefly, Stage Tips were prepared by cutting out three discs from an EmporeTM C18 (3 m) filter using a blunt-ended needle, followed by placing them in a P200 pipette tip using a plunger. The Stage Tips were washed twice with 90% acetonitrile and conditioned three times with 0.1% trifluoroacetic acid (TFA, Pierce). Acidified samples were loaded and then washed twice with 0.1% TFA. Stage Tips were flushed five times with freshly prepared labeling solutions and then washed three times with 0.1% TFA. All labeling steps were performed using a bench-top centrifuge (100 × g). Elution was performed first with 90% acetonitrile containing 0.1% TFA and then with 80% acetonitrile containing 10% trifluoroethanol and 0.1% TFA. Samples were mixed in a 1:1:1 (light/medium/heavy) ratio and dried by vacuum centrifugation.
Strong Anion Exchange (SAX) Fractionation
SAX fractionation was performed using a previously described protocol (21) with minor modifications. Briefly, Stage Tips were prepared by placing six layers of a 3M EmporeTM anion exchange disk (3M) into a P200 pipette tip. All fractionation steps were performed using a benchtop centrifuge (500 × g). Britton & Robinson SAX buffers (20 mm acetic acid, 20 mm boric acid (Applichem), 20 mm phosphoric acid) were freshly prepared and titrated to the desired pH values (pH 2, 4–6, 8, and 11) with NaOH. Stage Tips were conditioned with 100% methanol followed by a single wash with 1 m NaOH and four washes with phosphoric acid buffer at pH 11. Samples were reconstituted in buffer at pH 11 and loaded onto the SAX Stage Tips. The loading flow-through as well as the pH step elutions (in decreasing order of pH) were directly captured on EmporeTM C18 Stage Tips. Each collected fraction was washed with 0.1% TFA and eluted first with 90% acetonitrile containing 0.1% TFA and then with 80% acetonitrile containing 10% trifluoroethanol and 0.1% TFA. The eluted fractions were dried by vacuum centrifugation and used for LC-MS/MS analysis.
LC-MS/MS Analysis
Each SAX fraction was resuspended in 2% acetonitrile containing 0.1% formic acid for LC-MS/MS injections. Reverse phase separations were performed on a Dionex Ultimate 3000 RSLC nano-UPLC system (Thermo Fisher Scientific) connected on line with an Orbitrap Elite Mass Spectrometer (Thermo Fisher Scientific) piloted with Xcalibur (version 2.1) and Tune (version 2.5.5). A homemade nano-ESI source and a noise reduction system (Active Background Ion Reduction Device) were used to generate stable spray. Samples were trapped for 10 min at a flow rate of 3 μl min−1 in 0.1% TFA on a homemade capillary pre-column (Magic AQ C18; 3 μm to 200 Å; 2 cm × 100 μm inner diameter) and then separated on a C18 tip-capillary column (Nikkyo Technos Co; Magic AQ C18; 3 μm to 100 Å; 15 cm × 75 μm inner diameter) at 250 nl min−1. A long and shallow gradient (235 min) was performed ranging first from 99% A (2% acetonitrile, 0.1% formic acid) to 23% B (90% acetonitrile, 0.1% formic acid) in 130 min, then up to 42% B in 60 additional min, and finally up to 80% B in 35 min. Samples were analyzed in data-dependent acquisition mode with a dynamic exclusion of 40 s and a relative mass window of 10 ppm. The 20 most intense parent ions from each MS survey scan (m/z 300–1800) were selected and fragmented by collision-induced dissociation into the linear ion trap. Orbitrap MS survey scan resolution was set at 60,000 (at 400 m/z), and fragments were acquired at low resolution in centroid mode. The filling time in MS mode was set at 200 ms with a limitation of 1 × 10⁶ ions, whereas the filling time for fragments recording was set at 100 ms with a limitation of 1 × 10⁴ ions. Singly charged ions were excluded, and a threshold of 500 counts was applied to trigger the fragmentation. Source spray voltage was set at 1.9 kV, and capillary temperature at 200 °C. During fragmentation, an activation Q value of 0.25 was used, and normalized collision energy was set at 35% for 10 ms.
Protein Identification, Quantification, and Bioinformatic Analysis
Raw files were processed using MaxQuant Version 1.3.0.5 (22) with its internal search engine Andromeda (23). MS/MS spectra were searched against the M. smegmatis strain mc2155 database release 1 (July, 2010) containing 6,715 sequences (24). MaxQuant generates a decoy database containing common contaminants. A threshold of 1% false discovery rate was fixed at the peptide and protein level. Mass spectra were searched with an initial mass tolerance of 6 ppm in MS mode and 0.5 Da in MS/MS mode. Up to two missed cleavages were allowed, and carbamidomethylation was set as a fixed modification. Oxidation (Met), phosphorylation (Ser, Thr, and Tyr), and acetylation (protein N terminus) were considered as variable modifications. A minimum of seven amino acids was required as peptide length, and at least two (unique + razor) peptides were required for protein identification. Razor peptides are nonunique peptides assigned to the protein group with the most assigned peptides. Reverse and contaminant sequences were removed, and proteins with a posterior error probability lower than 0.1 were accepted for further analysis. Protein quantification was performed with razor and unique peptides using only unmodified, oxidized (Met), and acetylated (protein N terminus) peptides, and a minimum of two ratio counts was required for quantification. To obtain relative quantification within different conditions, significance B (SignB) values were calculated for each of the identified proteins using Perseus, the MaxQuant statistical tool (22). Further statistical treatments and graphical displays were performed using homemade programs written in R (25), which are available upon request. The identified proteins were classified into various functional categories according to JCVI annotations for M. smegmatis. To evaluate the term enrichment of the proteins showing differential abundance in comparison with the globally identified proteins, we calculated the probability of a functional category being present in the subpopulation only at levels expected by random chance, under the hypergeometric distribution, in R (26). Functional categories with an adjusted p value of <0.05 were considered as significant, corresponding to a false discovery rate of 5% (27). All pathways were drawn with the help of Kyoto Encyclopedia of Genes and Genomes pathway maps (28).
Two-dimensional PAGE Analysis
Low resolution two-dimensional PAGE analysis was carried out using the following protocol. First-dimensional separation of proteins was performed according to the manufacturer's (Invitrogen) recommendations using IPG strips (ZOOM strips, pH 4–7, Invitrogen) in ZOOM IPGRunner system (Invitrogen). Briefly, 100 μg of total protein lysate was diluted in IEF buffer and applied onto an IPG strip, followed by rehydration for 2 h. After rehydration, ZOOM IPGRunner mini-cell was assembled, and IEF was performed using the following running conditions: 200 V for 70 V-h; 450 V for 120 V-h; 750 V for 200 V-h; and 2000 V for 3500 V-h. Before the second dimension, the strips were incubated in sequence with equilibration buffer containing reducing (DTT) and alkylating (iodoacetamide) agents. Equilibrated strips were applied onto a NuPAGE Novex 4–12% BisTris ZOOM protein gel, and spots were resolved in the second dimension in MES running buffer (Invitrogen) according to the manufacturer's instructions. The gels were stained with Coomassie Brilliant Blue R-250.
RESULTS AND DISCUSSION
Quantitative Proteomic Analysis of Bacteria Grown on Different Carbon Substrates
Stable isotope dimethyl labeling and mass spectrometry were used to quantify the relative abundance levels of M. smegmatis proteins during growth on glucose, acetate, or propionate as the sole carbon source (Fig. 1). To achieve substantial coverage and quantitative accuracy, we repeated the entire analysis in four independent experiments. To rule out the possibility that any changes observed were due to incorporation of specific labels (light/medium/heavy) in a particular condition, labels were also interchanged between acetate and propionate conditions in two of these experimental repeats (referred to as reverse experiments). A high degree of reproducibility was observed, and 2,570 proteins were identified in all four experimental repeats. An additional 333 proteins were identified in at least three out of the four repeats (supplemental Fig. S3). Many peptides were phosphorylated (supplemental Table S2). Protein phosphorylation and dephosphorylation are known to regulate the activities of many enzymes, and this mechanism of post-translational regulation is widespread (29–31). The activities of some of the phosphoproteins identified in this study might be regulated by similar phospho-switching mechanisms, but confirmation will require targeted analysis. Each of the identified proteins was categorized by functional classification according to the JCVI annotation, and coverage was obtained across most of the functional categories within the M. smegmatis genome.
Fig. 1.
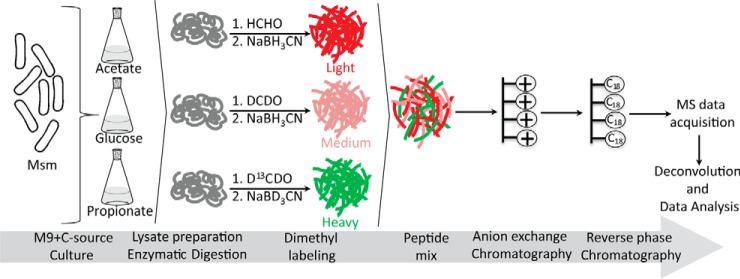
Schematic of strategy to identify differentially abundant proteins using dimethyl labeling and mass spectrometry. Bacteria were cultured on M9 minimal medium containing glucose, acetate, or propionate as the sole carbon source. In forward experiments, the labeling pattern was as depicted in the diagram. In reverse experiments, the labels on the acetate and propionate samples were swapped.
To obtain relative quantification of each of the identified proteins during growth on acetate or propionate as the carbon source, SignB values for each of these proteins were calculated and proteins having a SignB value of less than 0.05 were considered as differentially abundant. Quantification was accepted only if similar behavior was observed in at least three out of four experimental repeats. Using glucose-grown cells as the reference for comparison, we identified 107 differentially abundant proteins in lysates from acetate-grown cells and 125 differentially abundant proteins in lysates from propionate-grown cells. These changes indicate significant adaptation of the mycobacterial proteome to these two carbon sources. Proteins showing differential abundance were distributed among multiple functional categories (Fig. 2 and supplemental Fig. S4). A complete list of all proteins within each of the functional categories, along with their relative abundance pattern and sequence coverage, is provided in supplemental Table S3. To identify functional categories that show over-representation during growth on acetate or propionate compared with glucose, we subjected the data to enrichment analysis. Proteins within the functional categories of “Energy Metabolism” and “Transport and Binding Proteins” were enriched and included many metabolic enzymes within these categories (Fig. 2 and supplemental Table S3).
Fig. 2.

Functional classification of quantified proteins. Quantified proteins were categorized into functional categories (gray bars) according to JCVI annotations. The numbers of proteins showing differential protein abundance in acetate/glucose or propionate/glucose comparisons are indicated by black shading within the bar for each functional category. Under the hypergeometric distribution, only two functional categories (“Energy Metabolism” and “Transport and Binding proteins”, labeled with an asterisk) were significantly enriched (false discovery rate of 5%) in the subpopulation of differentially abundant proteins in comparison with the total population of quantified proteins.
A scatterplot of propionate/glucose ratios versus acetate/glucose ratios provides an overall picture of the proteome-wide changes associated with growth on different carbon substrates and highlights proteins that show significant differential abundance (Fig. 3). Growth on propionate was associated with higher abundance of proteins involved in the methylcitrate cycle and gluconeogenesis, as well as of isocitrate lyase 1 (Icl1), the gatekeeper enzyme of the glyoxylate shunt. Growth on acetate was associated with higher abundance of Icl1, but surprisingly, no change in abundance was seen for GlcB, the sole malate synthase homologue in M. smegmatis. Instead, we observed higher abundance of proteins that could potentially constitute a functional glycerate pathway. Both malate synthase (glyoxylate shunt) and glyoxylate carboligase (glycerate pathway) mediate anaplerotic functions by carrying out assimilation of glyoxylate, one of the reaction products of isocitrate lyase catalysis. Below, we demonstrate that M. smegmatis has the potential to utilize both the glyoxylate shunt and the glycerate pathway for assimilation of acetate. Another surprising observation was the increased abundance of proteins involved in the Entner-Doudoroff (ED) pathway during growth on glucose as the carbon source. Absence of the glycerate and ED pathways in pathogenic M. tuberculosis underscores the expanded metabolic potential of M. smegmatis, a saprophytic organism, as compared with its pathogenic relative (32). In subsequent sections, we discuss specific aspects of assimilation of the three carbon substrates (glucose, acetate, and propionate) in light of our comparative proteome analysis.
Fig. 3.

Scatterplot depicting differential abundance of proteins in propionate/glucose and acetate/glucose comparisons. Each dot represents one protein. Colored protein spots have significant normalized ratios with a SignB value <0.05 in at least three out of four independent experimental repeats. Purple, higher abundance in both acetate and propionate compared with glucose. Brown, lower abundance in both acetate and propionate compared with glucose. Red, higher abundance in acetate compared with glucose. Orange, lower abundance in acetate compared with glucose. Blue, higher abundance in propionate compared with glucose. Green, lower abundance in propionate compared with glucose. Light green, lower abundance in propionate and higher abundance in acetate, both compared with glucose. For clarity, only proteins of special interest are indicated. A more precise representation of the behavior of the proteins with asterisks is provided in supplemental Table S4. The inset shows a magnification of the boxed region of the plot. Data from a single representative experiment are shown. This experiment was repeated four times with similar results.
Quantitative Accuracy of Proteomics Measurements
We used two different strategies to assess the quantitative accuracy of protein measurements in our experiments. In the first strategy, we ran one-dimensional and low resolution two-dimensional polyacrylamide gels with equal amounts of samples corresponding to each carbon source and identified proteins that showed higher abundance by mass spectrometry. Coomassie-stained one-dimensional gels of these lysates revealed higher abundance of multiple proteins in the lysates from acetate- and propionate-grown cells (supplemental Fig. S5). These lysates were further resolved on two-dimensional gels, and the differentially expressed proteins were identified by liquid chromatography coupled to mass spectrometry (LC-MS/MS). Two proteins that showed higher abundance in both acetate and propionate growth conditions were identified as aconitate hydratase I (AcnA, MSMEG_3143) and isocitrate lyase 1 (Icl1, MSMEG_0911). Analysis of two more spots from the propionate gel also revealed higher abundance of methylcitrate synthase (PrpC, MSMEG_6647) and 2-methylcitrate dehydratase (PrpD, MSMEG_6645), enzymes that play key roles in propionate metabolism (17). Comparison with our quantitative proteomics results confirmed a similar pattern of higher abundance for these proteins in acetate- and propionate-grown cells (supplemental Table S3).
In the second strategy, we constructed a reporter strain of M. smegmatis in which three metabolic proteins are epitope-tagged as follows: Icl1 with FLAG tag; isocitrate lyase 2 (Icl2, MSMEG_3706) with c-Myc tag; and isocitrate dehydrogenase (Icd, MSMEG_1654) with HA tag. The triple reporter strain was cultured in medium with glucose, acetate, or propionate as the carbon source, and whole-cell lysates were immunoblotted with anti-FLAG, anti-c-Myc, and anti-HA antibodies. Consistent with our results from proteomics experiments, we observed increased abundance of Icl1 in both acetate and propionate growth conditions and no change for Icd in any of the conditions tested (supplemental Fig. S6). These data validate the results obtained from our quantitative proteomics analysis and indicate that we were able to quantify a large fraction of the M. smegmatis proteome with high stringency. A complete list of the identified/quantified proteins and quantitative data are provided in supplemental Table S4.
Glucose Metabolism
Glucose plays a central role in the biology of many organisms and must be synthesized de novo (gluconeogenesis) if it is not available from environmental sources. In this study, we compared the proteomes of glucose-grown bacteria to bacteria grown on the gluconeogenic substrates acetate or propionate. We reasoned that proteins showing a similar abundance pattern in both glucose/acetate and glucose/propionate comparisons might provide insights into the glucose assimilation network (supplemental Table S5). In M. smegmatis, it has been suggested that uptake of glucose occurs through constitutive expression of the glucose transporters, and two transport systems have been predicted as follows: the glucose symporter GlcP (MSMEG_4182) and a glucose-specific phosphotransferase system (MSMEG_2116-2120) (33). No mRNA transcript of glcP was detected in RT-PCR experiments with bacteria grown in glucose as a carbon source (33); consistent with this observation, our proteome analysis did not identify GlcP as an expressed protein. In contrast, we identified and quantified three proteins belonging to the putative glucose-specific phosphotransferase system (MSMEG_2117–2119), which were present at similar levels in glucose-, acetate-, and propionate-grown cells. Surprisingly, growth on glucose was associated with higher abundance of proteins predicted to be involved in transport of ribose, xylose, glycerol, and a protein belonging to the family of cytosine/purine/uracil/thiamine/allantoin permeases (supplemental Table S5). The most common route for intracellular degradation of glucose is the Embden-Meyerhof-Parnas (EMP) pathway (glycolysis), which produces two molecules each of pyruvate, ATP, and NADH. The only glycolytic enzyme that showed differential abundance in glucose/acetate and glucose/propionate comparisons was pyruvate kinase (MSMEG_3227), which catalyzes the irreversible step of conversion of phosphoenolpyruvate to pyruvate (orange highlighting in Fig. 4 and supplemental Fig. S7). Apart from changes in protein abundance levels, post-translational and allosteric mechanisms play an important role in modulation of enzymatic activities and thus the fluxes through various pathways. Interestingly, a recent report suggested that there is no significant difference in activity of the gluconeogenic enzyme fructose-1,6-bisphosphatase in cells grown with glucose or acetate as the carbon source (34). The same report indicated that the relative levels of glucose 6-phosphate are much higher in mycobacteria compared with other bacterial species. These observations hint that M. smegmatis might use a novel mechanism to regulate glycolytic and gluconeogenic fluxes during growth on different carbon substrates.
Fig. 4.

Pathways involved in carbon source assimilation. Highlighting indicates Embden-Meyerhof-Parnas pathway and gluconeogenic pathway (orange), pentose phosphate pathway (blue), Entner-Doudoroff pathway (yellow), glycerate pathway (green), methylcitrate and methylmalonate pathways (pink), tricarboxylic acid cycle and glyoxylate shunt (gray). Enzyme accession numbers without the “MSMEG_” prefix are adjacent to arrows indicating their associated reactions. Differentially abundant proteins are in bold green type with boxes labeled as follows: G (abundance in glucose compared with both acetate and propionate); A (abundance in acetate compared with glucose); and P (abundance in propionate compared with glucose). Color coding in each box indicates higher abundance (red), lower abundance (blue), or no difference (white). Proteins that show different trends in acetate versus glucose and propionate versus glucose are indicated as “no difference” in the G boxes. Only the quantified proteins are indicated. Metabolic pathways have been drawn according to Kyoto encyclopedia of genes and genomes pathway maps.
The pentose phosphate (PP) pathway (blue highlighting in Fig. 4 and supplemental Fig. S7) intersects with the glycolytic pathway and serves as a source of reducing power in the form of NADPH as well as 5-carbon sugar derivatives that are precursors for biosynthesis of ATP, NADH, FADH2, CoA, RNA, and DNA. Its importance in biosynthesis of these precursor metabolites makes it an essential pathway irrespective of the carbon source utilized. Depending on the cellular requirements for NADPH and precursor metabolites, ribulose 5-phosphate, a key intermediate of the PP pathway, can be converted to the glycolytic intermediates fructose 6-phosphate and glyceraldehyde 3-phosphate. We found that growth on glucose was associated with higher abundance of glucose-6-phosphate dehydrogenase (Zwf, MSMEG_0314), which dictates fluxes between the EMP and PP pathways (Fig. 4 and supplemental Fig. S7). Increased activity of this enzyme would divert higher glucose catabolic flux from the EMP pathway to the PP pathway to satisfy an increased demand for NADPH and anabolic precursors.
Another possibility is further diversion of the flux from glucose 6-phosphate into the ED pathway, as we observed higher abundance of phosphogluconate dehydratase (Edd, MSMEG_0313), an enzyme of the ED pathway, in glucose-grown cells (yellow highlighting in Fig. 4 and supplemental Fig. S7). However, radio-respirometric studies and enzymatic activity measurements suggest minimal contribution of this pathway to glucose assimilation in mycobacteria (35). A possible explanation for induction of the ED pathway during growth on glucose could be the activation of a global regulatory network that controls the assimilation of a wide range of sugars. This hypothesis is consistent with the facts that the ED pathway plays a role in the assimilation of a variety of carbohydrates, and the ED aldolase also plays a role in hexuronic acid metabolism and hydroxyproline biosynthesis (36, 37). Further support for a global regulatory network comes from the observation that proteins involved in transport of a number of alternative sugars show higher abundance during growth on glucose. Targeted studies will be necessary to dissect out the mechanisms that control the assimilation of various sugars in M. smegmatis and their relative partitioning through the EMP, PP, and ED pathways. Although the ED pathway has been suggested to play a role in adaptation and survival of several pathogenic organisms within their respective hosts (38–40), M. tuberculosis lacks homologues of the edd and eda (encoding 2-dehydro-3-deoxyphosphogluconate aldolase) genes encoding essential enzymes of the ED pathway (32).
Growth on glucose was associated with lower abundance of the glyoxylate cycle enzyme, isocitrate lyase 1 (Icl1, MSMEG_0911), the gluconeogenic enzyme phosphoenolpyruvate carboxykinase (PckA, MSMEG_0255), and the tricarboxylic acid (TCA) cycle enzymes aconitate hydratase (MSMEG_3143) and succinate dehydrogenase (MSMEG_1669 and MSMEG_1670) (gray highlighting in Fig. 4 and supplemental Fig. S7). Reduced expression of the TCA cycle enzymes in the presence of glucose is classically referred to as the “glucose effect” or “catabolite repression,” whereby glucose actively represses the expression of enzymes involved in utilization of other carbon substrates (41). However, because mycobacteria have been shown to co-utilize multiple carbon sources (14, 42), the relatively lower abundance of these enzymes in glucose-grown cells could instead reflect induction of their synthesis in the presence of other carbon sources that feed directly into the TCA cycle, such as acetate and propionate. The significance of these enzymes is discussed below. Growth on glucose was also associated with higher abundance of the DNA-binding response regulator PhoP (MSMEG_5872), which has been implicated in the biosynthesis of complex lipids (43, 44). Carbon substrate-dependent modulation of PhoP activity might be a strategy for optimizing the partitioning of carbon between basic cellular metabolism and lipid biosynthetic pathways.
Activation of Acetate and Propionate
The mechanism of uptake of acetate and propionate into bacterial cells is not clear and might involve both passive diffusion and transporter-mediated import. In this study, we did not identify any obvious candidate proteins that could play a role in active transport of either acetate or propionate. After entering cells, acetate and propionate need to be activated to their corresponding CoA thioesters before entering central metabolism. Activation of acetate can occur through two independent mechanisms as follows: (i) conversion of acetate to acetyl-phosphate by acetate kinase (AK), followed by phosphotransacetylase (PTA)-mediated conversion of acetyl-phosphate to acetyl-CoA; (ii) acetyl-CoA synthetase (ACS)-mediated1 conversion of acetate to acetyl-CoA through an acetyl-AMP intermediate (Fig. 5) (45–47). Propionate activation can also occur by either of these acetate activation pathways or by the action of a dedicated propionyl-CoA synthetase. An alternative mechanism involving CoA transferase has been implicated in acetate/propionate activation during growth of Corynebacterium glutamicum on mixed substrates, but a homologue of this enzyme is absent in mycobacterial genomes (45). Although it is relatively easy to predict the presence or absence of these genes in a particular organism, their functional role in acetate or propionate activation cannot be elucidated based on sequence analysis alone, and genetic studies have revealed that there is no “universal” strategy for acetate/propionate activation. For example, the AK-PTA pathway activates both acetate and propionate in C. glutamicum, whereas enteric bacteria primarily utilize the ACS/propionyl-CoA synthetase pathway for acetate/propionate activation (45, 48–51). Furthermore, although some organisms utilize the reversible AK-PTA pathway for acetate activation, others use the same pathway primarily for acetate secretion (48, 50, 52).
Fig. 5.
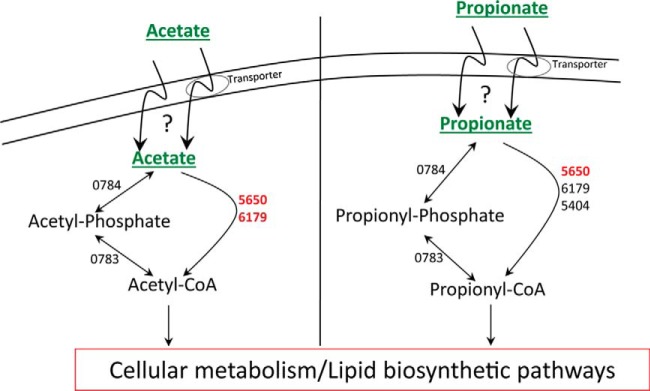
Acetate and propionate activation pathways. Proteins showing higher abundance in either acetate or propionate compared with glucose are indicated in red type; proteins that are present at similar levels in all three carbon substrates (glucose, acetate, and propionate) are indicated in black type.
M. smegmatis encodes homologues of the reversible AK-PTA pathway as well as acyl-activating enzymes that could function as ACS or propionyl-CoA synthetase (or both). Our proteomics analysis revealed that abundance of AK (MSMEG_0784) and PTA (MSMEG_0783) was similar in cells grown on glucose, acetate, or propionate as the sole carbon source. However, putative acyl-CoA synthetases were more abundant under acetate (MSMEG_5650 and MSMEG_6179) or propionate (MSMEG_5650) growth conditions (Fig. 5 and supplemental Table S3). Deletion of MSMEG_6179 in M. smegmatis indeed leads to a growth defect when acetate is used as a carbon source (53). The residual growth of this strain could be due to activation of the MSMEG_5650 or the AK-PTA pathway. Recent biochemical studies have hinted at a role of differential acylation of lysine residues in controlling the activity of acyl-activating enzymes (53–56). However, no change in the abundance pattern was observed for lysine acyltransferase (MSMEG_5458) or deacylase (MSMEG_5175) when bacteria were grown on glucose, acetate, or propionate as the carbon source.
Acetyl-CoA and propionyl-CoA perform two basic functions as follows: (i) enter central cellular metabolism for generation of energy and biosynthetic precursors, and (ii) enter pathways for biosynthesis of lipids, several of which are unique to the mycobacterial genus and might play a role in mycobacterial virulence. Acyl-CoAs are channeled directly into the cellular metabolic network, whereas lipid biosynthesis requires further carboxylation by acyl-CoA carboxylases to form malonyl-CoA from acetyl-CoA and methylmalonyl-CoA from propionyl-CoA. Polyketide synthase enzymes utilize malonyl-CoA and methylmalonyl-CoA as extender units for biosynthesis of the acyl chain of mycobacterial lipids (57). Biotin is a common cofactor for acyl-CoA carboxylases and other carboxylases involved in gluconeogenesis as well as biosynthesis of fatty acids, leucine, and isoleucine (58). We found that growth on acetate and propionate was also associated with higher abundance of enzymes involved in biosynthesis of biotin (MSMEG_3189 and MSMEG_3194) and pantothenate (MSMEG_4298 and MSMEG_1290) (59). Although biotin is an essential cofactor for many enzymes, pantothenate is involved in the biosynthesis of CoA, which is required for fatty acid activation and also provides the phosphopantetheinyl arm of the acyl carrier protein domains of fatty-acid synthase and polyketide synthase enzymes.
Acetate Metabolism
Comparison of the proteome profiles of bacteria grown in glucose or acetate identified 107 proteins that showed significant differential abundance (supplemental Fig. S8A and supplemental Table S3). Among these proteins, isocitrate lyase 1 (Icl1, MSMEG_0911) was identified as the most highly induced protein in acetate-grown cells. Isocitrate lyase is a hallmark enzyme for acetate assimilation and catalyzes cleavage of isocitrate into one molecule each of succinate and glyoxylate (gray highlighting in Fig. 4 and supplemental Fig. S9). Growth on acetate is usually accompanied by increased expression of malate synthase, which catalyzes condensation of glyoxylate with acetyl-CoA to generate malate, a TCA cycle intermediate (60–62). This reaction provides an anaplerotic shunt mechanism to avoid carbon loss by bypassing the two decarboxylative steps of the TCA cycle. Coordinated induction of both isocitrate lyase and malate synthase ensures maximal flux through this anaplerotic route and prevents accumulation of glyoxylate to toxic levels. Although Icl1 was strongly induced in acetate-grown cells, we observed no change in abundance pattern for the lone type G malate synthase (GlcB, MSMEG_3640) homologue in M. smegmatis (gray highlighting in Fig. 4 and supplemental Fig. S9). This disconnect has also been observed in M. tuberculosis, where icl1 but not glcB mRNA is up-regulated in vivo (6), in macrophages (5), and during growth on fatty acids (63). Also, the RamB transcriptional regulator controls expression of icl1 but not glcB in M. tuberculosis, whereas both genes are regulated by the RamB homologue in C. glutamicum (64). These observations suggest that the basal GlcB protein level can accommodate the increased flux through Icl1 or, alternatively, that mycobacteria might utilize alternative routes for glyoxylate assimilation.
Besides the glyoxylate shunt, two other pathways for glyoxylate assimilation have been identified in other bacteria as follows: (i) the glycerate pathway, which catalyzes conversion of glyoxylate to 3-phosphoglycerate, a glycolytic intermediate (65–67); (ii) the β-hydroxyaspartate pathway, which catalyzes conversion of glyoxylate to oxaloacetate, a TCA cycle intermediate (68, 69). Analysis of the proteomics data revealed that MSMEG_5476–5478, which correspond to the enzymes of a putative glycerate pathway, were also among the most highly abundant proteins in acetate-grown cells (supplemental Fig. S8A and supplemental Table S3). This three-gene cluster encodes homologues of glyoxylate carboligase (Gcl, MSMEG_5476), 2-hydroxy-3-oxopropionate reductase (MSMEG_5477), and hydroxypyruvate isomerase (MSMEG_5478). These proteins, together with glycerate kinase (MSMEG_2528), could potentially convert glyoxylate to 3-phosphoglycerate (green highlighting in Fig. 4 and supplemental Fig. S9).
We compared the roles of the glyoxylate shunt and glycerate pathway in acetate assimilation by analyzing the growth phenotypes of unmarked in-frame deletion strains lacking the genes encoding malate synthase (ΔglcB), glyoxylate carboligase (Δgcl), or both enzymes (ΔglcB Δgcl). All three mutant strains exhibited wild-type growth rates on glucose (Fig. 6A), whereas the ΔglcB and Δgcl strains were delayed for growth on acetate, and growth of the double mutant (ΔglcB Δgcl) was abolished (Fig. 6B). The final cell density achieved in acetate medium was higher for the Δgcl strain compared with the ΔglcB strain, suggesting that the glyoxylate shunt might be more efficient than the glycerate pathway as a route for carbon anaplerosis. Consistent with this interpretation, the malate synthase reaction fixes four carbon equivalents by condensing glyoxylate with acetyl-CoA, whereas the glyoxylate carboligase reaction fixes just three carbon equivalents, one carbon being released as CO2 during ligation of two glyoxylate molecules. Growth of the ΔglcB Δgcl strain on acetate was restored by complementation with a single copy plasmid encoding the gcl gene integrated at the chromosomal attB site, designated strain ΔglcB Δgcl attB::pgcl (Fig. 6C). These results demonstrate that M. smegmatis possesses two anaplerotic pathways for acetate assimilation, both of which require formation of glyoxylate by isocitrate lyase. Although the malate synthase pathway is shorter and could potentially generate higher flux, the glycerate pathway could ensure maximal routing of the glyoxylate flux for gluconeogenesis or, alternatively, provide a detoxification function when glyoxylate levels are too high.
Fig. 6.

Growth of bacteria lacking malate synthase (glyoxylate shunt) or glyoxylate carboligase (glycerate pathway) on different carbon substrates. A–C, bacterial strains were wild type (WT), malate synthase-deficient (ΔglcB), glyoxylate carboligase-deficient (Δgcl), or deficient in both enzymes (ΔglcB Δgcl). The double mutant strain was complemented with a single copy attB-integrating plasmid encoding glyoxylate carboligase (ΔglcB Δgcl attB::pgcl). Bacteria were grown on M9 minimal medium containing glucose (A) or acetate (B and C) as the sole carbon source. Growth was monitored by measuring the optical densities of the cultures at 600 nm (A600 nm). Symbols and error bars represent mean values and ranges (n = 2 independent experiments).
It is noteworthy that M. tuberculosis lacks functional homologues of the glycerate pathway but encodes alanine dehydrogenase (ald, rv2780), which also functions as a deaminating glycine dehydrogenase (70). Glycine dehydrogenase performs the first step of the glyoxylate-metabolizing β-hydroxyaspartate pathway and could provide an alternative route for glyoxylate assimilation (68). Although it is not clear whether M. tuberculosis utilizes the β-hydroxyaspartate pathway for glyoxylate assimilation, concomitant induction of Icl1 and glycine dehydrogenase has been observed in M. tuberculosis during growth under microaerophilic conditions (71). M. smegmatis encodes a functional homologue of alanine dehydrogenase (MSMEG_2659) and also a dedicated decarboxylating glycine dehydrogenase (MSMEG_3642). However, we did not observe any change in the abundance of these enzymes in the three carbon sources tested. Also, the inability of the ΔglcB Δgcl strain to grow on acetate would seem to rule out a role for the β-hydroxyaspartate pathway in anaplerosis during growth on acetate.
Another glyoxylate-utilizing reaction has been reported in M. tuberculosis, wherein Rv1248c catalyzes condensation of α-ketoglutarate with glyoxylate to form 2-hydroxy-3-oxoadipitate, which is further metabolized to 5-hydroxylevulinate (72). In our proteomics analysis, the homologue of Rv1248c in M. smegmatis (MSMEG_5049) showed no change in abundance between the three carbon sources tested. Even if this enzyme catalyzes a similar reaction in M. smegmatis, the inability of the ΔglcB Δgcl strain to grow on acetate would seem to rule out a potential role for MSMEG_5049 in carbon anaplerosis during growth on acetate. Its role in mycobacterial physiology could be limited to alleviating glyoxylate toxicity or providing biosynthetic precursors. This protein has also been suggested to play a role in channeling α-ketoglutarate flux to succinate by either acting as a decarboxylase or a dehydrogenase (73, 74), a link where another protein has also been implicated, viz. anaerobic-like α-ketoglutarate-ferredoxin oxidoreductase (75). Further studies will be necessary to clarify the roles of these proteins in mycobacterial metabolism, particularly in linking the “reductive” and “oxidative” branches of the TCA cycle.
Growth of M. smegmatis on acetate was also associated with higher abundance of the TCA cycle enzymes. Aconitate hydratase (AcnA, MSMEG_3143) and the associated regulatory protein AcnR (MSMEG_3142) were both present at higher levels in acetate-grown cells. Binding of citrate and Mg2+ to the AcnR homologue in C. glutamicum has been shown to reduce the affinity of the repressor for its target operator sequences (76). If a similar mechanism operates in M. smegmatis, then the induction of the repressor protein would presumably ensure a tighter control of acnA expression and shutdown of AcnA biosynthesis when citrate levels fall below a certain threshold.
In M. smegmatis, two unlinked gene clusters encode succinate dehydrogenase 1 (Sdh1, MSMEG_0420–0416) and succinate dehydrogenase 2 (Sdh2, MSMEG_1672–1669). In acetate-grown cells, Sdh1 components were repressed, and Sdh2 components were induced (gray highlighting in Fig. 4 and supplemental Fig. S9). A similar protein abundance profile has been reported for cells grown on cholesterol as a carbon source, which also increases flux through the TCA cycle (77–79). Interestingly, the abundance profile of the two gene clusters was reversed during growth on glucose (gray highlighting in Fig. 4 and supplemental Fig. S7). A hypothetical explanation for the opposing behavior of the sdh1 and sdh2 gene clusters could be that during growth on glucose the TCA cycle is bifurcated, and Sdh1 functions in reverse as a fumarate reductase catalyzing the conversion of fumarate to succinate. This interpretation is consistent with metabolomics studies that suggest the operation of a bifurcated TCA cycle in glucose-grown mycobacteria (14, 42). Furthermore, M. smegmatis does not encode a canonical fumarate reductase, and inactivation of the fumarate reductase of M. tuberculosis did not affect succinate production under the conditions tested (80). These results support the hypothesis that another enzyme, most likely one of the succinate dehydrogenases, could function as a fumarate reductase. Dissection of the precise roles of the Sdh1 and Sdh2 protein complexes will require targeted analysis by gene inactivation and metabolic flux balance analysis.
During growth on acetate, gluconeogenic flux contributes to biosynthesis of sugars and 3-phosphoglycerate, which is a precursor for biosynthesis of serine, cysteine, and glycine. Higher abundance of the gluconeogenic enzyme phosphoenolpyruvate carboxykinase (PckA, MSMEG_0255) was observed during growth on acetate. This is in agreement with a previous report that the mycobacterial GTP-dependent PckA enzyme has significantly higher enzymatic activity during growth on acetate (34). It has also been shown that an M. tuberculosis pckA mutant does not grow on fatty acids as a carbon source and fails to survive in mouse lungs, where lipids are thought to be an important carbon source available to the bacteria (16).
Propionate Metabolism
Apart from propionate activation during growth on propionate as the sole carbon source, propionyl-CoA also results from degradation of odd-chain fatty acids, branched-chain amino acids, or the side chain of cholesterol. This increased flux to propionyl-CoA could be channeled to the lipid biosynthetic network or the central carbon metabolic network depending on the metabolic needs of the cell. Propionate can enter the TCA cycle via succinate generated by the methylcitrate cycle, which converts propionyl-CoA to pyruvate and succinate, or the methylmalonate pathway, which converts propionyl-CoA to succinyl-CoA through a vitamin B12-dependent mutase (pink highlighting in Fig. 4 and supplemental Fig. S10). Gene inactivation studies in M. smegmatis indicate that either pathway is capable of compensating for the loss of the other, whereas genetic ablation of both pathways completely abrogates growth on propionate (17, 81). However, it is not clear whether there is simultaneous flux through both pathways in wild-type bacteria grown on propionate.
We compared the proteome profiles of glucose-grown and propionate-grown cells and identified 125 proteins with significant differential abundance pattern (supplemental Fig. S8B). Among the most highly abundant proteins in propionate-grown cells were the canonical enzymes of the methylcitrate cycle: methylcitrate synthase (PrpC, MSMEG_6647), methylcitrate dehydratase (PrpD, MSMEG_6645), and 2-methylisocitrate lyase (PrpB, MSMEG_6646) (supplemental Figs. S8B and S10). Proteins specific to the methylmalonate pathway were also identified, but these were present at similar levels in glucose-grown and propionate-grown cells. The differential pattern of protein abundance suggests that the methylcitrate cycle might play a dominant role in propionate utilization in wild-type cells. It is also noteworthy that the methylmalonate cycle requires vitamin B12 as a cofactor, which is rather expensive for the bacterium to synthesize and utilize for assimilation purposes. Thus, it seems likely that the primary function of the methylmalonate pathway is to generate precursors for lipid synthesis (methylmalonyl-CoA), whereas the methylcitrate cycle mediates flux of carbon into the TCA cycle. Unlike M. smegmatis, M. tuberculosis cannot utilize the methylmalonate pathway for propionate assimilation under in vitro growth conditions unless vitamin B12 is provided in the growth medium (81, 82).
Growth on propionate was associated with higher abundance of pyruvate carboxylase (MSMEG_6648) and of proteins belonging to the succinate dehydrogenase 2 gene cluster (MSMEG_1672–1669), which would presumably mediate an increased flux through oxaloacetate. Higher abundance of the gluconeogenic enzyme phosphoenolpyruvate carboxylase (PckA, MSMEG_0255) was accompanied by reduced abundance of pyruvate kinase (Pyk, MSMEG_3227), which would prevent a futile cycle of back-conversion of phosphoenolpyruvate to pyruvate (Fig. 4 and supplemental Fig. S10). Among other TCA cycle enzymes, higher abundance of aconitase and Icl1 was observed during growth on propionate. In Escherichia coli and Ralstonia eutropha, isocitrate lyase has been shown to play an important role in propionate assimilation (83, 84). However, isocitrate lyase activity is not required for growth of M. smegmatis or M. tuberculosis on propionate as a carbon source under conditions where the methylmalonyl-CoA pathway is operational (81, 82). Also, abundance of proteins belonging to the glycerate pathway was similar in glucose-grown and propionate-grown cells, in sharp contrast to the abundance profile during growth on acetate, where increased abundance of Icl1 was associated with increased abundance of the enzymes comprising the glycerate pathway.
It seems likely that aconitase and isocitrate lyase have alternative roles during growth of M. smegmatis on propionate as the carbon source. One possibility is that aconitase and isocitrate lyase could catalyze the related reactions associated with methylcitrate dehydratase and methylisocitrate lyase, respectively. Consistent with this hypothesis, previous reports have indicated a role for Icl1 in the methylcitrate cycle of both M. smegmatis and M. tuberculosis (17, 19).
Increased abundance of MSMEG_5447 and MSMEG_4745 was also observed during growth on propionate as a carbon source. MSMEG_5447 has been shown to function as a mannosyltransferase that catalyzes O-glycosylation of target proteins (85), and the M. tuberculosis homologue of MSMEG_4745 (Rv2518c) has been implicated in peptidoglycan biosynthesis (86). In mycobacteria, mannose forms an integral component of the mycobacterial cell wall, and mannose-containing proteins have been implicated in mediating the entry of M. tuberculosis into host cells (87–89).
CONCLUSION
Carbon metabolism involves a sequence of reactions whereby influx of one metabolite is channeled through various conversions that generate energy and biomass for the organism's survival and growth. Depending upon the ecological niche of an organism, this basic network of reactions is augmented with features that provide additional benefits to the organism. Gene inactivation is a powerful tool to gain insights into this network, but the results can be buffered due to “metabolic adaptation” and typically do not provide a global insight into the extent of the network. Proteome analysis, especially in conjunction with metabolite profiling, can overcome these limitations by providing an unbiased view of how metabolites are channeled through the metabolic reaction network. These studies also enable characterization of proteins with unknown functions, apart from providing information about novel reactions and pathways that may operate in an organism.
In this study, proteome profiling of M. smegmatis grown on glucose, acetate, or propionate as the sole carbon source provided new insights into the metabolic network of this organism. Growth on glucose was associated with increased abundance of enzymes involved in the ED pathway and several sugar transport proteins, which hints at the existence of a global network controlling carbohydrate assimilation. Proteome profiling of acetate-grown cells revealed increased abundance of enzymes that could mediate acetate assimilation through the glycerate pathway, and gene inactivation experiments provided functional evidence that both the glyoxylate shunt and the glycerate pathway are operational in M. smegmatis. Growth on propionate was associated with increased abundance of enzymes comprising the methylcitrate cycle. Results from proteome analysis were also consistent with previous studies focused on understanding propionate metabolism in this organism. Strikingly, assimilation of acetate and propionate could occur either through cofactor-dependent pathways (glycerate pathway and methylmalonate pathway) or cofactor-independent pathways (glyoxylate shunt and methylcitrate cycle).
Pathogenic M. tuberculosis apparently cannot biosynthesize an important cofactor (vitamin B12) for a functional methylmalonate pathway and lacks homologues for the ED pathway and the glycerate pathway. The apparently richer metabolic potential of M. smegmatis, a free-living saprophytic organism, is consistent with the idea that pathogenic organisms typically undergo reductive metabolic evolution as they adapt to the nutritional conditions encountered in their hosts (90). The metabolic plasticity of M. smegmatis may be important for its survival and persistence in diverse environmental conditions. Although the majority of the differentially abundant proteins that we identified belong to the functional categories of “Energy Metabolism” and “Transport and Binding Proteins,” we identified proteins that showed differential abundance in other categories as well, including hypothetical proteins and proteins with unknown functions. This study advances the current understanding of metabolic adaptation in mycobacteria and sets the stage for in-depth targeted studies to dissect the functional roles of differentially abundant proteins in optimal utilization of different carbon substrates.
Supplementary Material
Acknowledgments
We thank Trixie Ann Bartholomeusz for assistance with dimethyl labeling procedures and Emre Özdemir for helpful discussions. We also thank members of the McKinney laboratory for their valuable feedback on the manuscript. Author contributions: T.C. and R.H. designed research; T.C., R.H., and D.C. performed research; T.C. and F.A. analyzed data; T.C., M.M., and J.D.M. wrote the paper.
Footnotes
* This work was supported, in whole or in part, by National Institutes of Health Grant HL088906 (to J.D.M.). This work was also supported by Swiss National Science Foundation Grant 310030_135639 (to J.D.M.).
 This article contains supplemental material.
Accession information: All raw mass spectrometry data files and MaxQuant output files have been deposited to the ProteomeXchange Consortium (http://proteomecentral.proteomexchange.org) via the PRIDE partner repository (91) with the dataset identifier PXD000253. All peptide spectral matches and their MS/MS spectra can be viewed in the freely available MaxQuant viewer.
1 The abbreviations used are:
- ACS
- acetyl-CoA synthetase
- ED
- Entner-Doudoroff
- EMP
- Embden-Meyerhof-Parnas
- PP
- pentose phosphate
- SAX
- strong anion exchange
- SignB
- significance B
- TCA
- tricarboxylic acid
- BisTris
- 2-[bis(2-hydroxyethyl)amino]-2-(hydroxymethyl)propane-1,3-diol
- AK
- acetate kinase
- PTA
- phosphotransacetylase.
REFERENCES
- 1. Rastogi N., Legrand E., Sola C. (2001) The mycobacteria: an introduction to nomenclature and pathogenesis. Rev. Sci. Tech. 20, 21–54 [DOI] [PubMed] [Google Scholar]
- 2. Vissa V. D., Sakamuri R. M., Li W., Brennan P. J. (2009) Defining mycobacteria: shared and specific genome features for different lifestyles. Indian J. Microbiol. 49, 11–47 [DOI] [PMC free article] [PubMed] [Google Scholar]
- 3. Weigoldt M., Meens J., Bange F. C., Pich A., Gerlach G. F., Goethe R. (2013) Metabolic adaptation of Mycobacterium avium subsp. paratuberculosis to the gut environment. Microbiology 159, 380–391 [DOI] [PubMed] [Google Scholar]
- 4. Tang Y. J., Shui W., Myers S., Feng X., Bertozzi C., Keasling J. D. (2009) Central metabolism in Mycobacterium smegmatis during the transition from O2-rich to O2-poor conditions as studied by isotopomer-assisted metabolite analysis. Biotechnol. Lett. 31, 1233–1240 [DOI] [PMC free article] [PubMed] [Google Scholar]
- 5. Schnappinger D., Ehrt S., Voskuil M. I., Liu Y., Mangan J. A., Monahan I. M., Dolganov G., Efron B., Butcher P. D., Nathan C., Schoolnik G. K. (2003) Transcriptional adaptation of Mycobacterium tuberculosis within macrophages: insights into the phagosomal environment. J. Exp. Med. 198, 693–704 [DOI] [PMC free article] [PubMed] [Google Scholar]
- 6. Timm J., Post F. A., Bekker L. G., Walther G. B., Wainwright H. C., Manganelli R., Chan W. T., Tsenova L., Gold B., Smith I., Kaplan G., McKinney J. D. (2003) Differential expression of iron-, carbon-, and oxygen-responsive mycobacterial genes in the lungs of chronically infected mice and tuberculosis patients. Proc. Natl. Acad. Sci. U.S.A. 100, 14321–14326 [DOI] [PMC free article] [PubMed] [Google Scholar]
- 7. Heck A. J., Krijgsveld J. (2004) Mass spectrometry-based quantitative proteomics. Expert Rev. Proteomics 1, 317–326 [DOI] [PubMed] [Google Scholar]
- 8. Bantscheff M., Schirle M., Sweetman G., Rick J., Kuster B. (2007) Quantitative mass spectrometry in proteomics: a critical review. Anal. Bioanal. Chem. 389, 1017–1031 [DOI] [PubMed] [Google Scholar]
- 9. Moon Y. J., Kwon J., Yun S. H., Lim H. L., Kim M. S., Kang S. G., Lee J. H., Choi J. S., Kim S. I., Chung Y. H. (2012) Proteome analyses of hydrogen-producing hyperthermophilic archaeon Thermococcus onnurineus NA1 in different one-carbon substrate culture conditions. Mol. Cell. Proteomics 10.1074/mcp.M111.015420; [DOI] [PMC free article] [PubMed] [Google Scholar]
- 10. Liu X., Gao B., Novik V., Galán J. E. (2012) Quantitative proteomics of intracellular Campylobacter jejuni reveals metabolic reprogramming. PLoS Pathog. 8, e1002562. [DOI] [PMC free article] [PubMed] [Google Scholar]
- 11. Kraft-Terry S. D., Engebretsen I. L., Bastola D. K., Fox H. S., Ciborowski P., Gendelman H. E. (2011) Pulsed stable isotope labeling of amino acids in cell culture uncovers the dynamic interactions between HIV-1 and the monocyte-derived macrophage. J. Proteome Res. 10, 2852–2862 [DOI] [PMC free article] [PubMed] [Google Scholar]
- 12. Boersema P. J., Raijmakers R., Lemeer S., Mohammed S., Heck A. J. (2009) Multiplex peptide stable isotope dimethyl labeling for quantitative proteomics. Nat. Protoc. 4, 484–494 [DOI] [PubMed] [Google Scholar]
- 13. Kovanich D., Cappadona S., Raijmakers R., Mohammed S., Scholten A., Heck A. J. (2012) Applications of stable isotope dimethyl labeling in quantitative proteomics. Anal. Bioanal. Chem. 404, 991–1009 [DOI] [PubMed] [Google Scholar]
- 14. de Carvalho L. P., Fischer S. M., Marrero J., Nathan C., Ehrt S., Rhee K. Y. (2010) Metabolomics of Mycobacterium tuberculosis reveals compartmentalized co-catabolism of carbon substrates. Chem. Biol. 17, 1122–1131 [DOI] [PubMed] [Google Scholar]
- 15. Muñoz-Elías E. J., McKinney J. D. (2005) Mycobacterium tuberculosis isocitrate lyases 1 and 2 are jointly required for in vivo growth and virulence. Nat. Med. 11, 638–644 [DOI] [PMC free article] [PubMed] [Google Scholar]
- 16. Marrero J., Rhee K. Y., Schnappinger D., Pethe K., Ehrt S. (2010) Gluconeogenic carbon flow of tricarboxylic acid cycle intermediates is critical for Mycobacterium tuberculosis to establish and maintain infection. Proc. Natl. Acad. Sci. U.S.A. 107, 9819–9824 [DOI] [PMC free article] [PubMed] [Google Scholar]
- 17. Upton A. M., McKinney J. D. (2007) Role of the methylcitrate cycle in propionate metabolism and detoxification in Mycobacterium smegmatis. Microbiology 153, 3973–3982 [DOI] [PubMed] [Google Scholar]
- 18. Merkov L. N. (2006) Mycobacterium smegmatis. Ph.D. thesis, The Rockefeller University, New York [Google Scholar]
- 19. Muñoz-Elías E. J., Upton A. M., Cherian J., McKinney J. D. (2006) Role of the methylcitrate cycle in Mycobacterium tuberculosis metabolism, intracellular growth, and virulence. Mol. Microbiol. 60, 1109–1122 [DOI] [PubMed] [Google Scholar]
- 20. Rappsilber J., Ishihama Y., Mann M. (2003) Stop and go extraction tips for matrix-assisted laser desorption/ionization, nanoelectrospray, and LC/MS sample pretreatment in proteomics. Anal. Chem. 75, 663–670 [DOI] [PubMed] [Google Scholar]
- 21. Wiśniewski J. R., Zougman A., Mann M. (2009) Combination of FASP and StageTip-based fractionation allows in-depth analysis of the hippocampal membrane proteome. J. Proteome Res. 8, 5674–5678 [DOI] [PubMed] [Google Scholar]
- 22. Cox J., Matic I., Hilger M., Nagaraj N., Selbach M., Olsen J. V., Mann M. (2009) A practical guide to the MaxQuant computational platform for SILAC-based quantitative proteomics. Nat. Protoc. 4, 698–705 [DOI] [PubMed] [Google Scholar]
- 23. Cox J., Neuhauser N., Michalski A., Scheltema R. A., Olsen J. V., Mann M. (2011) Andromeda: a peptide search engine integrated into the MaxQuant environment. J. Proteome Res. 10, 1794–1805 [DOI] [PubMed] [Google Scholar]
- 24. Kapopoulou A., Lew J. M., Cole S. T. (2011) The MycoBrowser portal: a comprehensive and manually annotated resource for mycobacterial genomes. Tuberculosis 91, 8–13 [DOI] [PubMed] [Google Scholar]
- 25. R Development Core Team (2013). R: A language and environment for statistical computing. R Foundation for Statistical Computing, Vienna, Austria: ISBN 3-900051-07-0, http://www.R-project.org. [Google Scholar]
- 26. Wang R., Marcotte E. M. (2008) The proteomic response of Mycobacterium smegmatis to anti-tuberculosis drugs suggests targeted pathways. J. Proteome Res. 7, 855–865 [DOI] [PubMed] [Google Scholar]
- 27. Dabney A., Storey J. D. (2012). qvalue: Q-value estimation for false discovery rate control. R package version 1.32.0. [Google Scholar]
- 28. Kanehisa M., Goto S. (2000) KEGG: Kyoto encyclopedia of genes and genomes. Nucleic Acids Res. 28, 27–30 [DOI] [PMC free article] [PubMed] [Google Scholar]
- 29. Stock J. B., Ninfa A. J., Stock A. M. (1989) Protein phosphorylation and regulation of adaptive responses in bacteria. Microbiol. Rev. 53, 450–490 [DOI] [PMC free article] [PubMed] [Google Scholar]
- 30. Pawson T., Scott J. D. (2005) Protein phosphorylation in signaling–50 years and counting. Trends Biochem. Sci. 30, 286–290 [DOI] [PubMed] [Google Scholar]
- 31. Hunter T. (1995) Protein kinases and phosphatases: the yin and yang of protein phosphorylation and signaling. Cell 80, 225–236 [DOI] [PubMed] [Google Scholar]
- 32. Cole S. T., Brosch R., Parkhill J., Garnier T., Churcher C., Harris D., Gordon S. V., Eiglmeier K., Gas S., Barry C. E., 3rd, Tekaia F., Badcock K., Basham D., Brown D., Chillingworth T., Connor R., Davies R., Devlin K., Feltwell T., Gentles S., Hamlin N., Holroyd S., Hornsby T., Jagels K., Krogh A., McLean J., Moule S., Murphy L., Oliver K., Osborne J., Quail M. A., Rajandream M. A., Rogers J., Rutter S., Seeger K., Skelton J., Squares R., Squares S., Sulston J. E., Taylor K., Whitehead S., Barrell B. G. (1998) Deciphering the biology of Mycobacterium tuberculosis from the complete genome sequence. Nature 393, 537–544 [DOI] [PubMed] [Google Scholar]
- 33. Titgemeyer F., Amon J., Parche S., Mahfoud M., Bail J., Schlicht M., Rehm N., Hillmann D., Stephan J., Walter B., Burkovski A., Niederweis M. (2007) A genomic view of sugar transport in Mycobacterium smegmatis and Mycobacterium tuberculosis. J. Bacteriol. 189, 5903–5915 [DOI] [PMC free article] [PubMed] [Google Scholar]
- 34. Hasan M. R., Rahman M., Jaques S., Purwantini E., Daniels L. (2010) Glucose 6-phosphate accumulation in mycobacteria: implications for a novel F420-dependent anti-oxidant defense system. J. Biol. Chem. 285, 19135–19144 [DOI] [PMC free article] [PubMed] [Google Scholar]
- 35. Bai N. J., Pai M. R., Murthy P. S., Venkitasubramanian T. A. (1976) Pathways of glucose catabolism in Mycobacterium smegmatis. Can. J. Microbiol. 22, 1374–1380 [DOI] [PubMed] [Google Scholar]
- 36. Lengeler J. W., Drews G., Schlegel H. G. (eds) (2009) Biology of the Prokaryotes, pp. 187–233, Blackwell Science Ltd., Oxford [Google Scholar]
- 37. Conway T. (1992) The Entner-Doudoroff pathway: history, physiology and molecular biology. FEMS Microbiol. Rev. 9, 1–27 [DOI] [PubMed] [Google Scholar]
- 38. Patra T., Koley H., Ramamurthy T., Ghose A. C., Nandy R. K. (2012) The Entner-Doudoroff pathway is obligatory for gluconate utilization and contributes to the pathogenicity of Vibrio cholerae. J. Bacteriol. 194, 3377–3385 [DOI] [PMC free article] [PubMed] [Google Scholar]
- 39. Eriksson S., Lucchini S., Thompson A., Rhen M., Hinton J. C. (2003) Unravelling the biology of macrophage infection by gene expression profiling of intracellular Salmonella enterica. Mol. Microbiol. 47, 103–118 [DOI] [PubMed] [Google Scholar]
- 40. Brüggemann H., Hagman A., Jules M., Sismeiro O., Dillies M. A., Gouyette C., Kunst F., Steinert M., Heuner K., Coppée J. Y., Buchrieser C. (2006) Virulence strategies for infecting phagocytes deduced from the in vivo transcriptional program of Legionella pneumophila. Cell. Microbiol. 8, 1228–1240 [DOI] [PubMed] [Google Scholar]
- 41. Görke B., Stülke J. (2008) Carbon catabolite repression in bacteria: many ways to make the most out of nutrients. Nat. Rev. Microbiol. 6, 613–624 [DOI] [PubMed] [Google Scholar]
- 42. Rhee K. Y., de Carvalho L. P., Bryk R., Ehrt S., Marrero J., Park S. W., Schnappinger D., Venugopal A., Nathan C. (2011) Central carbon metabolism in Mycobacterium tuberculosis: an unexpected frontier. Trends Microbiol. 19, 307–314 [DOI] [PMC free article] [PubMed] [Google Scholar]
- 43. Walters S. B., Dubnau E., Kolesnikova I., Laval F., Daffe M., Smith I. (2006) The Mycobacterium tuberculosis PhoPR two-component system regulates genes essential for virulence and complex lipid biosynthesis. Mol. Microbiol. 60, 312–330 [DOI] [PubMed] [Google Scholar]
- 44. Gonzalo-Asensio J., Mostowy S., Harders-Westerveen J., Huygen K., Hernández-Pando R., Thole J., Behr M., Gicquel B., Martín C. (2008) PhoP: a missing piece in the intricate puzzle of Mycobacterium tuberculosis virulence. PLoS ONE 3, e3496. [DOI] [PMC free article] [PubMed] [Google Scholar]
- 45. Veit A., Rittmann D., Georgi T., Youn J. W., Eikmanns B. J., Wendisch V. F. (2009) Pathway identification combining metabolic flux and functional genomics analyses: acetate and propionate activation by Corynebacterium glutamicum. J. Biotechnol. 140, 75–83 [DOI] [PubMed] [Google Scholar]
- 46. Heider J. (2001) A new family of CoA-transferases. FEBS Lett. 509, 345–349 [DOI] [PubMed] [Google Scholar]
- 47. Fleck C. B., Brock M. (2008) Characterization of an acyl-CoA: carboxylate CoA-transferase from Aspergillus nidulans involved in propionyl-CoA detoxification. Mol. Microbiol. 68, 642–656 [DOI] [PubMed] [Google Scholar]
- 48. Reinscheid D. J., Schnicke S., Rittmann D., Zahnow U., Sahm H., Eikmanns B. J. (1999) Cloning, sequence analysis, expression and inactivation of the Corynebacterium glutamicum pta-ack operon encoding phosphotransacetylase and acetate kinase. Microbiology 145, 503–513 [DOI] [PubMed] [Google Scholar]
- 49. Horswill A. R., Escalante-Semerena J. C. (1999) The prpE gene of Salmonella typhimurium LT2 encodes propionyl-CoA synthetase. Microbiology 145, 1381–1388 [DOI] [PubMed] [Google Scholar]
- 50. Gerstmeir R., Wendisch V. F., Schnicke S., Ruan H., Farwick M., Reinscheid D., Eikmanns B. J. (2003) Acetate metabolism and its regulation in Corynebacterium glutamicum. J. Biotechnol. 104, 99–122 [DOI] [PubMed] [Google Scholar]
- 51. Claes W. A., Pühler A., Kalinowski J. (2002) Identification of two prpDBC gene clusters in Corynebacterium glutamicum and their involvement in propionate degradation via the 2-methylcitrate cycle. J. Bacteriol. 184, 2728–2739 [DOI] [PMC free article] [PubMed] [Google Scholar]
- 52. Grundy F. J., Waters D. A., Allen S. H., Henkin T. M. (1993) Regulation of the Bacillus subtilis acetate kinase gene by CcpA. J. Bacteriol. 175, 7348–7355 [DOI] [PMC free article] [PubMed] [Google Scholar]
- 53. Hayden J. D., Brown L. R., Gunawardena H. P., Perkowski E. F., Chen X., Braunstein M. (2013) Reversible acetylation regulates acetate and propionate metabolism in Mycobacterium smegmatis. Microbiology 159, 1986–1999 [DOI] [PMC free article] [PubMed] [Google Scholar]
- 54. Nambi S., Gupta K., Bhattacharyya M., Ramakrishnan P., Ravikumar V., Siddiqui N., Thomas A. T., Visweswariah S. S. (2013) Cyclic AMP-dependent protein lysine acylation in mycobacteria regulates fatty acid and propionate metabolism. J. Biol. Chem. 288, 14114–14124 [DOI] [PMC free article] [PubMed] [Google Scholar]
- 55. Starai V. J., Celic I., Cole R. N., Boeke J. D., Escalante-Semerena J. C. (2002) Sir2-dependent activation of acetyl-CoA synthetase by deacetylation of active lysine. Science 298, 2390–2392 [DOI] [PubMed] [Google Scholar]
- 56. Xu H., Hegde S. S., Blanchard J. S. (2011) Reversible acetylation and inactivation of Mycobacterium tuberculosis acetyl-CoA synthetase is dependent on cAMP. Biochemistry 50, 5883–5892 [DOI] [PMC free article] [PubMed] [Google Scholar]
- 57. Chopra T., Gokhale R. S. (2009) Polyketide versatility in the biosynthesis of complex mycobacterial cell wall lipids. Methods Enzymol. 459, 259–294 [DOI] [PubMed] [Google Scholar]
- 58. Salaemae W., Azhar A., Booker G. W., Polyak S. W. (2011) Biotin biosynthesis in Mycobacterium tuberculosis: physiology, biochemistry and molecular intervention. Protein Cell 2, 691–695 [DOI] [PMC free article] [PubMed] [Google Scholar]
- 59. Webb M. E., Smith A. G., Abell C. (2004) Biosynthesis of pantothenate. Nat. Prod. Rep. 21, 695–721 [DOI] [PubMed] [Google Scholar]
- 60. Cortay J. C., Bleicher F., Duclos B., Cenatiempo Y., Gautier C., Prato J. L., Cozzone A. J. (1989) Utilization of acetate in Escherichia coli: structural organization and differential expression of the ace operon. Biochimie 71, 1043–1049 [DOI] [PubMed] [Google Scholar]
- 61. Cronan J. E., LaPorte D.C. (1996) in Escherichia coli and Salmonella: Cellular and Molecular Biology (F. Neidhardt F., Curtiss R., Ingraham J., Lin E. C., Low K. B., Magasanik B., eds) pp. 206–216, American Society for Microbiology, Washington, D. C. [Google Scholar]
- 62. Clark D. P., Cronan J. E., Jr. (1996) in Escherichia coli and Salmonella: Cellular and Molecular Biology (Neidhardt F. C., Curtiss R., Ingraham J. L., Lin E. C., Low K. B., Magasanik B., Reznikoff W. S., Riley M., Schaechter M., Umbarger H. E., eds) 2nd Ed., pp. 343–357, American Society for Microbiology, Washington, D. C. [Google Scholar]
- 63. Smith C. V., Huang C. C., Miczak A., Russell D. G., Sacchettini J. C., Höner zu Bentrup K. (2003) Biochemical and structural studies of malate synthase from Mycobacterium tuberculosis. J. Biol. Chem. 278, 1735–1743 [DOI] [PubMed] [Google Scholar]
- 64. Micklinghoff J. C., Breitinger K. J., Schmidt M., Geffers R., Eikmanns B. J., Bange F. C. (2009) Role of the transcriptional regulator RamB (Rv0465c) in the control of the glyoxylate cycle in Mycobacterium tuberculosis. J. Bacteriol. 191, 7260–7269 [DOI] [PMC free article] [PubMed] [Google Scholar]
- 65. Kornberg H. L., Sadler J. R. (1960) Microbial oxidation of glycollate via a dicarboxylic acid cycle. Nature 185, 153–155 [DOI] [PubMed] [Google Scholar]
- 66. Ornston L. N., Ornston M. K. (1969) Regulation of glyoxylate metabolism in Escherichia coli K-12. J. Bacteriol. 98, 1098–1108 [DOI] [PMC free article] [PubMed] [Google Scholar]
- 67. Krakow G., Barkulis S. S., Hayashi J. A. (1961) Glyoxylic acid carboligase: an enzyme present in glycolate-grown Escherichia coli. J. Bacteriol. 81, 509–518 [DOI] [PMC free article] [PubMed] [Google Scholar]
- 68. Liu J. Q., Dairi T., Itoh N., Kataoka M., Shimizu S. (2003) A novel enzyme, d-3-hydroxyaspartate aldolase from Paracoccus denitrificans IFO 13301: purification, characterization, and gene cloning. Appl. Microbiol. Biotechnol. 62, 53–60 [DOI] [PubMed] [Google Scholar]
- 69. Kornberg H. L., Morris J. G. (1965) The utilization of glycollate by Micrococcus denitrificans: the βhydroxyaspartate pathway. Biochem. J. 95, 577–586 [DOI] [PMC free article] [PubMed] [Google Scholar]
- 70. Giffin M. M., Modesti L., Raab R. W., Wayne L. G., Sohaskey C. D. (2012) ald of Mycobacterium tuberculosis encodes both the alanine dehydrogenase and the putative glycine dehydrogenase. J. Bacteriol. 194, 1045–1054 [DOI] [PMC free article] [PubMed] [Google Scholar]
- 71. Wayne L. G., Lin K. Y. (1982) Glyoxylate metabolism and adaptation of Mycobacterium tuberculosis to survival under anaerobic conditions. Infect. Immun. 37, 1042–1049 [DOI] [PMC free article] [PubMed] [Google Scholar]
- 72. de Carvalho L. P., Zhao H., Dickinson C. E., Arango N. M., Lima C. D., Fischer S. M., Ouerfelli O., Nathan C., Rhee K. Y. (2010) Activity-based metabolomic profiling of enzymatic function: identification of Rv1248c as a mycobacterial 2-hydroxy-3-oxoadipate synthase. Chem. Biol. 17, 323–332 [DOI] [PMC free article] [PubMed] [Google Scholar]
- 73. Wagner T., Bellinzoni M., Wehenkel A., O'Hare H. M., Alzari P. M. (2011) Functional plasticity and allosteric regulation of α-ketoglutarate decarboxylase in central mycobacterial metabolism. Chem. Biol. 18, 1011–1020 [DOI] [PubMed] [Google Scholar]
- 74. Tian J., Bryk R., Itoh M., Suematsu M., Nathan C. (2005) Variant tricarboxylic acid cycle in Mycobacterium tuberculosis: identification of α-ketoglutarate decarboxylase. Proc. Natl. Acad. Sci. U.S.A. 102, 10670–10675 [DOI] [PMC free article] [PubMed] [Google Scholar]
- 75. Baughn A. D., Garforth S. J., Vilchèze C., Jacobs W. R., Jr. (2009) An anaerobic-type α-ketoglutarate ferredoxin oxidoreductase completes the oxidative tricarboxylic acid cycle of Mycobacterium tuberculosis. PLoS Pathog. 5, e1000662. [DOI] [PMC free article] [PubMed] [Google Scholar]
- 76. García-Nafría J., Baumgart M., Turkenburg J. P., Wilkinson A. J., Bott M., Wilson K. S. (2013) Crystal and solution studies reveal that the transcriptional regulator AcnR of Corynebacterium glutamicum is regulated by citrate-Mg2+ binding to a noncanonical pocket. J. Biol. Chem. 288, 15800–15812 [DOI] [PMC free article] [PubMed] [Google Scholar]
- 77. Ekanayaka N. V. (2013) Growth and Energetics of Cholesterol Utilisation by Mycobacterium smegmatis mc2155. Ph.D. thesis, University of Otago [Google Scholar]
- 78. Griffin J. E., Pandey A. K., Gilmore S. A., Mizrahi V., McKinney J. D., Bertozzi C. R., Sassetti C. M. (2012) Cholesterol catabolism by Mycobacterium tuberculosis requires transcriptional and metabolic adaptations. Chem. Biol. 19, 218–227 [DOI] [PMC free article] [PubMed] [Google Scholar]
- 79. Ouellet H., Johnston J. B., de Montellano P. R. (2011) Cholesterol catabolism as a therapeutic target in Mycobacterium tuberculosis. Trends Microbiol. 19, 530–539 [DOI] [PMC free article] [PubMed] [Google Scholar]
- 80. Watanabe S., Zimmermann M., Goodwin M. B., Sauer U., Barry C. E., 3rd, Boshoff H. I. (2011) Fumarate reductase activity maintains an energized membrane in anaerobic Mycobacterium tuberculosis. PLoS Pathog. 7, e1002287. [DOI] [PMC free article] [PubMed] [Google Scholar]
- 81. Lotlikar M. U. (2012) Roles of the Methylcitrate and Methylmalonyl-CoA Pathways in Mycobacterial Metabolism and Pathogenesis. Ph.D. thesis, The Rockefeller University, New York [Google Scholar]
- 82. Savvi S., Warner D. F., Kana B. D., McKinney J. D., Mizrahi V., Dawes S. S. (2008) Functional characterization of a vitamin B12-dependent methylmalonyl pathway in Mycobacterium tuberculosis: implications for propionate metabolism during growth on fatty acids. J. Bacteriol. 190, 3886–3895 [DOI] [PMC free article] [PubMed] [Google Scholar]
- 83. Wang Z. X., Brämer C. O., Steinbüchel A. (2003) The glyoxylate bypass of Ralstonia eutropha. FEMS Microbiol. Lett. 228, 63–71 [DOI] [PubMed] [Google Scholar]
- 84. Textor S., Wendisch V. F., De Graaf A. A., Müller U., Linder M. I., Linder D., Buckel W. (1997) Propionate oxidation in Escherichia coli: evidence for operation of a methylcitrate cycle in bacteria. Arch. Microbiol. 168, 428–436 [DOI] [PubMed] [Google Scholar]
- 85. Liu C. F., Tonini L., Malaga W., Beau M., Stella A., Bouyssié D., Jackson M. C., Nigou J., Puzo G., Guilhot C., Burlet-Schiltz O., Rivière M. (2013) Bacterial protein-O-mannosylating enzyme is crucial for virulence of Mycobacterium tuberculosis. Proc. Natl. Acad. Sci. U.S.A. 110, 6560–6565 [DOI] [PMC free article] [PubMed] [Google Scholar]
- 86. Gupta R., Lavollay M., Mainardi J. L., Arthur M., Bishai W. R., Lamichhane G. (2010) The Mycobacterium tuberculosis protein LdtMt2 is a nonclassical transpeptidase required for virulence and resistance to amoxicillin. Nat. Med. 16, 466–469 [DOI] [PMC free article] [PubMed] [Google Scholar]
- 87. Nguyen L., Pieters J. (2005) The Trojan horse: survival tactics of pathogenic mycobacteria in macrophages. Trends Cell Biol. 15, 269–276 [DOI] [PubMed] [Google Scholar]
- 88. Venisse A., Fournié J. J., Puzo G. (1995) Mannosylated lipoarabinomannan interacts with phagocytes. Eur. J. Biochem. 231, 440–447 [DOI] [PubMed] [Google Scholar]
- 89. Crick D. C., B. P., McNeil M. R. (2003) Tuberculosis, pp. 115–134, Lippincott Williams and Wilkins, Philadelphia, PA [Google Scholar]
- 90. Moran N. A. (2002) Microbial minimalism: genome reduction in bacterial pathogens. Cell 108, 583–586 [DOI] [PubMed] [Google Scholar]
- 91. Vizcaíno J. A., Côté R. G., Csordas A., Dianes J. A., Fabregat A., Foster J. M., Griss J., Alpi E., Birim M., Contell J., O'Kelly G., Schoenegger A., Ovelleiro D., Pérez-Riverol Y., Reisinger F., Ríos D., Wang R., Hermjakob H. (2013) The PRoteomics IDEntifications (PRIDE) database and associated tools: status in 2013. Nucleic Acids Res. 41, D1063–D1069 [DOI] [PMC free article] [PubMed] [Google Scholar]
Associated Data
This section collects any data citations, data availability statements, or supplementary materials included in this article.