Abstract
Fish larvae may intercept their own wake during sharp turns, which might affect their escape performance. We analysed C-starts of larval zebrafish (Danio rerio, Hamilton, 1822) using a computational fluid dynamics approach that simulates free swimming (swimming trajectory is determined by fluid forces) by coupling hydrodynamics and body dynamics. The simulations show that fish may intercept their own wake when they turn by 100–180°. During stage 1 of a C-start, the fish generates a strong jet at the tail that is shed into the wake. During stage 2, the fish intercepts this wake. Counterfactual simulations showed that wake interception increased the lateral force on the fish and reduced the fish's turning angle by more than 5°. Wake interception caused no significant acceleration tangential to the trajectory of the fish and did not affect total power output. While experimental and simulation evidence suggests that fish larvae can either undershoot or intercept but not overshoot their wake, our simulations show that larger fish might be able to avoid intercepting their wake by either under- or overshooting. As intercepting its own wake modifies the fish's escape trajectory, fish should account for this effect when planning their escape route.
Keywords: computational fluid dynamics, larval zebrafish, escape, wake interception, C-start
1. Introduction
Aquatic organisms use flow patterns generated by other organisms and inanimate objects to detect their presence—for example for prey capture [1–4], to evade predators [5,6], to find mates [7] or hosts [6]—and to reduce swimming effort when swimming downstream from inanimate objects [8,9] or in schools [10–12]. In these instances, organisms use flow patterns that they did not generate. Furthermore, aquatic organisms interact with wakes that they themselves have generated, such as bluegill sunfish, whose tail fin beats in the wake generated by its dorsal and anal fins [13] and whose pectoral fins synchronize with opercular pumping [14]. In such instances, fish control both the upstream and the downstream flow and are speculated to enhance their swimming performance by modulating the phase between the interacting wakes.
During escape-response C-starts, fish tend to move away from the threat [5,15,16], which may require them to reverse their initial heading and thereby swim through their own wake. The most extreme case of such a heading reversal occurs in fish with elongate, slender bodies, such as eels and fish larvae, which can reverse their original heading within one tail beat cycle by bending their body far enough for the snout to approach or even overlap with the tail [15]. Such an extreme reversal of heading might cause the head to traverse through the same flow region that was traversed by the tail at the beginning of the C-start. In this case, the fish would encounter its own tail wake while or shortly after the tail wake is being shed.
A typical C-start comprises at least two stages (stage 1 and 2), which can be roughly defined by the tail beat, with stage 1 defined by the first tail beat to one side, bending the fish into a C shape, and stage 2 defined by the second tail beat to the other side while the fish accelerates along its new path of motion [17–22]. Fish shed a vortex ring at the end of stage 1 and stage 2. These two stages are followed by a more variable stage 3, during which the fish continues to swim away from the threat. The net change in heading (difference between initial head orientation and the new heading at the end of stage 2 of a C-start) is determined by the re-orientation of the head during stages 1 and 2. During an extreme change in head orientation, the fish reverses its heading at the end of stage 1, followed by an encounter of its previously shed tail wake when it accelerates forward during stage 2. The body kinematics and flow patterns generated during a typical C-start have been studied extensively in adult carangiform fish [17,23–27] and to a lesser extend in larval fish (e.g. [22,28]), including several computational studies [29–33].
During an escape response, fish change their heading and swimming speed [34,35]. Fish tend to escape away from the threat independent of initial orientation [36]. Trajectory angles typically range from 90° (sideways) to 180° (reverse), yet the distribution is not uniform across these preferred angles but solitary fish usually have a bimodal response with a peak near 180° (reverse) and 130° (away and sideways) [36]. The peaks of this bimodal distribution can be explained as a result of two escape strategies—maximizing the distance to the predator (180°) and maximizing the ability to sense the predator's approach (90°) [36], and bimodal distributions have been observed also in larval zebrafish [37]. A non-normal, yet non-random distribution was seen as a strategy of the prey to reduce the predictability of its response without unduly increasing the probability of escape trajectories towards the predator [36].
In this study, we focus on C-starts in zebrafish larvae. We modelled the escape response and resulting flow patterns of a zebrafish larva performing an extreme C-start, based on the kinematic recordings of Budick & O'Malley [15]. We predict that fish that reverse their heading during a C-start will intercept their own wake. This wake interception will affect the fish's escape performance. We explore how intercepting its own wake affects the fish's escape performance and illuminate fluid dynamic constraints on the directionality of escape trajectories.
We developed a three-dimensional free-swimming numerical approach (introduced in §2) to simulate the escape response of a larval zebrafish and discovered that larvae can intercept their wake. We used the centre-of-mass (CoM) kinematics of the recorded zebrafish to validate our computational model (§3.1) and quantified the flow pattern focusing on the wake interception (§3.2). We explore the effect of wake interception by comparing the factual simulation with counterfactual simulations without wake interception in §3.3 and discuss escape trajectory affects wake interception and vice versa in larval fish [29,38] in §3.4. The effect of Reynolds number on the turning angle of the head and the nature of the wake interception is discussed in §3.5. In §3.6, we discuss the implications of wake interception for predator–prey interactions.
2. Material and methods
2.1. Overview
We developed an in-house three-dimensional numerical approach to simulate experimentally recorded C-starts of zebrafish larvae [30]. The model fish swims freely in the horizontal plane (3 d.f.). The only input parameters of the model are the experimentally determined three-dimensional time-dependent shape of the fish's body quantified from video recordings of swimming larvae. The CoM movements and body orientation are not prescribed, but are determined by the hydrodynamic forces generated by the swimming model fish. The force on the body was obtained by coupling the hydrodynamic and body dynamic solutions. Our computational model was programmed entirely in Fortran v. 90 and compiled by the Intel Fortran Compiler, we did not use commercial computational fluid dynamic software. The model has been described previously, including a validation [30] by comparing the experimental flow patterns and kinematics for a spontaneous C-start and forward cyclic swimming. In the electronic supplementary material, appendix, figure A1 shows a diagrammatic overview of the computational approach.
2.2. Fish model and computational grids
The computational model comprises a surface model of the fish to model the fish's body wave, and a local body-fitted grid plus a global grid to model the flow patterns generated by the fish with sufficient resolution both in the near and the far field (electronic supplementary material, figure A3b,c). The fish surface model was based on a larval zebrafish (Danio rerio, Hamilton, 1822) 5 days post fertilization (electronic supplementary material, figure A3a and table A1). The radial width of the body-fitted grid was defined to be less or equal to one-third of the fish's body length. The body grid had 20 radial layers at Re 200 and 2000, and 60 layers at Re 6000 (see the electronic supplementary material, Appendix A, for a validation of the grid resolution), with the radial width of the innermost layer adjacent to the body surface defined to be less than or equal to 0.1 L/ , an empirical formula ensuring that the grid resolution near the fish body is suitably accurate for the flow condition [30,39], where L is the body length of the fish and Re is the Reynolds number (in equation (2.1)). Hence, simulations at larger Re were run with a finer resolution of both the body and the global grids. Furthermore, the radial width of the body-fitted grid at each time step was co-determined by body curvature to accommodate the strong body deformations that occur during C-starts—radial width varied in order to avoid overlap between nearby grid cells (e.g. concave bend in the electronic supplementary material, figure A3d). To simulate the flow around the larva, the body-fitted grid was updated at each time step.
2.3. Hydrodynamic and body dynamic solutions
Hydrodynamic forces (including pressure and shear stress at the body surface) were obtained by solving Navier–Stokes equations both in the body-fitted grid and the global grid. Both solutions were interpolated at the boundary between both grids [30,39–41]. We also interpolated areas of overlap within the body-fitted grid that occurred when the fish's head and tail came close together. The force distribution on the body was used to compute the translational and rotational acceleration of the fish. We then integrated these forces along the body to obtain CoM displacement and the angle of the head. Details of the computational method are described in the electronic supplementary material, Appendices A (hydrodynamic model) and B (body dynamic model).
We computed two types of simulations, factual and counterfactual simulations. In the counterfactual simulations, we removed part of the flow to assess the effect of a particular flow element on the fish. These counterfactual simulations are explained in greater detail in §3.3.
2.4. Parameters
We simulated three C-starts based on published kinematic data [15,29,38]. We assumed that the larvae performed their C-starts at a Reynolds number (Re) of 2000 with Re defined in our computation as
| 2.1 |
where Utail,EXP is the maximum local velocity of the tail in experiment, L is the body length and υ is the kinematic viscosity of water at 25°C (8.714 × 10⁻⁷ m2 s−1). This Re puts C-starts at the transition from intermediate (101 < Re < 103, [42]) to inertial flow regime. We computed non-dimensional quantities in an Earth frame-of-reference, then converted them into dimensional quantities to facilitate comparison with experimental data.
2.5. Coordinates and directions
To facilitate comparisons, all experimental C-starts were re-oriented such that the fish swam in the horizontal plane and turned clockwise during stage 1. We used both fixed and dynamic frames of reference (figure 1). The Earth frame-of-reference XearthYearth was defined by the initial position of the fish's centre of mass (Oearth) as its origin and by the fish's initial orientation defining the negative Yearth axis; the fish frame-of-reference XfishYfish was defined by the position of the fish's centre of mass (Ofish), the Yfish axis points in the tangential direction of the trajectory of the CoM. At the beginning of the simulation, the origins of two frames of reference coincided, and the escape angle of the fish was defined as the azimuth between Yfish and negative Yearth at the end of stage 2.
Figure 1.
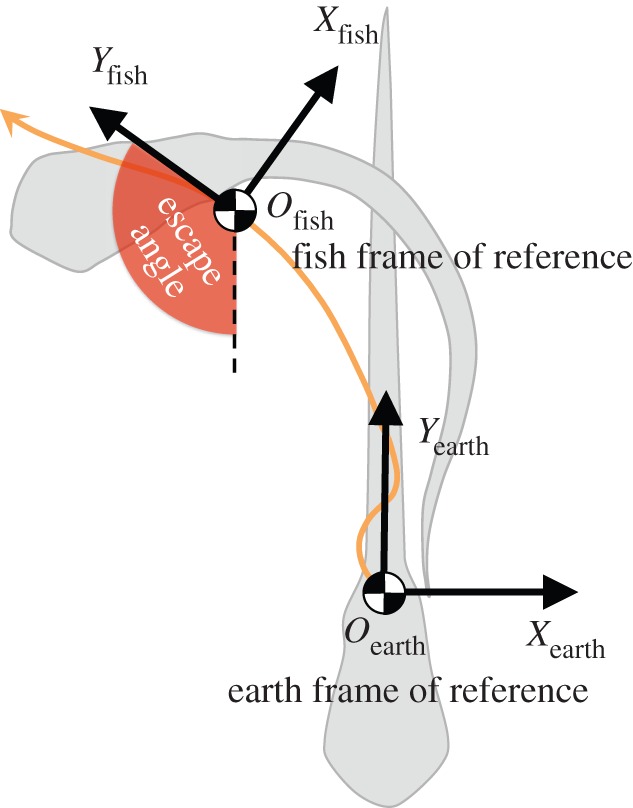
Coordinate system. The Earth frame-of-reference is defined by the position of the fish's centre of mass (origin Oearth) and orientation of the fish before the C-start (-Yearth), the fish frame-of-reference follows the fish throughout the swimming bout and is defined by the tangential direction of the trajectory of the centre of mass (Yfish) and the position of its centre of mass (Ofish); the escape angle is defined as the angle between the Earth frame-of-reference and the fish frame-of-reference at the end of stage 2.
3. Results and discussion
3.1. Kinematic results and validation
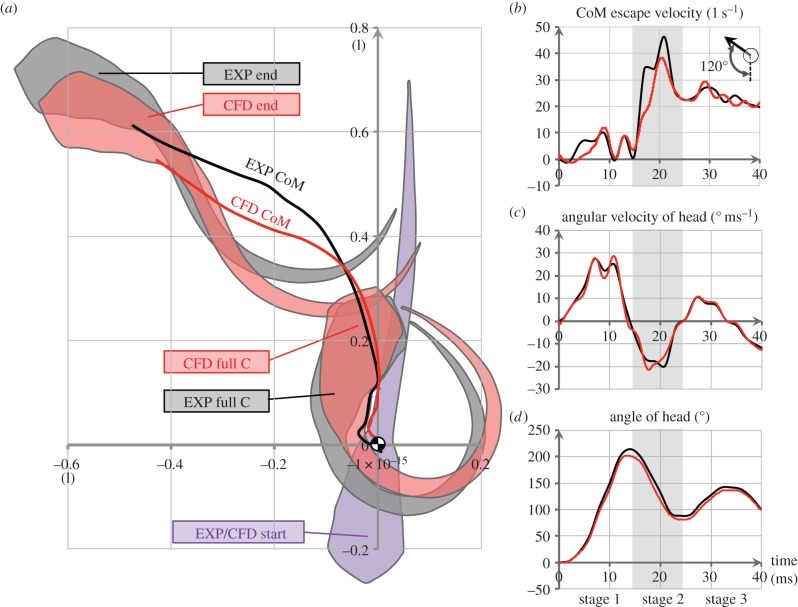
We first simulated the C-start (120° turn) recorded by Budick & O'Malley ([15], figure 4). We imported the body axis sequence (figure 2) into the solver, then compared the computational and experimental kinematic results (figure 3). Starting from an identical position and body orientation (the purple outline with CoM shown in figure 3a, EXP/CFD start), both the experimental and computational fish change the orientation of their head, reaching a similar maximum head angle (214° versus 202°) at a similar time (14 versus 13 ms) after the initiation of the C-start (figure 3d). The angular velocity of the head peaked at approximately 25° ms−1 roughly half way through stage 1 at about 7 ms (figure 3c) and reached similar average values throughout the C-start (e.g. average of 14.2° ms−1 and 14.1° ms−1 at 11–14 ms). The experimentally and computationally obtained body orientations at the instant of the full C-shape in figure 3a were in good agreement (see closely corresponding heading angles in figure 3d). Yet, we observed small differences in body position (figure 3a, black curve experimental fish and red curve computational fish) and escape speed (figure 3b). The experimental fish is shifted relative to the computational one due to subtle differences in body kinematics during stage 1, probably caused by the limited spatial and temporal resolution of the experimental data. This low resolution causes the simulation to underestimate peaks when the simulation interpolates between video frames.
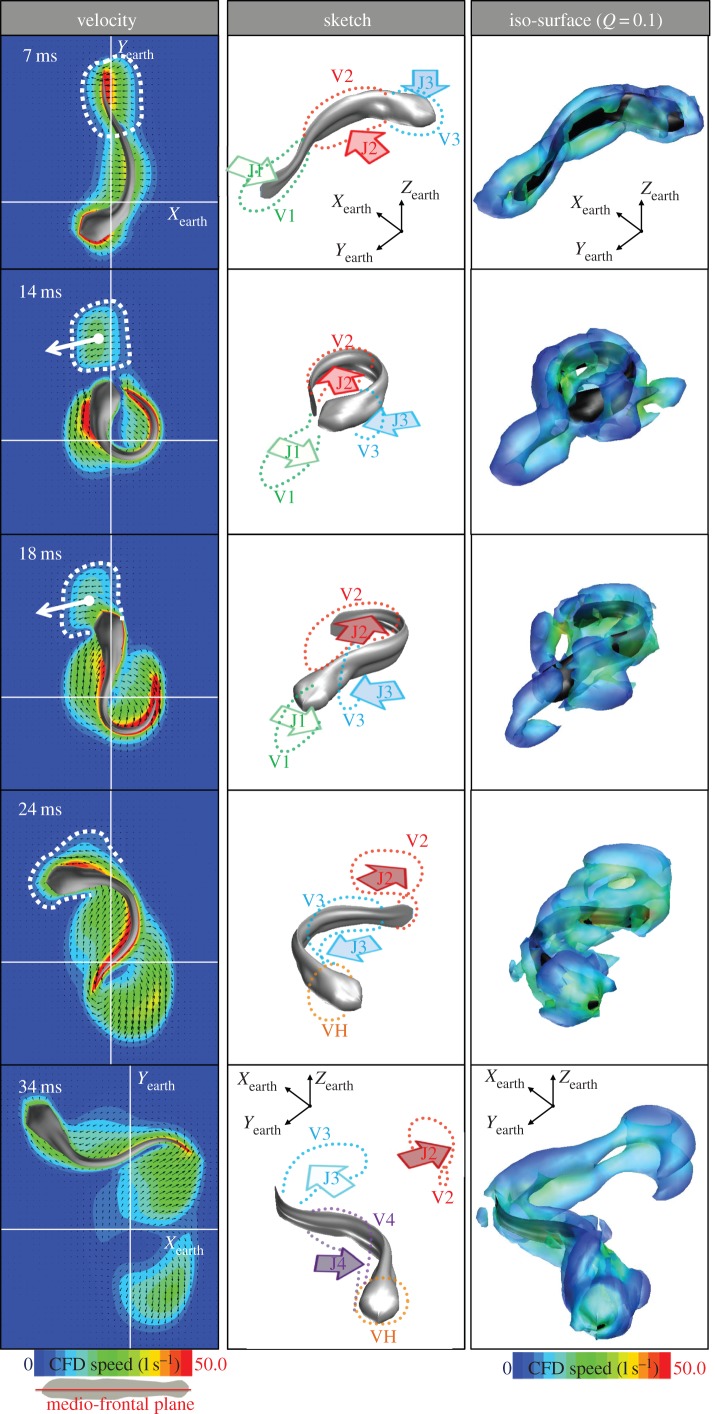
Figure 4.
Flow pattern during the escape response in figure 2. (Left column) Velocity field (colours) in the medio-frontal plane of the fish, and local flow directions (black arrows). The white lines indicate the x and y-axes of the Earth frame-of-reference. The intercepted wake is outlined by a dashed line. (Central column) Sketch of the main flow features. Body jet flows (J) and associated vortex rings (V) are numbered, the vortex ring at the head that forms due to wake interception is named VH. (Right column) Vorticity topology based on iso Q-surfaces (Q = 0.1) coloured by contours of flow velocity.
Figure 2.
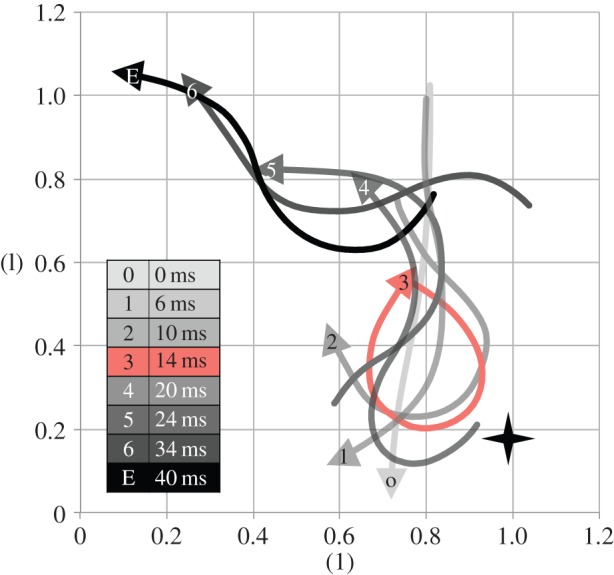
Body midline kinematics based on an observed C-start [15] (arrow head = snout). The fish received a tactile stimulus (positioned by the star) and initiated a C-start from rest at 0 ms. The moment of maximum bending occurred 14 ms after the initiation of the C-start (red midline).
Figure 3.
Comparison of body kinematics between computational (CFD, red) and experimental (EXP, black) results. (a) Body outlines and trajectories of the CoM at the start (EXP/CFD Start; purple outline), the end of stage 1 (full C) and at 40 ms (end). (b) Swimming speed in the escape direction. (c) Angular velocity of the head. (d) Angle of the head. The grey area in panels (a–c) indicates stage 2.
During stage 2, the fish generated a powerful acceleration (figure 3b). The experimental fish reached a maximum velocity in the escape direction of 46 l s−1 at 21 ms, while the computational fish reached a maximum velocity of 38 l s−1 at 20 ms. The latter was 17% lower than the experimental result, again probably due to limited accuracy of the body shape tracking of the C-start. During stage 2, the rotational direction was reversed (compared with stage 1) and the fish reduced its heading angle. By the end of stage 2 at 24 ms, the heading angles were reduced to 88° and 81° in the experiment and the simulation, respectively (figure 3d).
During the following stroke (third tail beat), both experimental and computational fish again reversed heading, turning clockwise, with the heading angle peaking at 33 ms, and reaching a final escape speed of 19 l s−1 and a heading angle of 100° at the end of the sequence. As illustrated in figure 3a, the CoM trajectories of the computational and the experimental fish were similar, but the computational fish was shifted to the left and covered a slightly smaller distance. On the whole, based on the similarity between experimental and CFD results, the computational model was considered capable of providing accurate results.
3.2. Wake interception
Figure 4 provides an overview of the computed flow patterns of the 120° turn, corresponding to previously published frames from the video ([15], figure 4). The left row shows the velocity field in the medio-frontal plane with local flow direction indicated by vectors. The right column shows the vorticity topology based on iso Q-criterion (Q = 0.1). The Q-criterion was defined as
| 3.1 |
where Ω and Φ denote the asymmetric and symmetric parts of the velocity gradient, respectively, ‖ ‖ is the matrix norm [43]. Positive Q iso-surfaces isolate areas where the strength of rotation dominates the strain, thus making those surfaces eligible as vortex envelopes [44]. We selected the Q-criterion for the visualization of vortices because it avoids the typical problems encountered by the pressure and vorticity criterion (for example, in the case of large pressure gradients in the flow or in the case of boundary layer flow with large forward velocity gradients in the lateral and vertical directions of fish surface). These iso-surfaces were coloured according to flow velocity, highlighting the faster flows of the central jets at the centre of each vortex ring. The vortex rings in the right column of figure 4 manifest as a counter-rotating vortex pair in the horizontal cross section in the left column [30]. The diagrams in the middle column highlight the relationship between the jet and the vorticity structures. As the fish initiated the C-start (0–7 ms), the fish's body formed an ‘S’-shape because the larva's posterior end was not stiff enough to follow the mid-body bending. At this initial stage of stage 1, three major jet flows (J1–J3) formed near the tail, mid-body and head (numbering follows convention in Tytell & Lauder [27], note that our J3 formed already in stage 1). These jets were each surrounded by a vortex ring (V1–V3). These vortex rings were connected, hence the horizontal cross section of the three vortex rings showed four vortices with alternating sense of rotation. This initial flow pattern was similar to flow patterns described in previous work [22,30].
As the fish completed stage 1 (7–14 ms), its body was bent so far that the tail almost touched the head. At 14 ms, jet J1 generated by the tail (J1, highlighted by white dashed line in velocity field, left column of figure 4) had already been shed (figure 4: left column, panel 2) and the larva's head was approaching the jet. The jet J1 had an azimuth of approximately 100° to the Yearth axis, pointing the jet into the path of the head (the direction of flow in the centre of J1 is highlighted by a white arrow, figure 4: left column, panel 2).
During stage 2, the fish increased its acceleration considerably and produced an anticlockwise torque, speeding towards wake J1. The fish intercepted and penetrated its own wake in the same time interval as it reached maximum swimming speed (figure 3b: 18–24 ms). When the fish enters the wake J1 (figure 4: 18 ms), the head intercepts the wake with the flow hitting the head in its side. Between the fish first entering its wake and the fish penetrating the wake, the wake and the boundary layer of the fish merged and became indistinguishable by the end of stage 2 at 24 ms. The momentum of the wake might have altered the trajectory of the fish. Furthermore, the interaction with the wake might have changed the velocity gradients near the fish's head, thereby changing inertial and viscous drag on the fish and altering the acceleration performance of the fish during the stage 2.
3.3. Wake-interception effect on escape performance
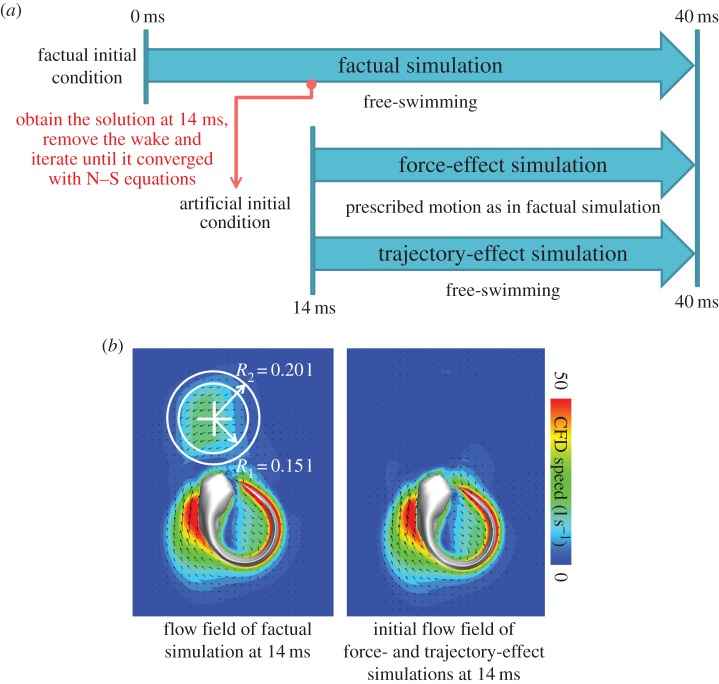
To qualitatively explore the effect of the wake interception on the fish, we ran two counterfactual simulations, one to assess the force exerted by the wake on the fish, and another to assess the effect of the wake of the fish's trajectory. To explore both effects, we obtained the flow field solution at 14 ms of the factual simulation presented in §3.1–3.2 and removed the wake. To remove the wake, we approximated the wake as a sphere with radius 0.15 l radius centred at the wake (white cross). We then set the flow velocity and pressure to zero in all grid cells containing the wake. We then dropped the values within a 0.05 l thick transitional zone along the sphere's periphery linearly to zero to avoid discontinuities in the flow field (figure 5b). Then, we iterated this preliminary solution until it was sufficiently convergent to the N–S equations (electronic supplementary material, equation A1). This converged solution was subsequently used as the ‘artificial’ initial condition for the counterfactual simulations, in which wake interception was prevented (figure 5a).
Figure 5.
(a) Computational procedures to explore the effects of wake interception. We digitally removed the wake at time 14 ms, then iterated the preliminary solution until it converged with N–S equations, then imported it into the counterfactual force-effect and trajectory-effect simulations as artificial initial condition. In the ‘force-effect’ simulation, the fish's trajectory is prescribed to be the same as in the simulation with wake (factual simulation); in the ‘trajectory-effect’ simulation, the fish's trajectory reflects the forces acting on the fish. (b) Wake removal zone.
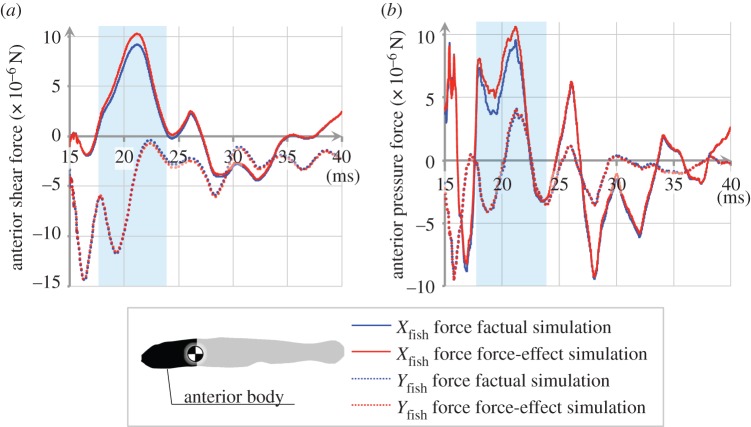
To assess the force exerted by the wake on the fish, we ran a force-effect simulation: we prescribed the fish's CoM translation and heading angle to be identical to those predicted by the factual simulation. Thus, the fish was not swimming freely in the force-effect simulation. To assess the effect of the wake on the fish's trajectory, we developed the trajectory-effect simulation: this simulation is identical to the force-effect simulation except that the fish was swimming freely (figure 5a). Both effect simulations were compared with the factual simulation presented in §3.1–3.2. We confirmed that the force results of the two counterfactual simulations were not spurious. Figure 6 shows that the forces exerted on the fish body are almost identical in all three simulations before the wake interception (before 18 ms), then diverge during the wake interception (18–24 ms), only to converge again after wake interception (at 40 ms).
Figure 6.
Comparison of the hydrodynamic forces acting on the fish with and without wake interception, contrasting factual and force-effect simulation of the escape turn shown in figure 2; forces are quantified along and perpendicular to the fish's instantaneous trajectory at the anterior body, which is the location of the wake interception. The difference is largest at times 18–24 ms (blue window) when the fish intercepts its wake. (a) Shear forces. (b) Pressure forces. The fluid force on the anterior body was mainly a drag force resisting motion. The force-effect simulation repeated the motion of the factual simulation, thus swimming velocities were identical.
Table 1 shows the hydrodynamic force acting on the fish in the two scenarios, the factual simulation and the force-effect simulation. The values for the two scenarios differed markedly (table 1, III and VI). Compared with the hydrodynamic forces acting on the total body, the difference in force along the fish's path of motion (Y-direction) is negligible, but the lateral force (X-direction) is of a similar order of magnitude (table 1, IV versus VI); the intercepted-wake force is of the same order of magnitude as the hydrodynamic force generated by the fish but roughly perpendicular to the fish's hydrodynamic force; hence intercepting the wake causes the fish's forward velocity to change mainly in orientation but not magnitude. By comparing the force on the anterior body (table 1, IV) with the force on the total body (table 1, VI), we find that the lateral intercepted-wake force (1.14 × 10⁻⁶ N) on the anterior body accounts for more than 85% of the lateral force on the total body (1.30 × 10⁻⁶ N)—the wake interacts mainly with the anterior body. The difference between the forces with (table 1, I and IV) and without wake interception (table 1, II and V) is negative (table 1, III and VI), indicating that the intercepted wake pushes the total body to the left and, by pushing against the anterior body, it counteracts the change in heading. If the fish had not intercepted its own wake, it would have turned further away from the threat and its escape trajectory would be further to the right. The main effect of the wake interceptions occurs in stage 2 of the C-start, but the effects carry over into stage 3 (table 1).
Table 1.
Comparison of fluid dynamic forces acting on the fish in the simulations with (factual simulation) and without wake interception (force-effect simulation). Forces are expressed in the fish frame-of-reference. The anterior body force is the force acting on the part of the body anterior to the CoM. See text for further explanation.
| stage | direction | average anterior body force (10−6 N) |
average total force (10−6 N) |
||||
|---|---|---|---|---|---|---|---|
| I factual simulation | II force-effect simulation | III = I–II difference | IV factual simulation | V force-effect simulation | VI = IV–V difference | ||
| 2 (14–24 ms) | Xfish | 4.79 | 5.93 | −1.14 | −5.94 | −4.64 | −1.30 |
| Yfish | −7.78 | −7.69 | −0.09 | 1.17 | 1.15 | 0.02 | |
| 3 (24–36 ms) | Xfish | −3.50 | −3.07 | −0.43 | 0.33 | 1.02 | −0.69 |
| Yfish | −3.54 | −3.80 | 0.26 | −0.32 | −0.67 | 0.35 | |
The main effect of the wake interception on the hydrodynamic forces acting on the fish is visible in figure 6. The anterior body of fish experienced a lower force in the Xfish direction (figure 6) and more force on the entire body occurred in the negative Xfish direction (table 1); hardly any difference in the hydrodynamic force acted in the swimming direction on the fish (Yfish direction) (table 1 and figure 6). Differences between factual and force-effect simulation occurred in both pressure and shear force, but mainly in the Xfish direction (figure 6). As the fish swam through its wake, the wake altered the surface velocity gradients in the fish's boundary layer and affected the surface stresses on the fish.
The comparison between the factual simulation and the trajectory-effect simulation showed that wake interception might change the fish's escape trajectory. When the wake was absent, the fish turned further than the fish that interacted with its wake (figure 7, red and blue curves, respectively). The difference in the turning angle of the fish was 5° at the end of stage 2 (24 ms) and by 7° at 40 ms.
Figure 7.
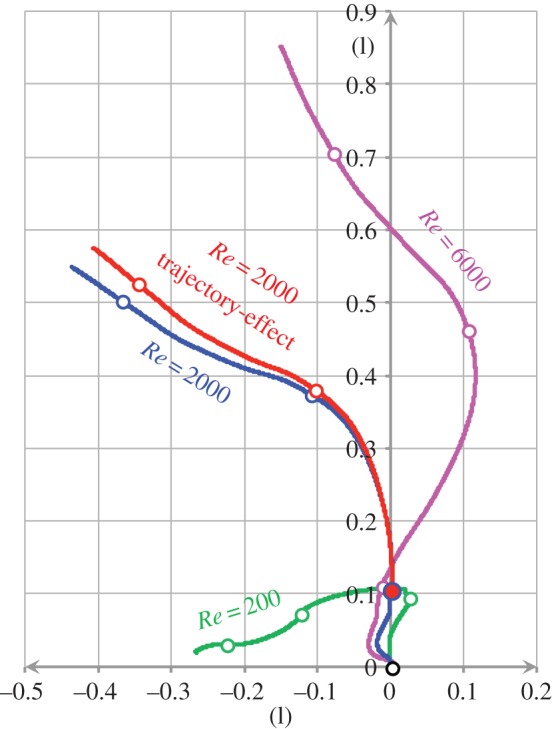
Simulated swimming trajectories of fish performing a C-start, based on experimentally observed body wave kinematics [15]. Paths are calculated for three Reynolds numbers and a simulation that removes the wake interception. Fish achieve greater re-orientation with increasing Reynolds number; wake interception (blue trajectory) decreases escape angle (red trajectory = trajectory-effect model, starting at 14 ms (red dot), rather than the origin (open black dot), with the wake removed as the initial condition; see main text for further explanation).
Wake interception had a small effect on total power defined by the electronic supplementary material, equation (A11). As shown in table 2, the wake interception marginally reduced power output by approximately 1%, suggesting that the wake interception mainly deflected the escape path by changing surface drag, but it did not significantly affect energy expenditure.
Table 2.
Comparison of total power output of the fish in the simulation with (factual simulation) and without wake interception (trajectory-effect simulation).
| stage | average power output (10−6 J s−1) |
||
|---|---|---|---|
| factual simulation | trajectory-effect simulation | wake-interception effect | |
| 2 (14–24 ms) | 13.78 | 13.88 | −0.14 |
| 3 (24–36 ms) | 3.29 | 3.33 | −0.04 |
Although our calculations provided specific values of the difference between the factual simulation and the two counterfactual simulations, these values only provide a qualitative exploration of wake-interception effects due to the nonlinear properties of fluid systems—the total flow phenomenon is not a linear superposition of phenomena due to the wake and the rest of the flow.
3.4. Flow patterns of starts in different directions
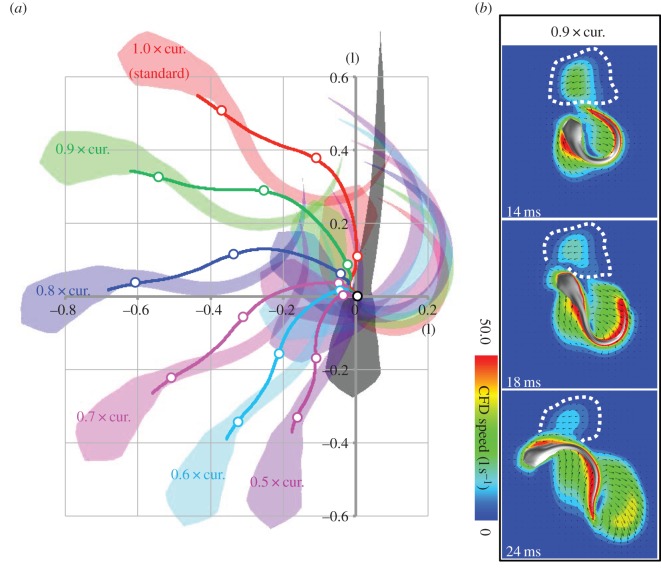
The effect of wake interception on the escape trajectory should depend on escape direction—wake interception can only occur if the fish turns far enough to intersect its own wake. To explore the sensitivity of the wake-interception effect to escape direction, we gradually reduced the body curvature of the C-start from 1.0 (factual simulation) to 0.9, 0.8, 0.7, 0.6 and 0.5 times the experimentally observed curvatures. This reduction in body curvature led to a reduction in escape angle as shown in figure 8. In the 0.9 times curvature simulation, the fish brushed up against the proximal side of the jet. As curvature decreased to 0.8 times and lower, the fish no longer intercepted its wake. In order to intercept its wake, the fish must turn at least 100°.
Figure 8.
(a) Predicted trajectories for a range of maximum body curvatures reached during stage 1, based on experimental data for a 120°turn [15], at Re 2000. Decreasing the maximum body curvature decreases the turning angle. (b) At 0.9 of the experimentally observed curvature, turning angle is sufficiently lower for the fish to no longer intercept its wake.
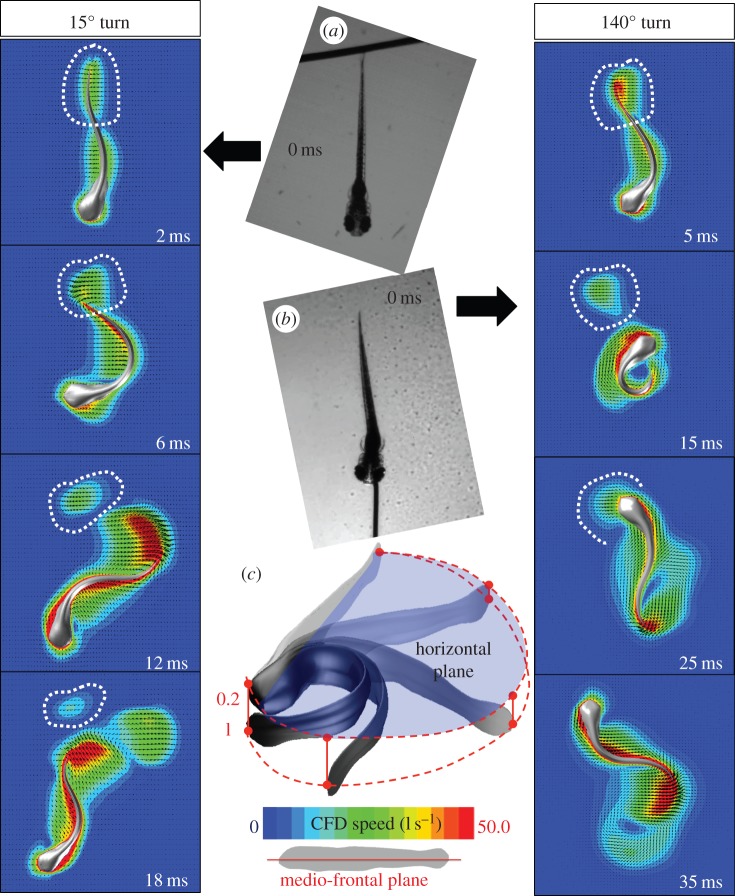
To explore the lower and upper bounds of the turning angle further, we simulated two additional experimentally observed C-starts, a 15° and a 140° turn. During the 15° turn (from [29], figure 3), the larva was touched at the tail (figure 9a) and started a forward escape. During the 140° turn (from [38], figure 1a), the fish was touched at the snout (figure 9b) and turned to swim away from the threat. In the 140° turn, the body bent so that the tail ended up underneath the head at the end of stage 1 (figure 9c).
Figure 9.
Simulated C-starts of larval fish performing a shallow (15°) and a sharp turn (140°), based on experimental data [29,38]. (a and left column) Larva was touched at the tail, executing a forward escape response. (b and right column) Larva was touched at the head, executing a sharp turn. (c) During the 140° turn, the fish larva bends so strongly that its tail and head overlap; our simulation assumes that the tail crosses just below the head.
During the 15° turn (figure 9, left column), the wake shed during the preparative stroke is positioned similarly to the wake shed during the 120° turn relative to the fish, yet the preparative stroke was briefer, the body bent less and the fish did not turn far enough to intercept its wake.
By contrast, during the 140° turn, the larva bent its body strongly, turning even further than during the 120° turn. In this stronger turn, the larva's head overshot the wake during stage 1 and then intercepted the wake not from the larva's front, as in the 120° turn, but from the larva's left side (figure 9: right column). The wake (highlighted by the white dash line in figure 9) again merged with the boundary layer of the anterior fish body. To our knowledge, this C-start event represents one of the largest turns of larval fish recorded so far. Yet even in this extreme case, the fish did not bypass the wake, suggesting that fish larvae might not be capable of turning far enough to overshoot and bypass the wake entirely. It may be impossible for larval fish executing a U-turn to avoid wake interception, according to the analysis in §3.3, and this implies that larvae executing a U-turn will be affected by wake interception.
3.5. Large fish might overshoot the ‘window of wake interception’
The results in §3.4 suggested fish larvae may be able to under- but not overshoot to avoid wake interception. To assess the effect of flow regime, we modelled the escape trajectory of the fish for two additional Re (200 and 6000), assuming identical body shape and body wave kinematics but either decreasing Re by one order of magnitude or tripling Re and comparing both simulations to the original case (120° turn, Re 2000) (figure 7). We assumed that the simulation at Re = 6000 did not enter the turbulent regime and could be computed by our laminar flow model. Anderson et al. [45] showed that at Re 60 000, the boundary layer of a scup remains laminar along the entire body. Tytell & Ellington [46] performed particle image velocimetry measurements of an artificial vortex ring as a wake model of hovering hawkmoth and they found that the wake remains laminar at a ring Re 5200 (based on a different definition in which the vortex ring velocity and its radius are used as reference speed and length, respectively) and for a longer duration (more than 1 s, dimensionless time: more than 5 × 10⁻⁴). Therefore, it is safe to assume that a fish's wake remains laminar long enough (less than 20 ms; dimensionless time: less than 3.6 × 10⁻⁴) for wake interception to occur before the wake transits to turbulence. Note that based on the same definition of Re used by Tytell and Ellington, the Re of the vortex ring of our Re 6000 simulation is less than 800, far smaller than 5200, suggesting that there exists in fact a considerable safe space before the wake becomes turbulence. This simulation at high Re predicts that larger fish (fish swimming at higher Re) are able to turn faster and further than smaller fish (fish swimming at lower Re). Compared with the original case, lowering Re decreased turning angle and total distance covered over the first three tail beats of the C-start; increasing Re had the opposite effect, improving overall escape performance. While large fish might be able to overshoot and escape their own wake, larvae might not.
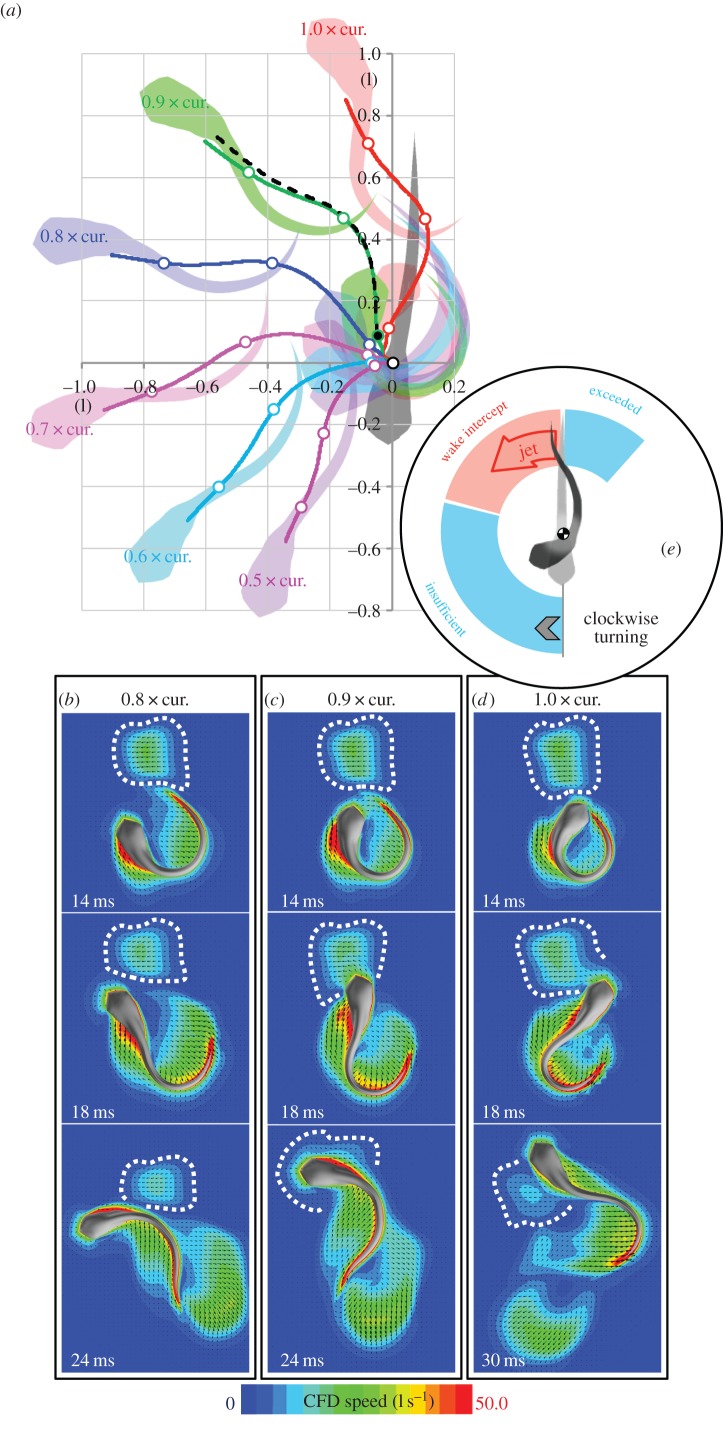
To explore how escape trajectory and wake interception depend on body wave at high Re, we again varied the body curvature from 0.9, 0.8, 0.7, 0.6 to 0.5 times the curvature of the 120° turn case of Budick & O'Malley ([15], figure 4), then calculated trajectories (figure 10a) and flow fields (figure 10b–d). We found that the simulated fish at 1.0 times the experimentally observed curvature achieved a higher escape angle than the larva at Re 2000 (escape angle 160°) and is intercepting only a small part of the wake at the distal rather than the near side of the wake (figure 10d), in contrast to the larval fish at Re 2000, which undershot its wake by passing the wake on the near side. We predict that increasing Re further will cause the fish to achieve even higher escape angles and cause the fish to overshoot its wake. At 0.9 times experimentally observed curvature and Re = 6000, the fish achieved a 120° turn and intercepted its own wake head on (figure 10c). At 0.8 times the experimentally observed curvature, the fish achieved a 100° turn and undershot its own wake, touching the proximal side of its wake (figure 10b). When the fish intercepted its own wake head-on, there was again a visible wake-interaction effect on the fish's trajectory; without the wake interaction, the fish would have turned 5° further than it did with the wake interaction (comparison between solid green and dash black lines, using the same method as factual and trajectory-effect simulations in §3.3), a similar effect to the one observed in the fish larva at Re 2000 (figure 7, blue and red curves).
Figure 10.
Simulated C-starts for a fish larva in the inertial flow regime (Re 6000), based on the body kinematics observed in [15], to explore the effects of Re on wake interception. (a) Predicted trajectories for a range of maximum body curvatures. (Black dashed trajectory = trajectory-effect model, starting from the solid black dot position at 14 ms). (b–d) Flow velocity field for simulations at 0.8, 0.9 and 1.0 times the originally observed body curvature. (e) Summary of the wake-interception effect in larval fish. Fish larvae will intercept their wake during a C-start if their turning angle is between 100° and 180°; fish larvae are able to undershoot but not overshoot their wake, possibly due to Re effects.
3.6. Wake interception in predator–prey interactions
Because of the effect of wake interception on their trajectory, escaping fish must not only take into account a predator's speed and distance, but also the possible interaction with their own wake, initiated in the previous tail beat. In the scenarios explored in this study, we found that wake interaction mainly reduces the turning angle of the escape response, which we do not consider a benefit. However, the wake interception does not reduce the tangential velocity of the fish.
Predator–prey interaction studies so far focused on sensory constraints affecting the directionality of escape responses (for a review, see [47]). Studies on aerial predator–prey interactions have shown that locomotory constraints affect the escape trajectory of birds escaping from raptors [48], and studies on insects voice similar concerns about the directional bias in escape turns [49]. Studies on aquatic predator–prey interactions suggest that size effects play a large role in capture strategy [50] and that context plays a large role in prey's escape response [51]. This study points for the first time to locomotory constraints imposed by flow effects that are likely to occur in many aquatic prey. Many aquatic prey exhibit binomial or non-random distributions in their escape trajectory, with away-responses around 180° accounting for one of the peaks in the distribution [16]. Whenever a predator approaches prey from the front, the prey is likely to execute a turn to direct its escape away from the predator. Such turns are likely to cause the prey to encounter its own wake, and this study suggests that such wake encounters may affect the escape trajectory of the prey. So, both prey and scientists need to take into account locomotory constraints in the directionality of escape responses.
Our simulations only explored horizontal escape responses. Wake interaction might have a different effect on escape responses that have a vertical component, and fish larvae are known to escape consistently downward even in response to a horizontal threat [52]. When choosing escape trajectories in three dimensions, prey fish might have a wider range of options to use or avoid the deflection effect of the wake interception.
4. Conclusion
When simulating the flow generated by a fish larva executing an experimentally observed C-start ([15], figure 4), we found that fish larvae can intercept their own wake. The larva produced a jet flow with its tail during stage 1 of the C-start and interacted with it during stage 2. According to our simulation, the intercepted wake may significantly increase the lateral force on the fish during stage 2. This lateral force deflected the fish's escape trajectory by several degrees. Yet, it had no significant effect on total power output. We hypothesize that during the wake interception, the fish ‘absorbed’ part of the momentum of the previously generated wake into its boundary layer, leading to the observed deflection in the escape trajectory.
To intercept the wake during a C-start, the turning angle of fish needs to be within an appropriate window (figure 10e). If the fish turns by less than 100°, it undershoots its own wake and will not interact with the wake. If the fish turns by 100–180°, its anterior body will intercept the wake, and this interaction will reduce its net turning angle. If the fish turns by more than 180°, the fish might overshoot its wake and again will not intercept its wake. Currently, we have experimental data showing that fish larvae either undershoot (turning angle less than 100°) or intercept their wake (100° ≤ turning angle ≤ 180°). However, we have no kinematic data that suggest that fish larvae actually overshoot their wake (turning angle greater than 180°). Based on the trend observed in our data, we predict that as the Reynolds number increases, the turning angle will increase, causing the fish to overshoot and miss the window of wake interception.
Supplementary Material
Supplementary Material
References
- 1.Miersch L, Hanke W, Wieskotten S, Hanke FD, Oeffner J, Leder A, Brede M, Witte M, Dehnhardt G. 2011. Flow sensing by pinniped whiskers . Phil. Trans. R. Soc. B 366, 3077–3084. ( 10.1098/rstb.2011.0155) [DOI] [PMC free article] [PubMed] [Google Scholar]
- 2.Hanke W, Wieskotten S, Marshall C, Dehnhardt G. 2013. Hydrodynamic perception in true seals (Phocidae) and eared seals (Otariidae). J. Comp. Physiol. A. 199, 421–440. ( 10.1007/s00359-012-0778-2) [DOI] [PubMed] [Google Scholar]
- 3.Pohlmann K, Grasso FW, Breithaupt T. 2001. Tracking wakes: the nocturnal predatory strategy of piscivorous catfish. Proc. Natl Acad. Sci. USA 98, 7371–7374. ( 10.1073/pnas.121026298) [DOI] [PMC free article] [PubMed] [Google Scholar]
- 4.Gardiner JM, Atema J. 2014. Flow sensing in sharks: lateral line contributions to navigation and prey capture. In Flow sensing in air and water (ed. Bleckmann H, Mogdans J, Coombs SL.), pp. 127–146. Berlin, Germany: Springer. [Google Scholar]
- 5.Stewart WJ, Cardenas GS, McHenry MJ. 2013. Zebrafish larvae evade predators by sensing water flow. J. Exp. Biol. 216, 388–398. ( 10.1242/jeb.072751) [DOI] [PubMed] [Google Scholar]
- 6.Heuch PA, Doall MH, Yen J. 2007. Water flow around a fish mimic attracts a parasitic and deters a planktonic copepod. J. Plankton Res. 29(Suppl. 1), i3-i16. ( 10.1093/plankt/fbl060) [DOI] [Google Scholar]
- 7.van Duren LA, Stamhuis EJ, Videler JJ. 1998. Reading the copepod personal ads: increasing encounter probability with hydromechanical signals. Phil. Trans. R. Soc. Lond. B 353, 691–700. ( 10.1098/rstb.1998.0235) [DOI] [Google Scholar]
- 8.Liao JC, Beal DN, Lauder GV, Triantafyllou MS. 2003. The Kármán gait: novel body kinematics of rainbow trout swimming in a vortex street. J. Exp. Biol. 206, 1059–1073. ( 10.1242/jeb.00209) [DOI] [PubMed] [Google Scholar]
- 9.Liao JC, Beal DN, Lauder GV, Triantafyllou MS. 2003. Fish exploiting vortices decrease muscle activity. Science 302, 1566–1569. ( 10.1126/science.1088295) [DOI] [PubMed] [Google Scholar]
- 10.Magnuson JJ. 1978. Locomotion by scombrid fishes: hydrodynamics, morphology, and behavior. In Fish physiology, vol. VII. Locomotion (eds Hoar WS, Randall DJ.), pp. 240–315. New York, NY: Academic Press. [Google Scholar]
- 11.Weihs D, Webb PW. 1983. ‘Optimization of locomotion’. In Fish biomechanics (eds Webb PW, Weihs D.), pp. 339–371. New York, NY: Praeger. [Google Scholar]
- 12.Herskin J, Steffensen JF. 1998. Energy savings in sea bass swimming in a school: measurements of tail beat frequency and oxygen consumption at different swimming speeds. J. Fish Biol. 53, 366–376. ( 10.1111/j.1095-8649.1998.tb00986.x) [DOI] [Google Scholar]
- 13.Tytell ED, Standen EM, Lauder GV. 2008. Escaping flatland: three-dimensional kinematics and hydrodynamics of median fins in fishes. J. Exp. Biol. 211, 187–195. ( 10.1242/jeb.008128) [DOI] [PubMed] [Google Scholar]
- 14.Tytell ED, Alexander JK. 2007. Bluegill Lepomis macrochirus synchronize pectoral fin motion and opercular pumping. J. Fish Biol. 70, 1268–1279. ( 10.1111/j.1095-8649.2007.01416.x) [DOI] [Google Scholar]
- 15.Budick SA, O'Malley DM. 2000. Locomotor repertoire of the larval zebrafish: swimming, turning and prey capture. J. Exp. Biol. 203, 2565–2579. [DOI] [PubMed] [Google Scholar]
- 16.Domenici P, Blagburn JM, Bacon JP. 2011. Animal escapology II: escape trajectory case studies. J. Exp. Biol. 214, 2474–2494. ( 10.1242/jeb.053801) [DOI] [PMC free article] [PubMed] [Google Scholar]
- 17.Webb PW. 1976. The effect of size on the fast-start performance of rainbow trout Salmo gairdneri and a consideration of piscivorous predator–prey interaction. J. Exp. Biol. 65, 157–177. [DOI] [PubMed] [Google Scholar]
- 18.Jayne BC, Lauder GV. 1993. Red and white muscle activity and kinematics of the escape response of bluegill sunfish during swimming. J. Comp. Physiol. A 173, 495–508. ( 10.1007/BF00193522) [DOI] [Google Scholar]
- 19.Spierts IL, van Leeuwen JL. 1999. Kinematics and muscle dynamics of C- and S-starts of carp (Cyprinus carpio L.). J. Exp. Biol. 202, 393–406. [DOI] [PubMed] [Google Scholar]
- 20.Tytell ED, Lauder GV. 2002. The C-start escape response of Polypterus senegalus: bilateral muscle activity and variation during stage 1 and 2. J. Exp. Biol. 205, 2591–2603. [DOI] [PubMed] [Google Scholar]
- 21.Müller UK, van Leeuwen JL. 2004. Swimming of larval zebrafish: ontogeny of body waves and implications for locomotory development. J. Exp. Biol. 204, 853–868. ( 10.1242/jeb.00821) [DOI] [PubMed] [Google Scholar]
- 22.Müller UK, van den Boogaart JGM, van Leeuwen JL. 2008. Flow patterns of larval fish: undulatory swimming in the intermediate flow regime. J. Exp. Biol. 211, 196–205. ( 10.1242/jeb.005629) [DOI] [PubMed] [Google Scholar]
- 23.Harper DG, Blake RW. 1990. Fast-start performance of rainbow trout Salmo gairdneri and northern pike Esox lucius. J. Exp. Biol. 150, 321–342. [Google Scholar]
- 24.Domenici P, Blake RW. 1991. The kinematics and performance of the escape response in the angelfish (Pterophyllum eimekei). J. Exp. Biol. 156, 187–205. [Google Scholar]
- 25.Eaton RC, Hackett JT. 1984. The role of Mauthner cells in fast-starts involving escape in teleost fish. In Neural mechanisms of startle behavior (ed. Eaton RC.), pp. 213–266. New York, NY: Plenum Press. [Google Scholar]
- 26.Niesterok B, Hanke W. 2013. Hydrodynamic patterns from fast-starts in teleost fish and their possible relevance to predator-prey interactions. J. Comp. Physiol. A 199, 139–149. ( 10.1007/s00359-012-0775-5) [DOI] [PubMed] [Google Scholar]
- 27.Tytell ED, Lauder GV. 2008. Hydrodynamics of the escape response in bluegill sunfish, Lepomis macrochirus. J. Exp. Biol. 211, 3359–3369. ( 10.1242/jeb.020917) [DOI] [PMC free article] [PubMed] [Google Scholar]
- 28.Danos N, Lauder GV. 2007. The ontogeny of fin function during routine turns in zebrafish Danio rerio. J. Exp. Biol. 210, 3374–3386. ( 10.1242/jeb.007484) [DOI] [PubMed] [Google Scholar]
- 29.Li G, Liu H, Müller UK, van Leeuwen JL. 2011. Swimming hydrodynamics and maneuverability in C-start of zebrafish larvae: an integrated computational study. In ASME-JSME-KSME Joint Fluids Engineering Conf. 2011, Hamamatsu, Japan, AJK2011-19020. New York, NY: American Society of Mechanical Engineers. [Google Scholar]
- 30.Li G, Müller UK, van Leeuwen JL, Liu H. 2012. Body dynamics and hydrodynamics of swimming fish larvae: a computational study. J. Exp. Biol. 215, 4015–4033. ( 10.1242/jeb.071837) [DOI] [PubMed] [Google Scholar]
- 31.Gazzola M, van Rees WM, Koumoutsakos P. 2012. C-start: optimal start of larval fish. J. Fluid Mech. 698, 5–18. ( 10.1017/jfm.2011.558) [DOI] [Google Scholar]
- 32.Borazjani I, Sotiropoulos F, Tytell ED, Lauder GV. 2012. Hydrodynamics of the bluegill sunfish C-start escape response: three-dimensional simulations and comparison with experimental data. J. Exp. Biol. 215, 671–684. ( 10.1242/jeb.063016) [DOI] [PubMed] [Google Scholar]
- 33.Borazjani I. 2013. The functional role of caudal and anal/dorsal fins during the C-start of a bluegill sunfish. J. Exp. Biol. 216, 1658–1669. ( 10.1242/jeb.079434) [DOI] [PubMed] [Google Scholar]
- 34.Eaton RC, Bombardieri RA, Meyer DL. 1977. The Mauthner-initiated startle response in teleost fish. J. Exp. Biol. 66, 65–81. [DOI] [PubMed] [Google Scholar]
- 35.Domenici P, Blake RW. 1997. The kinematics and performance of fish fast-start swimming. J. Exp. Biol. 200, 1165–1178. [DOI] [PubMed] [Google Scholar]
- 36.Domenici P, Blake RW. 1993. The effect of size on the kinematics and performance of angelfish (Pterophyllum eimekei) escape responses. Can. J. Zool. 71, 2319–2326. ( 10.1139/z93-325) [DOI] [Google Scholar]
- 37.McHenry MJ, Nair AM, Stewart WJ, Changsing K, Soto A. 2014. How zebrafish larvae sense and evade fish predators. Integr. Comp. Biol. 54, E137 ( 10.1098/rsbl.2009.0048) [DOI] [Google Scholar]
- 38.Friedrich T, Lambert AM, Masino MA. 2012. Mutation of zebrafish dihydrolipoamide branched-chain transacylase E2 results in motor dysfunction and models maple syrup urine disease. Dis. Model. Mech. 5, 248–258. ( 10.1242/dmm.008383) [DOI] [PMC free article] [PubMed] [Google Scholar]
- 39.Liu H. 2009. Integrated modeling of insect flight: from morphology, kinematics to aerodynamics. J. Comput. Phys. 228, 439–459. ( 10.1016/j.jcp.2008.09.020) [DOI] [Google Scholar]
- 40.Liu H, Kawachi K. 1999. A numerical study of undulatory swimming. J. Comput. Phys. 155, 223–247. ( 10.1006/jcph.1999.6341) [DOI] [Google Scholar]
- 41.Prewitt NC, Belk DM, Shyy W. 2000. Parallel computing of overset grids for aerodynamic problem with moving objects. Progr. Aerospace Sci. 36, 117–172. ( 10.1016/S0376-0421(99)00013-5) [DOI] [Google Scholar]
- 42.McHenry MJ, Lauder GV. 2005. The mechanical scaling of coasting in zebrafish (Danio rerio). J. Exp. Biol. 208, 2289–2301. ( 10.1242/jeb.01642) [DOI] [PubMed] [Google Scholar]
- 43.Hunt JCR, Wray AA, Moin P. 1988. Eddies, streams, and convergence zones in turbulent flows. In Studying Turbulence Using Numerical Simulation Databases, 2. Proc. 1988 Summer Program, SEE N89-24538 18–34, pp. 193–208. Stanford, CA: Center for Turbulence Research. [Google Scholar]
- 44.Dubief Y, Delcayre F. 2000. On coherent-vortex identification in turbulence. J. Turbul. 1, N11 ( 10.1088/1468-5248/1/1/011) [DOI] [Google Scholar]
- 45.Anderson EJ, McGillis WR, Grosenbaugh MA. 2001. The boundary layer of swimming fish. J. Exp. Biol. 204, 81–102. [DOI] [PubMed] [Google Scholar]
- 46.Tytell ED, Ellington CP. 2003. How to perform measurements in a hovering animal's wake: physical modelling of the vortex wake of the hawkmoth, Manduca sexta. Phil. Trans. R. Soc. Lond. B 358, 1559–1566. ( 10.1098/rstb.2003.1355) [DOI] [PMC free article] [PubMed] [Google Scholar]
- 47.Domenici P, Blagburn JM, Bacon JP. 2011. Animal escapology I: theoretical issues and emerging trends in escape trajectories. J. Exp. Biol. 214, 2463–2473. ( 10.1242/jeb.029652) [DOI] [PMC free article] [PubMed] [Google Scholar]
- 48.Hedenström A, Rosén M. 2001. Predator versus prey: on aerial hunting and escape strategies in birds. Behav. Ecol. 12, 150–156. ( 10.1093/beheco/12.2.150) [DOI] [Google Scholar]
- 49.Muijres FT, Elzinga MJ, Melis JM, Dickinson MH. 2014. Flies evade looming targets by executing rapid visually directed banked turns. Science 344, 172–177. ( 10.1126/science.1248955) [DOI] [PubMed] [Google Scholar]
- 50.Domenici P. 2001. The scaling of locomotor performance in predator–prey encounters: from fish to killer whales. Comp. Biochem. Physiol. A Mol. Integr. Physiol. 131, 169–182. ( 10.1016/S1095-6433(01)00465-2) [DOI] [PubMed] [Google Scholar]
- 51.Domenici P. 2010. Context-dependent variability in the components of fish escape response: integrating locomotor performance and behavior. J. Exp. Zool. A Ecol. Genet. Physiol. 313, 59–79. ( 10.1002/jez.580) [DOI] [PubMed] [Google Scholar]
- 52.Skajaa K, Browman HI. 2007. The escape response of food-deprived cod larvae (Gadus morhua L.). J. Exp. Mar. Biol. Ecol. 353, 135–144. ( 10.1016/j.jembe.2007.01.014) [DOI] [Google Scholar]
Associated Data
This section collects any data citations, data availability statements, or supplementary materials included in this article.


