

Abstract
Cellular homeostasis requires a fine balance between energy uptake, utilization, and growth. Dbp2 is a member of the DEAD-box protein family in Saccharomyces cerevisiae with characterized ATPase and helicase activity in vitro. DEAD-box RNA helicases are a class of enzymes that utilize ATP hydrolysis to remodel RNA and/or RNA–protein (RNP) composition. Dbp2 has been proposed to utilize its helicase activity in vivo to promote RNA–protein complex assembly of both messenger (m)RNAs and long noncoding (lnc)RNAs. Previous work from our laboratory demonstrated that loss of DBP2 enhances the lncRNA-dependent transcriptional induction of the GAL genes by abolishing glucose-dependent repression. Herein, we report that either a carbon source switch or glucose deprivation results in rapid export of Dbp2 to the cytoplasm. Genome-wide RNA sequencing identified a new class of antisense hexose transporter transcripts that are specifically upregulated upon loss of DBP2. Further investigation revealed that both sense and antisense hexose transporter (HXT) transcripts are aberrantly expressed in DBP2-deficient cells and that this expression pathway can be partially mimicked in wild-type cells by glucose depletion. We also find that Dbp2 promotes ribosome biogenesis and represses alternative ATP-producing pathways, as loss of DBP2 alters the transcript levels of ribosome biosynthesis (snoRNAs and associated proteins) and respiration gene products. This suggests that Dbp2 is a key integrator of nutritional status and gene expression programs required for energy homeostasis.
Keywords: helicase, noncoding, metabolism, DEAD-box, transport
CELL growth and division is intimately coupled to cell mass, with the nutrient availability and ribosome content playing a key role in dictating growth rate (Lempiainen and Shore 2009). This involves phosphorylation cascades such as the TOR (target of rapamycin) and the Ras–cAMP–protein kinase A signaling pathways to transmit information regarding the availability of nutrients to essential processes for cell growth (Powers and Walter 1999; Warner 1999; Lempiainen and Shore 2009; Broach 2012).
Dbp2 is a member of the DEAD-box RNA helicase family in the budding yeast Saccharomyces cerevisiae. DEAD-box proteins are RNA-dependent ATPases that utilize ATP hydrolysis to catalyze structural rearrangements to RNA and RNA–protein (RNP) complexes (Bowers et al. 2006; Bhaskaran and Russell 2007; Del Campo et al. 2009; Jankowsky 2011; Putnam and Jankowsky 2013b). The metazoan ortholog of Dbp2, hDDX5, or p68 has been linked to ribosome biogenesis as well as a variety of gene regulatory processes including transcriptional regulation, alternative splicing, and mRNA export (Wilson et al. 2004; Buszczak and Spradling 2006; Caretti et al. 2006; Jalal et al. 2007; Salzman et al. 2007; Camats et al. 2008; Clark et al. 2008; Fuller-Pace and Moore 2011). Budding yeast Dbp2 is also required for ribosome biogenesis and numerous processes linked to transcriptional fidelity (Barta and Iggo 1995; Bond et al. 2001; Bohnsack et al. 2009; Cloutier et al. 2012; Cloutier et al. 2013; Ma et al. 2013).
Biochemical characterization has established that Dbp2 is a bona fide helicase and ATPase in vitro, with robust duplex unwinding in line with other DEAD-box proteins (Cloutier et al. 2012; Kovalev et al. 2012; Ma et al. 2013). Dbp2 associates directly with actively transcribed chromatin, suggestive of a cotranscriptional role (Cloutier et al. 2012). Moreover, loss of DBP2 results in decreased association of mRNA-binding proteins and nuclear export factors Yra1, Nab2, and Mex67 to mRNA (Ma et al. 2013). This has led to the model that Dbp2 promotes mRNP assembly by modulating nascent RNA structure during transcription.
Recent work from our laboratory connected the RNA helicase Dbp2 to long noncoding RNA (lncRNA)-dependent gene regulation (Cloutier et al. 2013). Although the precise molecular role(s) for the >30,000 eukaryotic lncRNAs identified thus far is not well defined, an emerging theme is that lncRNAs fine tune transcriptional switches in gene expression (Fatica and Bozzoni 2014). The GAL cluster genes are part of the galactose metabolic switch that allows budding yeast to rapidly adapt to the availability of galactose as an alternative to glucose as a carbon source (Lohr et al. 1995; Sellick et al. 2008). This switch involves a number of carbon source sensors, sugar transporters, signaling cascades, and transcriptional effectors to globally alter the metabolic program for energy production (Gancedo 1998; Johnston and Kim 2005; Traven et al. 2006; Broach 2012). Interestingly, our work revealed that the GAL lncRNAs function in this switch by enhancing the transcriptional response rate to the carbon source switch (Cloutier et al. 2013). Dbp2 antagonizes this role by maintaining glucose-dependent repression of the GAL genes, with loss of DBP2 enhancing transcriptional induction in an lncRNA-dependent manner (Cloutier et al. 2013). This suggests that Dbp2 may be fundamentally integrated into gene regulatory programs that are responsive to nutritional status of the cell.
Herein, we show that Dbp2 plays a global role in glucose-dependent repression. Our results suggest that this RNA helicase is both regulated by carbon source availability and controls expression of energy-producing and -consuming gene expression networks. We also document a class of lncRNAs that are antisense to hexose transporter genes and show that the levels of these lncRNAs are dependent on Dbp2. These results are intriguing because glucose-dependent repression is primarily maintained by transcription factors whose activity is controlled by cellular signaling cascades. Our work now establishes a role for an RNA helicase in this process, indicating that gene expression networks may also be regulated by modulation of RNA structure.
Materials and Methods
Yeast strains
The strains used in this study include: DBP2–GFP, MATa DBP2–GFP:HIS3 his3∆1 leu2∆0 met15∆0 ura3∆0; wild type, MATa his3∆1 leu2∆0 met15∆0 ura3∆0 dbp2∆ (BTY115), MATa dbp2::KanMx6 his3∆1 leu2∆0 met15∆0 ura3∆0; msn5Δ DBP2–GFP MATa msn5::KanMx6 DBP2–GFP:HIS3 his3∆1 leu2∆0 met15∆0 ura3∆0; snf1Δ DBP2–GFP MATa snf1::KanMx6 DBP2–GFP:HIS3 his3∆1 leu2∆0 met15∆0 ura3∆0; hog1Δ DBP2–GFP, MATa hog1::KanMx6 DBP2–GFP:HIS3 his3∆1 leu2∆0 met15∆0 ura3∆0; DBP2–FLAG MATa his3∆1 leu2∆0 met15∆0 ura3∆0 DBP2–3xFLAG:KanMx6. All strains are in the BY4741 strain background. DBP2–GFP is available from Invitrogen whereas wild type is available from Open Biosystems. The dbp2∆ strain was constructed by PCR-mediated gene replacement as previously described (Cloutier et al. 2012).The msn5Δ DBP2–GFP and snf1Δ DBP2–GFP strains were constructed by PCR-mediated integration of a GFP tag into DBP2 genomic locus in the the msn5Δ, snf1Δ, and hog1Δ strains available from Open Biosystems.
Preparation and purification of anti-Dbp2
Polyclonal rabbit anti-Dbp2 antibodies were generated by Cocalico Biologicals, Inc., using full-length, recombinant purified Dbp2 expressed in bacteria (Cloutier et al. 2012). Resulting immunosera was dialyzed against PBS and subjected to affinity purification using Dbp2-conjugated CNBr–sepharose according to manufacturer’s instructions (Sigma). The eluted, purified anti-Dbp2 antibody was stored at 4° in the presence of 0.05% sodium azide. Western blotting was conducted with a 1:5000 dilution of anti-Dbp2.
Fluorescent cell microscopy
Cells were initially grown to an OD600 nm of 0.1 at 30° in YP + 2% Glucose (YPD). Cells were washed twice with YP + 0% Glucose (YP) and then resuspended in YP + different concentrations of glucose as indicated. Cells were harvested by centrifugation at the indicated time points and were visualized using an Olympus BX-51 fluorescent microscope. For translational shut-off assays, cells grown in YPD were shifted to YP and then back to YPD with or without 300 µg/ml cycloheximide for 30 min before visualization. Where indicated, 10 µg/ml rapamycin was included. Images were captured with a Hamamatsu Orca R2 camera and MetaMorph software (Molecular Devices, Sunnyvale, CA).
Quantitative Western blotting
Protein stability was assayed following addition of cycloheximide to the media as above, but with 20 μg/ml of cycloheximide. Yeast cell lysates were prepared as described previously (Cloutier et al. 2013). Dbp2, Upf1, and Pgk1 were detected using rabbit anti-Dbp2 (this study), rabbit anti-Upf1 (Bond et al. 2001), or mouse anti-Pgk1 (459250, Invitrogen) respectively. Proteins were visualized using Luminata Crescendo Western HRP Substrate (Millipore) according to manufacturer’s instructions. Bands were quantified using ImageQuant TL software (GE Life Sciences).
RNA sequencing sample preparation
Wild-type and dbp2Δ cells were grown in YPD at 30° to an OD600 nm of 0.4 before being harvested by centrifugation, flash frozen in liquid nitrogen, and stored at −80°. Total RNA isolation was performed using a standard acid phenol:chloroform purification as previously described (Cloutier et al. 2012). DNase treatment was performed using 1 U TurboDNase (Life Technologies) per 10 μg of RNA for 30 min at 37°. RNA was analyzed with a DU-730 Beckman-Coulter spectrophotometer. RNA purity was considered suitable for qPCR if the A260/280 was ∼2.0 and the yield was ∼80% after DNase treatment.
Ribosomal RNA depletion was performed prior to library generation (Ribominus Eukaryote kit, Life Technologies). A strand-specific RNA sequencing library was generated using paired-end reads and SOLiD sequencing on the 5500 XL platform (Life Technologies) by the Northwestern University Genomics Core Facility. Forward sequences were generated using the F3 tag and were 75 bp in length; reverse sequences were generated with the F5 tag and were 35 bp in length.
RNA sequencing data analysis
RNA sequencing generated ∼60 million and 40 million mappable reads in wild type and dbp2∆, respectively, per replicate. Raw data quality was evaluated by FastQC software with Ilumina 1.9 encoding. Reads were aligned by position and orientation to the reference S. cerevisiae genome sacCer3 (http://www. http://genome.ucsc.edu) using LifeScope v. 2.5.1. Gene expression (in RPKM), statistical analysis, and fold change between strains were determined using Cufflinks 2.0 software. Those genes with a statistically significant increase in transcripts in dbp2∆ were analyzed for GO-term enrichment for similar processes using FuncAssociate 2.0 (http://llama.mshri.on.ca/funcassociate/) (Berriz et al. 2009). RNA sequencing data are deposited in the NCBI GEO database no. GSE58097.
Strand-specific RT-qPCR
Primers for RT–qPCR were designed using Primer Express 3.0 software. Strand-specific reverse transcription was performed using the Quantitect reverse transcription kit (Qiagen) with the following modifications: A total amount of 2 μg of RNA was prepared for a 20μl reaction. Primers specific to one strand of the target gene and the sense strand of a reference gene, ACT1, were added to a final concentration of 5 μM. Actinomycin D was included in the reverse transcription reaction to a final concentration of 6 ng/μl to prevent second-strand synthesis. Following heat inactivation, unincorporated primers were removed using the QiaQuick PCR Purification Kit (Qiagen) according to the manufacturer’s instructions. Quantitative PCR was performed as previously described (Cloutier et al. 2012). Fold changes were calculated using the Pfaffl method (Pfaffl 2001), with results reported as the mean ±SE of three biological replicates with three technical repeats. See Table 1 for a listing of primers used for strand-specific reverse transcription.
Table 1. Oligonucleotides for qPCR.
| ACT1 forward | TGGATTCCGGTGATGGTGTT |
| ACT1 reverse* | TCAAAATGGCGTGAGGTAGAGA |
| HXT1 forward** | GAATTGGAATCTGGTCGTTC |
| HXT1 reverse* | TAGACACCTTTTCCGGTGTT |
| HXT4 forward** | CCGCCTACGTTACAGTTTCC |
| HXT4 reverse* | ACAAAACCACCGAAAGCAAC |
| HXT5 sense forward | GCCGGTTACAACGATAATTTGG |
| HXT5 sense reverse* | GGCCTTCATGGGAAATGTAACT |
| HXT5 antisense forward** | TTTCTGCCCACTTCTCTCTTACAA |
| HXT5 antisense reverse | CCGTCCTCACTGTTTTATTACCAA |
| HXT8 forward** | TTTCCATTAAGGGTGAGATCCAA |
| HXT8 reverse | CGATTAGGAACCCCCACAATAA |
Oligonucleotides for quantitative PCR after reverse transcription (RT–qPCR). Oligonucleotides for RT–qPCR are listed as forward and reverse pairs for each transcript tested. Primers used for strand-specific cDNA preparation are indicated with one asterisk corresponding to a primer for sense and two asterisks for antisense. QPCR was conducted with both forward and reverse primer pairs.
Chromatin immunoprecipitation
Chromatin immunoprecipitation (ChIP) was performed as described previously (Cloutier et al. 2012). Primer-probe sets were designed to amplify DNA corresponding to the genomic regions to the 5′ ends of the sense and antisense transcripts of HXT1, HXT5, and HXT8 and the region corresponding to the sense transcript of HXT4. Results represent three biological replicates with three technical replicates shown as the mean percentage signal above input and SEM. Primetime assay primer-probe sets (IDT) are listed in Table 2.
Table 2. Oligonucleotides for Chromatin Immunoprecipitation (ChIP).
| Name | Forward primer | Reverse primer | Probe |
|---|---|---|---|
| HXT1 antisense | TTCCAGGCTGTCGGTTTAAG | AGCACCCCACATCAAACAG | CCAAAACGGTCAACGGTGTAC |
| HXT1 sense | GGCCATGAATACTCCAGAAGG | CACCGAAAGCAACCATAACAC | AGTGAAAGTCAAGTGCAACCCGC |
| HXT4 sense | GTTGGTGTTACAAGATTGTGGC | CAGGTAGTGGCAAAACAGAATAAG | AACGGGTCTTCTAAGGGTGCTGG |
| HXT5 antisense | TTACTCGAGGTTTCAACAGGG | AGGTAGCGGAGTTTTCAGTTC | AATCAAGAGCCCCGTTCTTTTACCGT |
| HXT5 sense | CGGAACTTGAAAACGCTCATC | TGAGACGGGTTTAGCTTGTG | CCTTGGAAGGGTCTGCTACTGTGA |
| HXT8 antisense | TCTGTTGATAAGTTGGGCCG | GTAAATAACCATGCACGCCG | TCTTTTACTTGGAGCAGCCACCATGA |
| HXT8 sense | TTAGTGTTCTTGCCCCGATG | CGAAAGTCACCATCAATTGCC | ACTGCGCCAAAGCATATCAGAGGT |
Oligonucleotides for ChIP are Primetime qPCR assays (IDT) and are listed as forward and reverse primers and probe for each gene tested.
Results
The cellular localization of Dbp2 is responsive to extracellular glucose
Many glucose-dependent repressors are regulated at the level of cellular localization, protein stability, and/or synthesis in response to nutrient availability (Gancedo 1998). Moreover, recent global analyses of mRNP complexes in budding yeast revealed that the subcellular distribution of a large proportion of RNA-binding proteins is dictated by environmental growth conditions (Mitchell et al. 2013). To determine if Dbp2 is regulated similarly, we first examined the localization of a C-terminally GFP-tagged Dbp2 in S. cerevisiae during the shift from glucose to galactose (Figure 1A). Briefly, strains expressing a genomically encoded DBP2–GFP were grown to early log phase (OD600 nm of 0.1) in standard, rich media (YP) plus 2% glucose and then shifted to rich media plus 2% galactose. The cellular localization of Dbp2–GFP was determined by epifluorescent microscopy of samples before (0 min) or at different time points following readdition of galactose.
Figure 1.

Dbp2 is redistributed to the cytosol upon glucose deprivation. (A) The nuclear Dbp2–GFP signal is rapidly lost during a shift from glucose to galactose media. Dbp2–GFP cells were grown in the presence of 2% glucose (YPD) and shifted to media with 2% galactose (YP + Gal). Fluorescent images were collected by microscopy at the indicated time points following the shift. (B) Nuclear Dbp2–GFP signal decreases with lower glucose concentrations. Yeast cells expressing a C-terminally GFP-tagged Dbp2 encoded within the endogenous DBP2 locus were grown to early log phase (0.1 OD at 600 nm) at 30° in rich media + 2% glucose (YPD) and then shifted to media with the indicated glucose concentrations for 30 min. The localization of Dbp2–GFP was determined by fluorescent microscopy (bottom) with corresponding DIC images (top). All images were collected with the same exposure time and are scaled equivalently. (C) Graphical representation of glucose-dependent nuclear localization of Dbp2. Dbp2–GFP localization was determined as above over a range of glucose concentrations. The fraction of cells with a predominantly nuclear Dbp2–GFP signal is reported for each glucose concentration tested. Graphical points represent the average of three biological replicates with >100 cells per replicate counted and scored. Error bars represent the SEM. (D) Dbp2 is rapidly lost from the nucleus after glucose removal. Fluorescence microscopy images of Dbp2–GFP localization at the indicated time points following depletion of glucose (YP) are shown. DIC and fluorescent microscopy images were collected as above following growth of Dbp2–GFP-expressing yeast cells in rich media with glucose to early log phase and subsequent removal by centrifugation and resuspension in media lacking glucose. (E) Graphical analysis of the rate of nuclear Dbp2–GFP loss following removal of glucose. The time for Dbp2–GFP relocalization following glucose depletion was determined by growing Dbp2–GFP-expressing cells in YP+2% glucose as above, rapidly shifting the cells to YP lacking glucose and collecting images by fluorescence microscopy at the indicated time points before (0 min) and immediately following glucose depletion. The fraction of cells with nuclear signal was determined as in C.
Consistent with previous studies, Dbp2–GFP displayed a predominantly nuclear localization when cells were grown in the presence of glucose (Figure 1A, 0 min, Cloutier et al. 2012). However, Dbp2–GFP redistributed to the cytosol after the carbon source shift (Figure 1A, 30 and 60 min). Interestingly, the nuclear localization was restored by 300 min, suggesting that the cellular redistribution of Dbp2–GFP is due to the removal of glucose, not the presence of galactose. To test this, we asked if reduction of glucose concentrations in the media would also render Dbp2 cytoplasmic. Interestingly, Dbp2 exhibited cytosolic localization only upon full glucose deprivation (0%), whereas Dbp2 is largely nuclear at all tested concentrations (Figure 1, B and C). Next, we asked how quickly cytoplasmic redistribution occurs by conducting a microscopy time course immediately prior to and following removal of glucose from the media (Figure 1, D and E). This revealed that Dbp2–GFP is redistributed to the cytosol within 2 min following glucose removal, indicating a rapid alteration of cellular localization (Figure 1E). Moreover, the cytosolic localization persisted over a 1-hr time frame (Figure 1, D and E), indicating that the redistribution is both rapid and stable.
The change in Dbp2 localization is due to nuclear transport not protein turnover
The apparent cellular redistribution of Dbp2 could be due to active nuclear export and/or protein turnover. To test this, we measured Dbp2 protein stability by quantitative Western blotting over time following addition of the translational inhibitor cycloheximide. Dbp2 levels were then plotted with respect to the loading control Pgk1 (Figure 2, A and B). Consistent with prior data stating that Dbp2 is exceptionally stable with an estimated half-life of ∼250 min (Laxman et al. 2010), we did not observe an appreciable decrease within the 1-hr time frame of our analysis. This was not due to an incomplete translational block, as the levels of another RNA helicase, Upf1, was degraded with a half-life within the range of other studies (Figure 2A, red; Ruiz-Echevarria et al. 1998). Furthermore, the stability of Dbp2 did not change upon removal of glucose within 1 hr (Figure 2B). This suggests that protein turnover is not a major mechanism for the observed relocalization.
Figure 2.

The change in cellular localization of Dbp2 is due to nuclear transport, not protein turnover. (A and B) Dbp2 protein exhibits similar stability irrespective of the presence of glucose in the media. The stability of Dbp2 protein in the presence of glucose (A) or following glucose deprivation (B) by adding cycloheximide, as previously described to prevent new protein synthesis (Castoralova et al. 2012). Samples were removed at 5-, 10-, 20-, 30-, 40-, and 60-min increments and subjected to Western blotting with rabbit polyclonal anti-Dbp2. Dbp2 levels were quantified with respect to Pgk1 and are presented graphically. Upf1, another RNA helicase, has a reported half-life of ∼16 min (Ruiz-Echevarria et al. 1998) and is included as a control for efficient translational shutoff. Dbp2 half-lives could not be determined for either growth conditions because they do not decrease substantially within a 1-hr time frame. (C) Readdition of glucose to glucose-deprived cells restores nuclear Dbp2 signal. Dbp2–GFP-expressing cells were subjected to a 30-min glucose deprivation, to ensure complete cytosolic redistribution, and were then resuspended in fresh media with saturating glucose (2%). Dbp2–GFP was visualized before glucose removal (0 min), following deprivation, and after 30 min incubation with fresh, glucose-containing media. Dbp2 localization was visualized by fluorescent microscopy as above. Note that Dbp2–GFP-expressing strains show reduced signal in the absence of glucose (middle). However, this is not due to a change in Dbp2 protein levels (see Figure 2A). (D) New protein synthesis is not necessary for restoration of nuclear signal upon glucose readdition. Dbp2–GFP localization was determined as in C, but in the presence of cyclohexamide to block translation.
We then asked if nuclear signal could be restored upon readdition of glucose (Figure 2C). To this end, we subjected cells to a 30-min glucose depletion followed by a 30-min incubation in the presence of glucose (2%). Fluorescent microscopy revealed that the predominantly nuclear localization of Dbp2 was fully restored by adding back glucose (Figure 2C). Moreover, the addition of cyclohexamide had no effect on this nuclear accumulation (Figure 2D). This is similar to the regulated localization of the glucose-dependent repressor Mig1 (De Vit et al. 1997) and suggests that relocalization of Dbp2 upon glucose deprivation occurs through regulated nucleocytoplasmic transport.
Transport of Dbp2 is not dependent on the Snf1/Msn5, Hog1, or TOR signaling pathways
Upon reduction in extracellular glucose, Mig1 is exported to the cytoplasm through the activity of Snf1, the budding yeast ortholog of the human AMP-activated protein kinase AMPK (Woods et al. 1994; De Vit et al. 1997; Hardie et al. 2012), and the export receptor Msn5 (DeVit and Johnston 1999). To determine if the Snf1 signaling pathway is involved in Dbp2 relocalization, we constructed DBP2–GFP snf1∆ cells through standard yeast genetic methods and conducted cellular microscopy following glucose deprivation as above. In contrast to Mig1, Dbp2–GFP was still localized to the cytoplasm following glucose removal in SNF1-deficient strains (Figure 3A, left and middle). Moreover, loss of MSN5 had no effect on relocalization of Dbp2–GFP to the cytoplasm (Figure 3A, right). This suggests that export of Dbp2 upon glucose deprivation is not dependent on the Snf1 signaling pathway. We also observed efficient cytoplasmic relocalization of Dbp2–GFP in the absence of HOG1, a mitogen-activated protein kinase involved in osmolaric stress responses that has recently been linked to glucose deprivation (Westfall et al. 2004; Piao et al. 2012; Figure 3B).
Figure 3.

The cellular redistribution of Dbp2 upon glucose deprivation does not depend on the Snf1 pathway, Hog1 pathway, or TOR signaling. (A) Dbp2–GFP signal relocalization is not dependent on the Snf1 kinase pathway. Wild-type, snf1∆, and msn5∆ cells harboring genomically encoded DBP2–GFP constructs were visualized for Dbp2 localization in the presence of glucose (YPD) or after a 30-min deprivation (YP 30 min). Dbp2–GFP was visualized by epifluorescent microscopy and images are representative of three biological replicates. (B) Dbp2–GFP signal is not redistributed to the cytoplasm via the HOG1 osmolaric stress response pathway. Dbp2–GFP localization in wild-type and hog1∆ cells was visualized in both the presence of glucose (YPD) and following a 30-min glucose deprivation (YP 30 min) as above. (C) Glucose-dependent localization of Dbp2–GFP is not dependent on the TOR pathway. Dbp2–GFP cells were grown in the presence of glucose (YPD) and then shifted to YPD supplemented with rapamycin for 30 min to inhibit the TOR pathway and cycloheximide to inhibit de novo protein synthesis (Shift 1). Cells were then subjected to a 30-min glucose deprivation (YP 30 min) in the presence of rapamycin and cycloheximide (Shift 2). After glucose deprivation, cells were given access to glucose (YPD) supplemented with rapamycin and cycloheximide (Shift 3). Fluorescent images were collected as above.
We then asked if the glucose-dependent cellular localization of Dbp2 is an effect of inhibited reimport rather than stimulated export. The TOR signaling pathway promotes anabolic processes that promote cell growth (Wullschleger et al. 2006). To determine if the localization of Dbp2–GFP requires TOR signaling, we performed cellular microscopy following glucose removal and readdition in the presence of the TOR inhibitor, rapamycin. The translational inhibitor, cycloheximide, was also included to ensure that perceived changes in cellular localization were not due to new protein synthesis. Dbp2–GFP, however, was efficiently reimported upon addition of glucose regardless of the presence of rapamycin (Figure 3C, compare to Figure 2, C and D). Thus, the cytoplasmic relocalization of Dbp2 is not dependent upon Snf1 or Hog1 signaling and neither import nor export of Dbp2 requires TOR. This suggests that the cellular localization of Dbp2 is dependent on another, as-of-yet unidentified signaling pathway or that multiple pathways dictate the glucose-dependent localization of Dbp2 (see Discussion).
DBP2 facilitates glucose-dependent regulation of multiple gene expression networks
Dbp2 is a bona fide RNA helicase that associates directly with transcribed chromatin (Cloutier et al. 2012; Ma et al. 2013). However, our data above suggest that this enzyme may function more like a carbon-source-regulated transcription factor. Consistent with this, Dbp2 is required for glucose-dependent repression of the GAL cluster genes through modulation of associated long noncoding RNAs (Cloutier et al. 2013). To determine if Dbp2 plays a more widespread role in nutrient-dependent gene expression, we conducted RNA sequencing of wild-type and dbp2∆ cells using SOLiD NextGen technology to reveal the entire complement of transcripts whose levels depend on DBP2. This resulted in ∼50 million mappable reads per strain per replicate, which were then subjected to bioinformatics analysis and alignment to the S. cerevisiae genome (Supporting Information, Table S1). Transcripts were separated by sense vs. antisense orientation with respect to the protein-coding gene and fold change from wild type was determined using Cufflinks 2.0 (Table S2 and Table S3, respectively).
RNA seq identified ∼3000 coding and noncoding (nonribosomal) transcripts that are either over- or underrepresented in DBP2-deficient cells as compared to wild type. To determine if these differentially expressed transcripts fall into common functional categories, we then conducted GO term analysis using FuncAssociate 2.0 (Berriz et al. 2009). Consistent with the link between Dbp2 and carbon source availability, GO classification revealed a robust overaccumulation of transcripts encoding mitochondrial respiration components (Table 3). S. cerevisiae preferentially utilize aerobic fermentation over oxidative respiration for energy production until fermentable carbon sources, such as glucose, become limiting (Broach 2012). These genes are typically repressed in wild-type cells to promote fermentation over oxidation in the presence of glucose. Conversely, transcripts encoding ribosome biogenesis factors, whose expression is activated by glucose, were underrepresented in dbp2∆ cells (Table 4). Ribosome biogenesis is also dictated by nutrient availability, balancing energy production with consumption (Warner 1999; Broach 2012). Taken together, this indicates that DBP2 links nutrient availability to the energy status of the cell.
Table 3. Upregulated Sense Transcripts (895).
| N | LOD | P | P_adj | attrib ID | attrib name |
|---|---|---|---|---|---|
| 9 | 1.278165325 | 4.12E-06 | 0.001 | GO:0006122 | Mitochondrial electron transport, ubiquinol to cytochrome c |
| 8 | 1.229371024 | 2.03E-05 | 0.012 | GO:0005750 | Mitochondrial respiratory chain complex III |
| 8 | 1.229371024 | 2.03E-05 | 0.012 | GO:0045275 | Respiratory chain complex III |
| 8 | 1.083144865 | 6.35E-05 | 0.043 | GO:0005991 | Trehalose metabolic process |
| 10 | 1.066652419 | 9.00E-06 | 0.006 | GO:0005199 | Structural constituent of cell wall |
| 12 | 1.056106801 | 1.29E-06 | <0.001 | GO:0070469 | Respiratory chain |
| 20 | 0.953976428 | 3.53E-09 | <0.001 | GO:0022904 | Respiratory electron transport chain |
| 24 | 0.580122409 | 3.65E-06 | 0.001 | GO:0015078 | Hydrogen ion transmembrane transporter activity |
| 25 | 0.571861779 | 2.95E-06 | <0.001 | GO:0022900 | Electron transport chain |
| 24 | 0.483759772 | 5.38E-05 | 0.033 | GO:0015077 | Monovalent inorganic cation transmembrane transporter activity |
| 49 | 0.4055929 | 6.90E-07 | <0.001 | GO:0001071 | Nucleic acid binding transcription factor activity |
| 49 | 0.4055929 | 6.90E-07 | <0.001 | GO:0003700 | Sequence-specific DNA binding transcription factor activity |
| 50 | 0.30780812 | 6.48E-05 | 0.043 | GO:0006091 | Generation of precursor metabolites and energy |
| 60 | 0.27626111 | 7.13E-05 | 0.046 | GO:0043565 | Sequence-specific DNA binding |
Transcripts encoding respiration and energy production factors are upregulated in dbp2∆ cells. RNA sequencing was conducted for wild-type and dbp2∆ cells grown at 30° in YP + 2%D using a SOLiD platform and pairwise analysis. Sense and antisense reads were differentiated using Cufflinks 2.0. Resulting transcripts were analyzed as separate data sets depending on over- or underrepresentation and sense vs. antisense orientation with respect to the gene. Genes with sense transcripts that were overrepresented in dbp2∆ cells as compared to wild type were selected from the RNA sequencing data set. Gene ontology (GO) terms for functional processes were determined using FuncAssociate 2.0 (http://llama.mshri.on.ca/funcassociate/) (Berriz et al. 2009). The columns are as follows: N, no. of entries in the category; LOD, Log10 of the odds ratio; P, one-sided P-value of the association of attribute and query; P_adj, adjusted P-value as a fraction of 1000 null-hypothesis simulations; attrib ID, GO term identification number for attribution category; attrib name, category name for functional processes. RNA sequencing data are deposited in GEO, no. GSE58097.
Table 4. Downregulated Sense Transcripts (700).
| N | LOD | P | P_adj | attrib ID | attrib name |
|---|---|---|---|---|---|
| 5 | 1.84052114 | 1.93E-06 | 0.026 | GO:0004169 | Dolichyl-phosphate-mannose-protein mannosyltransferase activity |
| 18 | 0.711054338 | 1.45E-06 | 0.02 | GO:0030561 | RNA 2’-O-ribose methylation guide activity |
| 18 | 0.711054338 | 1.45E-06 | 0.02 | GO:0030562 | rRNA 2’-O-ribose methylation guide activity |
| 20 | 0.693317905 | 6.13E-07 | 0.006 | GO:0031167 | rRNA methylation |
| 21 | 0.685997034 | 3.97E-07 | 0.005 | GO:0031428 | Box C/D snoRNP complex |
| 29 | 0.673647597 | 4.46E-09 | 0 | GO:0000944 | Base pairing with rRNA |
| 28 | 0.667960766 | 1.00E-08 | 0 | GO:0030555 | RNA modification guide activity |
| 28 | 0.667960766 | 1.00E-08 | 0 | GO:0030556 | rRNA modification guide activity |
| 31 | 0.606510897 | 2.03E-08 | 0 | GO:0000154 | rRNA modification |
| 40 | 0.563435455 | 1.89E-09 | 0 | GO:0000496 | Base pairing |
| 39 | 0.551890352 | 5.25E-09 | 0 | GO:0000498 | Base pairing with RNA |
| 39 | 0.535516237 | 1.17E-08 | 0 | GO:0019843 | rRNA binding |
| 34 | 0.530391432 | 1.18E-07 | 0.002 | GO:0005732 | Small nucleolar ribonucleoprotein complex |
| 58 | 0.364279682 | 3.87E-07 | 0.005 | GO:0006520 | Cellular amino acid metabolic process |
| 60 | 0.351442841 | 5.69E-07 | 0.006 | GO:0044106 | Cellular amine metabolic process |
| 62 | 0.346800579 | 4.52E-07 | 0.006 | GO:0006412 | Translation |
| 63 | 0.321570613 | 2.12E-06 | 0.028 | GO:0009308 | Amine metabolic process |
| 77 | 0.313115978 | 3.93E-07 | 0.005 | GO:0044283 | Small molecule biosynthetic process |
Transcripts linked to ribosome biosynthesis, primarily corresponding to small nucleolar RNAs, are downregulated in dbp2∆ cells. Genes with sense transcripts that were significantly underrepresented in dbp2∆ cells as compared to wild type were selected from the RNA sequencing data set. GO term analysis was conducted using FuncAssociate 2.0 as above. The columns are as follows: N, no. of entries in the category; LOD, Log10 of the odds ratio; P, one-sided P-value of the association of attribute and query; P_adj, adjusted P-value as a fraction of 1000 null-hypothesis simulations; attrib ID, GO term 8 identification number for attribution category; attrib name, category name for functional processes. There was no enrichment of GO terms for downregulated antisense transcripts in DBP2-deficient cells.
Unexpectedly, our analysis also revealed accumulation of antisense transcripts overlapping hexose transporter genes (Table 5). Hexose transport constitutes an essential and rate-limiting step in sugar catabolism, with hexose transporters providing the sole portal for cellular import of fructose, mannose, and glucose (Johnston and Kim 2005; Horak 2013). Although the function of the hexose transporter (HXT) antisense transcripts is not known, this strong GO term enrichment suggests that Dbp2 may regulate expression of the HXT genes via lncRNAs. This would be consistent with prior studies of Dbp2 and the GAL cluster lncRNAs (Cloutier et al. 2013). We did not observe antisense transcripts at the ribosome biogenesis snoRNA or mitochondrial respiratory genes, suggesting that this is specific for the HXT antisense transcripts.
Table 5. Upregulated Antisense Transcripts (382).
| N | LOD | P | P_adj | attrib ID | attrib name |
|---|---|---|---|---|---|
| 9 | 1.570899749 | 7.66E-10 | 0 | GO:0005353 | Fructose transmembrane transporter activity |
| 9 | 1.570899749 | 7.66E-10 | 0 | GO:0015578 | Mannose transmembrane transporter activity |
| 9 | 1.508665946 | 1.69E-09 | 0 | GO:0005355 | Glucose transmembrane transporter activity |
| 9 | 1.454222369 | 3.47E-09 | 0 | GO:0015145 | Monosaccharide transmembrane transporter activity |
| 9 | 1.454222369 | 3.47E-09 | 0 | GO:0015149 | Hexose transmembrane transporter activity |
| 11 | 1.340249894 | 4.22E-10 | 0 | GO:0051119 | Sugar transmembrane transporter activity |
| 10 | 1.298536807 | 5.17E-09 | 0 | GO:0008645 | Hexose transport |
| 10 | 1.298536807 | 5.17E-09 | 0 | GO:0015749 | Monosaccharide transport |
| 11 | 1.180032699 | 7.49E-09 | 0 | GO:0015144 | Carbohydrate transmembrane transporter activity |
| 13 | 1.031860845 | 9.38E-09 | 0 | GO:0008643 | Carbohydrate transport |
| 36 | 0.41867088 | 3.33E-06 | 0.047 | GO:0022891 | Substrate-specific trans-membrane transporter activity |
GO term enrichment reveals an overrepresentation of antisense hexose transporter transcripts in DBP2-deficient cells. Genes with overlapping, antisense transcripts that were significantly overrepresented in dbp2∆ cells as compared to wild type were selected from the RNA sequencing data set. GO term analysis was conducted using FuncAssociate 2.0 as above. The columns are as follows: N, no. of entries in the category; LOD, Log10 of the odds ratio; P, one-sided P-value of the association of attribute and query; P_adj, adjusted P-value as a fraction of 1000 null-hypothesis simulations; attrib ID, GO term 8 identification number for attribution category; attrib name, category name for functional processes.
Loss of DBP2 affects both sense and antisense hexose transporter transcript levels
The vast majority of antisense transcriptional events correlate with decreased expression of overlapping, protein-coding genes. To determine if there is a general trend between the misregulated antisense transcripts and their corresponding sense targets in dbp2∆ cells, we manually selected all transcript pairs whose sense or antisense transcript was differentially expressed with respect to wild type (log2-fold change greater or less than ±0.5). We then generated a scatter plot of the change in abundance of antisense vs. the sense transcripts for all misregulated genes in dbp2∆ cells (Figure 4, gray dots). This revealed no correlation between the upregulated antisense transcripts in dbp2∆ cells and the level of the corresponding sense RNA, suggesting that the absence of DBP2 does not result in a general, genome-wide downregulation of antisense-targeted genes.
Figure 4.

Loss of DBP2 results in enrichment of sense and antisense hexose transporter gene transcripts. A scatter plot was generated to determine the correlation of sense and antisense transcript pair enrichment in DBP2-deficient cells over wild type. Log2-fold change of transcript abundance is shown for sense transcripts vs. antisense transcripts with substantially increased or decreased transcript levels. Genes that had either sense or antisense transcript reads that were >Log2 0.5 or <−0.5 as compared to wild type were selected. Sense and antisense hexose transporter transcript genes (HXTs) are shown in red.
Budding yeast encode 17 HXT genes whose expression and function constitute the rate-limiting step for glycolysis (Horak 2013). Given the striking enrichment in antisense hexose transporter transcripts in dbp2∆ cells (Table 5), we then asked if there was a correlation between sense and antisense HXT transcript levels. This revealed a slight positive correlation between the levels of sense and antisense transcripts corresponding to the HXT protein-coding gene products (Figure 4, red dots). In fact, 50% of the HXT genes displayed higher sense and antisense HXT transcript levels in dbp2∆ cells as evidenced by localization in the top, rightmost quadrant. This could occur by simultaneous expression of both, overlapping transcripts in a given cell or by mutually exclusive expression of individual RNAs in different cells within a population. Regardless, this suggests that Dbp2 regulates the levels of both sense and antisense HXT transcripts.
Strand-specific reverse transcriptase-quantitative PCR provides independent validation of differentially expressed HXT genes in dbp2∆ cells
To independently verify that both sense and antisense HXT transcripts are overabundant in dbp2∆ cells, we first modified a standard reverse transcriptase-quantitative PCR (RT–qPCR) method to quantify cellular RNAs transcribed from overlapping gene products (Figure 5A). This was necessary as analysis of overlapping transcriptional products is not always straightforward due to vastly different expression levels and the second-strand synthesis activity of reverse transcriptase (Perocchi et al. 2007). Strand-specific complementary (c) DNAs were generated using reverse transcription with gene-specific primers (GSPs) to the targeted sequence of interest, and to actin mRNA (ACT1) as an internal control, in the presence of actinomycin D (ActD) (Figure 5A). ActD efficiently inhibits second-strand synthesis by reverse transcriptase (data not shown), which has been noted to cause an overrepresentation of antisense transcripts in genome-wide transcriptional studies (Johnson et al. 2005; Perocchi et al. 2007). Unincorporated GSPs were then removed from the cDNA preparation by standard column chromatography. We selected the GAL10 sense and antisense RNAs for method validation because the sense and antisense products can be toggled by growth condition (Houseley et al. 2008; Pinskaya et al. 2009; Geisler et al. 2012). Measurement of GAL10 transcripts revealed robust expression of sense mRNA above antisense levels in galactose-grown cells and the converse expression pattern in the presence of glucose, consistent with prior studies (Houseley et al. 2008; Pinskaya et al. 2009; Geisler et al. 2012; Figure 5B).
Figure 5.

Strand-specific RT-qPCR confirms aberrant HXT transcript accumulation in dbp2∆ cells, correlating with presence of Dbp2 at genomic HXT loci. (A) Stepwise diagram of the strand-specific RT–qPCR method. Reverse transcription is conducted with a gene-specific primer that is complementary to either the sense or antisense strand. Single-stranded cDNA is produced using reverse transcriptase in the presence of actinomycin D (ActD), the latter of which prevents second-strand synthesis (Perocchi et al. 2007). Half arrow denotes primer positioning on targeted RNAs whereas complete arrow indicates reverse transcriptase activity. Unincorporated primers are removed using column chromatography and the resulting cDNA is quantified using PCR and SYBR green detection. (B) Single-stranded RT–qPCR measures expression of mutually exclusive GAL10 sense and antisense transcripts. Total RNA was isolated from wild-type cells grown in triplicate in either glucose or galactose media (for expression of antisense or sense GAL10 transcripts, respectively) and subjected to transcript-specific cDNA preparation. Gene-specific primers for ACT1 were also included in the reverse transcription reaction as an internal control for downstream quantification. Fold change in expression was calculated for each growth condition independently and is shown relative to the minority transcript (i.e., transcripts from cells grown in galactose are normalized to antisense GAL10 and to sense GAL10 for glucose-cultured cells), which is set to 1 for representation. Numbers above each bar show the average fold change with error bars reflecting the SE.M. (C and D) Independent validation of HXT sense and antisense transcript abundance using strand-specific RT–qPCR. The fold enrichment of representative HXT sense and antisense transcripts in dbp2∆ cells over wild type was determined using strand-specific RT–qPCR as above. Transcript abundance was normalized with respect to ACT1 transcript levels, a transcript whose levels do not vary between wild-type and dbp2∆ cells (Cloutier et al. 2012), and is the average of three independent biological replicates and the SEM. ND, not detectible. (E) Dbp2 interacts directly with 5′ region of HXT genes, with respect to the sense transcript. Chromatin immunoprecipitation of 3X-FLAG-tagged Dbp2 vs. and untagged control strain. Primer-probe sets (Table 2) were designed for sites on genomic DNA corresponding to the 5′ regions of the sense transcripts of HXT1, HXT4, HXT5, HXT8. (F) Dbp2 interacts directly with the genomic region encoding HXT antisense transcripts. Chromatin immunoprecipitation of 3X-FLAG-tagged Dbp2 vs. and untagged control strain. Primer-probe sets (Table 2) were designed for sites on genomic DNA corresponding to the 5′ regions of the antisense transcripts of HXT1, HXT5, HXT8. Results are presented as percentage input and are the average of three biological replicates with three technical replicates and the SEM.
We then utilized strand-specific RT–qPCR to measure the levels of sense and antisense transcripts from four candidate HXT genes, HXT1, HXT4, HXT5, and HXT8. This revealed overaccumulation of sense transcripts of all four HXT genes in dbp2∆ cells, with levels ranging from 7- to 17-fold higher than wild type (Figure 5C). HXT5 exhibits the largest increase, most likely because this moderate affinity hexose transporter is also induced by slow growth rate (Verwaal et al. 2002), which is a phenotype of dbp2∆ cells (Cloutier et al. 2012). Antisense HXT1, HXT5, and HXT8 transcripts also accumulate in dbp2∆ cells but to a lesser extent than sense gene products (Figure 5D). In contrast, we were unable to detect HXT4 antisense transcripts in dbp2∆ cells (Figure 5D, N.D.), suggesting that some HXT antisense lncRNAs are downregulated in the absence of DBP2. These measurements by strand-specific RT–qPCR are in line with RNA sequencing quantification, as evidenced by comparison to the RPKM values from wild-type and dbp2∆ cells for each HXT transcript (Table S2 and Table S3). The absolute fold change in expression between wild-type and dbp2∆ cells, however, is different between the two techniques. This is most likely due to normalization differences between these methods; i.e., RT–qPCR is normalized to ACT1 levels whereas RPKMs are normalized across the length of a transcribed unit. Regardless, this shows that loss of DBP2 results in simultaneous accumulation of both sense and antisense HXT transcripts within a population of cells.
To determine if Dbp2 plays a direct role in regulation of hexose transporter expression, we then utilized ChIP to ask if Dbp2 is associated with the genomic regions corresponding to sense and antisense HXT transcripts (Figure 5, E and F). ChIP was conducted using a genomically encoded, 3X-FLAG-tagged DBP2 strain and primer sets corresponding to 5′ ends of the HXT transcription units, based on the characterized occupancy of Dbp2 at other genomic loci (Table 2 and Cloutier et al. 2012). This revealed that Dbp2 is associated with chromatin encoding the sense and antisense HXT1, HXT5, and HXT8 transcripts (Figure 5, E and F, respectively). Dbp2 also associates with the 5′ end of the HXT4 sense-coding region (Figure 5E); however, we were unable to test the 5′ side of the HXT4 antisense region due to the lack of unique primer sets for qPCR (Figure 5F). Because each of these genes exhibited aberrant transcript accumulation in DBP2-deficient cells, this suggests that Dbp2 plays a direct role at the HXT genes.
Misregulated HXT transcripts in DBP2-deficient cells are products of normal gene expression
To determine if the expressed HXT sense and antisense transcripts in DBP2-deficient cells map to the same genomic location as wild-type cells, we utilized the University of California—Santa Cruz (UCSC) genome browser (http://genome.ucsc.edu/) to generate representative mapped reads of the HXT transcriptional products for both strains (Figure 6, A and B). Consistent with expression of the HXT genes, sense-oriented reads fully mapped to the annotated protein coding genes for HXT1, HXT4,and HXT5 (Figure 6A). In contrast, however, HXT8 sequences aligned to an ∼1.5-kb region originating within the 3′ end of the HXT8 ORF in both wild-type and dbp2∆ cells (Figure 6A, bottom). Interestingly, this transcript was also identified in another genome-wide study, indicating that budding yeast predominantly express this 1.5-kb intergenic product instead of HXT8 ORF mRNAs (Xu et al. 2009). Because this study demonstrated accumulation of this transcript under a variety of conditions (varying carbon sources, haploid, diploid), it is currently unknown what, or if any, conditions result in accumulation of a full-length HXT8 gene product.
Figure 6.

Mapped RNA seq reads across representative HXT genes. Alignment of mapped RNA sequencing reads shows similar (A) sense and (B) antisense expression patterns in wild-type and dbp2∆ cells. Reads were aligned to the S. cerevisiae genome using the UCSC genome browser. Images were generated directly through the UCSC website and show reads that correspond to the annotated, protein-coding gene. Reads on the top correspond to Watson strand-encoded transcript whereas reads on the bottom of each graph align to a gene encoded on the Crick strand. Arrows within the gene ORF rectangle indicate orientation of the sense transcript within the genome. Sense and antisense transcripts are displayed on different graphs due to differences in abundance and resulting graphical scaling. Note that the y-axis is different between wild-type and dbp2∆ cells due to expression level differences between these two strains.
Representative reads were also mapped for antisense transcripts corresponding to HXT1, 5 and 8 genes in wild-type and dbp2∆ cells (Figure 6B). Importantly, the antisense products of HXT1 and HXT5 map to the same location as antisense transcripts identified in prior genome-wide transcriptional profiling of wild-type and RNA decay-deficient strains (Xu et al. 2009; Van Dijk et al. 2011). This suggests that loss of dbp2∆ results in upregulation of antisense HXT1 and HXT5 gene products that are normally expressed at lower levels in wild-type cells. Antisense HXT8 transcripts are also present in wild-type cells, albeit at very low levels. Antisense HXT8 transcription may arise from RNA synthesis within the HXT8 gene locus or from alternative, upstream initiation of the YJL215C locus as noted in prior studies (Xu et al. 2009). Regardless, this suggests that antisense transcription is prevalent at HXT gene loci and that both sense and antisense transcripts accumulate in dbp2∆ cells.
Sense and antisense HXT transcripts accumulate in wild-type cells upon glucose deprivation
Given that Dbp2 is rapidly depleted from the nucleus upon glucose deprivation and that loss of DBP2 correlates with altered expression of metabolic genes, we asked if regulation of Dbp2 localization could be an unrecognized mechanism to control gene expression. If this is the case, we proposed that wild-type cells would show a similar expression pattern of HXT transcripts as dbp2∆ cells when depleted of glucose. To test this, we grew wild-type cells in rich media with glucose (2%) and then subjected the cells to glucose deprivation for 10 min to induce nuclear loss of Dbp2 (see Figure 1). We then conducted strand-specific RT–qPCR to measure the levels of sense and antisense HXT transcripts (Figure 7, A and B, respectively). Interestingly, this revealed a robust accumulation of HXT4 and HXT5 sense transcripts upon glucose deprivation (Figure 7A), reaching levels much higher than those seen in glucose-grown dbp2∆ cells (Figure 5, C and D). This difference in expression levels is most likely due to the activity of other nutrient responsive pathways, such as AMPK and PKA/Ras, in addition to Dbp2-dependent regulation (Broach 2012). HXT8 sense transcripts, however, accumulated to similar levels upon glucose deprivation in wild-type cells or deletion of DBP2, with a four- to sevenfold increase in transcript abundance as compared to the control strain (Figure 5 and 7). Antisense HXT8 transcripts also accumulated in wild-type cells upon glucose depletion (Figure 7B), suggesting that HXT8 gene expression may be most responsive to glucose-dependent changes in Dbp2 localization. In contrast, we did not observe induction of either sense or antisense HXT1 transcripts under these conditions, suggesting that altered HXT1 expression in dbp2∆ cells is due to a different mechanism or that Dbp2 may not be fully lost from the HXT1 locus upon glucose deprivation (Figure 7, A and B). Regardless, loss of DBP2, either by genomic mutation or by glucose deprivation, alters the cellular abundance of transcripts corresponding to HXT gene loci. Taken together, we suggest that cellular energy homeostasis is dependent on regulation of the RNA helicase Dbp2 and resulting changes in metabolic gene expression.
Figure 7.
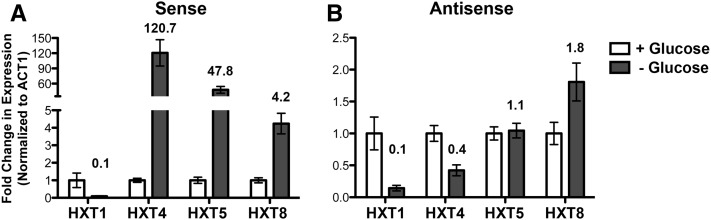
Glucose deprivation alters the levels of sense and antisense hexose transporter transcripts in wild-type cells. HXT sense and antisense transcript abundance using strand-specific RT–qPCR in wild-type cells grown in glucose or after glucose depletion. Wild-type cells were isolated following growth in glucose (2%) or after a 10-min shift to glucose-depleted media. The levels of (A) sense and (B) antisense hexose transporter transcripts were determined by strand-specific RT–qPCR as in Figure 4 and are reported as the average of three biological replicates with the SEM.
Discussion
Cellular life requires a fine balance between energy generation and consumption to maximize the potential for growth. The ability to drastically alter the metabolic state of the cell is a hallmark feature of tumor cells called the Warburg effect, as well as exercising muscle cells, red blood cells, and activated macrophages and stem cells (Ochocki and Simon 2013; Palsson-Mcdermott and O’Neill 2013). Thus, defining the mechanism(s) governing metabolic control has widespread implications in normal mammalian cell growth and human disease states.
Our results demonstrate that the RNA helicase Dbp2 is a key integrator of nutritional status and gene expression programs required for energy homeostasis. Dbp2 is a canonical member of the DEAD-box family of RNA helicases. Prior work from our laboratory has established that Dbp2 is an RNA-dependent ATPase in vitro capable of unwinding a variety of RNA duplex substrates (Cloutier et al. 2012; Ma et al. 2013). Dbp2 appears to function in multiple aspects of RNA biology including ribosome biogenesis, mRNP assembly, and transcription initiation (Barta and Iggo 1995; Bond et al. 2001; Cloutier et al. 2012; Ma et al. 2013), suggestive of a general role in RNA structure modulation. Dbp2 has also been shown to associate with chromatin actively transcribed by RNA polymerase II, indicative of a cotranscriptional role. This is supported by the fact that loss of DBP2 results in reduced association of mRNA binding proteins and inefficient transcription termination (Cloutier et al. 2012; Ma et al. 2013). Thus, our work suggests that RNA structure and/or composition may be central to the metabolic state of the cell.
The ability to match nutrient availability to cellular growth is largely accomplished through the glucose-sensing Rgt1–Snf3, the TOR, and the AMP-dependent protein kinase (Snf1 in budding yeast) pathways (Woods et al. 1994; Broach 2012; Hardie et al. 2012; Horak 2013). These signaling programs communicate the presence and concentration of glucose to the energy producing metabolic gene networks and energy-consuming ribosome biogenesis and translational processes. Snf1 and TOR play opposing roles in cellular homeostasis, with the former increasing energy availability when nutrients are limiting and the latter promoting biogenesis when nutrients are abundant. Snf1-dependent relocalization of Dbp2 to the cytoplasm would be reminiscent of regulated transport of the glucose-dependent repressor Mig1 whereas TOR signaling would be required to maintain the nuclear pool of Dbp2 in the presence of glucose. The latter would be similar to glucose-dependent regulation of the transcription factor Sfp1, whose nuclear localization is dependent on active TOR and Ras/PKA pathways (Jorgensen et al. 2004). However, our results suggest that neither Snf1 nor TOR signaling play major roles in regulation of Dbp2 localization in response to glucose availability.
Another possibility is that Dbp2 directly senses AMP/ATP ratios in the cell. Accumulation of AMP correlates with a decrease in the cellular energy status and occurs upon decreased glucose availability (Boer et al. 2010). The AMP-activated protein kinase AMPK is the major energy sensor in eukaryotic cells and is directly regulated by increasing AMP concentrations (Wilson et al. 1996; Hardie et al. 2012). Interestingly, recent work from the Jankowsky laboratory shows that several DEAD-box RNA helicases are enzymatically inhibited by AMP binding in vitro, even though AMP is not a product of ATP hydrolysis (Putnam and Jankowsky 2013a). This included Mss116 and Ded1, which exhibit similar RNA duplex unwinding activities to Dbp2 (Yang and Jankowsky 2005; Yang et al. 2007; Ma et al. 2013). Thus, it is tempting to speculate that cellular AMP may directly regulate the helicase activity of Dbp2. This is an intriguing possibility, as Snf1, the AMPK ortholog in budding yeast, does not directly sense AMP/ATP ratios but is, instead, activated by phosphorylation (Wilson et al. 1996; Hardie et al. 2012). Further work is necessary to determine if Dbp2 can act as an AMP sensor to maintain cellular energy homeostasis.
It is currently unknown how Dbp2 affects cellular RNA levels. Interestingly, rapid changes in carbon sources cause drastic changes in mRNP stability, with ribosomal protein mRNAs undergoing rapid decay upon a glucose to galactose media switch (Munchel et al. 2011). It is possible that loss of Dbp2 results in widespread changes in mRNP/lncRNP composition that alter RNA stability. If this were the case, we would speculate that these compositional changes occur in the nucleus due to the direct association of Dbp2 with chromatin (Cloutier et al. 2012). Moreover, the similarity between misregulated antisense transcripts in dbp2∆ cells and glucose-deprived wild-type cells, when Dbp2 is cytoplasmic, is consistent with loss of a nuclear role.
In addition to well-known pathways that are glucose dependent, loss of DBP2 also resulted in upregulation of both sense and antisense HXT transcripts. Yeasts in nature encounter a wide range of sugar concentrations that differ by 6 orders of magnitude (from micromolar to molar concentrations) (Johnston and Kim 2005; Horak 2013). A major mechanism to promote growth under these vastly different nutritional conditions is through tight regulation of hexose transporter activity. Although the mechanism(s) that govern transcriptional control of the HXT genes are largely established, a role for lncRNAs in this process has not been explored. Previous studies from our laboratory established a role for the GAL cluster-associated lncRNAs in facilitating transcriptional switches, enhancing the rate at which the transcriptional activation is stimulated or repressed in response to extracellular cues (Cloutier et al. 2013). We would speculate that the antisense HXT lncRNAs function similarly, maintaining the activation potential of the HXT genes for future restoration of hexose availability. This model is similar to a recently identified Ajar pathway for HXT5 and recognition of the rapid response rate of yeast upon restoration of nutrients after glucose depletion (Kresnowati et al. 2006; Bermejo et al. 2010). In fact, upregulation of HXT5 upon glucose deprivation is specifically required for the rapid restoration of normal growth, suggesting that this pathway allows this single-cell eukaryote to be “optimistic” regarding the return of nutrients in the environment.
An alternative explanation is that the sense and antisense HXT transcripts are expressed in different cells within the population, with the antisense transcripts promoting transcriptional repression. If this were the case, the HXT lncRNAs may function similarly to PHO84 lncRNA that functions as a “bimodal” switch to promote different cell fates within a genetically identical population (Castelnuovo et al. 2013). A third possibility is that the antisense HXT transcripts function in the cytoplasm, controlling translational efficiency to stability of the corresponding sense mRNA (Carrieri et al. 2012; Pelechano and Steinmetz 2013; Wang et al. 2013). Additional experiments are necessary to uncover potential mechanisms for these antisense lncRNAs in cellular homeostasis. These and future endeavors offer the exciting possibility that lncRNAs, RNA structure, and/or RNA helicases play specific roles in cellular metabolism.
Supplementary Material
Acknowledgments
Special thanks go to members of the Tran laboratory for advice and critical reading of this manuscript, to Nadereh Jafari (Northwestern) for assistance with RNA sequencing and bioinformatics, and to Vikki Weake (Purdue) for thoughtful discussion. This work was supported by National Institutes of Health (NIH) R01GM097332-01 to E.J.T.
Footnotes
Supporting information is available online at http://www.genetics.org/lookup/suppl/doi:10.1534/genetics.114.170019/-/DC1.
Communicating editor: M. Hampsey
Sequence data from this article have been deposited with the NCBI GEO Data Libraries under accession no. GSE58097.
Literature Cited
- Barta I., Iggo R., 1995. Autoregulation of expression of the yeast Dbp2p ’DEAD-box’ protein is mediated by sequences in the conserved DBP2 intron. EMBO J. 14: 3800–3808. [DOI] [PMC free article] [PubMed] [Google Scholar]
- Bermejo C., Haerizadeh F., Takanaga H., Chermak D., Frommer W. B., 2010. Dynamic analysis of cytosolic glucose and ATP levels in yeast using optical sensors. Biochem. J. 432: 399–406. [DOI] [PMC free article] [PubMed] [Google Scholar]
- Berriz G. F., Beaver J. E., Cenik C., Tasan M., Roth F. P., 2009. Next generation software for functional trend analysis. Bioinformatics 25: 3043–3044. [DOI] [PMC free article] [PubMed] [Google Scholar]
- Bhaskaran H., Russell R., 2007. Kinetic redistribution of native and misfolded RNAs by a DEAD-box chaperone. Nature 449: 1014–1018. [DOI] [PMC free article] [PubMed] [Google Scholar]
- Boer V. M., Crutchfield C. A., Bradley P. H., Botstein D., Rabinowitz J. D., 2010. Growth-limiting intracellular metabolites in yeast growing under diverse nutrient limitations. Mol. Biol. Cell 21: 198–211. [DOI] [PMC free article] [PubMed] [Google Scholar]
- Bohnsack M. T., Martin R., Granneman S., Ruprecht M., Schleiff E., et al. , 2009. Prp43 bound at different sites on the pre-rRNA performs distinct functions in ribosome synthesis. Mol. Cell 36: 583–592. [DOI] [PMC free article] [PubMed] [Google Scholar]
- Bond A. T., Mangus D. A., He F., Jacobson A., 2001. Absence of Dbp2p alters both nonsense-mediated mRNA decay and rRNA processing. Mol. Cell. Biol. 21: 7366–7379. [DOI] [PMC free article] [PubMed] [Google Scholar]
- Bowers H. A., Maroney P. A., Fairman M. E., Kastner B., Luhrmann R., et al. , 2006. Discriminatory RNP remodeling by the DEAD-box protein DED1. RNA 12: 903–912. [DOI] [PMC free article] [PubMed] [Google Scholar]
- Broach J. R., 2012. Nutritional control of growth and development in yeast. Genetics 192: 73–105. [DOI] [PMC free article] [PubMed] [Google Scholar]
- Buszczak M., Spradling A. C., 2006. The Drosophila P68 RNA helicase regulates transcriptional deactivation by promoting RNA release from chromatin. Genes Dev. 20: 977–989. [DOI] [PMC free article] [PubMed] [Google Scholar]
- Camats M., Guil S., Kokolo M., Bach-Elias M., 2008. P68 RNA helicase (DDX5) alters activity of cis- and trans-acting factors of the alternative splicing of H-Ras. PLoS ONE 3: e2926. [DOI] [PMC free article] [PubMed] [Google Scholar]
- Caretti G., Schiltz R. L., Dilworth F. J., Di Padova M., Zhao P., et al. , 2006. The RNA helicases p68/p72 and the noncoding RNA SRA are coregulators of MyoD and skeletal muscle differentiation. Dev. Cell 11: 547–560. [DOI] [PubMed] [Google Scholar]
- Carrieri C., Cimatti L., Biagioli M., Beugnet A., Zucchelli S., et al. , 2012. Long non-coding antisense RNA controls Uchl1 translation through an embedded SINEB2 repeat. Nature 491: 454–457. [DOI] [PubMed] [Google Scholar]
- Castelnuovo M., Rahman S., Guffanti E., Infantino V., Stutz F., et al. , 2013. Bimodal expression of PHO84 is modulated by early termination of antisense transcription. Nat. Struct. Mol. Biol. 20: 851–858. [DOI] [PMC free article] [PubMed] [Google Scholar]
- Castoralova M., Brezinova D., Sveda M., Lipov J., Ruml T., et al. , 2012. SUMO-2/3 conjugates accumulating under heat shock or MG132 treatment result largely from new protein synthesis. Biochim. Biophys. Acta 1823: 911–919. [DOI] [PubMed] [Google Scholar]
- Clark E. L., Coulson A., Dalgliesh C., Rajan P., Nicol S. M., et al. , 2008. The RNA helicase p68 is a novel androgen receptor coactivator involved in splicing and is overexpressed in prostate cancer. Cancer Res. 68: 7938–7946. [DOI] [PMC free article] [PubMed] [Google Scholar]
- Cloutier S. C., Ma W. K., Nguyen L. T., Tran E. J., 2012. The DEAD-box RNA helicase Dbp2 connects RNA quality control with repression of aberrant transcription. J. Biol. Chem. 287: 26155–26166. [DOI] [PMC free article] [PubMed] [Google Scholar]
- Cloutier S. C., Wang S., Ma W. K., Petell C. J., Tran E. J., 2013. Long noncoding RNAs promote transcriptional poising of inducible genes. PLoS Biol. 11: e1001715. [DOI] [PMC free article] [PubMed] [Google Scholar]
- Del Campo M., Mohr S., Jiang Y., Jia H., Jankowsky E., et al. , 2009. Unwinding by local strand separation is critical for the function of DEAD-box proteins as RNA chaperones. J. Mol. Biol. 389: 674–693. [DOI] [PMC free article] [PubMed] [Google Scholar]
- De Vit M. J., Waddle J. A., Johnston M., 1997. Regulated nuclear translocation of the Mig1 glucose repressor. Mol. Biol. Cell 8: 1603–1618. [DOI] [PMC free article] [PubMed] [Google Scholar]
- DeVit M. J., Johnston M., 1999. The nuclear exportin Msn5 is required for nuclear export of the Mig1 glucose repressor of Saccharomyces cerevisiae. Curr. Biol. 9: 1231–1241. [DOI] [PubMed] [Google Scholar]
- Fatica A., Bozzoni I., 2014. Long non-coding RNAs: new players in cell differentiation and development. Nat. Rev. Genet. 15: 7–21. [DOI] [PubMed] [Google Scholar]
- Fuller-Pace F. V., Moore H. C., 2011. RNA helicases p68 and p72: multifunctional proteins with important implications for cancer development. Future Oncol. 7: 239–251. [DOI] [PubMed] [Google Scholar]
- Gancedo J. M., 1998. Yeast carbon catabolite repression. Microbiol. Mol. Biol. Rev. 62: 334–361. [DOI] [PMC free article] [PubMed] [Google Scholar]
- Geisler S., Lojek L., Khalil A. M., Baker K. E., Coller J., 2012. Decapping of long noncoding RNAs regulates inducible genes. Mol. Cell 45: 279–291. [DOI] [PMC free article] [PubMed] [Google Scholar]
- Hardie D. G., Ross F. A., Hawley S. A., 2012. AMP-activated protein kinase: a target for drugs both ancient and modern. Chem. Biol. 19: 1222–1236. [DOI] [PMC free article] [PubMed] [Google Scholar]
- Horak J., 2013. Regulations of sugar transporters: insights from yeast. Curr. Genet. 59: 1–31. [DOI] [PubMed] [Google Scholar]
- Houseley J., Rubbi L., Grunstein M., Tollervey D., Vogelauer M., 2008. A ncRNA modulates histone modification and mRNA induction in the yeast GAL gene cluster. Mol. Cell 32: 685–695. [DOI] [PMC free article] [PubMed] [Google Scholar]
- Jalal C., Uhlmann-Schiffler H., Stahl H., 2007. Redundant role of DEAD box proteins p68 (Ddx5) and p72/p82 (Ddx17) in ribosome biogenesis and cell proliferation. Nucleic Acids Res. 35: 3590–3601. [DOI] [PMC free article] [PubMed] [Google Scholar]
- Jankowsky E., 2011. RNA helicases at work: binding and rearranging. Trends Biochem. Sci. 36: 19–29. [DOI] [PMC free article] [PubMed] [Google Scholar]
- Johnson J. M., Edwards S., Shoemaker D., Schadt E. E., 2005. Dark matter in the genome: evidence of widespread transcription detected by microarray tiling experiments. Trends Genet. 21: 93–102. [DOI] [PubMed] [Google Scholar]
- Johnston M., Kim J. H., 2005. Glucose as a hormone: receptor-mediated glucose sensing in the yeast Saccharomyces cerevisiae. Biochem. Soc. Trans. 33: 247–252. [DOI] [PubMed] [Google Scholar]
- Jorgensen P., Rupes I., Sharom J. R., Schneper L., Broach J. R., et al. , 2004. A dynamic transcriptional network communicates growth potential to ribosome synthesis and critical cell size. Genes Dev. 18: 2491–2505. [DOI] [PMC free article] [PubMed] [Google Scholar]
- Kovalev N., Barajas D., Nagy P. D., 2012. Similar roles for yeast Dbp2 and Arabidopsis RH20 DEAD-box RNA helicases to Ded1 helicase in tombusvirus plus-strand synthesis. Virology 432: 470–484. [DOI] [PubMed] [Google Scholar]
- Kresnowati M. T., van Winden W. A., Almering M. J., ten Pierick A., Ras C., et al. , 2006. When transcriptome meets metabolome: fast cellular responses of yeast to sudden relief of glucose limitation. Mol. Syst. Biol. 2: 49. [DOI] [PMC free article] [PubMed] [Google Scholar]
- Laxman S., Sutter B. M., Tu B. P., 2010. Behavior of a metabolic cycling population at the single cell level as visualized by fluorescent gene expression reporters. PLoS ONE 5: e12595. [DOI] [PMC free article] [PubMed] [Google Scholar]
- Lempiainen H., Shore D., 2009. Growth control and ribosome biogenesis. Curr. Opin. Cell Biol. 21: 855–863. [DOI] [PubMed] [Google Scholar]
- Lohr D., Venkov P., Zlatanova J., 1995. Transcriptional regulation in the yeast GAL gene family: a complex genetic network. FASEB J. 9: 777–787. [DOI] [PubMed] [Google Scholar]
- Ma W. K., Cloutier S. C., Tran E. J., 2013. The DEAD-box protein Dbp2 functions with the RNA-binding protein Yra1 to promote mRNP assembly. J. Mol. Biol. 425: 3824–3838. [DOI] [PMC free article] [PubMed] [Google Scholar]
- Mitchell S. F., Jain S., She M., Parker R., 2013. Global analysis of yeast mRNPs. Nat. Struct. Mol. Biol. 20: 127–133. [DOI] [PMC free article] [PubMed] [Google Scholar]
- Munchel S. E., Shultzaberger R. K., Takizawa N., Weis K., 2011. Dynamic profiling of mRNA turnover reveals gene-specific and system-wide regulation of mRNA decay. Mol. Biol. Cell 22: 2787–2795. [DOI] [PMC free article] [PubMed] [Google Scholar]
- Ochocki J. D., Simon M. C., 2013. Nutrient-sensing pathways and metabolic regulation in stem cells. J. Cell Biol. 203: 23–33. [DOI] [PMC free article] [PubMed] [Google Scholar]
- Palsson-McDermott E. M., O’Neill L. A., 2013. The Warburg effect then and now: from cancer to inflammatory diseases. BioEssays 35: 965–973. [DOI] [PubMed] [Google Scholar]
- Pelechano V., Steinmetz L. M., 2013. Gene regulation by antisense transcription. Nat. Rev. Genet. 14: 880–893. [DOI] [PubMed] [Google Scholar]
- Perocchi F., Xu Z., Clauder-Munster S., Steinmetz L. M., 2007. Antisense artifacts in transcriptome microarray experiments are resolved by actinomycin D. Nucleic Acids Res. 35: e128. [DOI] [PMC free article] [PubMed] [Google Scholar]
- Pfaffl M. W., 2001. A new mathematical model for relative quantification in real-time RT-PCR. Nucleic Acids Res. 29: e45. [DOI] [PMC free article] [PubMed] [Google Scholar]
- Piao H., MacLean Freed J., Mayinger P., 2012. Metabolic activation of the HOG MAP kinase pathway by Snf1/AMPK regulates lipid signaling at the Golgi. Traffic 13: 1522–1531. [DOI] [PMC free article] [PubMed] [Google Scholar]
- Pinskaya M., Gourvennec S., Morillon A., 2009. H3 lysine 4-di- and tri-methylation deposited by cryptic transcription attenuates promoter activation. EMBO J. 28: 1697–1707. [DOI] [PMC free article] [PubMed] [Google Scholar]
- Powers T., Walter P., 1999. Regulation of ribosome biogenesis by the rapamycin-sensitive TOR-signaling pathway in Saccharomyces cerevisiae. Mol. Biol. Cell 10: 987–1000. [DOI] [PMC free article] [PubMed] [Google Scholar]
- Putnam A. A., Jankowsky E., 2013a AMP sensing by DEAD-box RNA helicases. J. Mol. Biol. 425: 3839–3845. [DOI] [PMC free article] [PubMed] [Google Scholar]
- Putnam A. A., Jankowsky E., 2013b DEAD-box helicases as integrators of RNA, nucleotide and protein binding. Biochim. Biophys. Acta 1829: 884–893. [DOI] [PMC free article] [PubMed] [Google Scholar]
- Ruiz-Echevarria M. J., Gonzalez C. I., Peltz S. W., 1998. Identifying the right stop: determining how the surveillance complex recognizes and degrades an aberrant mRNA. EMBO J. 17: 575–589. [DOI] [PMC free article] [PubMed] [Google Scholar]
- Salzman D. W., Shubert-Coleman J., Furneaux H., 2007. P68 RNA helicase unwinds the human let-7 microRNA precursor duplex and is required for let-7-directed silencing of gene expression. J. Biol. Chem. 282: 32773–32779. [DOI] [PubMed] [Google Scholar]
- Sellick, C. A., R. N. Campbell and R. J. Reece, 2008 Galactose metabolism in yeast-structure and regulation of the leloir pathway enzymes and the genes encoding them. Int. Rev. Cell Mol. Biol. 269: 111–150. [DOI] [PubMed]
- Traven A., Jelicic B., Sopta M., 2006. Yeast Gal4: a transcriptional paradigm revisited. EMBO Rep. 7: 496–499. [DOI] [PMC free article] [PubMed] [Google Scholar]
- van Dijk E. L., Chen C. L., d’Aubenton-Carafa Y., Gourvennec S., Kwapisz M., et al. , 2011. XUTs are a class of Xrn1-sensitive antisense regulatory non-coding RNA in yeast. Nature 475: 114–117. [DOI] [PubMed] [Google Scholar]
- Verwaal R., Paalman J. W., Hogenkamp A., Verkleij A. J., Verrips C. T., et al. , 2002. HXT5 expression is determined by growth rates in Saccharomyces cerevisiae. Yeast 19: 1029–1038. [DOI] [PubMed] [Google Scholar]
- Wang J., Gong C., Maquat L. E., 2013. Control of myogenesis by rodent SINE-containing lncRNAs. Genes Dev. 27: 793–804. [DOI] [PMC free article] [PubMed] [Google Scholar]
- Warner J. R., 1999. The economics of ribosome biosynthesis in yeast. Trends Biochem. Sci. 24: 437–440. [DOI] [PubMed] [Google Scholar]
- Westfall P. J., Ballon D. R., Thorner J., 2004. When the stress of your environment makes you go HOG wild. Science 306: 1511–1512. [DOI] [PubMed] [Google Scholar]
- Wilson B. J., Bates G. J., Nicol S. M., Gregory D. J., Perkins N. D., et al. , 2004. The p68 and p72 DEAD box RNA helicases interact with HDAC1 and repress transcription in a promoter-specific manner. BMC Mol. Biol. 5: 11. [DOI] [PMC free article] [PubMed] [Google Scholar]
- Wilson W. A., Hawley S. A., Hardie D. G., 1996. Glucose repression/derepression in budding yeast: SNF1 protein kinase is activated by phosphorylation under derepressing conditions, and this correlates with a high AMP:ATP ratio. Curr. Biol. 6: 1426–1434. [DOI] [PubMed] [Google Scholar]
- Woods A., Munday M. R., Scott J., Yang X., Carlson M., et al. , 1994. Yeast SNF1 is functionally related to mammalian AMP-activated protein kinase and regulates acetyl-CoA carboxylase in vivo. J. Biol. Chem. 269: 19509–19515. [PubMed] [Google Scholar]
- Wullschleger S., Loewith R., Hall M. N., 2006. TOR signaling in growth and metabolism. Cell 124: 471–484. [DOI] [PubMed] [Google Scholar]
- Xu Z., Wei W., Gagneur J., Perocchi F., Clauder-Munster S., et al. , 2009. Bidirectional promoters generate pervasive transcription in yeast. Nature 457: 1033–1037. [DOI] [PMC free article] [PubMed] [Google Scholar]
- Yang Q., Del Campo M., Lambowitz A. M., Jankowsky E., 2007. DEAD-box proteins unwind duplexes by local strand separation. Mol. Cell 28: 253–263. [DOI] [PubMed] [Google Scholar]
- Yang Q., Jankowsky E., 2005. ATP- and ADP-dependent modulation of RNA unwinding and strand annealing activities by the DEAD-box protein DED1. Biochemistry 44: 13591–13601. [DOI] [PubMed] [Google Scholar]
Associated Data
This section collects any data citations, data availability statements, or supplementary materials included in this article.