

Abstract
Understanding and correctly utilizing relatedness among samples is essential for genetic analysis; however, managing sample records and pedigrees can often be error prone and incomplete. Data sets ascertained by random sampling often harbor cryptic relatedness that can be leveraged in genetic analyses for maximizing power. We have developed a method that uses genome-wide estimates of pairwise identity by descent to identify families and quickly reconstruct and score all possible pedigrees that fit the genetic data by using up to third-degree relatives, and we have included it in the software package PRIMUS (Pedigree Reconstruction and Identification of the Maximally Unrelated Set). Here, we validate its performance on simulated, clinical, and HapMap pedigrees. Among these samples, we demonstrate that PRIMUS can verify reported pedigree structures and identify cryptic relationships. Finally, we show that PRIMUS reconstructed pedigrees, all of which were previously unknown, for 203 families from a cohort collected in Starr County, TX (1,890 samples).
Introduction
Following the transmission of variants through a genealogy is at the foundation of modern genetics. Today, investigators continue to use pedigrees to determine the heritability and genetic models for traits and disorders, and knowing the exact pedigree structure allows them to correctly identify the genetic mode of disease inheritance and utilize powerful genetic-analysis tools that require, or benefit from, the true pedigree structure. Such tools include linkage,1 family-based association,2 pedigree-aware imputation, pedigree-aware phasing, Mendelian error checking, heritability, and pVAAST (Pedigree Variant Annotation, Analysis, and Search Tool).3 In many instances, knowing the pedigree that is consistent with the generated genetic data is crucial to solving the disease.4–7 Additionally, the collection of samples from a limited geographical region for a genetic analysis might introduce biases toward unintentionally obtaining samples of unknown relatedness for which a previously unknown pedigree could be reconstructed and used. As a result, large case-control consortia can harbor cryptic relatedness,8 which can bias the analysis unless the cryptic relatedness is removed or investigators use a method that models a kinship matrix.9 However, a substantial increase in power can be obtained if the true pedigree structures are known.9
Given the benefits of family-based studies in genetic research, an enormous amount of effort is spent collecting and maintaining accurate sample records and corresponding pedigrees. However, despite the best efforts of investigators, pedigree and sample errors are still quite common and require careful examination so that reductions in power to detect linkage can be avoided.10 The rate of nonpaternities in studies has been reported to be between 0.8% and 30% (median = 3.7%; n = 17),11 and other reports have shown more conservative estimates at around 1%–1.5%.12,13 Even at the conservative rate of 1%, a pedigree with six children has a 6% chance of being incorrect as a result of a nonpaternity error, and the pedigree error rate will be much higher after other common errors, such as sample swaps, duplicate samples, contamination, and other relationship discrepancies, are accounted for. The standard practice for checking and correcting pedigrees and relationships within genetic data sets is to use pairwise prediction programs,14–18 such as RELPAIR19 and PREST (Pedigree Relationship Statistical Test),20 to verify that the level of relatedness between every pair of individuals falls close to the expected level of relatedness from the reported pedigree.21–28
Although using pairwise estimates to check relationships in pedigrees is sometimes sufficient, there are four major drawbacks that we illustrate in this manuscript. First, pairwise checking will not catch pedigree errors if there are multiple pedigree structures that fit the genetic data and if the reported pedigree structure is among the incorrect possibilities. Second, pairwise relationship checking does not provide, or even suggest, the correct pedigree in the case of inconsistency between the data and the reported pedigree. Instead, these methods flag inconsistent relationships for the investigator to review by hand. Third, pairwise inconsistencies between genotyped samples are often resolved by the removal of the inconsistent sample(s), which can result in the unnecessary loss of samples or in accepting an incorrect pedigree as true. Fourth and finally, manually reconstructing an unknown pedigree with pairwise relationship comparisons requires arduous, error-prone labor. Previous attempts have been made to address this issue. For example, Pemberton et al.29 manually reconstructed cryptic HapMap3 pedigrees, but the authors encountered inconsistencies they could not resolve by hand.
A possible solution to the drawbacks of checking pedigrees by pairwise comparisons is to use the genetic data to reconstruct the corresponding pedigree structure. Ideally, pedigree reconstruction would not only identify any inconsistencies in a pedigree but also automatically provide the correct pedigree. Pedigree-reconstruction methods exist, but the reason they are not the standard for checking pedigrees in genetics studies is that existing methods have limited uses. Current approaches are limited in the number of genetic variants that can be used,30–32 are heavily biased in the presence of linkage disequilibrium between markers,33 cannot reconstruct half-sibling relationships,34,35 or cannot reconstruct a pedigree if it is connected by individuals for whom no genotype data are available.30–33 Even the most recent methods—COP (Constructing Outbred Pedigrees) and CIP (Constructing Inbred Pedigrees),35 IPED (Inheritance Path-based Pedigree Reconstruction)34 and IPED2, and PREPARE (Partitioning of Relatives)36—assume that all genotyped individuals are in the same generation, requiring a priori knowledge of the relative generations of the samples or the pedigree structure. Using the age of individuals is not adequate; for example, it is not uncommon to have an uncle or aunt younger than a niece or nephew. The most recent methods are good at reconstructing a small niche of pedigrees structures, but few pedigree structures typical of human genetic studies fall into this niche. Indeed, these are not capable of reconstructing many basic and common pedigree structures (e.g., trios).
We have developed a pedigree-reconstruction method without many of the limitations of previous pedigree-reconstruction programs and have incorporated it into a software package known as Pedigree Reconstruction and Identification of the Maximally Unrelated Set (PRIMUS).37 Our method utilizes the power of SNP arrays or next-generation sequence data to evaluate genome-wide identity-by-descent (IBD) estimates generated by programs such as PLINK14 or KING (Kinship-Based Inference for Genome-wide Association Studies).16 Our method assigns relationships by using the expected mean and variance for each relationship class and leverages all pairwise relationships within a family (as well as genetically determined sex) to reconstruct the possible pedigree structures in a manner consistent with the observed pairwise sharing. We designed PRIMUS to improve on previous methods in several ways—PRIMUS (1) automatically reconstructs multigenerational pedigrees with genotyped samples in any generation, (2) reconstructs pedigrees by using all individuals connected to a pedigree at a level of third-degree relatives or closer, (3) requires no prior knowledge of the pedigree structure, (4) allows for missing (i.e., nongenotyped) individuals in the pedigree, (5) appropriately incorporates half siblings, (6) allows for, but does not require, additional information such as sex and age of samples to improve reconstruction, and (7) inputs and outputs common file formats to improve usability.
In this report, we validate the performance of PRIMUS on thousands of simulated pedigrees. We also demonstrate its ability to reconstruct clinical pedigrees and HapMap3 pedigrees and to find previously unknown relationships in a large population-based study from Starr County, TX, illustrating that PRIMUS can (1) reconstruct, validate, and correct reported pedigrees, (2) incorporate cryptic relatedness into known pedigrees, and (3) find and reconstruct previously unknown pedigrees that can exist within large genetic data sets.
Material and Methods
Simulated Pedigrees
We generated simulated pedigrees for the training and initial testing of PRIMUS by using a broad range of known pedigrees that contained different structures, sizes, genotypes, and combinations of missing data among the individuals. In all, thousands of pedigrees were generated for three classes of pedigree structures:
-
1.
Size-12 pedigree: a 12-person pedigree that contains all relationships from Table 1 (Figure S1, available online).
-
2.
Uniform pedigree: a variable-sized pedigree with no half-sibling relationships and in which each pair of parents is expected to have three children. However, so that the desired pedigree sizes can be obtained, there could be a single pair of parents with as few as one child or as many as four children (Figure S2).
-
3.
Half-sibling pedigree: identical to the uniform pedigree except that there is a 30% chance that one person from each pair of parents has two children with another individual (Figure S2).
Table 1.
Expected Mean IBD Proportions for the Outbred Familial Relationship Categories
| Familial Relationship | IBD0 | IBD1 | IBD2 |
|---|---|---|---|
| Parental | 0 | 1 | 0 |
| Full-sibling | 0.25 | 0.5 | 0.25 |
| Half-sibling, avuncular, and grandparental | 0.5 | 0.5 | 0 |
| First-cousin, great-grandparental, great-avuncular, and half-avuncular | 0.75 | 0.25 | 0 |
| Distantly related | varies | varies | 0 |
| Unrelated (includes relationships beyond the third degree) | 1 | 0 | 0 |
IBD0, IBD1, and IBD2 are the genome proportions shared on 0, 1, and 2 chromosomes, respectively, between two individuals. Many relationships share the same expected mean IBD proportions; however, for full-sibling, second-degree, and third-degree relationships, a variance around the expected mean is due to the random nature of recombination events. Genotyping and other technical errors can contribute to this variance.
For both the uniform and the half-sibling pedigrees, we simulated complete pedigrees of sizes ranging from 5 to 400 individuals. For each pedigree, we created different genotypes for 100 versions of the pedigree structures by using the method applied by Morrison38 (see Web Resources): we randomly selected founder haplotypes with ∼1,000,000 SNPs from among the unrelated HapMap3 CEU (Utah residents with ancestry from northern and western Europe from the CEPH collection) samples, and we simulated recombination as a homogeneous Poisson process by disregarding the centromere and using the approximation 1 Mb = 1 cM. We compared the true IBD proportions to those calculated by PLINK for IBD estimates generated from 6,000 and 1,000,000 SNPs (Figure S3). The correlation between the estimates and the true values was r2 = 0.999 with pedigrees of size 10 and r2 = 0.974 with pedigrees of size 400. IBD estimates generated from as few as 6,000 SNPs were still remarkably accurate (Table S1), and they improved as the number of SNPs increased. We also tested the accuracy of IBD estimates calculated with the overlap of the approximately 1,000,000 HapMap3 SNP set and commonly used SNP panels and found high accuracy levels (Table S1). Unless otherwise stated, the complete ∼1,000,000-SNP sets were used for the simulations.
We also simulated data missingness in each of the uniform and half-sibling pedigrees. To accomplish this, we created ten additional versions of each pedigree by iteratively masking genetic data for a single sample until we had masked up to ten missing individuals. Data were eligible for masking if the individual had children and if his or her masking did not create a gap larger than a third-degree relationship. Eligible samples were masked at random, creating unique combinations of missing sample data for each pedigree.
IBD Estimates
PRIMUS takes input from any program that provides estimates of the proportions of the genome shared identically by descent on zero, one, and two chromosomes (IBD0, IBD1, IBD2, respectively). We note that calculating accurate relationships and estimating pairwise IBD is a nontrivial problem and one that has been tackled by a number of methodologies.14,16,39–41 IBD proportions presented here were calculated with the method-of-moments estimation implemented in PLINK.14 Although it is not required for simulated pedigrees, some pedigrees might require careful analysis of admixture in the samples. In these cases, we applied the approaches recommended by Morrison38 to remove ancestry-informative SNPs that could otherwise bias IBD estimates. The code used for calculating IBD estimates is available for download with the PRIMUS package (Web Resources).
Family-Network Identification
PRIMUS first groups the samples into family networks (or groups) on the basis of the estimated pairwise coefficient of relatedness (two times the kinship coefficient).37 An individual is only added to a family network if the sample is related to at least one other person in the network given a user-defined minimum coefficient of relatedness. For example, 0.1875, the midpoint between the mean expected IBD proportion for second- and third-degree relatives, is a threshold that will capture connections between most second-degree relatives or closer. The pedigree reconstruction is then performed independently on each family network within the data set.
Familial-Relationship Prediction Using a Kernel-Density-Estimation Function
PRIMUS uses six relationship categories to reconstruct pedigrees on the basis of the expected mean IBD0, IBD1, and IBD2 estimates shown in Table 1; however, distantly related and unrelated samples are handled as the same class during reconstruction. Both biological factors (i.e., recombination events, population substructure, historic inbreeding) and technical factors (i.e., density and distribution of the genotyped markers) contribute to variation around these means.
Given the IBD0, IBD1, and IBD2 estimates for a pair of individuals, PRIMUS predicts the corresponding relationship category by using a trained kernel density estimation (KDE; see Web Resources) for each of six familial relationship categories. We used the scipy.stats.gaussian_kde function (see SciPy in the Web Resources) with two training features: genome-wide estimates of IBD0 and IBD1. The training IBD0 and IBD1 estimates were selected from the IBD estimates generated with 6,000 SNPs for the 1,000 size-12 simulated pedigrees. We chose to use the lower number of SNPs so that the KDE could better handle the technical noise that comes with estimating IBD. We selected parent-offspring (PO), full-sibling (FS), second-degree, third-degree, distantly related, and unrelated relationships from each of the 1,000 simulated pedigrees and used them to train the respective KDEs. We used these simulated IBD proportions to train a KDE function for each of the six familial relationship categories.
Because bandwidth selection influences the trained KDE, we tested each KDE with different values for the coefficient factor used in calculating the kernel covariance matrices (Figure S4). These empirical tests allowed us to select the coefficient that best optimized reconstruction performance for the KDE of each relationship category. For the overlapping KDE distributions, we selected the smallest bandwidth that had no false-negative predictions of our test data set at a likelihood cutoff of 0.01 or lower. We selected the largest bandwidths possible for PO and FS relationships without overlap of the density distributions with other relationship categories. This minimizes the false-positive calls for these predictions. Figure S5 shows a density plot for the KDE of each relationship category, which is consistent with previous reports of genome-wide IBD proportions.42
PRIMUS uses the trained kernels to predict the familial relationship category for each pairwise relationship. For a set of IBD0, IBD1, and IBD2 proportions, PRIMUS queries each kernel for the density at the IBD0 and IBD1 values and stores the density for each familial category in a vector. Then PRIMUS normalizes the vector by dividing each density by the sum of all densities, producing a vector of the likelihoods corresponding to each familial category. This relationship-likelihood vector is used during both reconstruction and ranking of possible pedigrees.
Pedigree-Reconstruction Algorithm
For each family network, PRIMUS uses the relationship-likelihood vectors of all pairwise relationships to reconstruct all possible pedigrees, which is subject to the restrictions that (1) only relatives up to the third degree are considered and (2) the likelihood of each relationship class considered must exceed a minimum likelihood threshold (initial default of 0.3). We chose 0.3 as a good initial likelihood threshold on the basis of the relationship predictions of the uniform size-400 pedigrees (see Figure S4 for details).
Reconstruction is an iterative process of identifying a pairwise relationship that is within the family network but that has not yet been incorporated into the pedigree, fitting that relationship into the pedigree, and testing that all of the relationships generated by adding the individual are compatible with the relationship-likelihood vectors and sex data for all of the samples. If the addition of a relationship is incompatible with the relationship-likelihood vectors or if two individuals of the same sex have offspring, the pedigree is rejected and removed from the set of possible pedigrees. The reconstruction continues until all pairwise relationships from the family network are represented in each possible pedigree or until there are no possible pedigrees left for reconstruction.
PRIMUS reconstructs in three phases. Phase 1 uses PO and FS relationships. These two types of relationships are the most accurately predicted because PO relationships have no biological variance around the expected proportion of sharing, and FS relationships are the only nonconsanguineous relationships with IBD2 greater than 0. Phase 1 creates a backbone on which the more distant relationships are built. It adds a PO relationship between individuals A and B to the pedigree by creating a version of the pedigree in which A is the parent of B and another version in which B is the parent of A. Missing individuals are added as necessary so that each individual in the family network has zero or two parents. In phase 2, PRIMUS reconstructs second-degree (half-sibling, avuncular, and grandparental) relationships. The algorithm tests all possible rearrangements for each second-degree relationship within the pedigree and adds missing individuals to connect portions of the pedigree as necessary. Phase 3 is identical to phase 2, except that it considers third-degree (first-cousin, half-avuncular, great-avuncular, and great-grandparental) relationships. Because PRIMUS always checks every possible way that a sample can be added to the pedigree and eliminates pedigrees that do not fit, it is effectively exploring the entire search space of possible pedigrees. At present, PRIMUS does not reconstruct complex relationships (e.g., half sibling plus first cousin or double first cousins), consanguineous relationships, or relationships more distant than third-degree relatives. If one of these relationships is present in the data set, PRIMUS will match it to one of the relationship categories in Table 1 and fit the relationship into the pedigree accordingly.
Automatically Adjusting the Likelihood Threshold
If PRIMUS reaches the end of reconstruction and has zero possible pedigrees remaining, then it will automatically lower the likelihood threshold from the default of 0.3 to 0.2 and will rerun, allowing PRIMUS to consider additional possible pairwise relationships with likelihoods between 0.2 and 0.3. PRIMUS will continue to gradually drop the likelihood threshold until it produces a possible pedigree or it reaches a threshold below 0.01. If no possible pedigrees result from reconstruction after the threshold is lowered below 0.01, then PRIMUS stops reconstruction. For further details, see Figure S4.
Pedigree Scoring
For many families, there is only one possible pedigree that fits the data and the true pedigree. However, as a result of the unknown directionality of some relationships and missing data for individuals, PRIMUS can reconstruct more than one possible pedigree—including the true pedigree—that fits the genetic data. We attempt to increase the chances that the true pedigree is near the top of the list by ranking the possible pedigrees according to the relationship-likelihood vectors to obtain a pedigree score.
PRIMUS will rank the pedigrees according to a pedigree score it calculates by summing the log of the likelihood value of each relationship in the pedigree. For example, if a pedigree has only two individuals, and they have a 0.6 likelihood of being second-degree relatives and a 0.4 likelihood of being third-degree relatives, then all pedigrees in which they are second-degree relatives will be ranked higher than pedigrees in which they are third-degree relatives. Additionally, if the ages of individuals are provided, then PRIMUS will flag and rank all pedigrees in which the ages are inconsistent (e.g., a child is older than a parent).
PRIMUS Results and Output
PRIMUS uses Cranefoot43 (Web Resources) to provide an image of each pedigree and provides the corresponding PLINK-formatted FAM file. Summary results, as well as a list of the possible relationships for each pair of related individuals (similar to Table S5), are provided for each family network and the entire data set. See the PRIMUS documentation for a complete list and description of output files and formats (Web Resources).
Pedigree-Checking Program
PRIMUS also has the ability to check that a reported pedigree is among the produced reconstructed pedigrees. The user provides the reported pedigree in the form of a PLINK FAM or PED file, and PRIMUS compares it to each of the reconstructed pedigrees to see whether there is a match. In the case that the reconstruction includes additional samples that are not part of the reported pedigree, PRIMUS will find the match and report that there are additional genotyped samples included in the pedigree.
Reconstructing Authentic Pedigrees
We tested the ability of PRIMUS to reconstruct several different pedigrees by using real genetic data. IBD estimates were obtained from genotypes generated with a HumanCytoSNP-12 BeadChip for all available pedigrees obtained by the University of Washington Center for Mendelian Genomics (UW CMG), with the exception of 49 pedigrees for which only exome sequencing data were generated (see the Boston Early-Onset Chronic Obstructive Pulmonary Disease [EOCOPD] Study samples in the Web Resources). UW CMG studies were approved by the institutional review boards of the University of Washington, and informed consent was obtained from participants or their parents. The Boston EOCOPD Study participants provided written informed consent, and the Partners HealthCare Human Research Committee approved the study.
IBD estimates for HapMap3 were generated with HapMap3 release 2 data (Web Resources). We used PLINK to calculate all IBD estimates by using SNPs with a minor allele frequency > 1% and a call rate > 90%. We used PRIMUS to identify the maximum unrelated set for each HapMap3 population and used the allele frequencies from the unrelated samples for the IBD analysis of their own respective populations.
The Starr County Health Studies’ Genetics of Diabetes Study is composed of 1,890 affected individuals and representative control samples from a systematic survey conducted in Starr County from 2002 to 2006.44 However, the types of relationships and potential families in the study are unknown. IBD estimates for the Starr County samples were generated from genotypes called from the Affymetrix Genome-Wide SNP Array 6.0.44 We used PLINK to calculate all IBD estimates by using SNPs with a minor allele frequency > 1% and a call rate > 90%. We used PRIMUS37 to identify the maximum unrelated set for the Starr County data and used the allele frequencies from the unrelated samples for the IBD estimations. The Starr County Health Studies’ participants provided written informed consent, and the institutional review boards of the University of Texas Health Science Center at Houston approved the study.
Exome Sequencing Data and Corresponding Pedigrees
The Boston EOCOPD Study45 (see Web Resources) is an extended pedigree study of genetic susceptibility to EOCOPD. All available first-degree relatives (siblings, parents, and children), older second-degree relatives (half siblings, aunts, uncles, and grandparents), and other relatives diagnosed with EOCOPD were invited to participate in the study. For this project, 351 subjects from 49 pedigrees were sequenced at the UW CMG.
Exome sequencing was performed with NimbleGen v.2 in-solution hybrid capture and Illumina HiSeq 2000 sequencing,46 sequences were aligned to the human reference genome (UCSC Genome Browser hg19),47 and single-nucleotide and insertion-deletion variants were called with the Genome Analysis Toolkit.48 We used VCFtools49 to select only PASS SNPs with a minimum and maximum depth of 8× and 300×, respectively, and converted them to PLINK14-formatted PED and MAP files. We then calculated IBD estimates in PLINK by using the 56,516 SNPs with a minor allele frequency > 1% and a call rate > 90%. We used a coefficient-of-relatedness cutoff of 0.1 to calculate SNP allele frequencies for the IBD analysis from 81 of the 351 exome-sequenced samples that made up the maximum unrelated set as calculated by PRIMUS.37
Results
Reconstructing Simulated Pedigrees
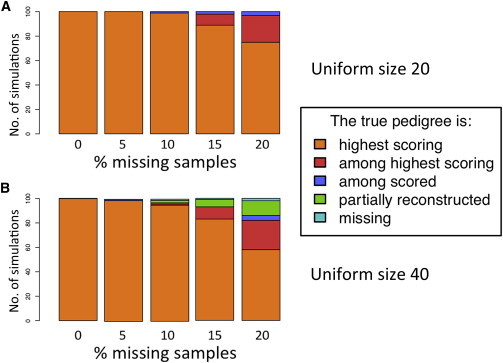
To test and evaluate the performance of PRIMUS on a broad range of known pedigrees, we simulated uniform and half-sibling pedigree structures of varying sizes, different numbers of markers, and varying combinations of masked data for individuals in the pedigrees (see Material and Methods for details). Figure 1 shows the simulation results for reconstruction of size-20 and size-40 uniform pedigrees with ≤20% missing samples. PRIMUS reconstructed the true pedigree as the only pedigree or the highest-scoring pedigree in 89% of the simulations. For another 5.6% of these simulations, the true pedigree was tied with one other pedigree for the highest-scoring pedigree. Only 2.5% of these simulations failed to run to completion as a result of too many possible pedigrees (>100,000), too long of a runtime (>36 hr), or using too much memory (e.g., exceeding 12 Gb). PRIMUS then reran these incomplete reconstructions with a relatedness cutoff of 0.375 to generate partial reconstructions for each. A partially reconstructed pedigree typically consists of two to six pieces of the larger pedigree in which the individuals are connected by first-degree relationships. It would require connecting these pieces with second- and third-degree relationships to achieve a complete reconstruction of the true pedigree.
Figure 1.
A Summary of the PRIMUS Reconstructions for 1,000 Simulated Pedigrees
All simulated uniform size-20 (A) and uniform size-40 (B) pedigrees with up to 20% missing samples were reconstructed with PRIMUS. We ran 100 simulations for each size and percentage of missing samples. For each simulation, we determined where the true pedigree fell among the ranked reconstruction results. Each bar displays the proportion of the 100 simulations corresponding to the five reconstruction outcomes defined as follows: “highest scoring” means that the true pedigree was the highest-scoring pedigree; “among highest scoring” means that PRIMUS output contained more than one possible pedigree and that the true pedigree was tied with one or more other pedigrees for the highest-scoring pedigree; “among scored” indicates that the true pedigree was not the highest-scoring pedigree but was among the pedigrees generated by PRIMUS; “partial reconstruction” means that the complete reconstruction resulted in too many possible pedigrees, ran out of memory, or took longer than 36 hr to run, and as a result only a partial reconstruction using first-degree relationships was generated; and “missing” indicates that PRIMUS reconstructed one or more possible pedigrees but that the true pedigree was not among them.
Across all of the uniform and half-sibling simulated pedigrees of size 5–50 (∼10,000 pedigrees), PRIMUS reconstructed the true pedigree as the highest-scoring or tied-for-highest-scoring pedigree in 88.7% of the simulations (Table S2; Figure S6). Only 6.3% of all simulations led to partial reconstructions, and PRIMUS completed, but did not reconstruct, the true pedigree in only 0.5% of the simulations. We found that if PRIMUS outputs a single possible pedigree, then that pedigree is the true pedigree in 99.83% of the simulations.
Two trends were seen within the simulation results with respect to the size of the pedigree being reconstructed and the proportion of individuals without genetic data. First, PRIMUS identified the true pedigree as the most likely pedigree in 94.9% of the simulations of pedigrees up to size 20 and up to 20% missing sample data and identified the highest-scoring or tied-for-highest-scoring pedigree in 99.4% of the simulations. As the proportion of individuals without genetic data increased to 50%, the true pedigree was more often tied for the highest-scoring pedigree rather than being the highest-scoring pedigree, as expected. Frequently, additional information, such as age, will help rule out many of the tied pedigrees to identify the true pedigree structure.
Second, even with size-50 pedigrees and 20% missing samples, more often than not PRIMUS identified the correct pedigree as the single most likely pedigree. These results can be further improved with greater computational capabilities; PRIMUS tends to produce partial reconstructions as the size of the pedigree increases. For example, compared to size-20 pedigrees with 50% missing samples, size-50 pedigrees with 20% missing samples require more run time (>36 hr) and memory (>12 Gb) to traverse the entire space of possible pedigrees.
Very few simulations completed reconstruction yet failed to find the true pedigree among the possible pedigrees (∼0.5%), and their occurrence was not linked to pedigree size or the number of missing samples. This occurs when the initial likelihood threshold is set higher than the likelihood calculated by the KDE for one or more of the relationships in the true pedigree. Running PRIMUS with an initial likelihood threshold of 0.01 would include the true pedigree among the reconstructed pedigrees. As expected, we found that PRIMUS runtime tends to increase exponentially with pedigree size and the amount of missing sample data (Figure S7). Pedigrees up to size 20 and 20% missing samples reconstruct in a matter of seconds.
Confirming and Correcting Clinically Ascertained Pedigrees
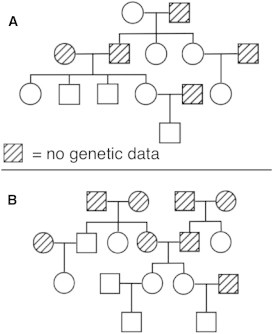
To demonstrate the ability of PRIMUS to verify the genetic information for clinical pedigrees, we reconstructed and confirmed or corrected more than 100 pedigrees submitted to the UW CMG. The genetic information used by PRIMUS can be either chip-based (Figure 2) or sequence-based (Figures 3 and 4) technologies. Genome-wide IBD estimates for the samples in the pedigree in Figure 2 were generated with genotypes from the HumanCytoSNP BeadChip for each nonmissing sample. PRIMUS used these IBD estimates for all pairs of samples to reconstruct the possible pedigree. Only one pedigree fit the data, and it matched the clinically provided pedigree, supporting our hypothesis that it is the correct pedigree. This reconstruction took 9 s on a 2.3 GHz Intel Core i7 processor. Importantly, PRIMUS also introduced the five missing individuals necessary to connect the final pedigree and correctly identified in the pedigree a cycle that occurred because individual III-3 had children with the two cousins III-2 and III-4 (Figure 2).
Figure 2.

A UW CMG Pedigree Correctly Reconstructed by PRIMUS in 9 s
PRIMUS used chip-based genotype data to verify this clinically ascertained pedigree, which included the presence of five individuals for whom no genetic data were available (individuals marked with diagonal lines) and a cycle that occurred because individual III-3 had children with both III-2 and III-4.
Figure 3.
Two Reported EOCOPD Study Pedigrees Verified by PRIMUS
(A) This pedigree was the only pedigree generated from PRIMUS.
(B) This pedigree was tied with five other pedigrees for the highest-scoring pedigree.
Figure 4.
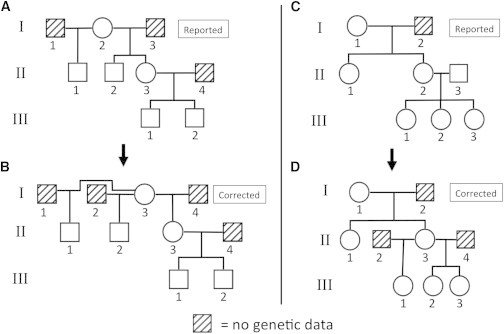
Two of the Six EOCOPD Study Pedigrees Corrected by PRIMUS
The reported pedigrees are depicted above (A and C), and the corrected pedigrees are shown below (B and D). Reported pedigree A has a nonpaternity error, so individuals II-2 and II-3 are actually half siblings rather than full siblings in the correct pedigree B. Pedigree B was the top-ranked pedigree in the PRIMUS output. Reported pedigree C contains not only a nonpaternity error that caused individual III-1 to be incorrectly reported as a full sibling of III-2 and III-3 but also a sample swap that caused individual II-3’s DNA to be swapped for DNA of an individual from an entirely different pedigree. Corrected pedigree D was the only pedigree generated by PRIMUS. The investigators have independently confirmed the corrected pedigrees.
Using variant data obtained from exome sequencing generated by the UW CMG, PRIMUS validated 49 pedigrees consisting of 351 individuals ascertained through a proband with severe EOCOPD. The pedigrees range from size 4 with 50% missing samples to size 23 with 35% missing samples. PRIMUS confirmed that 43 of the pedigrees matched the reported pedigrees collected in the study. Among the remaining six pedigrees, PRIMUS found and corrected five nonpaternity errors, one sample swap, and one duplicate sample. These findings were consistent with the corrections independently made by the Boston EOCOPD Study investigators, who compared estimates of IBDs obtained by PLINK with theoretical IBDs obtained with the kinship2 package (Web Resources). Table S4 summarizes the EOCOPD reconstruction and includes size, the number of possible pedigrees, and where the true pedigree ranked in the possible pedigrees.
Figure 3 shows two reported EOCOPD Study pedigrees that were verified by PRIMUS. The pedigree depicted in Figure 3A was the only pedigree generated by PRIMUS, and the pedigree in Figure 3B was among the highest-scoring pedigrees. Figure 4 shows two of the reported pedigrees (Figures 4A and 4C) that were corrected with PRIMUS (Figures 4B and 4D). The pedigree in Figure 4A had a nonpaternity error, so individuals A and B are actually half siblings rather than full siblings (Figure 4B). For the reported pedigree in Figure 4C, PRIMUS not only corrected a nonpaternity error, revealing that individual B is a half sibling of individuals C and D, but also identified a sample swap that caused individual A’s DNA to be replaced with DNA from another individual in the data set. This corrected pedigree was the only pedigree generated by PRIMUS for these samples.
Reconstructing and Incorporating Cryptic Relatedness
To evaluate whether PRIMUS could incorporate cryptic relationships into known pedigrees, we reconstructed pedigrees by using HapMap3 data.50 Although the HapMap samples were collected to contain trios, duos, and unrelated individuals, cryptic relatedness among these samples is well established.6,19,29 For example, the ten-person pedigree from individuals of Mexican Ancestry in Los Angeles (MXL; Figure S8) has been manually reconstructed with pairwise relationship predictions by several groups.15,29,39
We used PRIMUS to automatically reconstruct all pedigrees within each HapMap3 population, and PRIMUS reconstructed cryptic pedigrees in 9 of the 11 populations (Table S5). PRIMUS confirmed the relationships reported by the HapMap Consortium and the cryptic first- through third-degree relationships reported by Pemberton et al.29 and Kyriazopoulou-Panagiotopoulou et al.15 (Table S5). However, because PRIMUS uses all pairwise relationships up to third-degree relatives to reconstruct the entire pedigree, it can consider each relationship in the context of all others. This enabled our approach to correct one misspecified first-degree and two second-degree relationships reported by Pemberton et al. In addition to making these corrections, PRIMUS was able to increase the specificity of 13 second- and third-degree relationship predictions. For example, Pemberton et al. reported that MKK (Maasai in Kinyawa, Kenya) individuals NA21312 and NA21370 had an unknown relationships status, but PRIMUS identified them as half siblings. For this pair of individuals, PRIMUS eliminated all other second-degree relationships by using the context of the other pairwise relationships in the pedigree.
PRIMUS also identified 85 previously unreported15,29 potential third-degree relationships among the HapMap3 samples (Table S5). Although we cannot be certain that these relationships are precise, our results provide strong evidence that relationships do exist and are an improvement over the common assumption that these samples are unrelated. We have made all reconstructed HapMap3 pedigrees available for download on the PRIMUS website (see Web Resources).
Reconstruction of Previously Unknown Pedigrees from Starr County
We used the Starr County Health Study to demonstrate the ability of PRIMUS to reconstruct previously unknown pedigrees from a large genetic data set. We calculated IBD estimates among all 1,890 samples by using genotypes obtained from the individuals (Affymetrix Genome-Wide SNP Array 6.044). PRIMUS used these estimates to group 458 samples into 203 family networks of two or more samples. Using only these genetic data, PRIMUS reconstructed a single possible pedigree for 120 of these families in less than 4 min, and according to our simulation results, we expect that ∼99.83% of these are the true pedigrees. When ages are provided to PRIMUS, it flags pedigrees that are impossible given the ages of the samples (e.g., when a parent is younger than a child). Using the age information collected for the Starr County Heart Study data set, PRIMUS ruled out these incorrect pedigrees and identified a single possible pedigree for an additional 73 families for a total of 193 pedigrees ranging in size from two to five individuals.
Comparing PRIMUS to Competing Methods
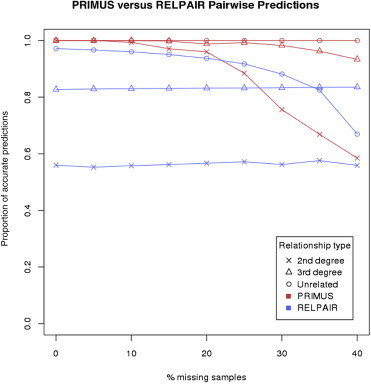
We compared the results of PRIMUS to those generated by RELPAIR, a program commonly used to check relationships in genetic data. Using the method employed by Pemberton et al.,29 we compared the accuracy of the pairwise predictions of RELPAIR to the accuracy of the pairwise relationships in the top-ranked reconstructed pedigree produced by PRIMUS (Figure 5; Table S3). Both methods had 100% accuracy when distinguishing between first-degree relationships; however, PRIMUS outperformed RELPAIR when second-degree relationships were considered. Although RELPAIR made the distinction between the first- and second-degree relationships, it labeled all third-degree relationships as cousins. PRIMUS distinguished between the four third-degree relationships and also gave directionality to the relationship (e.g., individual II-5 is the great-grandfather of individual V-1 in Figure 2). Therefore, to make a fair comparison between the ability of PRIMUS and RELPAIR to predict third-degree relationships, we compared only the degree of the relationship predicted by PRIMUS to the “cousin” prediction of RELPAIR. PRIMUS outperformed RELPAIR when classifying third-degree and unrelated relationships (Figure 5; Table S3).
Figure 5.
Relationship-Prediction Accuracies for Simulated Pedigrees with RELPAIR or PRIMUS
For this comparison, we used half-sibling size-20 pedigrees with 0%–40% missing samples to test pairwise relationship-prediction accuracy. For PRIMUS, we tested whether the relationships in the highest-ranked pedigree matched the true simulated relationships. For RELPAIR, we used the method employed by Pemberton et al.29 to obtain the prediction and compared that to the true simulated relationship. A second-degree relationship prediction is correct if the predicted relationship type matches the true relationship type. A third-degree relationship prediction is correct if the predicted relationship degree matches the true relationship degree. A distantly and unrelated prediction is correct if the true relationship is more than a third-degree relationship.
We also compared PRIMUS to the latest pedigree-reconstruction programs, PREPARE and IPED2 (see Web Resources). Of the 9,717 simulated pedigrees of size 10–50, only 43 pedigrees had all genotyped samples in a single generation, and all of these pedigrees had at least one half-sibling relationship. Therefore, PREPARE and IPED2 could only attempt to correctly reconstruct <0.5% of the simulated pedigrees; PRIMUS correctly reconstructed 9,008 of the 9,717 (92.7%) simulated pedigrees. Figure S9 shows PRIMUS reconstructions for additional simple, common pedigree structures that PREPARE and IPED2 could not completely reconstruct.
Additionally, neither PREPARE nor IPED2 could completely reconstruct any of the real data presented in this manuscript because all of these pedigrees have genotyped samples from multiple generations. PREPARE and IPED2 provided a partial reconstruction by dropping samples from higher generations and using only extant individuals, as the PREPARE authors did with the MXL pedigree (Figure 14 from Shem-Tov and Halperin;36 Figure S8). In order to reconstruct relationships, PREPARE requires a priori information about which individuals are in the same generation prior to reconstruction and cannot connect these pairwise relationships into a single, multigenerational pedigree. PRIMUS completely reconstructed these pedigrees (e.g., Figure S8). PREPARE and IPED2 provide limited utility to check reported pedigree structures and to reconstruct previously unknown pedigrees de novo.
Discussion
PRIMUS is designed to reconstruct nonconsanguineous pedigrees of arbitrary size and structure from pairwise estimates of IBD for samples of up to third-degree relatives. It can also reconstruct some consanguineous pedigrees with children whose parents are third-degree relatives (Figure S10). PRIMUS provides major advancements in reconstructing, testing, and correcting pedigrees. Although pairwise predictions provided by commonly applied programs such as RELPAIR and PREST can test whether two individuals are related at the expected degree of relatedness, they are much weaker at distinguishing between relationship types within the same degree of relatedness (e.g., avuncular versus grandparental) and cannot provide information of the directionality of a relationship (i.e., individual A is the grandparent of B). As a result, they are not able to detect all pedigree inconsistencies or suggest corrections to pedigrees. Additionally, using pairwise relationships to check pedigrees can result in the unnecessary loss of data (Figure S11) or in accepting an incorrect pedigree as true (Figure S12).
PRIMUS improves on the pairwise predictions by using all the pairwise relationships to reconstruct the pedigree. The context of all the pairwise relationships in the family improves the prediction accuracy of each relationship pair. We have shown that the reconstructed pedigrees obtained by PRIMUS were more accurate than those obtained with RELPAIR (Figure 5; Table S3). In the case of HapMap3, PRIMUS corrected and improved several of the pairwise relationship predictions made by RELPAIR and CARROT (Classification of Relationships with Rotations)15 (Table S5).
PRIMUS is also a major step forward in comparison to existing pedigree-reconstruction programs given that the existing methods require a small number of markers, completely genotyped pedigrees, no half siblings, and/or that all genotyped samples be in the same generation. For these reasons, no other pedigree-reconstruction program we tested is capable of reconstructing the variety of pedigrees—which represent some of the most common pedigrees found in human genetic studies—we illustrate in this paper.
Importantly, pedigree reconstruction by PRIMUS depends on the quality of the IBD estimates, which are influenced by several factors, including the number of genetic markers, population substructure,16 admixture,39 and reference minor allele frequencies.51 For best results, users should obtain high-quality IBD estimates before reconstructing pedigrees with PRIMUS. IBD estimates can be obtained by PRIMUS or by another program (PLINK,14 KING,16 or REAP [Relatedness Estimation in Admixed Populations]39) that uses the appropriate allele frequencies for the ancestry of the samples and accounts for potential admixture and population substructure among the data.
We designed PRIMUS to reconstruct up to third-degree relationships for several reasons. First, the distance between the expected mean genome-wide IBD proportions for more distant relationships (e.g., fourth and fifth degrees) is small, and the variation around these means is large. Therefore, the overlap between the distributions of these distant relationships precludes highly accurate relationship assignments of any relationship beyond the third degree. Second, as the relationship distance increases beyond the third degree, the number of possible relationships increases rapidly (Table S6), and pedigree reconstruction quickly becomes computationally challenging. For more distant relationships, it is possible to apply programs such as Beagle41 and ERSA (Estimation of Recent Shared Ancestry)18 to connect the PRIMUS-obtained subpedigrees that are distantly related to one another, and we are incorporating this feature in a future release of PRIMUS. Additionally, programs such as RELPAIR19 could improve the pairwise relationship prediction because they model recombination events to distinguish between second-degree relationships. The improved relationship predictions could then be used to improve the scoring of possible pedigrees.
We have identified two limitations of PRIMUS and their corresponding remedies. First, because of computational restraints, PRIMUS was unable to complete the reconstruction of 6.3% of simulations with third-degree relatives or closer. The vast majority of these pedigrees had ≥30 individuals with >20% missing sample data. Investigators can still greatly benefit from partial reconstructions of these pedigrees. Users can obtain a partial reconstruction, as we did, by using a higher relatedness threshold to reconstruct with just first- or second-degree relationships. Second, for a very small proportion (∼0.5%) of the simulations, PRIMUS did not output the true pedigree among the results because the initial likelihood threshold was set too high. Yet, by lowering the initial likelihood threshold used for predicting familial relationships, PRIMUS was able to reconstruct each of these pedigree structures. Therefore, for a very small percentage of pedigrees run on PRIMUS, it might be necessary to depart from the default initial likelihood threshold to obtain a reported pedigree.
PRIMUS provides an immediate benefit to the genetics community in two ways: pedigree verification and pedigree discovery. Because PRIMUS computationally verifies reported pedigrees by using genotype data and identifies and corrects inconsistencies, PRIMUS saves a significant amount of time and effort that would otherwise be spent on manual verification of pedigrees. This is especially beneficial when large, complex pedigrees—similar to the Boston EOCOPD Study pedigrees—are being studied. For example, PRIMUS has identified and corrected nonpaternities, underrelated samples, samples swaps, duplicate samples, and unexpected consanguinity in clinical pedigrees (Figure 4; Figure S10). In many cases, such corrections can result in a correction of the genetic model and assumptions used for downstream analysis, improving the chances of finding the genetic cause of the disease.
Moreover, PRIMUS can reconstruct previously unknown pedigrees by using only genetic data, as demonstrated in the HapMap3 and Starr County data sets. Although, PRIMUS cannot guarantee that these pedigrees are the true pedigrees, the pedigrees can be treated as a hypothesis to be confirmed with supporting independent evidence. This application of PRIMUS is particularly useful in large-scale genetic studies where substantial cryptic relatedness might exist. In the case of the Starr County data, we can now use powerful family-based analyses that leverage the information contained in nearly 200 previously unknown pedigrees.
Incomplete understanding of relatedness structures (i.e., pedigrees) within genetic data can result in a vast array of analytic problems, from dramatically biased effects of rare variants to complete power loss in pedigree-based methods. With the introduction of PRIMUS, we hope to address many of the limitations of prior pedigree-reconstruction frameworks and pairwise comparison algorithms in a fast, tractable, and easy-to-use algorithm, enabling investigators to better assess the information present within their data.
Acknowledgments
Andrew Stayart, Chad Huff, William Noble, Bruce Weir, Elizabeth Thompson, Jean Morrison, Brian Browning, Jay Shendure, David Dale, Kevin Boehme, Christa Poel, Colleen Davis, and Timothy Thornton provided helpful discussion and input. We’d like to thank Craig L. Hanis and the investigators and staff of the Starr County Health Studies (grants DK073541 and DK085501) and the University of Washington Center for Mendelian Genomics (UW CMG; HG006493). Sequencing was provided by the UW CMG and was funded by National Human Genome Research Institute (NHGRI) and NHLBI grant 1U54HG006493 to D.A.N., Jay Shendure, and Michael Bamshad. J.S. is support by the National Science Foundation Graduate Research Fellowship under grant DGE-0718124. Support for D.A.N. and J.E.B. was provided by NHGRI and NHLBI grant HG006493. The Boston Early-Onset Chronic Obstructive Pulmonary Disease Study, D.Q., M.H.C., and E.K.S. are supported by NHLBI grant R01 HL113264. In the past 3 years, E.K.S. received honoraria and consulting fees from Merck and grant support and consulting fees from GlaxoSmithKline.
Contributor Information
Deborah A. Nickerson, Email: debnick@uw.edu.
Jennifer E. Below, Email: jennifer.e.below@uth.tmc.edu.
Supplemental Data
Web Resources
The URLs for data presented herein are as follows:
Boston Early-Onset COPD Study, http://bostoncopd.org
CraneFoot, http://www.finndiane.fi/software/cranefoot/
International HapMap Project, http://hapmap.ncbi.nlm.nih.gov
PRIMUS, http://primus.gs.washington.edu
PRIMUS simulations, the link to the code used for generating simulations, and the reconstructed HapMap3 pedigrees, http://sourceforge.net/projects/primus-beta/files/
SciPy, http://www.scipy.org
References
- 1.Santorico S.A., Edwards K.L. Challenges of linkage analysis in the era of whole-genome sequencing. Genet. Epidemiol. 2014;38(Suppl 1):S92–S96. doi: 10.1002/gepi.21832. [DOI] [PubMed] [Google Scholar]
- 2.Ott J., Kamatani Y., Lathrop M. Family-based designs for genome-wide association studies. Nat. Rev. Genet. 2011;12:465–474. doi: 10.1038/nrg2989. [DOI] [PubMed] [Google Scholar]
- 3.Hu H., Roach J.C., Coon H., Guthery S.L., Voelkerding K.V., Margraf R.L., Durtschi J.D., Tavtigian S.V., Shankaracharya, Wu W. A unified test of linkage analysis and rare-variant association for analysis of pedigree sequence data. Nat. Biotechnol. 2014;32:663–669. doi: 10.1038/nbt.2895. [DOI] [PMC free article] [PubMed] [Google Scholar]
- 4.McMillin M.J., Below J.E., Shively K.M., Beck A.E., Gildersleeve H.I., Pinner J., Gogola G.R., Hecht J.T., Grange D.K., Harris D.J., University of Washington Center for Mendelian Genomics Mutations in ECEL1 cause distal arthrogryposis type 5D. Am. J. Hum. Genet. 2013;92:150–156. doi: 10.1016/j.ajhg.2012.11.014. [DOI] [PMC free article] [PubMed] [Google Scholar]
- 5.Below J.E., Earl D.L., Shively K.M., McMillin M.J., Smith J.D., Turner E.H., Stephan M.J., Al-Gazali L.I., Hertecant J.L., Chitayat D., University of Washington Center for Mendelian Genomics Whole-genome analysis reveals that mutations in inositol polyphosphate phosphatase-like 1 cause opsismodysplasia. Am. J. Hum. Genet. 2013;92:137–143. doi: 10.1016/j.ajhg.2012.11.011. [DOI] [PMC free article] [PubMed] [Google Scholar]
- 6.Li B., Krakow D., Nickerson D.A., Bamshad M.J., Chang Y., Lachman R.S., Yilmaz A., Kayserili H., Cohn D.H., University of Washington Center for Mendelian Genomics Opsismodysplasia resulting from an insertion mutation in the SH2 domain, which destabilizes INPPL1. Am. J. Med. Genet. A. 2014;164A:2407–2411. doi: 10.1002/ajmg.a.36640. [DOI] [PMC free article] [PubMed] [Google Scholar]
- 7.Makaryan V., Rosenthal E.A., Bolyard A.A., Kelley M.L., Below J.E., Bamshad M.J., Bofferding K.M., Smith J.D., Buckingham K., Boxer L.A., UW Center for Mendelian Genomics TCIRG1-associated congenital neutropenia. Hum. Mutat. 2014;35:824–827. doi: 10.1002/humu.22563. [DOI] [PMC free article] [PubMed] [Google Scholar]
- 8.Voight B.F., Pritchard J.K. Confounding from cryptic relatedness in case-control association studies. PLoS Genet. 2005;1:e32. doi: 10.1371/journal.pgen.0010032. [DOI] [PMC free article] [PubMed] [Google Scholar]
- 9.Day-Williams A.G., Blangero J., Dyer T.D., Lange K., Sobel E.M. Linkage analysis without defined pedigrees. Genet. Epidemiol. 2011;35:360–370. doi: 10.1002/gepi.20584. [DOI] [PMC free article] [PubMed] [Google Scholar]
- 10.Boehnke M., Cox N.J. Accurate inference of relationships in sib-pair linkage studies. Am. J. Hum. Genet. 1997;61:423–429. doi: 10.1086/514862. [DOI] [PMC free article] [PubMed] [Google Scholar]
- 11.Bellis M.A., Hughes K., Hughes S., Ashton J.R. Measuring paternal discrepancy and its public health consequences. J. Epidemiol. Community Health. 2005;59:749–754. doi: 10.1136/jech.2005.036517. [DOI] [PMC free article] [PubMed] [Google Scholar]
- 12.Kerr S.M., Campbell A., Murphy L., Hayward C., Jackson C., Wain L.V., Tobin M.D., Dominiczak A., Morris A., Smith B.H., Porteous D.J. Pedigree and genotyping quality analyses of over 10,000 DNA samples from the Generation Scotland: Scottish Family Health Study. BMC Med. Genet. 2013;14:38. doi: 10.1186/1471-2350-14-38. [DOI] [PMC free article] [PubMed] [Google Scholar]
- 13.Wolf M., Musch J., Enczmann J., Fischer J. Estimating the prevalence of nonpaternity in Germany. Hum. Nat. 2012;23:208–217. doi: 10.1007/s12110-012-9143-y. [DOI] [PubMed] [Google Scholar]
- 14.Purcell S., Neale B., Todd-Brown K., Thomas L., Ferreira M.A., Bender D., Maller J., Sklar P., de Bakker P.I., Daly M.J., Sham P.C. PLINK: a tool set for whole-genome association and population-based linkage analyses. Am. J. Hum. Genet. 2007;81:559–575. doi: 10.1086/519795. [DOI] [PMC free article] [PubMed] [Google Scholar]
- 15.Kyriazopoulou-Panagiotopoulou S., Kashef Haghighi D., Aerni S.J., Sundquist A., Bercovici S., Batzoglou S. Reconstruction of genealogical relationships with applications to Phase III of HapMap. Bioinformatics. 2011;27:i333–i341. doi: 10.1093/bioinformatics/btr243. [DOI] [PMC free article] [PubMed] [Google Scholar]
- 16.Manichaikul A., Mychaleckyj J.C., Rich S.S., Daly K., Sale M., Chen W.M. Robust relationship inference in genome-wide association studies. Bioinformatics. 2010;26:2867–2873. doi: 10.1093/bioinformatics/btq559. [DOI] [PMC free article] [PubMed] [Google Scholar]
- 17.Abecasis G.R., Cherny S.S., Cookson W.O.C., Cardon L.R. GRR: graphical representation of relationship errors. Bioinformatics. 2001;17:742–743. doi: 10.1093/bioinformatics/17.8.742. [DOI] [PubMed] [Google Scholar]
- 18.Huff C.D., Witherspoon D.J., Simonson T.S., Xing J.C., Watkins W.S., Zhang Y.H., Tuohy T.M., Neklason D.W., Burt R.W., Guthery S.L. Maximum-likelihood estimation of recent shared ancestry (ERSA) Genome Res. 2011;21:768–774. doi: 10.1101/gr.115972.110. [DOI] [PMC free article] [PubMed] [Google Scholar]
- 19.Epstein M.P., Duren W.L., Boehnke M. Improved inference of relationship for pairs of individuals. Am. J. Hum. Genet. 2000;67:1219–1231. doi: 10.1016/s0002-9297(07)62952-8. [DOI] [PMC free article] [PubMed] [Google Scholar]
- 20.Sun L., Wilder K., McPeek M.S. Enhanced pedigree error detection. Hum. Hered. 2002;54:99–110. doi: 10.1159/000067666. [DOI] [PubMed] [Google Scholar]
- 21.Nijmeijer J.S., Arias-Vásquez A., Rommelse N.N., Altink M.E., Buschgens C.J., Fliers E.A., Franke B., Minderaa R.B., Sergeant J.A., Buitelaar J.K. Quantitative linkage for autism spectrum disorders symptoms in attention-deficit/hyperactivity disorder: significant locus on chromosome 7q11. J. Autism Dev. Disord. 2014;44:1671–1680. doi: 10.1007/s10803-014-2039-4. [DOI] [PubMed] [Google Scholar]
- 22.Chen C.T., Liu C.T., Chen G.K., Andrews J.S., Arnold A.M., Dreyfus J., Franceschini N., Garcia M.E., Kerr K.F., Li G. Meta-analysis of loci associated with age at natural menopause in African-American women. Hum. Mol. Genet. 2014;23:3327–3342. doi: 10.1093/hmg/ddu041. [DOI] [PMC free article] [PubMed] [Google Scholar]
- 23.Lange L.A., Hu Y., Zhang H., Xue C., Schmidt E.M., Tang Z.Z., Bizon C., Lange E.M., Smith J.D., Turner E.H., NHLBI Grand Opportunity Exome Sequencing Project Whole-exome sequencing identifies rare and low-frequency coding variants associated with LDL cholesterol. Am. J. Hum. Genet. 2014;94:233–245. doi: 10.1016/j.ajhg.2014.01.010. [DOI] [PMC free article] [PubMed] [Google Scholar]
- 24.Bella J.N., Cole S.A., Laston S., Almasy L., Comuzzie A., Lee E.T., Best L.G., Fabsitz R.R., Howard B.V., Maccluer J.W. Genome-wide linkage analysis of carotid artery lumen diameter: the strong heart family study. Int. J. Cardiol. 2013;168:3902–3908. doi: 10.1016/j.ijcard.2013.06.048. [DOI] [PMC free article] [PubMed] [Google Scholar]
- 25.Bizon C., Spiegel M., Chasse S.A., Gizer I.R., Li Y., Malc E.P., Mieczkowski P.A., Sailsbery J.K., Wang X., Ehlers C.L., Wilhelmsen K.C. Variant calling in low-coverage whole genome sequencing of a Native American population sample. BMC Genomics. 2014;15:85. doi: 10.1186/1471-2164-15-85. [DOI] [PMC free article] [PubMed] [Google Scholar]
- 26.Quillen E.E., Chen X.D., Almasy L., Yang F., He H., Li X., Wang X.Y., Liu T.Q., Hao W., Deng H.W. ALDH2 is associated to alcohol dependence and is the major genetic determinant of “daily maximum drinks” in a GWAS study of an isolated rural chinese sample. Am. J. Med. Genet. B. Neuropsychiatr. Genet. 2014;165B:103–110. doi: 10.1002/ajmg.b.32213. [DOI] [PMC free article] [PubMed] [Google Scholar]
- 27.Zhu Y., Voruganti V.S., Lin J., Matsuguchi T., Blackburn E., Best L.G., Lee E.T., MacCluer J.W., Cole S.A., Zhao J. QTL mapping of leukocyte telomere length in American Indians: the Strong Heart Family Study. Aging (Albany, N.Y. Online) 2013;5:704–716. doi: 10.18632/aging.100600. [DOI] [PMC free article] [PubMed] [Google Scholar]
- 28.Nolan D., Kraus W.E., Hauser E., Li Y.J., Thompson D.K., Johnson J., Chen H.C., Nelson S., Haynes C., Gregory S.G. Genome-wide linkage analysis of cardiovascular disease biomarkers in a large, multigenerational family. PLoS ONE. 2013;8:e71779. doi: 10.1371/journal.pone.0071779. [DOI] [PMC free article] [PubMed] [Google Scholar]
- 29.Pemberton T.J., Wang C., Li J.Z., Rosenberg N.A. Inference of unexpected genetic relatedness among individuals in HapMap Phase III. Am. J. Hum. Genet. 2010;87:457–464. doi: 10.1016/j.ajhg.2010.08.014. [DOI] [PMC free article] [PubMed] [Google Scholar]
- 30.Riester M., Stadler P.F., Klemm K. FRANz: reconstruction of wild multi-generation pedigrees. Bioinformatics. 2009;25:2134–2139. doi: 10.1093/bioinformatics/btp064. [DOI] [PMC free article] [PubMed] [Google Scholar]
- 31.Hadfield J.D., Richardson D.S., Burke T. Towards unbiased parentage assignment: combining genetic, behavioural and spatial data in a Bayesian framework. Mol. Ecol. 2006;15:3715–3730. doi: 10.1111/j.1365-294X.2006.03050.x. [DOI] [PubMed] [Google Scholar]
- 32.Marshall T.C., Slate J., Kruuk L.E.B., Pemberton J.M. Statistical confidence for likelihood-based paternity inference in natural populations. Mol. Ecol. 1998;7:639–655. doi: 10.1046/j.1365-294x.1998.00374.x. [DOI] [PubMed] [Google Scholar]
- 33.Cussens J., Bartlett M., Jones E.M., Sheehan N.A. Maximum likelihood pedigree reconstruction using integer linear programming. Genet. Epidemiol. 2013;37:69–83. doi: 10.1002/gepi.21686. [DOI] [PubMed] [Google Scholar]
- 34.He D., Wang Z., Han B., Parida L., Eskin E. IPED: inheritance path-based pedigree reconstruction algorithm using genotype data. J. Comput. Biol. 2013;20:780–791. doi: 10.1089/cmb.2013.0080. [DOI] [PMC free article] [PubMed] [Google Scholar]
- 35.Kirkpatrick B., Li S.C., Karp R.M., Halperin E. Pedigree reconstruction using identity by descent. J. Comput. Biol. 2011;18:1481–1493. doi: 10.1089/cmb.2011.0156. [DOI] [PubMed] [Google Scholar]
- 36.Shem-Tov D., Halperin E. Historical pedigree reconstruction from extant populations using PArtitioning of RElatives (PREPARE) PLoS Comput. Biol. 2014;10:e1003610. doi: 10.1371/journal.pcbi.1003610. [DOI] [PMC free article] [PubMed] [Google Scholar]
- 37.Staples J., Nickerson D.A., Below J.E. Utilizing graph theory to select the largest set of unrelated individuals for genetic analysis. Genet. Epidemiol. 2013;37:136–141. doi: 10.1002/gepi.21684. [DOI] [PMC free article] [PubMed] [Google Scholar]
- 38.Morrison J. Characterization and correction of error in genome-wide IBD estimation for samples with population structure. Genet. Epidemiol. 2013;37:635–641. doi: 10.1002/gepi.21737. [DOI] [PMC free article] [PubMed] [Google Scholar]
- 39.Thornton T., Tang H., Hoffmann T.J., Ochs-Balcom H.M., Caan B.J., Risch N. Estimating kinship in admixed populations. Am. J. Hum. Genet. 2012;91:122–138. doi: 10.1016/j.ajhg.2012.05.024. [DOI] [PMC free article] [PubMed] [Google Scholar]
- 40.Abecasis G.R., Cherny S.S., Cookson W.O., Cardon L.R. Merlin—rapid analysis of dense genetic maps using sparse gene flow trees. Nat. Genet. 2002;30:97–101. doi: 10.1038/ng786. [DOI] [PubMed] [Google Scholar]
- 41.Browning B.L., Browning S.R. A fast, powerful method for detecting identity by descent. Am. J. Hum. Genet. 2011;88:173–182. doi: 10.1016/j.ajhg.2011.01.010. [DOI] [PMC free article] [PubMed] [Google Scholar]
- 42.Hill W.G., Weir B.S. Variation in actual relationship as a consequence of Mendelian sampling and linkage. Genet. Res. 2011;93:47–64. doi: 10.1017/S0016672310000480. [DOI] [PMC free article] [PubMed] [Google Scholar]
- 43.Mäkinen V.P., Parkkonen M., Wessman M., Groop P.H., Kanninen T., Kaski K. High-throughput pedigree drawing. Eur. J. Hum. Genet. 2005;13:987–989. doi: 10.1038/sj.ejhg.5201430. [DOI] [PubMed] [Google Scholar]
- 44.Below J.E., Gamazon E.R., Morrison J.V., Konkashbaev A., Pluzhnikov A., McKeigue P.M., Parra E.J., Elbein S.C., Hallman D.M., Nicolae D.L. Genome-wide association and meta-analysis in populations from Starr County, Texas, and Mexico City identify type 2 diabetes susceptibility loci and enrichment for expression quantitative trait loci in top signals. Diabetologia. 2011;54:2047–2055. doi: 10.1007/s00125-011-2188-3. [DOI] [PMC free article] [PubMed] [Google Scholar]
- 45.Silverman E.K., Chapman H.A., Drazen J.M., Weiss S.T., Rosner B., Campbell E.J., O’Donnell W.J., Reilly J.J., Ginns L., Mentzer S. Genetic epidemiology of severe, early-onset chronic obstructive pulmonary disease. Risk to relatives for airflow obstruction and chronic bronchitis. Am. J. Respir. Crit. Care Med. 1998;157:1770–1778. doi: 10.1164/ajrccm.157.6.9706014. [DOI] [PubMed] [Google Scholar]
- 46.Fu W., O’Connor T.D., Jun G., Kang H.M., Abecasis G., Leal S.M., Gabriel S., Rieder M.J., Altshuler D., Shendure J., NHLBI Exome Sequencing Project Analysis of 6,515 exomes reveals the recent origin of most human protein-coding variants. Nature. 2013;493:216–220. doi: 10.1038/nature11690. [DOI] [PMC free article] [PubMed] [Google Scholar]
- 47.Li H., Durbin R. Fast and accurate short read alignment with Burrows-Wheeler transform. Bioinformatics. 2009;25:1754–1760. doi: 10.1093/bioinformatics/btp324. [DOI] [PMC free article] [PubMed] [Google Scholar]
- 48.McKenna A., Hanna M., Banks E., Sivachenko A., Cibulskis K., Kernytsky A., Garimella K., Altshuler D., Gabriel S., Daly M., DePristo M.A. The Genome Analysis Toolkit: a MapReduce framework for analyzing next-generation DNA sequencing data. Genome Res. 2010;20:1297–1303. doi: 10.1101/gr.107524.110. [DOI] [PMC free article] [PubMed] [Google Scholar]
- 49.Danecek P., Auton A., Abecasis G., Albers C.A., Banks E., DePristo M.A., Handsaker R.E., Lunter G., Marth G.T., Sherry S.T., 1000 Genomes Project Analysis Group The variant call format and VCFtools. Bioinformatics. 2011;27:2156–2158. doi: 10.1093/bioinformatics/btr330. [DOI] [PMC free article] [PubMed] [Google Scholar]
- 50.Altshuler D.M., Gibbs R.A., Peltonen L., Altshuler D.M., Gibbs R.A., Peltonen L., Dermitzakis E., Schaffner S.F., Yu F., Peltonen L., International HapMap 3 Consortium Integrating common and rare genetic variation in diverse human populations. Nature. 2010;467:52–58. doi: 10.1038/nature09298. [DOI] [PMC free article] [PubMed] [Google Scholar]
- 51.Cross D.S., Ivacic L.C., Stefanski E.L., McCarty C.A. Population based allele frequencies of disease associated polymorphisms in the Personalized Medicine Research Project. BMC Genet. 2010;11:51. doi: 10.1186/1471-2156-11-51. [DOI] [PMC free article] [PubMed] [Google Scholar]
Associated Data
This section collects any data citations, data availability statements, or supplementary materials included in this article.