

Abstract
Patch clamping depends on a tight seal between the cell membrane and the glass of the pipet. Why does the seal have such high electric resistance? Why does the patch adhere so strongly to the glass? Even under the action of strong hydrostatic, adhesion, and electrical forces, it creeps at a very low velocity. To explore possible explanations, we examined two physical models for the structure of the seal zone and the adhesion forces and two respective mechanisms of patch creep and electric conductivity. There is saline between the membrane and glass in the seal, and the flow of this solution under hydrostatic pressure or electroosmosis should drag a patch. There is a second possibility: the lipid core of the membrane is liquid and should be able to flow, with the inner monolayer slipping over the outer one. Both mechanisms predict the creep velocity as a function of the properties of the seal and the membrane, the pipet geometry, and the driving force. These model predictions are compared with experimental data for azolectin liposomes with added cholesterol or proteins. It turns out that to obtain experimentally observed creep velocities, a simple viscous flow in the seal zone requires ∼10 Pa·s viscosity; it is unclear what structure might provide that because that viscosity alone severely constrains the electric resistance of the gigaseal. Possibly, it is the fluid bilayer that allows the motion. The two models provide an estimate of the adhesion energy of the membrane to the glass and membrane’s electric characteristics through the comparison between the velocities of pressure-, adhesion-, and voltage-driven creep.
1. Introduction
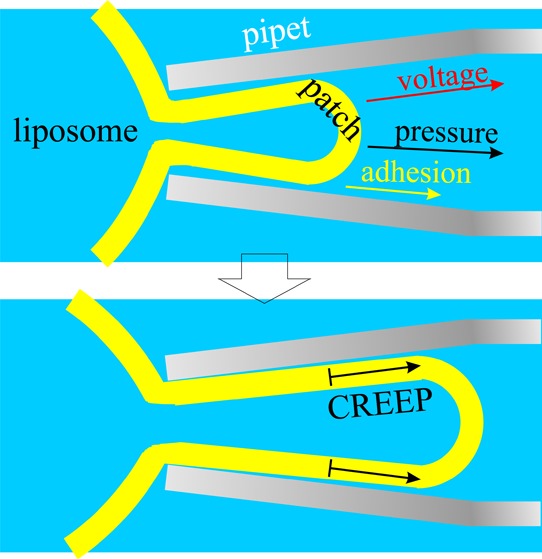
Patch clamp moved into its dominant role in electrophysiology with the serendipitous occurrence of the gigaseal.1 Why a membrane that is negatively charged and made of fluid lipids stick to negatively charged glass remains unclear, although van der Waals interactions seem to be the key.2−4 The mechanics of the seal give an indication of why patches can be mechanically stressed with suction without flying up the pipet. Patches do, in fact, creep under pressure3 as well as spontaneously. Those properties of patches that allow them to stick to glass are the subject of this paper.
There are several general approaches to understanding the physics of this interaction, but no matter what the model, it must permit the creation of seals with a resistance of 1–100 GΩ. The simplest model is to assume that there is a highly viscous medium between the membrane and the glass (Figure 1). In the case of lipid bilayers medium can only be saline plus the headgroups of the lipids, including the water there, which is likely to be ordered by its proximity to the glass and the membrane.2,3 The creep rate of patches made of pure lipids is affected by the presence of proteins; for example, data suggest that some proteins might denature against the glass and thus slow the creep by serving as immobile bridges in the bilayer.5,6 Pure lipid patches might actually have similar “stops” because no lipids are pure, and a small quantity of contaminant might alter the seal behavior drastically. A great deal of physical data is available on adhesives because they play such an important role in modern technology,7−9 but the mechanism of adhesion of the patch to the glass remains unclear; our goal here is to examine a few possibilities and use some of the ideas from the known physical chemistry of adhesion. We begin by considering patches made of pure lipids.
Figure 1.
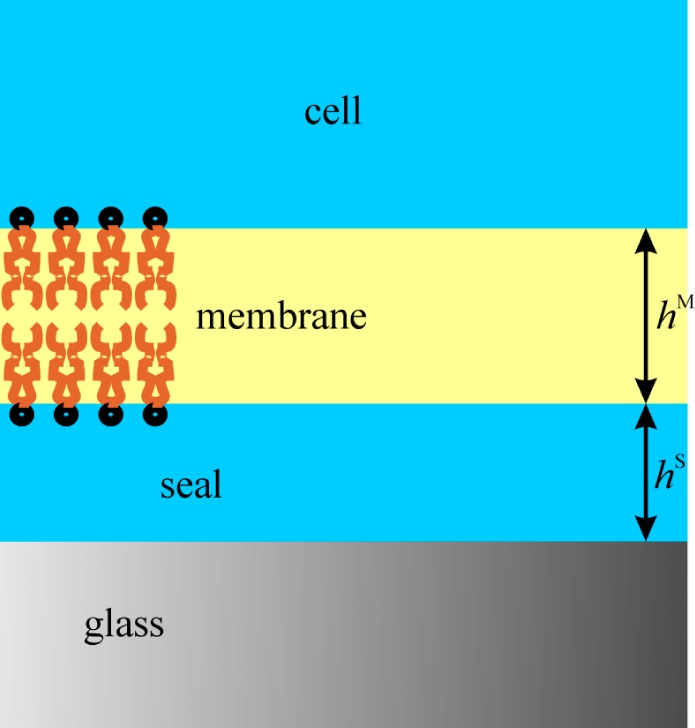
Diagram of the seal zone–multilayer model. The region labeled “cell” would be saline when patching lipid vesicles.
The resistance of the seal imposes powerful constraints on any model. In what follows we use typical patch dimensions of ∼10 μm in length and a pipet radius of nominally 1 μm. If the seal is viewed as a conductive annulus filled with normal saline, the thickness would have to be on the order of angstroms to create a multi GΩ seal. The first important question is whether the seal region between the glass and the membrane (Figure 1) is an electrostatically stabilized liquid film (i.e., a common black film10 with a thickness on the order of 10 nm), or the glass and membrane are in molecular contact (a Newton black film,10 where the saline solution is in an extremely narrow film involving few hydration layers of the glass surface and the head groups of the lipids). These two cases correspond to different mechanisms of creep, different adhesion energies, and different resistances depending on the membrane and glass potential. In the case of a common black film, the motion and energy dissipation are located in the saline layer. In the case of a membrane in molecular contact with the glass, motion and dissipation are located in the bilayer.
2. Electromechanical Properties of the Seal
2.1. van der Waals Disjoining Pressure
To estimate the adhesion energy of the membrane, we will first consider the van der Waals force between the membrane and the glass. Assuming that the seal is a flat glass–seal–membrane–cell structure (Figure 1), the following formula11,12 can be used for the van der Waals disjoining pressure, ΠvdW, and the respective van der Waals energy, σvdW, in the seal film
| 1 |
Here hS and hM are the thicknesses of the seal and the hydrophobic core of the membrane, respectively; and hM is assumed to be equal to two extended hydrocarbon chains of the membrane lipid, ∼4 nm.13 The Hamaker constant AHS is related to the binary constants for water–water (AH), glass–water (AHGW), water–membrane (AH), and glass–membrane (AHGM) van der Waals interaction:11,12
| 2 |
For AHWW and AH, we use the values:4,12AHWW = 3.7 × 10⁻²⁰ J and AH = 4.1 × 10⁻²⁰ J. The other two constants were calculated using the formulas12
| 3 |
The data for the Hamaker constants involved were:4,12AHMM = 4.5 × 10⁻²⁰ J; AH = 5 × 10–20 J; AHWMW = 0.9 × 10⁻²⁰ J; and AH=0.83 × 10⁻²⁰ J. (A list of symbols is provided in the Supporting Information S1.) These values and eq 2 yield a Hamaker constant of AHS= 0.2 × 10⁻²⁰ J. Because all constants involved have a large uncertainty and AH is a small number obtained as the difference between large numbers, not only its value but also even the sign of AHS is not reliable. We have chosen values of the constants in such a way that the final result for AH corresponds to attraction (AHS > 0) because the presence of attractive force is essential for the formation of a gigaseal.3 Equation 1 is approximate–it neglects various effects such as electromagnetic retardation, the screening effect of the electrolyte on the Hamaker constants, and so on;4,12 in addition, eqs 2 and 3 are rough approximations, especially for very thin films. Therefore, eq 1 and the value of AH = 0.2 × 10⁻²⁰ J can be used only for crude estimates of the van der Waals energy of the seal.
2.2. Electrostatic Disjoining Pressure: Variation of the Surface Potential with Seal Thickness, hS
We will investigate in this section the electrostatic characteristics of the seal film14 in Figure 1. There is a strong repulsive electrostatic contribution to the adhesion.15 Let the surface potential of the glass in contact with 150 mM NaCl be ϕ∞G (we assume the value3,16 ϕ∞ = −20 mV) and the surface potential of the outer monolayer of a free-standing bilayer be ϕ∞M (ϕ∞ ≈ −50 mV17,18). Using Gouy electroneutrality condition16 (eq A12 in the Supporting Information S2), one can calculate the respective surface charge densities: ρeG = 0.018 C/m2 and ρe = 0.052 C/m2. When the membrane adheres to the glass and forms a thin liquid film (the seal), the potentials of both surfaces, ϕG and ϕM, will increase due to the interaction between the negatively charged surfaces. The effect is negligible if the Debye length is smaller than seal thickness, LD ≪ hS, but is strong for thin seals, where LD > hS. (LD is defined with LD2 = kBTεS/2e2C, where kB is Boltzmann constant, T is temperature, εS is the absolute dielectric permittivity of the seal, e is elementary charge, and C is electrolyte concentration [m–3]). For 150 mM 1:1 electrolyte solution, the Debye length is LD ≈ 1 nm. The thickness hS of the seal region depends on the magnitude of the van der Waals, electrostatic, and other surface forces acting within the seal. In Section 2.4, we will consider the relation between the electric resistance of the seal, Res, and hS to estimate the thickness from experimental data for Res.
The relation between the surface potentials and hS for the case where the surface charge densities ρeG and ρe are independent of hS is derived in the Supporting Information S2 following Derjaguin.19 The final results for ϕM and ϕG are shown in Figure 2, together with the minimal potential ϕm in the seal film (the minimum of the potential ϕ(z) in the film; this quantity plays a central role in the theory of electrostatic interactions in films19). As seen in the Figure, for thick seals (e.g., hS > 4 nm), the surface potentials are almost equal to those of free-standing membrane and glass surfaces. In such case, the known19 asymptotic formulas for the electrostatic disjoining pressure, Πel, and the electrostatic energy, σel, of thick films can be used (cf. the Supporting Information S2)
| 4 |
| 5 |
Here the electrostatic factor γel is given by
| 6 |
For the values of the parameters cited above, γel = 0.087.
Figure 2.
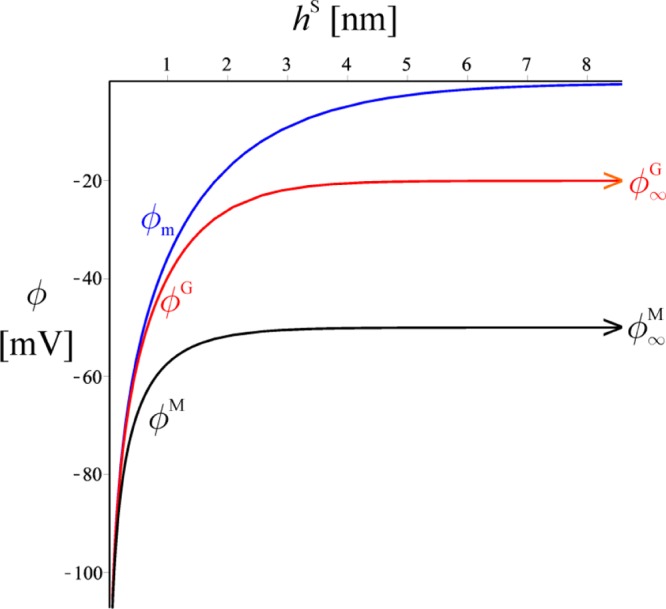
Dependence of the potentials ϕM, ϕG, and ϕm [mV] on seal thickness, hS, in the constant charge regime. For hS > 4 nm, the surface potentials ϕM and ϕG are about the same as those of free surfaces, ϕ∞M and ϕ∞. The minimal potential ϕm in the seal decreases roughly exponentially at large hS, while for thin seal films, it is about equal to both ϕS and ϕG. For a very thin seal, the potentials increase significantly in absolute value. The graphs are obtained by plotting the parametric solution ϕ(ϕm) versus h(ϕm) following eqs A5, A6, and A11 in the Supporting Information S2.
Equations 4 and 5 are not correct for extremely thin films (hS < LD), where the surface potentials are very different from those of the free glass and membrane surface. It is seen from Figure 2 that ϕM, ϕG, and ϕm become equal for such thin films. The physical reason for this is that the electrostatic potential gradient has characteristic length, LD, so if the film is thinner than LD the potential is unable to change significantly across the film. Indeed, the difference Δϕ between the two surface potentials decreases linearly with the decrease in hS in the limit hS/LD →0 (cf. Supporting Information S2 for derivation)
| 7 |
where the electrostatic factor γϕ is
| 8 |
For the values of the parameters cited above, γϕ = 1.47. We will use this expression when dealing with the electroosmotic creep in Section 3.1.5.
Equation 7 is approximate but perhaps predicts a qualitatively correct picture. A number of effects will significantly modify the electrostatics of very thin films, among them: charge regulation (both surface charge density and surface potential change with hS, while the chemical potentials of ions remain constant16), charge discreteness,20 effects related to the presence of lipid headgroups in the seal region such as ion expulsion and dielectric permittivity decrement, structural effects related to the state of water in film less than one nanometer thick, and so on. Because these effects can change disjoining pressure, Πel , by an order of magnitude, we will not consider Πel in this limiting case; we will only assume that its value is on the order of the van der Waals disjoining pressure.
Another significant simplification we are making is to neglect the presence of divalent ions in the seal. Divalent Ca2+ and Mg2+ ions assist the formation of the gigaseal.15,21 This is either due to their specific effect on the surface potentials of the glass and the membrane (they decrease both ϕM and ϕG, which suppresses the electrostatic repulsion in the seal) or due to the formation of salt bridges connecting a negative charge at the glass surface with a negative charge at the membrane21 (the latter obviously favors the formation of Newton black film rather than a common black film). However, double layer made of a mixture of monovalent and divalent ions has a rather complicated structure.19 In fact, the validity of the Poisson–Boltzmann and Gouy equations for double layer containing divalent ions is doubtful because divalent ions are subject of strong image and hydration forces, which these equations neglect.22 We leave aside also the question for the ion-specific effects on the adhesion,23 but KCl is expected to decrease the electrostatic disjoining pressure in the seal in comparison with NaCl at the same concentration due to the higher specific adsorption energy24 of K+. These complications are not going to change the estimated orders of magnitude in what follows, but at this level of simplification, our model is unable to account for the ever-present ion-specific effects.
2.3. Adhesion Energy in the Film
Considering first the thick film limit (hS > 4 nm), we assume that the disjoining pressure in the seal is the sum of Πel and ΠvdW according to eqs 1 and 4. The respective sum corresponds to the DLVO25,26 theory for Π. The sum of van der Waals and electrostatic energies in eqs 1 and 5 has a minimum at hS = 7 nm. This equilibrium thickness of the film (electrostatically stabilized common black film10) will correspond to relatively high conductivity and high creep rates of the seal. The respective adhesion energy σadh = −(σvdW + σel) at hS = 7 nm is 0.5 × 10⁻³ mJ/m2. The same order of σadh was obtained by Smith et al.,27 who studied the pulling of tethers in vesicles adhered to rigid substrates.
If a common black film breaks, the lipid and the glass surface will come into close contact, keeping few hydration layers of water (Newton black film will be formed10). The respective film thickness will be on the order of few angstroms. The adhesion energy is hard to predict, first because non-DLVO forces will be present (steric, hydration, and perhaps specific interactions such as hydrogen bonding between the lipid headgroups and the glass surface19,28,10), and second, because of the inapplicability of eqs 1 and 5 for very thin films.29 The adhesive van der Waals energy for hS = 0.5–1 nm thick seal film is, according to eq 1, on the order of σvdW = −0.1 to −0.2 mJ/m2. Steric and electrostatic disjoining pressure will decrease the absolute value of the total adhesion energy, σadh, so we can assume that σadh is ∼50% from −σvdW; that is, it is on the order of σadh = 0.05 mJ/m2. Justification for this assumption is given in the Supporting Information S4. Estimates for the thickness and the adhesion energies of common black and Newton black films are summarized in Table 1. The order of the values calculated here is lower than previous experimental estimates yielding σadh ≈ 1 mJ/m2 by us3 and others.30,31 The difference can be due to specific protein interactions (although Smith et al.32 found a much lower value, 10–5 mJ/m2, for the protein adhesion energy). It might be also due to an inaccurate force balance at the dome rim due to finite thickness, curvature of the membrane, and dynamic effects.
Table 1. Estimates for the Basic Characteristics of the Seal Film: Thickness, hS, Adhesion Energy, σadh, and Resistivity, Res.
2.4. Seal Conductivity
Typically,3 patches have seal resistances Res on the order of 1–100 GΩ. More specifically, for patches made of cells and liposomes in contact with 150 mM NaCl and a few millimolar CaCl2, or with 200 mM KCl and 40 mM MgCl2, we measured seal conductivities that are in the range 3–15 GΩ (with liposomes being at the higher end). These values represent the parallel combination of the pipet spanning dome and the seal. For simplicity, we will refer to seal resistance as the seal alone; that is, we neglect dome conductivity. To estimate the conductivity of the seal, we use the Stokes–Einstein relationship between the drift velocity vi of the ith ion (of charge ei and Stokes radius Ri) and the tangential electric field E in the seal33
| 9 |
ηS is seal viscosity. The corresponding ion current densities, ji, and electric current density, j = Σeiji, are
| 10 |
In the first approximation, we neglect the surface conductivity34,35 due to the double layers at both surfaces (equivalent to setting Ci(z) ≈ Ci∞). In that case, the integral current J in the seal (of cross-section 2πRchS, where Rc is the radius of the capillary) is
| 11 |
where we used E = −Δϕout/L, whereΔϕout is applied voltage and L is seal length. Because we aim only at an estimate, let us assume that both the cation and the anion have the same radius Ri. The resistance Res = −Δϕout/J is then
| 12 |
However, surface conductivity is likely to make a significant contribution to J. The expression of Res is corrected for this effect in the Supporting Information S3; the final result for Res is
| 13 |
where the factor γRes is given by
| 14 |
The equation is valid only for the case where hS > LD; for the values of the potentials above, we obtain γRes = 0.46. Taking Ri = 4 Å, ηS = 0.001 Pa·s, C = 150 mM, L = 10 μm, Rc = 1 μm, and hS = 7 nm as for a common black film, we obtain Res = 0.17 GΩ, a low value in comparison with experimental data.
Let us consider now the other limiting case, where the film is extremely thin. In this case, the double layers of the two surfaces overlap significantly, and the seal resistance is dominated by surface conductivity. We will use the result from Section 2.2 that the electrostatic potential in a very thin film is nearly constant (ϕM ≈ ϕG ≈ ϕm ≈ −70 mV; cf. Figure 2 and Supporting Information S2). Such a high negative value of ϕ in the seal zone means that the concentration of cations there will be much higher than the concentration of anions (this is the reason for the high cation-selectivity observed with typical gigaseals36); therefore, we can neglect the conductivity due to the anions. Taking the counterion concentration as C+ ≈ C exp(−eϕm/kBT) and assuming it is about constant, we can write for the local and the integral current
| 15 |
The seal resistance is
| 16 |
Using the values ϕm = −70 mV, hS = 0.5 nm, and ηS = 0.001 Pa·s, we obtain Res = 1.2 GΩ. This is about seven times higher than the resistivity of the common black film obtained from eq 13 and in much better agreement but still lower than the average experimental values, 3–15 GΩ. An even better agreement will be obtained if one accounts for the effect from the proximity of the membrane and the glass on the mobility of the ions. The seal thickness 0.5 nm is on the order of the typical diameter of a hydrated ion,33 0.8 nm, so the ions might roll over the glass surface, half-dipped into the membrane. Therefore, one must use not the water viscosity but something between the viscosity of water and of the membrane.37 To estimate the membrane’s effective viscosity, we can use the data for the diffusion coefficient of a lipid in the membrane,2D ≈ 10–12 m2/s, which is ∼10 times lower than the typical diffusion coefficient of a lipid in water38 (10–11 m2/s). From this result and Einstein–Stokes relation between D and ηS, one concludes that the membrane viscosity is about 10 times higher than that of water. Therefore, the effective viscosity felt by the ion must be between 0.001 and 0.01 Pa·s, the upper limit corresponding to Res = 12 GΩ.
The results for the resistivity again suggest that the seal is probably a Newton black film (cf. Table 1). We remind the reader that the calculations above concern lipid/water/glass seal, whereas biological membranes are much more complicated.3 We shall return to the effects of heterogeneity, polyvalent ions, and the ion-specific effects in a future paper.
3. Creep Rate of Patches
One way to explore the properties of the seal is to examine the rate at which the patch can creep up the pipet under the influence of a driving force. Creep can occur due to various driving forces: the adhesion energy σadh, sucking pressure Δp, or voltage Δϕout. In addition, the two configurations of the seal zone correspond to two different mechanisms of creep, with different friction forces, respectively. As previously discussed, the mechanism of motion depends on whether the seal film is a common black, highly fluid film of thickness ∼7 nm or is a stagnated Newton black film. In the first case, slippage is located entirely in the seal (of thickness hS) and that is where the dissipation occurs. In the second case, slippage and dissipation occur in the membrane. Mixed transport using both mechanisms is also possible.
We first investigate the case where motion occurs through a shear flow in the seal film (Section 3.1). We discuss the other possibility (shear occurs between the two monolayers of the membrane) in Section 3.2.
3.1. Creep through Motion in the Seal Zone
3.1.1. Adhesion-Driven Creep
Consider the case where the driving force of creep is membrane adhesion and there is an infinite supply of lipid available from the cell (Figure 3). The adhesion energy of the membrane at the glass pulls more membrane into the capillary. The membrane is moving with velocity vL = dL/dt, where L is the length of the seal, that is, the membrane-wetted pipet (height of the cylinder). The free energy gained from adhesion is
where Aadh = 2πRcL is the contact area between membrane and glass and Rc is the radius of the pipet. The power (work per unit time) of the energy source is therefore
| 17 |
Figure 3.
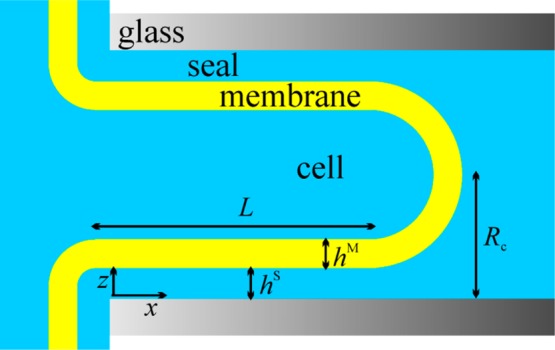
Cartoon of a “cell-attached” patch of bilayer. The cell (vesicle) is located at the left and serves as an effectively infinite supply of lipid relative to the area of the patch dome shown at the right.
In this section, we assume that this energy is dissipated mainly through hydrodynamic friction in the seal zone. The velocity profile in the seal zone is that of a simple shear flow
| 18 |
At z = 0 (the glass surface), velocity is zero, and at z = hS (the membrane outer surface), the liquid is moving with velocity vL. The corresponding local and integral dissipation rates are, respectively (cf. e.g., Batchelor39),
| 19 |
where ηS is viscosity of the seal fluid. Creep velocity, vL, can be found from the energy balance Wdiss + Wadh = 0 (e.g., de Gennes40), which yields
| 20 |
A typical creep rate for biological patches is3vL ≈ 8–16 nm/s. If one takes L ≈ 10 μm, ηS = 0.001 Pa·s as for water, hS ≈ 7 nm, and σadh = 0.5 μJ/m2 as for a common black film (Table 1), one can estimate from eq 20 that vL = 350 nm/s, two orders higher than the experimental value! In the case of Newton black film, the velocity will be even higher due to the larger value of σadh; if hS = 0.5 nm and σadh = 50 μJ/m2, then vL ≈ 2500 nm/s. This suggests either that we are using incorrect parameters (say, it is possible that ηS is orders of magnitude higher than the viscosity of water due to the proximity of the glass and the membrane) or that the mechanism of motion is different.
Note that eq 20 is a differential equation for L(t) (since vL = dL/dt), and its solution is
| 21 |
This parabolic dependence (velocity decreases with time ≈ t–1/2) is in fact a version of the well-known Lucas–Washburn law.41,42 The observed L(t) dependence for cell-attached patches seems to be quite linear3,43 rather than following the square root formula 21; in the case of cell membranes, that may reflect the influence of cytoskeletal forces normal to the membrane and their viscoelasticity. Dome bulging seems also to be a factor (cf. Section 4).
In the patch clamp technique, pipettes usually have conical shapes rather than cylindrical. The case of adhesion driven creep in conical capillary is analyzed in the Supporting Information S5. Here we cite only the final result
| 22 |
compared with eq 20. The lengths L and L0 are defined in Figure 4. The integral of this equation, the dependence of L on t, yields a transcendental equation
| 23 |
This can be compared with the inverse function of eq 21 for L, t = ηSL2/2hSσadh. We will use eq 23 for the interpretation of experimental data in Section 4.
Figure 4.

Diagram of a conical capillary.
3.1.2. Pressure-Driven Creep
Consider a vesicle or a cell-attached patch with an infinite supply of material, creeping under the action of an applied hydrostatic pressure, that is, the driving force is the pressure gradient Δp/L in the seal region. The flow is now more complex: it is superposition of the parabolic flat-channel Poiseuille flow and linear shear flow39
| 24 |
The energy that drives the process is the mechanical work done on the system. It has two components: the work done on the “liquid” in the seal (of area 2πRchS, moving with velocity, v̅x) and the work done for moving the dome patch (of area πRc2, moving with velocity, vL). Written as work per unit time, these are
| 25 |
where eq 24 was used; evidently, Wpatch ≫ Wflow. The dissipation is concentrated in the seal, and the integral dissipation rate corresponding to the velocity profile (eq 24) is given by the expression
| 26 |
Creep velocity can be found again from the energy balance, which is Wdiss + Wflow + Wpatch = 0 and which yields in first approximation (neglecting terms of the order of hS/Rc)
| 27 |
This result is similar to eq 20, with −ΔpRc/2 instead of σadh. A “typical value” for the suction factor, −ΔpRc/2, is on the order of 0.05 to 0.5 mJ/m2 (Rc = 1 μm and Δp is between −100 and −1000 Pa). A comparison between adhesion-driven creep velocity and pressure-driven creep yields an estimate of σadh, even if ηS is unknown. This is demonstrated in Section 4.
The case of pressure-driven creep in conical capillary (Figure 4) is investigated in the Supporting Information S6; the result for vL is
| 28 |
The result is similar to eq 22 for adhesion-driven creep, again with −ΔpRc/2 instead of σadh, as it was with cylindrical capillary. However, the pressure-driven creep of the patch will follow different L(t) dependence from the adhesion driven creep because Rc depends on L in the case of conical pipet, cf. Figure 4 and eq A36 in Supporting Information S5. In addition, the applied suction pressure Δp may be time-dependent; for example, it can be44 a linear function of t.
3.1.3. Creep-Driven Simultaneously by Pressure and Adhesion
In the experimental case, both adhesive force and pressure gradient are usually present. The difference compared with pressure-driven creep (investigated in Section 3.1.2) is that Wadh, eq 17, should be added in the power balance so that it reads Wadh + Wdiss + Wflow + Wpatch = 0. The respective result for the creep velocity, vL, in a cylindrical capillary is
| 29 |
Again, this can be used to estimate hS/ηS and σadh. Equation 29 suggests that if Δp = 2σadh/Rc (positive pressure, acting toward pushing the patch out of the capillary), the creep velocity will be zero. This can be used as a technique for measuring σadh by changing Δp until vL = 0. The result for the conical capillary is similar (Supporting Information S6)
| 30 |
The conical capillary has the additional advantage that Rc increases with L: Rc = (L0 + L) sin(α/2). For positive Δp, there exists a value of L such that Rc = 2σadh/Δp, at which patch dome will stand still, once again allowing for a fine determination of σadh.
3.1.4. Pressure-Driven Creep Motion of an Excised Patch
In the case of an excised patch of fixed area 2πRcLseal + Apatch (the whole patch is inside the pipet), no contribution of adhesion will be present because, in a cylindrical pipet, creep does not involve a change in the area of adhesion. Equation 29 then simplifies to
| 31 |
where vL = dL/dt (L is the position of the patch rim) and Lseal is the length of the seal (the glass surface covered by the excised membrane). Because the right-hand side of the equation is independent of L or t, the velocity vL is constant. The solution for L(t) is
| 32 |
The position L of the patch is now linear function of t.
3.1.5. Voltage-Driven Creep: Electroosmotic Smoluchowski Flow
For electrocapillary flow (flow under an applied voltage Δϕout), the Navier–Stokes equation balances viscous friction and electrostatic forces:
| 33 |
where the tangential electric field Ex = −Δϕout/L acts on the ions of bulk charge density ρe = ∑eiCi, with ion concentration profiles Ci = Ci∞ exp(−eiϕ/T) according to the Boltzmann distribution; ϕ(z) is the potential distribution in the double layer (we assume that Δϕout ≪ ϕG). The Poisson equation of electrostatics states that εS∇2ϕ = −ρe, so eq 33 yields
| 34 |
After two integrations of this equation one obtains
| 35 |
The two integration constants k0 and k1 are determined by two boundary conditions:
(i) The electric force acting at the liquid surface (Maxwell tensor εSExEz) is equal to the viscous force (Stokes tensor ηSdvx/dz):
| 36 |
which means that k1 = 0, cf. eq 35.
(ii) At the glass surface (z = 0) where the potential is ϕ = ϕG, velocity is zero and therefore from eq 35
| 37 |
With these values of k0 and k1, for the velocity profile, we obtain the well-known general result from Smoluchowski’s approach;16,34 the velocity profile of a flat flow is proportional to the double-layer potential profile
| 38 |
Note that the fluid velocity is equal to zero at all points, with z having the same potential ϕ(z) as the glass surface.
The creep velocity coincides with the velocity of the membrane (z = hS); it is obtained from eq 38 by setting ϕ = ϕM
| 39 |
where ϕM is the surface potential of the outer monolayer of the membrane. From eq 39, it follows that if the membrane has a negative charge (and potential), this does not require that the membrane moves in negative direction. Actually, there are three possibilities according to eq 39: (i) If the membrane surface potential is more negative than the glass (ϕM < ϕG), then indeed it will move toward the anode. (ii) If the membrane is more positive than the glass (ϕM > ϕG), it will move toward the cathode, even though it is negatively charged; viscous drag due to counterion movement inside the seal film is stronger than the directly acting electric force, (iii) If ϕM = ϕG, then although membrane is negatively charged, it will not move; the electric force at the surface (toward the anode) is precisely compensated by the viscous force due to counterions moving toward the cathode dragging the membrane. From eq 39, we can conclude that the membrane will stop moving at a salinity and pH at which ϕM = ϕG. For example, we found3 that patches change creep direction between pH 5 and 7, which means that at pH 5 membrane has ϕM > ϕG (membrane is more “positive” than glass), but at pH 7, the situation is reversed and ϕM < ϕG.
Equation 39 is of the same form as eqs 20 and 27, but this time the “adhesion force” resulting from the outer potential is
| 40 |
Using ε of water, ϕG – ϕM ≈ 30 mV, Δϕout ≈ 50 mV, and hS = 5 nm, one obtains “adhesion force” of ∼0.2 mJ/m2. This is of the same order as the mechanical creep.
Note that Smoluchowski’s result is valid for unperturbed double layer only,34 that is, Δϕout ≪ ϕG, while experimental Δϕout is on the same order as ϕG. This is probably the reason why eq 39 does not suggest the voltage asymmetry that was observed in patches;3 the high potential drop Δϕout disturbs the double layer. In such conditions, a nonlinear and probably asymmetric relation between vL and Δϕout will be valid instead of eq 39. Another complication34 is the possible dependences of η and ε on z, but we will not deal with that given the absence of data.
Consider now the effect of hS on the electroosmotic creep rate.39 If the film is thick (hS > LD as in the case of a common black film), ϕS and ϕM are almost independent of hS (cf. Figure 2) and so is vL according to eq 39. For a thin film (hS ≈ LD, as in the case of a Newton black film) at constant surface charge density, the potential difference ϕG – ϕM depends on seal thickness through eq 7; substituting it into eq 39 of Smoluchowski, we obtain how the electroosmotic creep velocity of the membrane depends on the seal thickness hS in the case that hS ≈ LD and surface charge densities are fixed
| 41 |
Two features are interesting. First, vL depends linearly on hS (no electroosmotic creep if hS = 0). Second, there is a multiplying effect of the “film thinness” on the potential difference; the creep velocity is very sensitive to small differences between the potential of the (freestanding) membrane and the glass surface. (Notice the difference of exponents in eq 8 for γϕ instead of the Smoluchowski formula, which is linear with respect to ϕG – ϕM.) This suggests that if one could control ϕG, one could create a very fine method for the determination of the surface potential of a cell by varying ϕG until the patch ceases to creep.
3.2. Creep with Flow in the Lipid Bilayer
Consider the other limiting case of a cell- or vesicle-attached patch where the relevant flow occurs in the membrane itself (in contrast with Section 3.1, where dissipation was located entirely into the seal fluid). We assume at first that the pipet is cylindrical and we seek the velocity profile vxM(z) in the membrane and vx(z) in the cell. The outer monolayer sticks to the glass, while the inner monolayer moves across the outer. The boundary conditions for such problem are, at first glance
| 42 |
where z = 0 is positioned at the outer wall of the membrane (considered fixed by the adjacent glass). This would be the simple shear flow with a profile vxM = vLz/hM. There is a conceptual difficulty with these boundary conditions, however−the flow vx = vLz/hM will have total discharge of lipid material QM of
| 43 |
This amount of lipid is insufficient to coat the newly wetted pipet near the patch rim with 2πRcvL square meters of bilayer per second because the volume of lipid needed is obviously
| 44 |
that is, two times larger than eq 43. If the real discharge is smaller than the one given by eq 44, the flow will accumulate elastic strain in the dome region (through dilution of the lipid adsorption in the two monolayers), which will bring along a restoring Marangoni effect that will immediately “draw” the missing lipid from the adhered membrane toward the patch. There are two ways, at least, to compensate for the difference between the discharge (eq 44) needed to supply the lipid for the newly formed surface and the simple shear discharge (eq 43):
(i) The membrane can set the seal boundary into motion, until both its walls move with the same velocity, vL, through Marangoni effect at the outer monolayer of the membrane. This case will coincide with the models in Section 3.1.
(ii) If the outer monolayer sticks tightly to the glass, the Marangoni flow will occur at the inner monolayer (the membrane–cell interface), which will result in the geometry of the flow in the membrane and in the cell shown in Figure 5. The flow in the cell will be a superposition of the simple homogeneous flow, vxC = 2vL, and a backward Poiseuille flow. In this way, the inner membrane wall can move with velocity, vx = 2vL, while the outer monolayer stays immobile.45,46 Additionally, in the rim region there must exist a mechanism of transfer of lipid from the inner monolayer to the outer.
Figure 5.

Diagram of the flow in the case of shear flow with dissipation in the membrane. The outer monolayer is fixed to the glass (the seal is a Newton black film), while the inner monolayer moves with velocity 2vL. The lipid transported from the inner monolayer flip-flops in the region of the patch dome. The membrane flow excites Marangoni flow in the intracellular fluid, resulting in the profile shown (see eq 46).
We will now consider the second possibility in more detail for various driving forces. The membrane consists of two plates of lipids, the outer one immovably bound to the pipet surface and the inner one moving with velocity 2vL. Instead of the boundary conditions (eq 42), we assume that (using cylindrical coordinates this time)
| 45 |
This choice of the velocity vxM means that the shortage of lipid due to the difference between the discharges in eqs 44 and 43 soon creates a strong gradient ∇σM in the inner monolayer (through a gradient of the surface density ∇Γ of lipid), yielding an additional flow of surfactant toward the patch. We assume that the lipid transfer is located entirely at the inner monolayer. Such mechanism requires two other processes to occur simultaneously. First, transfer of lipid from the inner monolayer to the outer one at the patch rim and the dome by, for example, a flip-flop mechanism, and second, if the inner monolayer moves with velocity 2vL, then it sets into motion the adjacent cell fluid and the additional quantity of transported liquid must have a path back through the center of the pipet (cf. Figure 5). This happens in the following sequence of events: (i) Marangoni effect transports cytoplasmic fluid toward the patch; (ii) this strains the membrane and yields an increased pressure in the cell right next to the patch dome; and (iii) this increased pressure yields a backward restoring Poiseuille flow. The velocity profiles corresponding to this mechanism are vx = 2vL(Rc – r)/hM in the membrane and
| 46 |
Here ΔpC is the pressure rise due to the strained patch; small terms of the order of hM/Rc are neglected in these equations. The total discharge of lipid through the membrane is now correct (eq 44). The total discharge of cytoplasmic fluid must be πRc2vL. We can calculate the cytoplasmic discharge by integrating eq 46 over the cell region, which yields the balance
| 47 |
This balance determines the sought pressure rise ΔpC
| 48 |
The rise of the pressure is very small; if ηC = 0.001 Pa·s and vL = 10 nm/s, then ΔpC = 5 × 10⁻⁴ Pa is enough to restore the increased discharge of cytoplasmic fluid to the correct value πRc2vL. We can calculate now the velocity of the fluid at r = 0 by substituting eq 48 into eq 46. The result is vxC(r = 0) = 0; that is, the fluid in the pipet axis is immobile (cf. Figure 5). The Poiseuille flow induced by the Marangoni effect is not really important for the dissipation; the dissipation rate in the cytoplasmic fluid corresponding to the velocity profile (eq 46) is
| 49 |
while the dissipation in the membrane is
| 50 |
which is higher by many orders of magnitude compared with WdissC according to eq 49.
The viscous tensors acting on both sides of the inner monolayer of the membrane are given by
| 51 |
The first force is higher than the second by a factor of Rc/hM; that is, the viscous force due to the intracellular fluid motion can be neglected in the force balance at the inner wall of the membrane. The mechanical balance at the inner monolayer equates the tangential Marangoni gradient ∇σM to the friction forces (eq 51)
| 52 |
From here, the tension drop from the edge of the pipet to the patch rim follows
| 53 |
where we used the value ηM = 0.01 Pa·s (which follows from the value2 of D = 10–12 m2/s; see above). As seen, the Marangoni increase in σM needed to produce the increased velocity vxM(r = Rc– hM) = 2vL is rather small. The difference ΔσM is due to a slight decrease in the surface density Γ in the patch region, accumulated in the initial period of the creep (when the discharge is closer to eq 43). The shortage of lipid ΔΓ is related to ΔσM through the Gibbs elasticity, EG:
| 54 |
The value was calculated by assuming the order EG ≈ 100 mJ/m2. Thus, a decrease in the lipid adsorption by 0.0005% in the patch is enough to produce a very significant Marangoni flow of the inner monolayer of the membrane.
Let us investigate another point here. There are generally two mechanisms of transfer of surfactant tangentially to the membrane. First, the main convective flux 2vLΓ, and second, a smaller diffusive flux due to ΔΓ. The latter is given approximately by DΔΓ/L; the ratio between the two fluxes is DΔΓ/2vLΓL ≈ 10–5. That is, the diffusive flux is negligible compared with the convective, which confirm the applicability of the approximations made in our derivation. A more intricate question is whether a bilayer can be modeled as a continual Newtonian liquid, and what precisely is the meaning of the quantity ηM. To avoid complications, we simply consider ηM to be an effective characteristic of the adhesion force between the two bilayers of the membrane. According to Amontons’ laws of friction, the larger this adhesion, the harder the slippage between the two monolayers and the higher the effective viscosity ηM.
The dissipation rate (eq 50) in the membrane determines the creep velocity; depending on the driving force, we can derive various expressions for vL, analogously to those in Section 3.1. For example, for adhesion-driven creep where the power of the driving force is given by eq 17, from the balance Wdiss + Wadh = 0 we get
| 55 |
Inserting the values ηM = 0.01 Pa·s, L = 10 μm, hM = 4 nm, and vL = 10 nm/s, we obtain σadh = 0.001 mJ/m2. Compared with our Laplace-type calculations that give3 for the adhesion energy σadh = 1 mJ/m2, this value is small. It is, however, in acceptable agreement with the estimated order of the adhesion energy in Section 2.3.
Equation 55 is easily generalized to the case of conical capillary by analogy to the derivation of eq 22
| 56 |
Formally, it differs from eq 22 for dissipation occurring in the seal only with the factor of 1/4. The same factor appears in the expression for the pressure-driven creep velocity
| 57 |
The final element of the considered mechanism of creep motion is the flip-flop transfer of the lipid molecules from the inner monolayer of the membrane to the outer one in the region of the patch dome. The influx of lipid through the inner membrane is QM = 2πRchMvL. Half of it, πRchMvL, must be transferred to the outer wall. The driving force for this transfer is the strain of the outer monolayer. In the initial period of the creep, the outer wall of the patch accumulates shortage of lipid, resulting in increased interfacial tension. The difference Δσ⊥M in the tension of the two monolayers is inducing a flip-flop transfer. Assuming that the flip-flop flux is linear function of Δσ⊥, we can write
| 58 |
where jflip-flop [m/s] is the transverse volumic flux of surfactant across the membrane, ΔΓ⊥ is the respective difference of the surface concentrations, and Res⊥ is the friction coefficient for flip-flop motion. The total flip-flop flux must be
| 59 |
Assuming for simplicity that the dome is a hemisphere (which is not always correct47) so that Apatch = 2πRc2, we get for the flux, jflip-flop , the value hMvL/2Rc ≈ 2 × 10–11 m/s. If the molecular volume is Vm ≈ 1 nm3 and the area per molecule is 1/Γ ≈ 1 nm2, then a lipid molecule at the inner monolayer of the dome flip-flops once in τ = VmΓ/jflip-flop ≈ 100 s on the average.
Unfortunately, we cannot yet estimate the values of the driving force Δσ⊥M and the resistivity Res⊥, because both are unknown. The knowledge of the value of both parameters is required for estimating the local and the total dissipation rates, wflip-flop and Wflip-flop, related to flip-flopping process; these are given by the expressions
| 60 |
where we used eqs 58 and 59 and the relation Apatch = 2πRc2 (valid for hemispherical dome only) as well as the assumption that the adsorptions, Γ, in the inner and the outer monolayers are not too different (ΔΓ⊥ ≪ Γ). If Res⊥ (and, respectively, Δσ⊥M) is very large, the order of Wflip-flop will be comparable to Wdiss so that the dissipation due to flip-flopping must be accounted for in the energetic balance. Wflip-flop is smaller than WdissM when Δσ⊥M < 8ΓVmηMLvL/(hM)2; for the expected order of the magnitude of the involved parameters, this inequality yields Δσ⊥M < 0.1 mN/m. The following argument can be given for the validity of this inequality. If Δσ⊥M ≈ 0.1 mN/m, it will be comparable to the order of magnitude of the adhesion energy; in such case, the adhesion will probably be unable to hold the outer monolayer against the Marangoni effect and it will creep until Δσ⊥M is relaxed, that is, until Δσ⊥M ≪ σadh. Nevertheless, from the inequality above, it follows that it is possible that at certain geometry of the patch (small L, large Rc) Wflip-flop and Wdiss are comparable, which can be used for the experimental determination of the flip-flop resistance coefficient, Res⊥. As a simple example, in the limiting case where Wflip-flop ≫ WdissM, the adhesion-driven creep velocity will be determined by the balance between Wflip-flop and Wadh, eq 17, which yields
| 61 |
Thus, in the case where the flip-flop controls the dissipation and the dome remains a hemisphere during creep, the adhesion-driven creep velocity is a constant reversely proportional to Res⊥. An additional point here is that flip-flopping dissipation may be stronger in the excised patch configuration. It was recently reported47 that the difference Δσ⊥M between the tensions of the two monolayers of a liposome patch is significantly increased in the excised patch configuration (up to 30% of the monolayer tension!) compared with the cell-attached configuration. Flip-flopping may allow Δσ⊥M to relax to a much lower value; nevertheless, the result is indicating that lipid-flipping should occur at a higher rate and with higher dissipation in excised patches. The question for the flip-flopping dissipation will be studied in more detail in future.
4. Comparison with Experiment
We analyzed data for pressure-driven creep of several patches of different composition based on liposomes made of azolectin: (i) pure azolectin liposomes (Azo 100%); (ii) azolectin liposomes made of 70 wt % azolectin and 30% cholesterol (Azo 70%+Chol 30%); (iii) azolectin liposomes with incorporated mechanosensitive channels of small conductivity (MscS), in weight ratio 1:100 azolectin/protein; and (iv) azolectin liposomes with incorporated two types of mechanosensitive channels of small and of large conductance (MscL+MscS) in weight ratio 1:10:1000 MscL/MscS/Azo. The bath and pipet recording solution consisted of 200 mM KCl, 40 mM MgCl2, and 5 mM Hepes (pH 7.2 adjusted with KOH). WT-MscL-GST and WT-MscS-His6 were prepared according to published procedures.48,49 MscS or MscS and MscL were incorporated into liposomes using either a dehydration/rehydration48 (D/R) or sucrose50 reconstitution method (Supporting Information S7).
Pipettes used were cones with L0 = 10 μm and α = 10° (cf. Figure 4). All measurements were done at 24–26 °C. Details of the experimental procedure are given in the Supporting Information S7 and in ref (44). During the creep experiment, the suction pressure Δp was increased linearly with time, Δp = ptt, until the lytic pressure was reached, at which the membrane broke (cf. the supporting information of ref (44)). Pressure Δp and displacement (defined as ΔL = L(t) – L(0), where L(0) was on the order of 5–15 μm) were monitored as a function of time (cf. Supporting Information S7, Figure S3).
In the initial period of the experiment, creep motion was accompanied by bloating of the dome as new intracellular fluid and lipid were drawn into the dome (cf. Supporting Information S7, Figure S4). We take into account only data where the dome has relaxed to a stationary shape. From the data for the displacement, ΔL, as a function of time, the creep velocity was determined through numerical differentiation using the quadratic interpolating polynomial formula
| 62 |
where indices i–1, i, and i+1 refer to three subsequent measurements.
We first assumed that the dissipation is concentrated in the seal region. We represented eq 28 in the form
| 63 |
On the right-hand side of this equation, there are only known quantities; this allows the determination of ηS/hS. Ideally, the calculated ratio ηS/hS should be independent of time and pressure. However, because of the dome bulging in the initial moments of the experiment, ηS/hS is an apparent function of Δp and it relaxes to a constant value only after a relaxation time of several seconds, as illustrated in Figure 6 and in the Supporting Information S7. We calculated the relaxed value ηS/hS for all four membranes (Azo 100%, Azo 70%+Chol 30%, MscS, and MscS+MscL) using several runs for each membrane. The deviation from the average is reasonably small. The results are given in Table 2. Assuming first that the seal thickness corresponds to a common black film in equilibrium, hS ≈ 7 nm (cf. Section 2.3), we obtain a viscosity on the order of 10–20 Pa·s, which is four orders of magnitude higher than the viscosity of water. Such a high value in a relatively thick film is hard to explain. Viscosity of 10–20 Pa·s will yield also too high resistivity; from eq 13, one can estimate that Res would be on the order of 2000–4000 GΩ, which is incompatible with the experiment.
Figure 6.
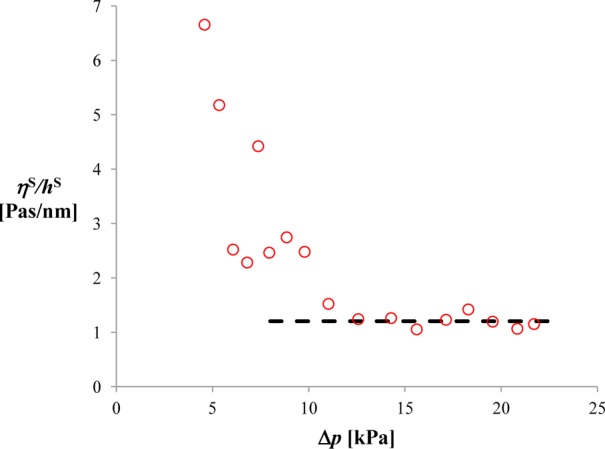
Ratio ηS/hS, calculated from eq 63 versus Δp. In the initial period of the experiment, the apparent value of ηS/hS decreases steeply until it reaches a constant value, due to the bulging of the dome (cf. also the Supporting Information S7). Data for a liposome with incorporated MscS.
Table 2. Value of Ratios ηS/hS and ηM/hM Calculated from Pressure-Driven Creep Velocity Data for Four Different Compositions of the Membrane.
We therefore turn to the other possible mechanism, where the creep motion occurs through flow in the membrane so that eq 57 is correct. Obviously, the result for ηM/hM is precisely four times smaller than the one for ηS/hS from eq 63. Because the thickness of the membrane is known,∼4 nm, we can calculate the effective membrane viscosity (Table 2). The results ranges from 1 to 3 Pa·s, which is about two orders higher than the value predicted through Stokes–Einstein relationship from the diffusive coefficient (0.01 Pa·s). This may be partly due to the fact that the geometrical factor 6π in the equation of Stokes–Einstein is smaller for 2-D diffusion.37 (If DM = kBT/gηMR in the membrane and D = kBT/6πηR in water, we obtain ηM ≈ 6πηD/gDM; if g is smaller than 6π, then ηM > 0.01 Pa·s.) In general, one must not expect that our “effective viscosity”, ηM, which is a measure of the friction between the two monolayers upon slip, has a value similar to the viscosity following from the equation of Stokes–Einstein for the lateral diffusion in the membrane.
The membrane viscosity obtained in Table 2 shows an interesting and expected correlation to the lytic pressure; the more “viscous” the membrane (more precisely, the larger the adhesion between the two monolayers; cf. the discussion below eq 54), the larger the lytic pressure (i.e., the membrane is more robust). The correlation is illustrated in Figure 7. The data demonstrate that the addition of cholesterol to the azolectin liposome makes it less robust, decreasing both lytic pressure and ηM. The presence of proteins has a more complex effect. The addition of MscS has a similar but stronger effect compared with cholesterol: the membrane containing MscS is of decreased lytic pressure and is even more mobile than Azo 70%+Chol 30%. However, the addition of MscL to a bilayer already containing MscS does not change the lytic pressure, yet it decreases the mobility of the membrane. The contrasting effects of the two proteins on ηM can be explained with their structure. There is a prevalence51 of polar and positively charged amino groups in the loop region of MscL, which are probably interacting with the negatively charged glass wall. Therefore, MscL remains electrostatically attached to the glass and serves as an obstacle for the slippage between the two monolayers of the membrane, slowing the creep (without affecting significantly lytic pressure). On the opposite, the relevant amino acid residues of MscS are polar and negatively charged,52 so that it is repelled by the glass; thus, this protein unsticks the membrane from the glass, making the patch more mobile.
Figure 7.
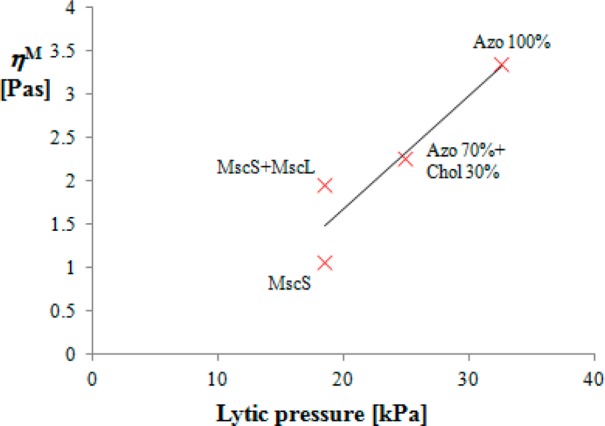
Correlation between membrane viscosities calculated from pressure-driven creep velocities and lytic pressures of the bilayers in Table 2.
The knowledge of the friction coefficient ηS/hS (or equivalently, ηM/hM) allows us to determine the adhesion energy from data for the adhesion driven creep from the supporting information of ref (44). We use eq 23 in the form
| 64 |
where t0 is added because the initial moment of contact between the pipet and the cell is unknown. The creep data for MscS+MscL are given in Figure 8 in the appropriate coordinates, t versus (1 + L/L0)2 ln(1 + L/L0) – L2/2L02 – L/L0. The line is a fit, and from its slope we calculated the quantity ηS/hSσadh = 1.20 × 10¹³ s/m2. Since ηS/hS is already known from the pressure-driven creep data, ηS/hS = 1.96 Pa·s/nm (cf. Table 2); from the known value of ηS/hSσadh, we can determine the adhesion energy: σadh = 0.16 ± 0.02 mJ/m2. The same result will be obtained if the flow is in the membrane, because changing ηS/hS to 4ηM/hM does not alter the final result for σadh. This is due to the fact that we determine σadh by comparing the creep velocities of adhesion-driven and pressure-driven creep. The nature of the friction force is unimportant for this comparison as far as it is the same for both driving forces. The obtained value for σadh is in good agreement with the estimation of the adhesion energy of the seal when it is a Newton black film (cf. Table 1).
Figure 8.
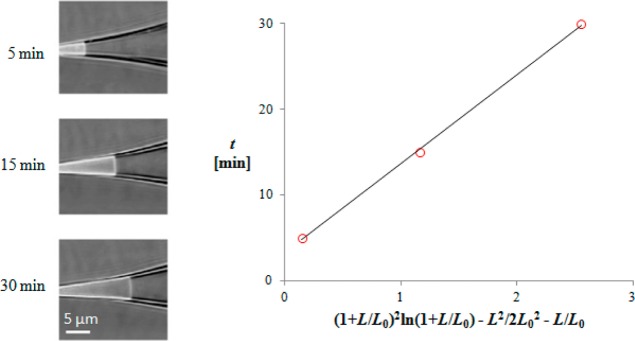
Adhesion-driven creep: the dependence of time t versus (1 + L/L0)2 ln(1 + L/L0) – L2/2L02 – L/L0, cf. eq 64. From the slope, the adhesion energy was determined: σadh = 0.16 mJ/m2. The spontaneous creeping of the MscS+MscL patch is evident in the images on the left (which are adapted and modified from ref (44)).
5. Conclusions
The two possible mechanisms of creep motion depend on whether the seal forms a Newton black film (i.e., membrane is in molecular contact with the glass) or it remains electrostatically stabilized common black film.
The assumption for common black film yields: (i) Seal of large thickness (7 nm) and very low adhesion energy (0.5 μJ/m2) according to DLVO theory, Table 1. (ii) The large seal thickness goes with resistance 0.2 GΩ (Table 1), much lower than the experimental one. (iii) The mechanism of creep motion occurs through dissipation in the seal zone. The thick seal film provides little friction, and the calculated creep velocity is larger than the experimentally observed value.
The assumption for a Newton black film (membrane sticks to the glass) yields: (i) Seal is a few angstroms thick (∼5 Å) and adhesion energy is on the order of 0.5 mJ/m2, Table 1. (ii) The small hS brings high resistance (1.2–12 GΩ, Table 1), in agreement with the experimentally observed one. (iii) The mechanism of creep motion occurs through dissipation inside the membrane and involves Marangoni flow at the inner monolayer of the membrane and flip-flop transfer of lipid at the patch dome. The creep velocity is determined by the effective viscosity ηM of the membrane (which is, in fact, a characteristic of the strength of adhesion between the two monolayers).
The analysis of the creep data points to the fact that the second hypothesis is far more plausible. The creep data allow us to determine the effective viscosity ηM (∼1 Pa·s, as it follows from pressure-driven creep data) and the adhesion energy of the bilayer to the glass (σadh ≈ 0.2 mJ/m2, as it follows from the adhesion-driven creep data) for azolectin-based liposomes. In general, the values of the adhesion energy reported in the literature vary by many orders of magnitude (Table 1), which may reflect neglected dynamic effects at the dome rim (e.g., Young balance at the dome rim may involve significant dynamic contributions40), finite thickness, or curvature effects. The value 0.2 mJ/m2 obtained by our method from creep data compares well with the theoretical estimation for the van der Waals energy of a Newton black film.
Acknowledgments
R.S. is grateful to FP7 project BeyondEverest. We acknowledge an NIH grant to F.S. and a National Health and Medical Research Council Fellowship to B.M. We also thank Navid Bavi and Dr Charles D. Cox for their comments.
Supporting Information Available
S1. List of symbols and abbreviations. S2. Electrostatics of the seal zone. S3. Effect of surface conductivity on seal resistivity. S4. Ratio between van der Waals attractive energy and the energy of the repulsive interactions in equilibrium thin films. S5. Adhesion-driven creep in conical capillary. S6. Pressure-driven creep rate in conical capillary. S7. Experimental data for pressure-driven creep. This material is available free of charge via the Internet at http://pubs.acs.org.
The authors declare no competing financial interest.
Funding Statement
National Institutes of Health, United States
Supplementary Material
References
- Hamill O. P.; Marty A.; Neher E.; Sakmann B.; Sigworth F. J. Improved patch-clamp techniques for high-resolution current recording from cells and cell-free membrane patches. Pfluegers Arch. 1981, 391, 85–100. [DOI] [PubMed] [Google Scholar]
- Bae C.; Markin V. S.; Suchyna T. M.; Sachs F. Modeling ion channels in the gigaseal. Biophys. J. 2011, 101, 2645–2651. [DOI] [PMC free article] [PubMed] [Google Scholar]
- Suchyna T. M.; Markin V. S.; Sachs F. Biophysics and structure of the patch and the gigaseal. Biophys. J. 2009, 97, 738–747. [DOI] [PMC free article] [PubMed] [Google Scholar]
- Parsegian A.Van der Waals Forces: A Handbook for Biologists, Engineers and Physicists; Cambridge University Press: Cambridge, U.K., 2006. [Google Scholar]
- Ruknudin A.; Song M. J.; Sachs F. The ultrastructure of patch-clamped membranes: a study using high voltage electron microscopy. J. Cell Biol. 1991, 112, 125–134. [DOI] [PMC free article] [PubMed] [Google Scholar]
- McEwen B. F.; Song M. J.; Ruknudin A.; Barnard D. P.; Frank J.; Sachs F.. Tomographic Three Dimensional Reconstruction of Patch Clamped Membranes Imaged with the High Voltage Electron Microscope. In Proceedings of the XIIth International Congress of Electron Microscopy, Seattle, WA, 12–18 August 1990; Peachey L. D., Williams D. B., Eds.; San Francisco Press: San Francisco, 1990; pp 522–523.. [Google Scholar]
- Casiraghi A.; Di Grigoli M.; Cilurzo F.; Gennari C. G. M.; Rossoni G.; Minghetti P. The influence of the polar head and the hydrophobic chain on the skin penetration enhancement effect of poly(ethylene glycol) derivatives. AAPS PharmSciTech 2012, 13, 247–253. [DOI] [PMC free article] [PubMed] [Google Scholar]
- Cilurzo F.; Gennari C. G. M.; Minghetti P. Adhesive properties: a critical issue in transdermal patch development. Expert Opin. Drug Delivery 2012, 9, 33–45. [DOI] [PubMed] [Google Scholar]
- Minghetti Y.; Cilurzo F.; Tosi L.; Casiraghi A.; Montanari L. Design of a new water-soluble pressure-sensitive adhesive for patch preparation. AAPS PharmSciTech 2003, 4, 53–61. [DOI] [PMC free article] [PubMed] [Google Scholar]
- Exerowa D.; Kruglyakov P. M.. Foam and Foam Films. Theory, Experiment, Application; Elsevier: New York, 1998. [Google Scholar]
- Nir S.; Vassilieff C. S.. Van der Waals Interactions in Thin Films. In Thin Liquid Films; Ivanov I. B., Dekker M., Eds.; New York, 1988; p 207. [Google Scholar]
- Israelachvili J. N.Intermolecular and Surface Forces, 3rd ed.; Academic Press: Amsterdam, 2011; section 13. [Google Scholar]
- Rawicz W.; Smith B. A.; McIntosh T. J.; Simon S. A.; Evans E. Elasticity, strength, and water permeability of bilayers that contain raft microdomain-forming lipids. Biophys. J. 2008, 94, 4725–4736. [DOI] [PMC free article] [PubMed] [Google Scholar]
- McLaughlin S. The electrostatic properties of membranes. Annu. Rev. Biophys. Biophys. Chem. 1989, 18, 113–136. [DOI] [PubMed] [Google Scholar]
- Priel A.; Gil Z.; Moy V. T.; Magleby K. L.; Silberberg S. D. Ionic requirements for membrane-glass adhesion and giga seal formation in patch-clamp recording. Biophys. J. 2007, 92, 3893–3900. [DOI] [PMC free article] [PubMed] [Google Scholar]
- Overbeek J. T. G. In Colloid Science, Kruyt H. R., Ed.; Elsevier: Amsterdam, 1952; Vol. 1. [Google Scholar]
- Zhang P. C.; Keleshian A. K.; Sachs F. Voltage induced membrane movement. Nature 2001, 413, 428–431. [DOI] [PubMed] [Google Scholar]
- Murray D.; Arbuzova A.; Hangyas-Mihalyne G.; Gambhir A.; Ben-Tal N.; Honig B.; McLaughlin S. Electrostatic properties of membranes containing acidic lipids and adsorbed basic peptides: theory and experiment. Biophys. J. 1999, 77, 3176–3188. [DOI] [PMC free article] [PubMed] [Google Scholar]
- Derjaguin B. V.Theory of Stability of Colloids and Thin Films; Nauka: Moscow, 1986. (in Russian). [Google Scholar]
- Levine S.; Robinson K.; Bell G. M.; Mingins J. The discreteness-of-charge effect at charged aqueous interfaces: I. General theory for single adsorbed ion species. J. Electroanal. Chem. 1972, 38, 253–269. [Google Scholar]
- Corey D.; Stevens C.. Science, And Technology of Patch Recording Electrodes. In Single-Channel Recording; Sakmann B., Neher E., Eds.; Plenum Press: New York, 1983; pp 53–68. [Google Scholar]
- Slavchov R. I.; Novev J. K.; Peshkova T. V.; Grozev N. A. Surface tension and surface Δχ-potential of concentrated Z+:Z– electrolyte solutions. J. Colloid Interface Sci. 2013, 403, 113–126. [DOI] [PubMed] [Google Scholar]
- Snyder K. V.; Kreigstein A.; Sachs F. A convenient electrode holder for glass pipettes to stabilize electrode potentials. Eur. J. Physiol. 1999, 438, 405–411. [DOI] [PubMed] [Google Scholar]
- Ivanov I. B.; Slavchov R. I.; Basheva E. S.; Sidzhakova D.; Karakashev S. I. Hofmeister effect on micellization, thin films and emulsion stability. Adv. Colloid Interface Sci. 2011, 168, 93–104. [DOI] [PubMed] [Google Scholar]
- Derjaguin B.; Landau L. Theory of the stability of strongly charged lyophobic sols and of the adhesion of strongly charged particles in solutions of electrolytes. Acta Physicochim. URSS 1941, 14, 633–662. [Google Scholar]
- Verwey E. J. W.; Overbeek J. T. G.. Theory of the stability of lyophobic colloids; Elsevier: Amsterdam, 1948. [Google Scholar]
- Smith A. S.; Sackmann E.; Seifert U. Pulling tethers from adhered vesicles. Phys. Rev. Lett. 2004, 92, 208101. [DOI] [PubMed] [Google Scholar]
- Kralchevsky P. A.; Danov K. D.; Basheva E. S. Hydration force due to the reduced screening of the electrostatic repulsion in few-nanometer-thick films. Curr. Opin. Colloid Interface Sci. 2011, 16, 517–524. [Google Scholar]
- Kralchevsky P. A.; Nagayama K.. Particles at fluid interfaces and membranes, 1st ed.; Elsevier: Amsterdam, 2001. [Google Scholar]
- Opsahl L. R.; Webb W. W. Lipid-glass adhesion in giga-sealed patch-clamped membranes. Biophys. J. 1994, 66, 75–79. [DOI] [PMC free article] [PubMed] [Google Scholar]
- Ursell T.; Agrawal A.; Phillips R. Lipid bilayer mechanics in a pipette with glass-bilayer adhesion. Biophys. J. 2011, 101, 1913–1920. [DOI] [PMC free article] [PubMed] [Google Scholar]
- Smith A. S.; Lorz B. G.; Sackmann E. Force-controlled equilibria of specific vesicle-substrate adhesion. Biophys. J. 2006, 90, L52–L54. [DOI] [PMC free article] [PubMed] [Google Scholar]
- Robinson R. A.; Stokes R. H.. Electrolyte Solutions; Butterworths Scientific Publications: London, 1959. [Google Scholar]
- Dukhin S. S.Electrical Conductivity and Electrokinetic Properties of Disperse Systems; Naukova dumka: Kiev, Ukraine, 1975. (in Russian). [Google Scholar]
- Dukhin S. S.; Shilov V. N.. Dielectric Phenomena and Double Layer in Disperse Systems and Polyelectrolytes; Naukova dumka: Kiev, 1972. (in Russian), Chapter 2. [Google Scholar]
- Sachs F.; Feng Q. Gated, ion selective channels observed with patch pipettes in the absence of membranes: novel properties of the gigaseal. Biophys. J. 1993, 65, 1101–1107. [DOI] [PMC free article] [PubMed] [Google Scholar]
- Radoev B. P.; Nedjalkov M.; Djakovich V. Brownian motion at liquid-gas interfaces. 1. Diffusion coefficients of macroparticles at pure interfaces. Langmuir 1992, 8, 2962–2965. [Google Scholar]
- Gaede H. C.; Gawrisch K. Lateral diffusion rates of lipid, water, and a hydrophobic drug in a multilamellar liposome. Biophys. J. 2003, 85, 1734–1740. [DOI] [PMC free article] [PubMed] [Google Scholar]
- Batchelor G. K.An Introduction to Fluid Dynamics; Cambridge University Press: Cambridge, U.K., 2000. [Google Scholar]
- de Gennes P.-G. Wetting: statics and dynamics. Rev. Mod. Phys. 1985, 57, 827–863. [Google Scholar]
- Lucas R. Rate of capillary ascension of liquids. Kolloid-Z. 1918, 23, 15–22. [Google Scholar]
- Washburn E. The dynamics of capillary flow. Phys. Rev. 1921, 17, 374–375. [Google Scholar]
- Meng F.; Sachs F. Orientation-based FRET sensor for real-time imaging of cellular forces. J. Cell Sci. 2011, 125, 743–750. [DOI] [PMC free article] [PubMed] [Google Scholar]
- Nomura T.; Cranfield C. G.; Deplazes E.; Owen D. M.; Macmillan A.; Battle A. R.; Constantine M.; Sokabe M.; Martinac B. Differential effects of lipids and lyso-lipids on the mechanosensitivity of the mechanosensitive channels MscL and MscS. Proc. Natl. Acad. Sci. U.S.A. 2012, 109, 8770–8775. [DOI] [PMC free article] [PubMed] [Google Scholar]
- Yeung A.Mechanics of Intermonolayer Coupling in Fluid Surfactant Bilayers. Ph.D. Physics, Univ. British Columbia, 1994. [Google Scholar]
- Evans E.; Yeung A. Hidden dynamics in rapid changes of bilayer shape. Chem. Phys. Lipids 1994, 73, 39–56. [Google Scholar]
- Bavi N.; Nakayama Y.; Bavi O.; Cox C. D.; Qin Q. H.; Martinac B. Biophysical implications of lipid bilayer rheometry for mechanosensitive channels. Proc. Natl. Acad. Sci. U.S.A. 2014, 111, 13864–13869. [DOI] [PMC free article] [PubMed] [Google Scholar]
- Häse C. C.; Le Dain A. C.; Martinac B. Purification and functional reconstitution of the recombinant large mechanosensitive ion channel (MscL) of Escherichia coli. J. Biol. Chem. 1995, 270, 18329–18334. [DOI] [PubMed] [Google Scholar]
- Vásquez V.; Cortes D. M.; Furukawa H.; Perozo E. An optimized purification and reconstitution method for the MscS channel: Strategies for spectroscopical analysis. Biochemistry 2007, 46, 6766–6773. [DOI] [PubMed] [Google Scholar]
- Battle A. R.; Petrov E.; Pal P.; Martinac B. Rapid and improved reconstitution of bacterial mechanosensitive ion channel proteins MscS and MscL into liposomes using a modified sucrose method. FEBS Lett. 2009, 583, 407–412. [DOI] [PubMed] [Google Scholar]
- Oakley A. J.; Martinac B.; Wilce M. C. J. Structure and function of the bacterial mechanosensitive channel of large conductance. Protein Sci. 1999, 8, 1915–1921. [DOI] [PMC free article] [PubMed] [Google Scholar]
- Petrov E.; Palanivelu D.; Constantine M.; Rohde P. R.; Cox C. D.; Nomura T.; Minor D. L.; Martinac B. Patch-clamp characterization of the MscS-like mechanosensitive channel from silicibacter pomeroyi. Biophys. J. 2013, 104, 1426–1434. [DOI] [PMC free article] [PubMed] [Google Scholar]
Associated Data
This section collects any data citations, data availability statements, or supplementary materials included in this article.