

Abstract
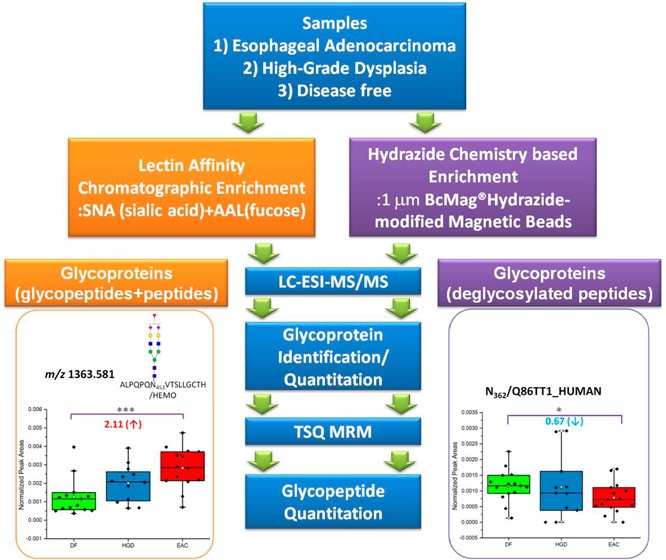
Changes in glycosylation have been shown to have a profound correlation with development/malignancy in many cancer types. Currently, two major enrichment techniques have been widely applied in glycoproteomics, namely, lectin affinity chromatography (LAC)-based and hydrazide chemistry (HC)-based enrichments. Here we report the LC–MS/MS quantitative analyses of human blood serum glycoproteins and glycopeptides associated with esophageal diseases by LAC- and HC-based enrichment. The separate and complementary qualitative and quantitative data analyses of protein glycosylation were performed using both enrichment techniques. Chemometric and statistical evaluations, PCA plots, or ANOVA test, respectively, were employed to determine and confirm candidate cancer-associated glycoprotein/glycopeptide biomarkers. Out of 139, 59 common glycoproteins (42% overlap) were observed in both enrichment techniques. This overlap is very similar to previously published studies. The quantitation and evaluation of significantly changed glycoproteins/glycopeptides are complementary between LAC and HC enrichments. LC–ESI–MS/MS analyses indicated that 7 glycoproteins enriched by LAC and 11 glycoproteins enriched by HC showed significantly different abundances between disease-free and disease cohorts. Multiple reaction monitoring quantitation resulted in 13 glycopeptides by LAC enrichment and 10 glycosylation sites by HC enrichment to be statistically different among disease cohorts.
Introduction
Altered glycosylation has been reported in many cancer types,1−3 indicating its profound correlation with carcinogenesis. Protein glycosylation is one of the most prevalent post-translational modifications (PTMs) with >50% of human proteins glycosylated. There are two major types of glycosylation: N-linked and O-linked glycosylations. N-linked glycosylation involves the attachment of glycan residues to an asparagine residue with an NXS/T motif, where X is any amino acid except proline. O-linked glycosylation involves serine or threonine residues, to which glycan structures are chemically attached. The biosynthesis of such glycosylations is regulated by the presence/expression of glycosyltransferases/glycosidases and the availability of substrate glycans.2,3 Glycosylation plays a pivotal role in many physiological functions and biological pathways such as protein stabilization, maintaining tissue structures, turnover and activity, cell–cell adhesion, and cell-matrix attachment.4,5 Glycomics and glycoproteomics have been developed to evaluate glycosylation of glycoconjugates in biological systems.6,7 Glycomics focuses on studying the structural diversity of glycans irrespective of the glycoprotein/glycopeptides to which such structures are attached, while the focus of glycoproteomics is to define the microheterogeneity associated with the glycosylation sites of proteins.
The predominant method to decipher protein glycosylations is liquid chromatography interfaced to mass spectrometry (LC–MS and LC–MS/MS). Enrichment techniques are commonly needed to overcome several challenges in glycoproteomics. Glycoproteins are present at low abundance in biological systems. Moreover, LC–MS/MS analysis of glycopeptides is hampered by microheterogeneity and low ionization/fragmentation efficiencies of such structures in the presence of other peptides. Because many approved cancer biomarkers are glycoproteins, which are present in low abundance, enriching glycoproteins/glycopeptides facilitates sensitive characterization needed to reliably define glycoprotein cancer biomarkers.
Currently, two enrichment techniques have been widely applied in glycoproteomics, namely, lectin affinity chromatography (LAC)-8,9 and hydrazide chemistry (HC)-based enrichment.10,11 LAC is based on the specific interaction of lectins (carbohydrate-binding proteins) with a certain type of glycan residues or linkages.8,9 For example, Concanavalin A (ConA) specifically binds to mannose containing glycans, SNA specifically interacts with sialic acid containing glycans, and WGA mainly interacts with GlcNAc residues of a glycan structure. Lectin affinity enrichment has been used either as a single type of lectin or a multilectin mixture.
HC-based enrichment employs chemical reactions to capture glycoproteins.10,11 Upon peroxidation, a secondary hydroxyl group of a glycan is converted to an aldehyde group, which covalently binds to hydrazide functionalized beads. To release the glycopeptides from the beads, another chemical reaction or additional enzyme is needed because the hydrazine bond is irreversible. PNGase F is the commonly used enzyme in an elution step of HC-based enrichment. This chemistry eliminates information related to the microheterogeneity of the glycosylation sites because the enzyme cleaves the N-glycosidic bond attaching glycan structures to the N-glycosylation sites. These two enrichment techniques have been successfully employed in many studies of glycoproteins associated with various cancer types including lung cancer,12−15 breast cancer,16−18 prostate cancer,19,20 and hepatocellular carcinoma.21−23
Multiple reaction monitoring (MRM) is one of the MS/MS techniques that has been widely used in quantitative analysis of peptides/proteins.24,25 However, in glycoproteomics/glycopeptidomics, MRM is not commonly considered to be a quantitative option. Previously, we have demonstrated the successful use of MRM in the quantitation of glycopeptides associated with standard glycoproteins, such as fetuin and alpha-1-acid glycoprotein, as well as depleted blood serum (BS).26 MRM quantitation of glycopeptides is based on the use of oxonium ions as transitions including m/z values at 138 (HexNAc–2H2O–CH2O), 274 (NeuAc–H2O), 366 (HexNAc+Hex), and 657 (HexNAc+Hex+NeuAc).27,28 This concept was prompted by the observation that oxonium ions of glycopeptides are always detected with high intensities in CID MS/MS acquired from triple quadrupole mass spectrometer. High collision energy (CE) was applied to produce such oxonium ions. The results demonstrated that the concentration linear dynamic range extended over more than three orders of magnitude with a limit of detection <1.4 fmol.26 Sanda et al.29 have recently reported the MRM quantitation of glycopeptides associated with haptoglobin from liver cirrhosis and hepatocellular carcinoma. In conjunction with the use of an exoglycosidase, the high level of fucosylated glycopeptides in liver disease was successfully examined within a significant value (p < 0.05).
The incidence of esophageal adenocarcinoma (EAC) is increasing at a rate that exceeds that of any other types of cancer over the past 25 years.30−32 EAC is one of the subtypes of esophageal cancer, the other being esophageal squamous cell carcinoma (ESCC). ESCC is evenly distributed throughout the length of the esophagus, while EAC is predominantly found in distal esophagus and gastroesophageal junction. In the 1970s, ESCC accounted for the vast majority of esophageal cancers, while EAC accounted for <5%. Currently, EAC represents 60–90% of esophageal cancers.33 In many cases, EAC is diagnosed in a late stage, thus leading to a 5 year survival rate of <20%.31,32 Moreover, 5 year survival drops to <4% with distant metastasis to other organs, which is the third lowest rate after liver/intra-hepatic bile duct and pancreatic cancers.30 Like other cancers, the survival rate of EAC patients increases if patients are diagnosed in early stages of the disease.34 Hence, there is a pressing need to determine diagnostic biomarkers capable of detecting the disease in an early stage. Like other cancers, EAC is believed to develop in a stepwise manner, and it is thought that its precursor lesion is high-grade dysplasia (HGD) of metaplastic esophageal epithelium.
Here we report the quantitative analyses of human BS glycoproteins and glycopeptides associated with EAC development by LAC- and HC-based enrichment in conjunction with two tandem MS approaches, namely, LC–ESI–MS/MS and MRM LC–MS/MS. The overarching goal of this study is to assess glycoproteomic and glycopeptidomic biomarkers of EAC using the current enrichment techniques that have been widely used in cancer-associated glycoprotein studies. Statistical evaluation was also performed to validate candidate cancer-associated glycoprotein/glycopeptide biomarkers.
Experimental Section
Materials
HPLC-grade solvents, including methanol, isopropanol, and water, were procured from Macron Fine Chemicals-Avantor Performance Materials (Center Valley, PA). HPLC-grade acetonitrile (ACN) was purchased from Fisher Scientific (Pittsburgh, PA). Sodium chloride (NaCl) and disodium phosphate (Na2HPO4) were obtained from Mallinckrodt Chemicals (Phillipsburg, NJ). MS-grade formic acid (FA), trifluoroacetic acid (TFA), and acetic acid were obtained from Sigma-Aldrich (St. Louis, MO). d,l-Dithiothreitol (DTT), iodoacetamide (IAA), 3-[(3-cholamidopropyl)dimethylammonio]-1-propanesulfonate (CHAPS), sodium dodecyl sulfate (SDS), urea, sodium meta-periodate, and sodium acetate (NaAc) were also purchased from Sigma-Aldrich. Sephadex G-25 spin column was obtained from GE Healthcare Life Science (Pittsburgh, PA). Agarose-bound Sambucus nigra agglutinin and Aleuria aurantia lectin were purchased from Vector Laboratories (Burlingame, CA). 1 μm diameter BcMag hydrazide-modified magnetic beads were acquired from Bioclone (San Diego, CA). Mass-spectrometry-grade trypsin was obtained from Promega (Madison, WI), while PNGase F was purchased from New England Biolabs (Ipswich, MA).
Serum Samples and Clinical Diagnosis
All samples were collected in clinic or preop (prior to surgical case). Henry Ford Hospital has all of the needed institutional review board (IRB) approvals for sample collection. Enrolled subjects were newly diagnosed. Serum samples from healthy volunteers were obtained and used as control (namely disease-free). Clinical information on the samples used in this study is summarized in Supplementary Table 1 in the Supporting Information. The study was also approved by the Texas Tech University IRB.
Depletion of the Seven Most Abundant Proteins in Blood Serum
Two sets of samples were prepared for LAC enrichment and HC-based enrichment. BS samples were obtained from patients diagnosed with EAC (N = 15), HGD (N = 12 for LAC and N = 11 for HC), as well as age- and sex-matched disease-free (DF, N = 15) subjects. Agilent Plasma 7 multiple affinity removal spin cartridge from Agilent Technologies (Santa Clara, CA) was used to deplete the seven most abundant human serum proteins, namely, albumin, IgG, antitrypsin, IgA, transferrins, haptoglobin, and fibrinogen. A 10 μL aliquot of human BS was depleted, as stated in the protocol recommended by the manufacturer. The buffer of the depleted sample was exchanged into 50 mM PBS (pH 7.5), a phosphate-buffered saline containing 50 mM of Na2HPO4 and 150 mM of NaCl, using 5 kDa MWCO spin concentrators from Agilent Technologies. This buffer is needed for efficient lectin enrichment. The second set of samples was exchanged into 100 mM NaAc/150 mM NaCl (pH 5.5), which is recommended by the vendor for HC-based enrichment.
Protein Assay
Prior to enrichments, the protein concentration of depleted BS was determined through micro BCA protein assay (Thermo Scientific/Pierce, Rockford, IL). The bovine serum albumin (BSA) standard stock solution of 2.0 mg/mL concentration provided in the micro BCA assay kit was used to prepare a set of diluted BSA standard samples with concentrations of 200, 40, 20, 10, 5, 2.5, and 1 μg/mL. 50 mM PBS was used to prepare the BSA standard samples. The micro BCA working reagent required for the assay was prepared by mixing reagents A–C (provided by the vendor) at a ratio of 50:48:3. Next, a 10 μL aliquot of depleted BS samples was diluted in 140 μL of 50 mM PBS. BSA standard samples and depleted BS samples were then mixed with 150 μL aliquots of the working buffer and transferred to a 96-well plate prior to incubation at 37 °C for 2 h. The concentration was then measured at 620 nm wavelength on Multiskan plate-reader (Thermo Scientific, Rockford, IL).
Lectin Affinity Chromatographic Enrichment of N-Linked Glycoproteins Using SNA and AAL Mixture
Two agarose-bound lectins were used to enrich glycoproteins from 42 depleted BSs associated with two esophagus diseases and disease-free subjects. Sambucus nigra agglutinin (SNA, 3 mg/mL of settled gel) is binding to sialic acid, while Aleuria aurantia lectin (AAL, 2 mg/mL of settled gel) is specific to bind fucose-related structures. 60 μL aliquots of SNA and 90 μL aliquots of AAL were mixed and washed five times with 200 μL of 50 mM PBS. 42 lectin mixtures were prepared for each depleted BS subject. The depleted BS samples were mixed with lectin mixtures and incubated overnight at 4 °C with gentle agitation. The unbound fractions were then discarded after the centrifugation at a speed of 2000g for 5 min. The bound fractions were washed five times with 50 mM PBS to remove nonspecific binding proteins. The enriched glycoproteins were released by incubation with 400 μL of 100 mM acetic acid at 4 °C for 4 h with gentle agitation. The eluted fractions were collected and subjected to buffer exchange, as previously described. The exchanged buffer was 50 mM ammonium bicarbonate. BCA protein assay was then performed to determine the number of enriched glycoproteins.
Enzymatic Digestion of Lectin Affinity-Enriched N-liked Glycoproteins
Thermal denaturation was performed at 65 °C for 10 min. 200 mM DTT and 200 mM IAA solutions were prepared in 50 mM ammonium bicarbonate. A 1.25 μL aliquot of 200 mM DTT solution was then added to the samples prior to incubation at 60 °C for 45 min. The reduced glycoproteins were then alkylated through the addition of a 5 μL aliquot of 200 mM of IAA and incubation at 37.5 °C for 45 min. A second 1.25 μL aliquot of 200 mM DTT was added to consume excess IAA, followed by the incubation at 37.5 °C for 30 min. The samples were then tryptically digested and incubated at 37.5 °C overnight, followed by microwave digestion at 45 °C and 50W for 30 min. The amount of trypsin added to the samples (enzyme/substrate ratio of 1:25 w/w) was determined based on the glycoprotein concentration values calculated from micro-BCA protein assay. The enzymatic digestion was quenched by adding 0.5 μL aliquots of neat FA to the samples. Then, the samples were speed-vacuum-dried and resuspended in 0.1% FA prior to LC–MS/MS analyses.
Hydrazide Chemistry-Based Enrichment for N-linked Glycoproteins
This protocol was modified from a published work.35,36 Protein samples were denatured using 8 M urea at 37.5 °C for 4 h. Denatured proteins in coupling buffer (100 mM NaAc/150 mM NaCl and 0.2% CHAPS) were oxidized by adding sodium meta-periodate to make a final concentration of 15 mM. The incubation was performed with agitation at room temperature for 1 h. The samples were then desalted by Sephadex G-25 spin column using coupling buffer. BcMag hydrazide-modified magnetic beads were suspended and washed three times with coupling buffer. Magnetic separator for six Eppendorf tubes was used to separate solution and magnetic beads. The samples were then mixed with the magnetic beads (protein/beads ratio of 1:10 w/w), followed by overnight incubation with agitation at room temperature for 18 h. Nonglycoproteins were removed by washing with 800 μL binding buffer three times and 800 μL urea solution, containing 8 M urea and 0.4 M ammonium bicarbonate, six times. Bound glycoproteins were reduced by adding 25 μL of 200 mM DTT, followed by incubation at 37.5 °C for 1 h. After removing the reduction solution, the samples were then alkylated by adding 125 μL of 200 mM IAA and incubating at 37.5 °C for 1 h. The bound glycoproteins were washed with 300 μL of urea solution and 50 mM ammonium bicarbonate three times. Tryptic digestion was performed using the trypsin/protein ratio of 1:50 (w/w) at 37.5 °C. Tryptically released peptides were removed by a series of washing with 500 μL of 80% acetonitrile/0.1% TFA, 8 M urea/0.1% SDS, and 100 mM ammonium bicarbonate. Each washing step was completed six times to remove the peptides. The bound glycopeptides on magnetic beads were then suspended in 300 μL of 100 mM ammonium bicarbonate prior to PNGase F digestion. PNGase F was added based on the enzyme/protein ratio was 1:35 (w/w), followed by incubating at 37 °C for 18 h. Released deglycosylated peptides were finally collected using 80% acetonitrile/0.1% TFA. The deglycosylated peptides were vacuum-dried and resuspended in 2% acetonitrile/0.1% FA prior to LC–MS/MS analysis.
LC–MS/MS Analyses
LC–MS/MS and MRM LC–MS/MS were performed on Dionex 3000 Ultimate nano-LC system (Dionex, Sunnyvale, CA) interfaced to LTQ Orbitrap Velos and TSQ Vantage mass spectrometers (Thermo Scientific, San Jose, CA), respectively. These were equipped with a nano-ESI source. The digested samples were online-purified using a PepMap 100 C18 cartridge (3 μm, 100 Å, Dionex). The purified samples were then separated using a PepMap 100 C18 capillary column (75 μm id × 150 mm, 2 μm, 100 Å, Dionex). The separation of LAC-enriched samples was achieved at 350 nL/min flow rate using the following gradient: 0–10 min maintaining 10% solvent B (98% ACN with 0.1% FA), 10–160 min ramping solvent B 10–45%, 160–165 min ramping solvent B 45–80%, 165–170 min maintaining solvent B at 90%, 170–171 min decreasing solvent B 80–10%, and 171–180 min sustaining solvent B at 10%. Solvent A was a 2% ACN aqueous solution containing 0.1% FA. The separation and scan time was set to 180 min.
The separation of HC-enriched samples was achieved at 350 nL/min flow rate using the following gradient: 0–10 min maintaining 10% solvent B, 10–55 min ramping solvent B 5–30%, 55–60 min ramping solvent B 30–50%, 60–61 min ramping solvent B 50–80%, 61–65 min maintaining solvent B at 80%, 65–66 min decreasing solvent B 80–5%, and 66–70 min sustaining solvent B at 5%. The separation and scan time was set to 70 min. This was optimized gradient for identification of peptides/protein in a separate study. The data showed the comparable number of protein and peptides identified using the 180 method. Thus, HC-enriched samples were analyzed twice using this optimum gradient.
The LTQ Orbitrap Velos mass spectrometer was operated with three scan events. The first scan event was a full MS scan of 380–2000 m/z at a mass resolution of 15 000. The second scan event was CID (collision-induced dissociation) MS/MS of parent ions selected from the first scan event with an isolation width of 3.0 m/z, a normalized CE of 35%, and an activation Q value of 0.250. The third scan event was set to acquire HCD (higher energy collision dissociation) MS/MS of the parent ions selected from the first scan event. The isolation width of HCD experiment was set to 3.0 m/z, while the normalized CE was set to 45% with an activation time of 0.1 ms. The CID and HCD MS/MS were performed on the eight most intense ions seen from the first MS scan event. The LTQ Orbitrap Velos mass spectrometer was externally calibrated, permitting <2 ppm mass accuracy.
The TSQ Vantage mass spectrometer was operated in EZ method for MRM experiments. The EZ method is more convenient to import the list of precursors and transitions with segmented retention times, thus permitting 3000 transitions set up. In scan editor, experiment type was set to be SRM with chrom filter peak width enabled as 10.0 and collision gas pressure of 1.0 mTorr. In terms of SRM settings, Q1 peak width (fwhm) was set to be 0.70 with cycle time of 3.5 s for LAC samples and that of 5 s for HC samples. With these cycle times, dwell times of 18 ms and 17 ms were acquired for LAC and HC samples, respectively. This allows 14 data points to be built across the peak from HC samples, while 20 data points were built across the peak from LAC samples. We acquired more data points for LAC samples for better quantitation. Normalized CE of 35 and 45% were set for HC and LAC glycopeptides, respectively. Normalized CE of 45% was used in the case of glycopeptides according to our published work,26 while 35% (common value used in proteomics) was used for the peptides generated by HC enrichment.
Data Processing
The identification of enriched glycoproteins was achieved using MASCOT. Proteome Discoverer version 1.2 software (Thermo Scientific) was used to generate a mascot generic format file (*.mgf), which was subsequently employed for database searching using MASCOT version 2.3.2 (Matrix Science, Boston, MA). Parent ions were selected from a mass range of 300–5000 Da with a minimum peak count of 1. The parameters from Mascot Daemon were set to search against IPI-human database. Oxidation of methionine was set as a variable modification, while carbamidomethylation of cysteine was set as a fixed modification. In the case of HC-enriched samples, deamidation of asparagine was added as a variable modification. Tandem MS ions were searched within 0.8 Da mass tolerances. The peptide sequences of enriched glycoproteins were identified within 5 ppm. The results from MASCOT were imported into Scaffold 3 (Proteome Software, Portland, OR), where spectral-count quantitation of glycoproteins was performed and NCBI annotation was added for gene ontology. Peptides and glycopeptides were identified with the false discovery rate (FDR) <1%.
The identification of glycopeptides enriched by LAC was accomplished using ExPASy GlycoMod tool using the lists of glycoproteins obtained from MASCOT database search. CID and HCD MS/MS spectra of glycopeptides were then manually searched to assign glycan structures and peptide backbone masses. Confirmed assignment of glycopeptides was based on the detection of diagnostic ions of N-lined glycopeptides (oxonium ions) in HCD MS/MS, such as m/z values of 138, 204, 274, 292, 366, 657, and so on. Glycan structures were assessed from CID MS/MS if diagnostic ions were observed in HCD spectra. To find peptide backbone sequences, the experimental molecular masses of glycopeptides were searched through ExPASy GlycoMod tool using all identified glycoproteins. Peptide backbone sequences were determined within 15 ppm mass accuracy of molecular mass of glycopeptide. Also, the identification of glycopeptides was confined by matching the glycan structures suggested from GlycoMod tool and manual assignments in CID spectra. Assignment was also based on applying mass accuracy of <3 ppm for all identified glycopeptides m/z values. For MRM experiment, transitions were set to be at m/z values of 204, 274, and 366. This is because all of the glycopeptides are sialylated with or without fucosylation, and those three diagnostic ions are observed with high intensities compared with other diagnostic ions of N-linked glycopeptides. The segmentation of retention times was set to 6 min ahead and behind a peak apex.
The selection of transitions and precursor ions of HC-enriched glycopeptides were performed by Pinpoint 1.1 (Thermo Scientific). The spectral library was uploaded to select deglycosylated peptides with the top three intense transitions. The selection of transitions was based on y ions higher than y3 and single charge state. Every transition was confirmed from tandem MS because Pinpoint is capable of upload spectrum. The segmentation of retentions times was set to 6 min ahead and behind a peak apex.
For quantitation, spectral counts were used to quantify glycoproteins acquired from LC–ESI–MS/MS, while peak areas were used to quantify glycopeptides (LAC) and deglycosylated peptides (HC) acquired from MRM LC–MS/MS. Spectral counts were obtained from Scaffold 3, while peak areas were acquired from Pinpoint. All MRM raw files of the samples enriched by LAC and HC were imported into Pinpoint. Peak width was set to 2.0 min with minimum signal threshold of 10 and possible alignment errors of 2.0 min. The number of smoothing points of the peak was set to 7, thus enabling us to compute area/peak of smoothed data. The peak areas were normalized and averaged to compare the quantitative results between disease subjects. If the same glycosylation sites from HC deglycosylated peptides with different peptide sequences were observed, the peak areas associated with that glycosylation site were summed up. It applied to LAC samples if the same glycan structure on the same glycosylation sites but different sequences was detected. The standard error of the mean (SEM) was used to consider the variability between the biological samples. One-way ANOVA was performed for statistical evaluation with p value of 0.05.
Results and Discussion
Spectral-Count Quantitation of Blood Serum Glycoproteins Enriched by Lectin Affinity Chromatography and Hydrazide Chemistry
Chemometric analysis (principal component analysis, PCA) and t test were performed for clustering spectral-count quantitative data associated with subjects and establishing statistically significant glycoproteins showing changes between disease groups and disease free subjects, respectively. Figure 1A corresponds to nonsupervised PCA scoring plot of LAC-enriched samples, while Figure 2A corresponds to that of HC-enriched samples. PCA is a widely used chemometric tool, facilitating cluster analysis that captures the differences among data sets.37 A plot of the scores of principal component one and two for the samples of three disease onsets is illustrated in Figure 1A. The second principal component scores (D2 score) permitted a clear distinction between the three onsets. Moreover, each subject was clustered to represent different disease states. DF subjects were populated between HGD and EAC subjects. However, less difference was observed between HGD and EAC group in terms of first principal component scores (D1 score). Therefore, according to PCA plot, a high distinction exists for disease-free subject compared with HGD and EAC, while a minute difference presents between HGD versus EAC associated with the identified glycoproteins by LC–ESI–MS/MS along with LAC enrichment. In regard to chemometric analysis of HC enriched samples, clustering appeared to be comparable to that of LAC-enriched samples.
Figure 1.

Principal component analysis (PCA) scores plot for LC–ESI–MS/MS results of LAC- (A) and HC-enriched (B) samples from human blood serum associated with DF subjects (N = 15, green), HGD (N = 12 for LAC enrichment and N = 11 for HC enrichment, blue), and EAC (N = 15, red).
Figure 2.

Spectral counts quantitation of LAC-enriched glycoproteins (A) and HC-enriched glycoproteins (B) by LC–ESI–MS/MS that were evaluated as significant differentiated ones between DF and HGD and between DF and EAC with p value <0.05.
In LAC enrichment, a mixture of SNA and AAL lectins was used to capture sialylated or fucosylated glycopeptides because our previous glycomic studies have revealed that many of glycans with significant changes were sialylated or fucosylated.38,39 Also, changes in sialylation or fucosylation of glycans associated with glycoproteins have been implicated in many diseases, such as cancers, prompting us to investigate their changes associated with different esophageal diseases.40,41 LC–ESI–MS/MS analyses resulted in the identification of 102 glycoproteins for the samples enriched by LAC, as shown in Supplementary Figure 1A in the Supporting Information. This number of enriched glycoproteins is comparable to previously published works.42,43 Madera et al.42 have reported 108 human BS glycoproteins identified using a series of Con A, SNA-I, UEA-I, and PHA-L lectins, while Drake et al.43 have reported 122 human BS glycoproteins identified using SNA and AAL multilectin columns. Here 94 glycoproteins and 704 unique peptides appeared to be common between three cohorts, as shown in Supplementary Figure 1A,B in the Supporting Information. A total of 96 glycoproteins were identified by LC–ESI–MS/MS analyses for the HC-based enriched samples, as shown in Supplementary Figure 2A in the Supporting Information. Also, the number of identified glycoproteins is very comparable to a previous paper by Zhang et al.10 They have reported 97 human BS glycoproteins using HC-based enrichment. As shown in Supplementary Figure 2A,B in the Supporting Information, 92 glycoproteins and 579 unique peptides were commonly identified between the three cohorts. Compared with LAC enrichment, a lower number of identified peptides was observed. The identification of glycoproteins was based on the detection of peptides of glycoproteins in the case of LAC-enriched samples, while it was only based on the detection of deglycosylated peptides (deamidated peptide resulting from PNGase F treatment) in the case of HC-enriched samples. The HC protocol involves successive washes after tryptic digestion, thus eliminating a large number of nonglycopeptides.
In this study, a total of 139 human BS glycoproteins were identified for both HC and LAC enrichments. As shown in Supplementary Figure 3 in the Supporting Information, LC–ESI–MS/MS resulted in 59 glycoproteins commonly detected between the two enrichments, which correspond to 42% overlap. The overlap of common glycoproteins observed between LAC and HC enrichments is similar to previously published studies. Pan et al.44 and McDonald et al.45 have reported the complementary identification of glycoproteins enriched by two enrichment techniques. According to Pan et al.,44 HC and LAC enrichments resulted in a total of 216 human glycoproteins associated with cerebrospinal fluid by LC–MS/MS analysis. 86 common glycoproteins (40% overlap) were identified, while 53 glycoproteins and 77 glycoproteins appeared to be unique to HC and LAC enrichments, respectively. Also, McDonald et al. has shown similar results.45 They evaluated glycoproteins expressed in HeLa cells using HC and LAC enrichments. Maackia amurensis (MAA and MHA) lectin was used to capture sialylated glycoproteins. LC–ESI–MS/MS analysis resulted in a total of 240 glycoproteins identified from HeLa cell lysates using HC and LAC enrichments. 101 common glycoproteins (42% overlap) were observed from both enrichments. These discrepancies in enriching or identifying glycoproteins were mainly contributed to the different chemistry of these two enrichment techniques. LAC enrichment applied in this study captured sialylated or fucosylated glycopeptides, while HC enrichment captured broader range of glycopeptides.
Gene ontology was searched using NCBI annotation from Scaffold in terms of biological process for LAC-enriched samples (Supplementary Figure 4A in the Supporting Information) and HC-enriched samples (Supplementary Figure 4B in the Supporting Information). The glycoproteins have multiple biological processes showing that the total number of biological process was not matched to the number of identified glycoproteins. LAC and HC enrichment resulted in a similar analysis of biological process. For example, 61.2% of LAC-enriched glycoproteins and 60.6% of HC-enriched glycoproteins function in the cellular process, biological regulation, response to a stimulus, metabolic process, and multicellular organismal process. Also, cellular components of LAC- and HC-enriched glycoproteins showed comparable distribution. 86.8% of LAC-enriched glycoproteins and 84.2% of HC-enriched glycoproteins were mainly originated in an extracellular region, membrane, cytoplasm, intracellular organelle, plasma membrane, and the organelle part, as shown in Supplementary Figure 5A,B in the Supporting Information.
Significant differences in the abundance of glycoproteins were evaluated between disease-free and two esophagus diseases using spectral counts. The t test resulted in complementary evaluation between LAC and HC enrichment. Figure 2 shows changes of glycoproteins in spectral counts between DF versus HGD and DF versus EAC for LAC-enriched glycoproteins (Figure 2A) and HC-enriched glycoproteins (Figure 2B). Glycoproteins with significantly different abundances among the two cohorts are designated with asterisks, indicating p values <0.05. In Figure 2A, four glycoproteins were observed as significantly different in DF versus HGD. Down-regulated glycoproteins in HGD are inter-alpha-trypsin inhibitor heavy chain H2 and GUGU beta form while up-regulated glycoproteins in HGD are complement C3 and leucine-rich alpha-2 glycoprotein. Five glycoproteins were determined to be significant in DF versus EAC. Two down-regulated glycoproteins in EAC were GUGU beta form and serum paraoxonase arylesterase 1 while two up-regulated and one detected only in EAC were leucine-rich alpha-2 glycoprotein, complement C1r subcomponent, and coagulation factor IX. Here GUGU beta form is observed as statistically significant down-regulated glycoprotein in both HGD (p value <0.01) and EAC (p value <0.001). Leucine-rich alpha-2 glycoprotein was detected as up-regulated glycoprotein in HGD and EAC. Both changes resulted in p value less than 0.05.
The up-regulation of leucine-rich alpha-2 glycoprotein has been reported in other cancers such as lung cancer12,14 or ovarian cancer.46,47 This glycoprotein is a regulatory protein and is usually found in plasma.48 Leucine-rich alpha-2 glycoprotein has multiple functions such as protein–protein interaction, signal transduction, cell adhesion, and development. GUGU beta form was detected as down-regulated in both HGD and EAC. GUGU beta form or fetuin-B is a fetuin-A counterpart, which is secreted in the liver.49 It is a negative acute-phase protein that is down-regulated during disease development or inflammation. It has been previously reported that this glycoprotein demonstrates developmental or inflammation changes associated with hepatic level of fetuin-B m-RNA.49 The other glycoproteins that demonstrated significant change in this study are involved in different functions. For example, complement C3 is involved in the activation of the complement system. Activated C3b chain can attach to carbohydrates on the cell surface or immune aggregates.50,51
In the case of HC-enriched samples, the glycoproteins that appeared to be significantly different in DF versus the two esophagus diseases were different from those observed in the case of LAC-enriched samples (Figure 2B). Eight significant glycoproteins were observed between DF versus HGD. Three down-regulated glycoproteins are angiotensinogen, IGHM protein, and ceruloplasmin, while four up-regulated glycoproteins are, namely, leucine-rich alpha-2 glycoprotein, coagulation factor V, alpha-1-antitrypsin, and inter-alpha-trypsin inhibitor heavy chain H3. One glycoprotein was detected only in HGD, namely, isoform 1 of sulfhydryl oxidase 1. Four glycoproteins were defined as significantly differentiated between DF and EAC. Three down-regulated glycoproteins were angiotensinogen, alpha-1B-glycoprotein, and histidine-rich glycoprotein, while prostaglandin H2 d-isomerase was observed as up-regulated glycoprotein with statistical significance in EAC.
Alpha-1-antitrypsin has been previously reported showing elevated levels in other cancers such as lung cancer13 or hepatocellular carcinoma.21 It is a circulating serine protease inhibitor or serpin and an acute-phase protein secreted in the liver. It is involved in the inhibition of apoptosis, or modulation of local and systemic inflammatory responses.52 Interestingly, prostaglandin-H2-d isomerase was detected after enrichment. It catalyzes the conversion of Prostaglandin-H2 to Prostaglandin-D2.53,54 This glycoprotein is highly involved in the functions of central nervous system and brain. It can be found in other organs or BS with relatively low concentrations.53 In this study, it was significantly up-regulated in EAC compared with DF.
MRM-Based Quantitation and Evaluation of LAC- and HC-Enriched Glycopeptide/Glycosylation Site
57 LAC-enriched glycopeptides and 83 HC-enriched glycopeptides containing 85 glycosylation sites were evaluated by MRM quantitation. The list of glycopeptides including the name of glycoprotein, peptide backbone sequences, m/z values, ppm, and quantitative values is summarized in Supplementary Table 2 in the Supporting Information (LAC-enriched glycopeptides) and 3 (HC-enriched glycopeptides). The complementary MRM quantitation targeted a total of 70 glycoproteins (Supplementary Figure 6A in the Supporting Information) with 112 glycosylation sites (Supplementary Figure 6B in the Supporting Information). Seventeen glycosylation sites appeared to be common from LAC- and HC-enriched glycopeptidomic quantitation. Figure 3 illustrated the comparisons of quantitative values (ratio) of the 17 glycosylation sites between DF versus HGD and DF versus EAC by LAC and HC enrichment techniques. Because the raw or normalized intensities are not comparative from two enrichments, the comparison focuses on the ratio between disease subjects. Uniprot entry name was used instead of full name of glycoproteins for convenience. Student t test was performed using 95% confidence interval to evaluate variation between LAC and HC quantitative values. As a result, a comparable trend of changes in disease cohorts was seen between LAC and HC enrichment techniques, except for a single glycosylation site at N156 for FETUA (N156/FETUA). The change of N241/HPT in DF versus EAC by LAC and that of N494/KLKB1 in DF versus HGD by HC enrichment showed a large variation, which might be originating from samples.
Figure 3.
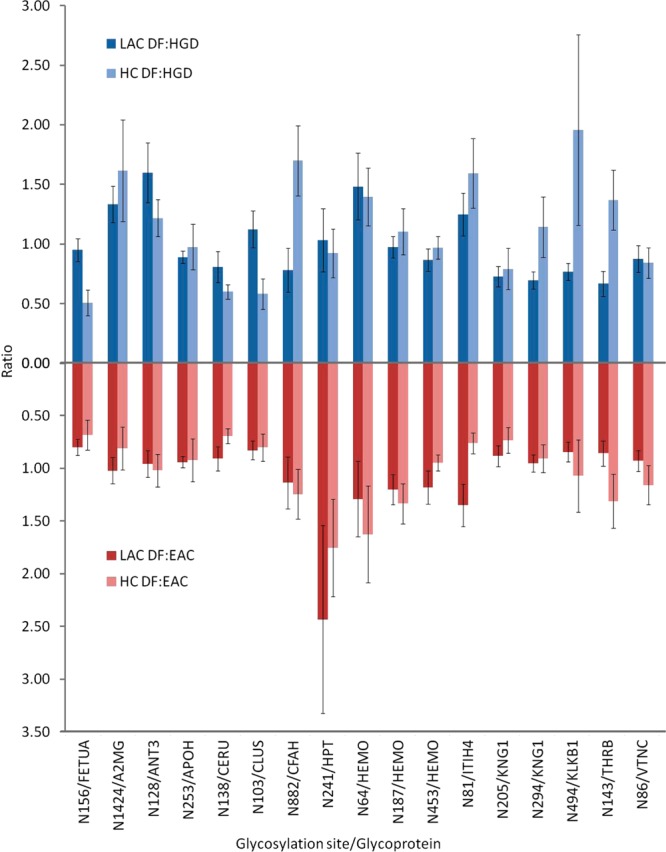
Comparisons of MRM quantitation for 17 common glycosylation site between LAC and HC enrichments in terms of ratio between DF versus HGD and DF versus EAC.
HPT or haptoglobin was identified and quantified in this study, although it is one of the target proteins for depletion. Its incomplete depletion is accountable due to the high secondary interactions with other glycoproteins and higher abundances in cancer. From LAC and HC enrichments, HPT was increased in EAC. HPT is considered as a distinct lung-cancer-associated glycoprotein. Previous papers have reported that a substantial increase associated with core-fucosylation was observed in lung cancer.55,56 Because it is involved in acute phase reaction, its increase has been also reported in many cancers such as ovarian57 or pancreatic cancers.58
ANOVA test resulted in the complementary evaluation for statistically differentiated glycopeptides from LAC and HC enrichments. Tables 1 and 2 summarize 13 LAC-enriched glycopeptides and 10 HC-enriched glycopeptides defined as statistically significant between disease groups from MRM LC–MS/MS. These contain normalized areas and SEM values of the glycosylation sites with their p values. In Figure 4, two glycopeptides by LAC enrichment and two glycosylation sites by HC enrichment were determined to be significant between DF and EAC. Each dot represents each sample. Two LAC-enriched glycopeptides associated with HEMO were observed as statistically up-regulated in EAC (Figure 4A). Monofucosylated-disialylated and monofucosylated-monosialylated glycopeptides attached to N453 showed 2.11 and 1.74 times higher intensities in EAC. HEMO or hemopexin is an acute phase glycoprotein, which is induced after inflammation.59 It is mainly expressed in liver and has a high affinity to heme. Its fucosylated glycans have been observed to be significantly abundant in hepatocellular carcinoma.60 In this study, the up-regulation of two fucosylated glycopeptides on N453 was evaluated with significant p value. This observation was also marked in a separate study (Mayampurath, A.; Song, E.; Mathur, A.; Yu, C.-y.; Hammoud, Z.; Mechref, Y.; Tang, H. Label-Free Glycopeptide Quantification for Biomarker Discovery in Human Sera. J. Proteome Res.2014; 10.1021/pr500242m). This work described the novel statistical method for identification and quantitation of glycopeptides/glycoproteins using label-free mass spectrometry. By HC enrichment (Figure 4B), the glycosylation on N362 from Q86TT1 protein shows 0.67 times down-regulated in EAC. Another glycosylation site on N374 from CLUS was also defined to be down-regulated in EAC by 0.76 times. Compared with the data using spectral count quantitation, the changes of leucine-rich alpha-2 glycoprotein, IGHM protein, inter-alpha-trypsin inhibitor heavy chain H3, ceruloplasmin, alpha-1B-glycoprotein, and prostaglandin-H2-d isomerase were confirmed through MRM experiments. Coagulation factor V depicted an opposite trend in MRM quantitation relative to spectral count experiment.
Table 1. Normalized and Averaged Areas of 13 Glycopeptides Identified in LAC-Enriched Samples That Were Differentially Expressed among Disease Groups As Suggested by p Valuesa.
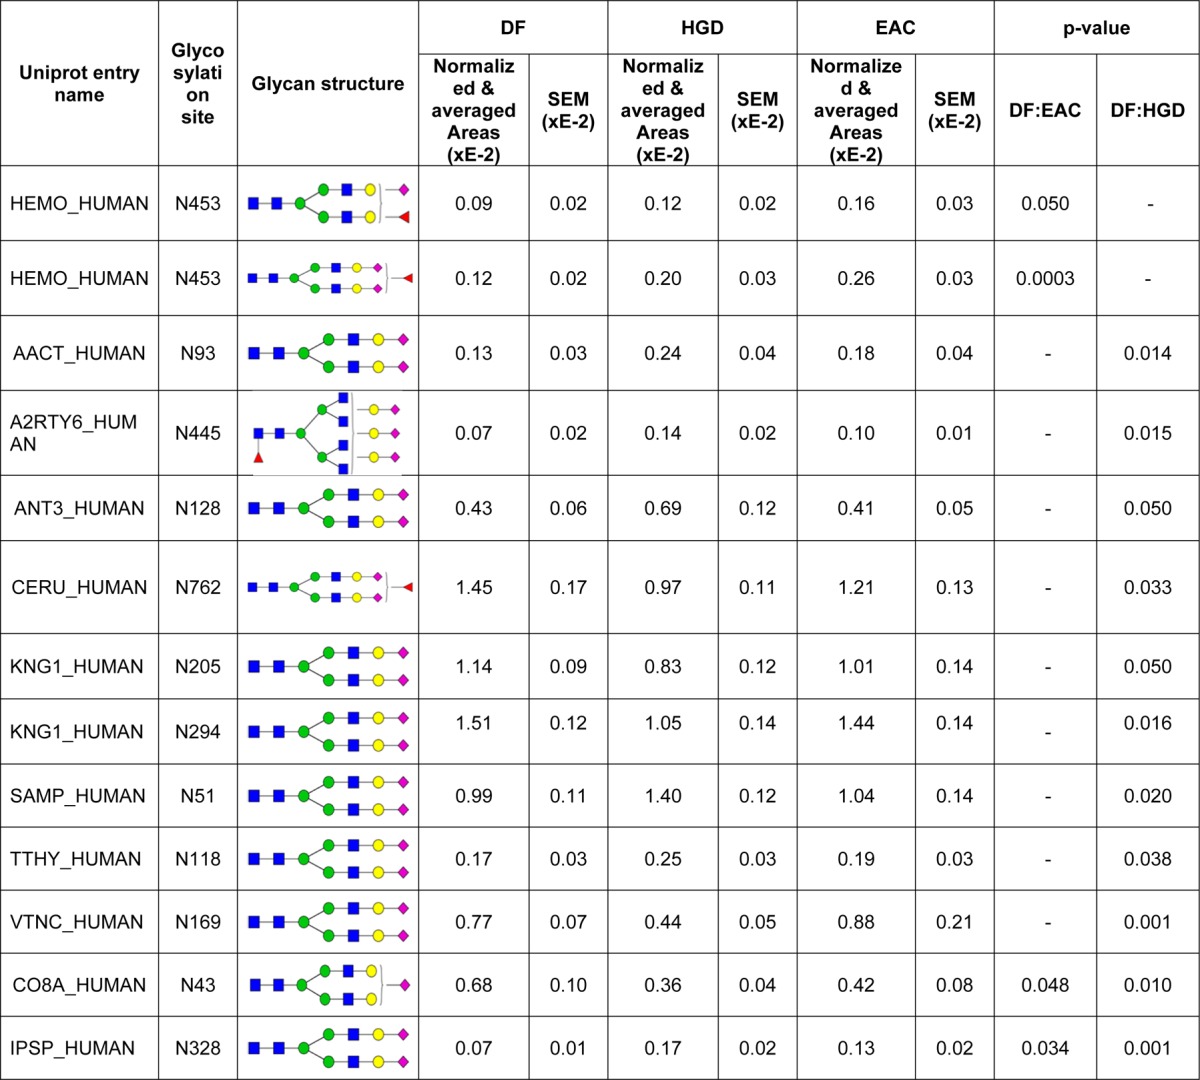
Observed peptide sequences and m/z values are listed in Supplementary Table 2 in the Supporting Information.
Table 2. Normalized and Averaged Areas of 10 Glycosylation Sites Identified in HC-Enriched Samples That Depicted Differentital Expression among Disease Groups As Suggested by p Valuesa.
| DF |
HGD |
EAC |
p value |
||||||
|---|---|---|---|---|---|---|---|---|---|
| Uniprot entry name | glycosylation site | normalized and averaged areas (xE-4) | SEM (xE-4) | normalized and averaged areas (xE-4) | SEM (xE-4) | normalized and averaged areas (xE-4) | SEM (xE-4) | DF:EAC | DF:HGD |
| CLUS_HUMAN | N374 | 526.13 | 42.74 | 571.63 | 76.72 | 401.25 | 45.78 | 0.050 | |
| Q86TT1_HUMAN | N362 | 11.62 | 1.32 | 11.23 | 3.04 | 7.81 | 1.25 | 0.046 | |
| FINC_HUMAN | N552 | 3.50 | 0.66 | 0.89 | 0.42 | 2.92 | 1.27 | 0.005 | |
| IBP3_HUMAN | N136 | 2.87 | 0.44 | 1.25 | 0.49 | 2.13 | 0.41 | 0.023 | |
| FETUA_HUMAN | N156 | 33.87 | 4.63 | 17.24 | 4.69 | 23.14 | 6.03 | 0.021 | |
| CFAH_HUMAN | N882 | 30.43 | 4.50 | 51.71 | 10.08 | 37.91 | 8.53 | 0.045 | |
| PTGDS_HUMAN | N51 | 2.23 | 0.37 | 0.91 | 0.48 | 2.25 | 0.32 | 0.036 | |
| CERU_HUMAN | N138 | 540.69 | 37.64 | 323.99 | 42.72 | 375.42 | 47.60 | 0.011 | 0.001 |
| CERU_HUMAN | N397 | 1442.05 | 82.95 | 1147.04 | 74.77 | 943.68 | 94.66 | 0.0005 | 0.018 |
| F13B_HUMAN | N555 | 11.40 | 1.89 | 3.92 | 1.11 | 5.88 | 1.69 | 0.038 | 0.005 |
Peptide sequences and m/z values are listed in Supplementary Table 3 in the Supporting Information.
Figure 4.
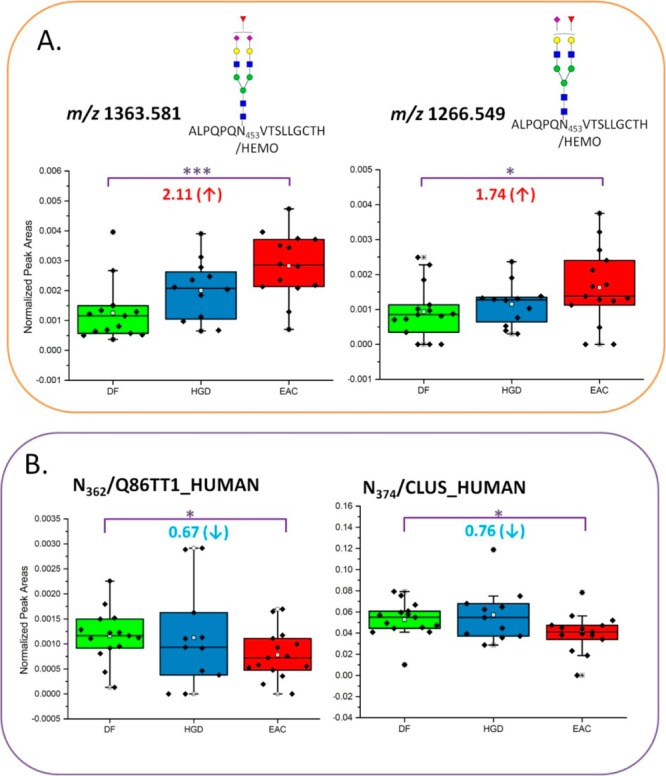
Box and dot plots of normalized peak areas of glycopeptides determined by MRM LC–MS/MS analyses of LAC-enriched samples and glycosylation sites of HC-enriched samples. These are peptides and glycopeptides that have demonstrated a statistically significant differences in expressions between DF versus EAC with p value <0.05. Dots represent each sample.
There are nine glycopeptides by LAC enrichment, and five glycosylation sites by HC enrichment were defined, as significantly changed between DF and HGD, as shown in Figure 5. In Figure 5A, LAC enrichment resulted in four down-regulated glycopeptides and five up-regulated glycopeptides in HGD. For example, disialylated biantennary glycopeptide associated with N169 from VTNC was observed 0.57 times lower in HGD with p value of 0.001. Disialylated biantennary glycopeptides on N294 and N205 from KNG1 were observed 0.70 and 0.73 times lower in HGD, respectively. Monofucosylated and trisialylated glycopeptide attached to N445 from A2RTY6 was determined to be the highest up-regulation in HGD. It shows 2.08 times higher abundance in HGD than in DF with p value of 0.015. HC enrichment resulted that five glycosylation sites were determined to be significantly distinguishable between DF versus HGD including four down-regulation and one up-regulation (Figure 5B). For example, the glycosylation on N552 associated with FINC shows a very low abundance or nondetection from some of the subjects in HGD or EAC. The ANOVA test resulted in p value of 0.005 for 0.25 times fold change between DF versus HGD. The glycosylation on N882 from CFAH was observed with 1.70 times higher in HGD compared with DF. It was determined to be significant with p value of 0.045. Between DF and EAC, three glycosylation sites were observed to be significant between HGD and EAC. Two glycosylation sites on N81 and N51 were associated with ITIH4, representing down-regulation by 0.48 and 0.64 times in EAC, respectively.
Figure 5.

Box and dot plots of normalized peak areas of glycopeptides determined by MRM LC–MS/MS analyses of LAC-enriched samples and glycosylation sites of HC-enriched samples. These are peptides and glycopeptides that have demonstrated a statistically significant differences in expressions between DF versus HGD with p value <0.05. Dots represent each sample.
In Figure 6, two glycopeptides by LAC enrichment and three glycosylations sites by HC enrichment were observed with statistically significance of abundances in both disease groups. In Figure 6A, monosialylated biantennary glycopeptide attached to N43 on CO8A was detected with down-regulation for HGD (0.53 times lower) and EAC (0.62 times lower) compared with DF. Disialylated biantennary glycopeptide attached to N328 from IPSP was observed with up-regulation in HGD (2.36 times higher) and EAC (1.71 times higher) compared with DF.
Figure 6.

Box and dot plots of normalized peak areas of glycopeptides determined by MRM LC–MS/MS analyses of LAC-enriched samples and glycosylation sites of HC-enriched samples. These are peptides and glycopeptides that have demonstrated a statistically significant difference between DF versus EAC and DF versus HGD with p value <0.05. Dots represent each sample.
By HC enrichment, two glycosylation sites of N138 and N397 associated with CERU were determined to be statistically validated between DF versus HGD and DF versus EAC. Both were observed with lower abundance in diseases groups. The abundance of glycosylation on N138 was decreased by 0.60 times in HGD representing p value less than 0.001 while decreased by 0.69 times in EAC with p value of 0.011. The glycosylation on N397was decreased to be 0.80 times in HGD with p value of 0.018 while to be 0.65 times in EAC with p value of 0.0005. Another glycosylation site on N555 from F13B also shows down-regulation by 0.34 times in HGD and 0.52 times in EAC compared with DF. Here CERU or ceruloplasmin shows the significant decreases in glycosylation by HC enrichment. CERU is a copper-binding glycoprotein involved in iron metabolism.61 Previously, the increase in serum CERU has been reported to diagnosis cancer.62 However, their glycosylation associated with cancers shows a different observation requiring in-depth investigations. In N138 and N397, the level of glycosylation appeared to decrease from DF to HGD or EAC, while it shows less change from HGD to EAC. This was different from LAC enrichment. According to this study and Anoop et al. (submitted), the abundances vary irrespective of the type of glycoforms or glycosylation sites.
Conclusions
Overall, we extensively evaluated glycoproteins/glycopeptides associated with esophageal diseases by LAC enrichment and HC-based enrichment. Also, different tandem MS techniques were employed to quantify glycoproteins or glycopeptides including LC–ESI–MS/MS and MRM LC–MS/MS. Separate statistical tests for the abundances of glycoproteins/glycopeptides between disease-free or disease groups resulted in unique candidate glycoprotein/glycopeptides biomarkers. Comparing the two enrichment methods, 42% of identified glycoproteins were commonly observed from both enrichment techniques. This overlap is very comparable to previous studies. Spectral count-quantitation suggested that 7 LAC-enriched glycoproteins and 11 HC-enriched glycoproteins are significantly expressed among disease-free and disease groups. MRM quantitation suggested that 17 glycopeptides are common among LAC- and HC-enriched samples with comparable ratio between disease-free and disease groups, except N156 from FETUA. Evaluation of glycoproteins or glycopeptides using LAC and HC enrichment techniques is complementary.
Acknowledgments
This work was supported by the Office of the Vice President for Research at Texas Tech University and partially by NIH (1R01GM093322-04) and Cancer Prevention Institute of Texas (CPRIT, RP130624).
Supporting Information Available
Supplementary Table 1: Clinical information on the esophageal carcinoma and high-grade dysplasia samples. Supplementary Table 2. List of all glycopeptides with normalized and averaged areas with SEM values from MRM quantitation. Supplementary Table 3. List of all deglycosylated peptides with normalized and averaged areas with SEM values from MRM quantitation. Supplementary Figure 1. Number of identified glycoproteins and identified unique peptides between DF, HGD, and EAC by LAC enrichment. Supplementary Figure 2. Number of identified glycoproteins and identified unique peptides between DF, HGD, and EAC using HC-based enrichment. Supplementary Figure 3. Comparisons of number of identified glycoproteins from LC–ESI–MS/MS. Supplementary Figure 4. Gene ontology for biological process from identified glycoproteins enriched by LAC enrichment and by HC. Supplementary Figure 5. Gene ontology for cellular component from identified glycoproteins enriched by LAC enrichment and by HC. Supplementary Figure 6. Comparisons of number of targeted glycoproteins and glycosylation sites for MRM experiments and statistical evaluation. This material is available free of charge via the Internet at http://pubs.acs.org.
The authors declare no competing financial interest.
Funding Statement
National Institutes of Health, United States
Supplementary Material
References
- Mechref Y.; Hu Y.; Garcia A.; Hussein A. Identifying cancer biomarkers by mass spectrometry-based glycomics. Electrophoresis 2012, 33121755–1767. [DOI] [PMC free article] [PubMed] [Google Scholar]
- Varki A.; Kannagi R.; Toole B. P., Glycosylation Changes in Cancer. In Essentials of Glycobiology; Varki A., Cummings R. D., Esko J. D., Freeze H. H., Stanley P., Bertozzi C. R., Hart G. W., Etzler M. E., Eds.; The Consortium of Glycobiology: La Jolla, CA, 2009. [Google Scholar]
- Spiro R. G. Protein glycosylation: nature, distribution, enzymatic formation, and disease implications of glycopeptide bonds. Glycobiology 2002, 12443R–56R. [DOI] [PubMed] [Google Scholar]
- Hart G. W.; Copeland R. J. Glycomics hits the big time. Cell. 2010, 1435672–676. [DOI] [PMC free article] [PubMed] [Google Scholar]
- Moremen K. W.; Tiemeyer M.; Nairn A. V. Vertebrate protein glycosylation: diversity, synthesis and function. Nat. Rev. Mol. Cell Biol. 2012, 137448–462. [DOI] [PMC free article] [PubMed] [Google Scholar]
- Mechref Y.; Novotny M. V. Structural investigations of glycoconjugates at high sensitivity. Chem. Rev. 2002, 1022321–369. [DOI] [PubMed] [Google Scholar]
- Alley W. R. Jr.; Mann B. F.; Novotny M. V. High-sensitivity analytical approaches for the structural characterization of glycoproteins. Chem. Rev. 2013, 11342668–2732. [DOI] [PMC free article] [PubMed] [Google Scholar]
- Mechref Y.; Madera M.; Novotny M. V. Glycoprotein enrichment through lectin affinity techniques. Methods Mol. Biol. 2008, 424, 373–396. [DOI] [PubMed] [Google Scholar]
- Madera M.; Mann B.; Mechref Y.; Novotny M. V. Efficacy of glycoprotein enrichment by microscale lectin affinity chromatography. J. Sep. Sci. 2008, 31142722–2732. [DOI] [PMC free article] [PubMed] [Google Scholar]
- Zhang H.; Li X. J.; Martin D. B.; Aebersold R. Identification and quantification of N-linked glycoproteins using hydrazide chemistry, stable isotope labeling and mass spectrometry. Nat. Biotechnol. 2003, 216660–666. [DOI] [PubMed] [Google Scholar]
- Nilsson J.; Ruetschi U.; Halim A.; Hesse C.; Carlsohn E.; Brinkmalm G.; Larson G. Enrichment of glycopeptides for glycan structure and attachment site identification. Nat. Methods 2009, 611809–811. [DOI] [PubMed] [Google Scholar]
- Heo S. H.; Lee S. J.; Ryoo H. M.; Park J. Y.; Cho J. Y. Identification of putative serum glycoprotein biomarkers for human lung adenocarcinoma by multilectin affinity chromatography and LC–MS/MS. Proteomics 2007, 7234292–4302. [DOI] [PubMed] [Google Scholar]
- Hongsachart P.; Huang-Liu R.; Sinchaikul S.; Pan F. M.; Phutrakul S.; Chuang Y. M.; Yu C. J.; Chen S. T. Glycoproteomic analysis of WGA-bound glycoprotein biomarkers in sera from patients with lung adenocarcinoma. Electrophoresis 2009, 3071206–1220. [DOI] [PubMed] [Google Scholar]
- Zeng X.; Hood B. L.; Sun M.; Conrads T. P.; Day R. S.; Weissfeld J. L.; Siegfried J. M.; Bigbee W. L. Lung cancer serum biomarker discovery using glycoprotein capture and liquid chromatography mass spectrometry. J. Proteome Res. 2010, 9126440–6449. [DOI] [PMC free article] [PubMed] [Google Scholar]
- Li Q. K.; Shah P.; Li Y.; Aiyetan P. O.; Chen J.; Yung R.; Molena D.; Gabrielson E.; Askin F.; Chan D. W.; Zhang H. Glycoproteomic analysis of bronchoalveolar lavage (BAL) fluid identifies tumor-associated glycoproteins from lung adenocarcinoma. J. Proteome Res. 2013, 1283689–3696. [DOI] [PMC free article] [PubMed] [Google Scholar]
- Yang Z.; Harris L. E.; Palmer-Toy D. E.; Hancock W. S. Multilectin affinity chromatography for characterization of multiple glycoprotein biomarker candidates in serum from breast cancer patients. Clin. Chem. 2006, 52101897–1905. [DOI] [PubMed] [Google Scholar]
- Wang Y.; Ao X.; Vuong H.; Konanur M.; Miller F. R.; Goodison S.; Lubman D. M. Membrane glycoproteins associated with breast tumor cell progression identified by a lectin affinity approach. J. Proteome Res. 2008, 7104313–4325. [DOI] [PMC free article] [PubMed] [Google Scholar]
- Whelan S. A.; Lu M.; He J.; Yan W.; Saxton R. E.; Faull K. F.; Whitelegge J. P.; Chang H. R. Mass spectrometry (LC–MS/MS) site-mapping of N-glycosylated membrane proteins for breast cancer biomarkers. J. Proteome Res. 2009, 884151–4160. [DOI] [PMC free article] [PubMed] [Google Scholar]
- Drake R. R.; Schwegler E. E.; Malik G.; Diaz J.; Block T.; Mehta A.; Semmes O. J. Lectin capture strategies combined with mass spectrometry for the discovery of serum glycoprotein biomarkers. Mol. Cell. Proteomics. 2006, 5101957–1967. [DOI] [PubMed] [Google Scholar]
- Chen J.; Xi J.; Tian Y.; Bova G. S.; Zhang H. Identification, prioritization, and evaluation of glycoproteins for aggressive prostate cancer using quantitative glycoproteomics and antibody-based assays on tissue specimens. Proteomics 2013, 13152268–2277. [DOI] [PMC free article] [PubMed] [Google Scholar]
- Qin X.; Chen Q.; Sun C.; Wang C.; Peng Q.; Xie L.; Liu Y.; Li S. High-throughput screening of tumor metastatic-related differential glycoprotein in hepatocellular carcinoma by iTRAQ combines lectin-related techniques. Med. Oncol. 2013, 301420. [DOI] [PubMed] [Google Scholar]
- Ishihara T.; Fukuda I.; Morita A.; Takinami Y.; Okamoto H.; Nishimura S.; Numata Y. Development of quantitative plasma N-glycoproteomics using label-free 2-D LC-MALDI MS and its applicability for biomarker discovery in hepatocellular carcinoma. J. Proteomics 2011, 74102159–2168. [DOI] [PubMed] [Google Scholar]
- Chen R.; Tan Y.; Wang M.; Wang F.; Yao Z.; Dong L.; Ye M.; Wang H.; Zou H. Development of glycoprotein capture-based label-free method for the high-throughput screening of differential glycoproteins in hepatocellular carcinoma. Mol. Cell. Proteomics 2011, 107M110006445. [DOI] [PMC free article] [PubMed] [Google Scholar]
- Keshishian H.; Addona T.; Burgess M.; Kuhn E.; Carr S. A. Quantitative, multiplexed assays for low abundance proteins in plasma by targeted mass spectrometry and stable isotope dilution. Mol. Cell Proteomics 2007, 6122212–2229. [DOI] [PMC free article] [PubMed] [Google Scholar]
- Carr S. A.; Abbatiello S. E.; Ackermann B. L.; Borchers C.; Domon B.; Deutsch E. W.; Grant R. P.; Hoofnagle A. N.; Huttenhain R.; Koomen J. M.; Liebler D. C.; Liu T.; Maclean B.; Mani D.; Mansfield E.; Neubert H.; Paulovich A. G.; Reiter L.; Vitek O.; Aebersold R.; Anderson L.; Bethem R.; Blonder J.; Boja E.; Botelho J.; Boyne M.; Bradshaw R. A.; Burlingame A. L.; Chan D.; Keshishian H.; Kuhn E.; Kinsinger C.; Lee J. S.; Lee S. W.; Moritz R.; Oses-Prieto J.; Rifai N.; Ritchie J.; Rodriguez H.; Srinivas P. R.; Townsend R. R.; Van Eyk J.; Whiteley G.; Wiita A.; Weintraub S. Targeted Peptide Measurements in Biology and Medicine: Best Practices for Mass Spectrometry-based Assay Development Using a Fit-for-Purpose Approach. Mol. Cell. Proteomics 2014, 133907–917. [DOI] [PMC free article] [PubMed] [Google Scholar]
- Song E.; Pyreddy S.; Mechref Y. Quantification of glycopeptides by multiple reaction monitoring liquid chromatography/tandem mass spectrometry. Rapid Commun. Mass Spectrom. 2012, 26171941–1954. [DOI] [PMC free article] [PubMed] [Google Scholar]
- Mayampurath A. M.; Wu Y.; Segu Z. M.; Mechref Y.; Tang H. Improving confidence in detection and characterization of protein N-glycosylation sites and microheterogeneity. Rapid Commun. Mass Spectrom. 2011, 25142007–2019. [DOI] [PubMed] [Google Scholar]
- Mayampurath A.; Yu C. Y.; Song E.; Balan J.; Mechref Y.; Tang H. Computational framework for identification of intact glycopeptides in complex samples. Anal. Chem. 2014, 861453–463. [DOI] [PubMed] [Google Scholar]
- Sanda M.; Pompach P.; Brnakova Z.; Wu J.; Makambi K.; Goldman R. Quantitative liquid chromatography-mass spectrometry-multiple reaction monitoring (LC–MS-MRM) analysis of site-specific glycoforms of haptoglobin in liver disease. Mol. Cell. Proteomics 2013, 1251294–1305. [DOI] [PMC free article] [PubMed] [Google Scholar]
- Siegel R.; Ma J.; Zou Z.; Jemal A. Cancer statistics, 2014. Ca-Cancer J. Clin. 2014, 6419–29. [DOI] [PubMed] [Google Scholar]
- Jemal A.; Bray F.; Center M. M.; Ferlay J.; Ward E.; Forman D. Global cancer statistics. Ca-Cancer J. Clin. 2011, 61269–90. [DOI] [PubMed] [Google Scholar]
- Ferlay J.; Shin H. R.; Bray F.; Forman D.; Mathers C.; Parkin D. M. Estimates of worldwide burden of cancer in 2008: GLOBOCAN 2008. Int. J. Cancer. 2010, 127122893–2917. [DOI] [PubMed] [Google Scholar]
- Pohl H.; Sirovich B.; Welch H. G. Esophageal adenocarcinoma incidence: are we reaching the peak?. Cancer Epidemiol., Biomarkers Prev. 2010, 1961468–1470. [DOI] [PubMed] [Google Scholar]
- Shah A. K.; Saunders N. A.; Barbour A. P.; Hill M. M. Early diagnostic biomarkers for esophageal adenocarcinoma--the current state of play. Cancer Epidemiol., Biomarkers Prev. 2013, 2271185–1209. [DOI] [PubMed] [Google Scholar]
- Berven F. S.; Ahmad R.; Clauser K. R.; Carr S. A. Optimizing performance of glycopeptide capture for plasma proteomics. J. Proteome Res. 2010, 941706–1715. [DOI] [PMC free article] [PubMed] [Google Scholar]
- Chen R.; Jiang X.; Sun D.; Han G.; Wang F.; Ye M.; Wang L.; Zou H. Glycoproteomics analysis of human liver tissue by combination of multiple enzyme digestion and hydrazide chemistry. J. Proteome Res. 2009, 82651–661. [DOI] [PubMed] [Google Scholar]
- Balsera M. A.; Wriggers W.; Oono Y.; Schulten K. Principal Component Analysis and Long Time Protein Dynamics. J. Phys. Chem. 1996, 10072567–2572. [Google Scholar]
- Mechref Y.; Hussein A.; Bekesova S.; Pungpapong V.; Zhang M.; Dobrolecki L. E.; Hickey R. J.; Hammoud Z. T.; Novotny M. V. Quantitative serum glycomics of esophageal adenocarcinoma and other esophageal disease onsets. J. Proteome Res. 2009, 862656–2666. [DOI] [PMC free article] [PubMed] [Google Scholar]
- Hu Y.; Desantos-Garcia J. L.; Mechref Y. Comparative glycomic profiling of isotopically permethylated N-glycans by liquid chromatography/electrospray ionization mass spectrometry. Rapid Commun. Mass Spectrom. 2013, 278865–877. [DOI] [PMC free article] [PubMed] [Google Scholar]
- Narayanan S. Sialic acid as a tumor marker. Ann. Clin. Lab. Sci. 1994, 244376–384. [PubMed] [Google Scholar]
- Miyoshi E.; Moriwaki K.; Nakagawa T. Biological function of fucosylation in cancer biology. J. Biochem. 2008, 1436725–729. [DOI] [PubMed] [Google Scholar]
- Madera M.; Mechref Y.; Klouckova I.; Novotny M. V. High-sensitivity profiling of glycoproteins from human blood serum through multiple-lectin affinity chromatography and liquid chromatography/tandem mass spectrometry. J. Chromatogr., B 2007, 8451121–137. [DOI] [PubMed] [Google Scholar]
- Drake P. M.; Schilling B.; Niles R. K.; Braten M.; Johansen E.; Liu H.; Lerch M.; Sorensen D. J.; Li B.; Allen S.; Hall S. C.; Witkowska H. E.; Regnier F. E.; Gibson B. W.; Fisher S. J. A lectin affinity workflow targeting glycosite-specific, cancer-related carbohydrate structures in trypsin-digested human plasma. Anal. Biochem. 2011, 408171–85. [DOI] [PMC free article] [PubMed] [Google Scholar]
- Pan S.; Wang Y.; Quinn J. F.; Peskind E. R.; Waichunas D.; Wimberger J. T.; Jin J.; Li J. G.; Zhu D.; Pan C.; Zhang J. Identification of glycoproteins in human cerebrospinal fluid with a complementary proteomic approach. J. Proteome Res. 2006, 5102769–2779. [DOI] [PubMed] [Google Scholar]
- McDonald C. A.; Yang J. Y.; Marathe V.; Yen T. Y.; Macher B. A. Combining results from lectin affinity chromatography and glycocapture approaches substantially improves the coverage of the glycoproteome. Mol. Cell. Proteomics 2009, 82287–301. [DOI] [PMC free article] [PubMed] [Google Scholar]
- Andersen J. D.; Boylan K. L. M.; Xue F. S.; Anderson L. B.; Witthuhn B. A.; Markowski T. W.; Higgins L.; Skubitz A. P. N. Identification of candidate biomarkers in ovarian cancer serum by depletion of highly abundant proteins and differential in-gel electrophoresis. Electrophoresis 2010, 314599–610. [DOI] [PMC free article] [PubMed] [Google Scholar]
- Wu J.; Xie X.; Nie S.; Buckanovich R. J.; Lubman D. M. Altered Expression of Sialylated Glycoproteins in Ovarian Cancer Sera Using Lectin-based ELISA Assay and Quantitative Glycoproteomics Analysis. J. Proteome Res. 2013, 1273342–3352. [DOI] [PubMed] [Google Scholar]
- O’Donnell L. C.; Druhan L. J.; Avalos B. R. Molecular characterization and expression analysis of leucine-rich alpha2-glycoprotein, a novel marker of granulocytic differentiation. J. Leukocyte Biol. 2002, 723478–485. [PubMed] [Google Scholar]
- Olivier E.; Soury E.; Ruminy P.; Husson A.; Parmentier F.; Daveau M.; Salier J. P. Fetuin-B, a second member of the fetuin family in mammals. Biochem. J. 2000, 350Pt 2589–597. [PMC free article] [PubMed] [Google Scholar]
- Baldo A.; Sniderman A. D.; St-Luce S.; Avramoglu R. K.; Maslowska M.; Hoang B.; Monge J. C.; Bell A.; Mulay S.; Cianflone K. The adipsin-acylation stimulating protein system and regulation of intracellular triglyceride synthesis. J. Clin. Invest. 1993, 9231543–1547. [DOI] [PMC free article] [PubMed] [Google Scholar]
- Cui W.; Simaan M.; Laporte S.; Lodge R.; Cianflone K. C5a- and ASP-mediated C5L2 activation, endocytosis and recycling are lost in S323I-C5L2 mutation. Mol. Immunol. 2009, 46153086–3098. [DOI] [PubMed] [Google Scholar]
- Ehlers M. R. Immune-modulating effects of alpha-1 antitrypsin. Biol. Chem. 2014, 10.1515/hsz-2014-0161. [DOI] [PMC free article] [PubMed] [Google Scholar]
- Tokugawa Y.; Kunishige I.; Kubota Y.; Shimoya K.; Nobunaga T.; Kimura T.; Saji F.; Murata Y.; Eguchi N.; Oda H.; Urade Y.; Hayaishi O. Lipocalin-type prostaglandin D synthase in human male reproductive organs and seminal plasma. Biol. Reprod. 1998, 582600–607. [DOI] [PubMed] [Google Scholar]
- Zhou Y.; Shaw N.; Li Y.; Zhao Y.; Zhang R.; Liu Z. J. Structure-function analysis of human l-prostaglandin D synthase bound with fatty acid molecules. FASEB J. 2010, 24124668–4677. [DOI] [PubMed] [Google Scholar]
- Tsai H. Y.; Boonyapranai K.; Sriyam S.; Yu C. J.; Wu S. W.; Khoo K. H.; Phutrakul S.; Chen S. T. Glycoproteomics analysis to identify a glycoform on haptoglobin associated with lung cancer. Proteomics 2011, 11112162–2170. [DOI] [PubMed] [Google Scholar]
- Wang D.; Hincapie M.; Rejtar T.; Karger B. L. Ultrasensitive characterization of site-specific glycosylation of affinity-purified haptoglobin from lung cancer patient plasma using 10 mum i.d. porous layer open tubular liquid chromatography-linear ion trap collision-induced dissociation/electron transfer dissociation mass spectrometry. Anal. Chem. 2011, 8362029–2037. [DOI] [PMC free article] [PubMed] [Google Scholar]
- Ye B.; Cramer D. W.; Skates S. J.; Gygi S. P.; Pratomo V.; Fu L.; Horick N. K.; Licklider L. J.; Schorge J. O.; Berkowitz R. S.; Mok S. C. Haptoglobin-alpha subunit as potential serum biomarker in ovarian cancer: identification and characterization using proteomic profiling and mass spectrometry. Clin. Cancer Res. 2003, 982904–2911. [PubMed] [Google Scholar]
- Lin Z.; Simeone D. M.; Anderson M. A.; Brand R. E.; Xie X.; Shedden K. A.; Ruffin M. T.; Lubman D. M. Mass spectrometric assay for analysis of haptoglobin fucosylation in pancreatic cancer. J. Proteome Res. 2011, 1052602–2611. [DOI] [PMC free article] [PubMed] [Google Scholar]
- Tolosano E.; Altruda F. Hemopexin: structure, function, and regulation. DNA Cell Biol. 2002, 214297–306. [DOI] [PubMed] [Google Scholar]
- Debruyne E. N.; Vanderschaeghe D.; Van Vlierberghe H.; Vanhecke A.; Callewaert N.; Delanghe J. R. Diagnostic value of the hemopexin N-glycan profile in hepatocellular carcinoma patients. Clin. Chem. 2010, 565823–831. [DOI] [PubMed] [Google Scholar]
- Osaki S.; Johnson D. A.; Frieden E. The possible significance of the ferrous oxidase activity of ceruloplasmin in normal human serum. J. Biol. Chem. 1966, 241122746–2751. [PubMed] [Google Scholar]
- Senra Varela A.; Lopez Saez J. J.; Quintela Senra D. Serum ceruloplasmin as a diagnostic marker of cancer. Cancer Lett. 1997, 1212139–145. [DOI] [PubMed] [Google Scholar]
Associated Data
This section collects any data citations, data availability statements, or supplementary materials included in this article.