

Abstract
Clear cell renal cell carcinoma is the most prevalent of all reported kidney cancer cases, and currently there are no markers for early diagnosis. This has stimulated great research interest recently because early detection of the disease can significantly improve the low survival rate. Combining the proteome, glycoproteome, and N-glycome data from clear cell renal cell carcinoma plasma has the potential of identifying candidate markers for early diagnosis and prognosis and/or to monitor disease recurrence. Here, we report on the utilization of a multi-dimensional fractionation approach (12P-M-LAC) and LC–MS/MS to comprehensively investigate clear cell renal cell carcinoma plasma collected before (disease) and after (non-disease) curative nephrectomy (n = 40). Proteins detected in the subproteomes were investigated via label-free quantification. Protein abundance analysis revealed a number of low-level proteins with significant differential expression levels in disease samples, including HSPG2, CD146, ECM1, SELL, SYNE1, and VCAM1. Importantly, we observed a strong correlation between differentially expressed proteins and clinical status of the patient. Investigation of the glycoproteome returned 13 candidate glycoproteins with significant differential M-LAC column binding. Qualitative analysis indicated that 62% of selected candidate glycoproteins showed higher levels (upregulation) in M-LAC bound fraction of disease samples. This observation was further confirmed by released N-glycans data in which 53% of identified N-glycans were present at different levels in plasma in the disease vs non-disease samples. This striking result demonstrates the potential for significant protein glycosylation alterations in clear cell renal cell carcinoma cancer plasma. With future validation in a larger cohort, information derived from this study may lead to the development of clear cell renal cell carcinoma candidate biomarkers.
Keywords: Glycoproteomics, glycomics, N-glycans, lectins, multi-lectin affinity chromatography
1. Introduction
Kidney (renal) cancer, which includes renal cell carcinomas and transitional cell carcinomas of the renal pelvis, is estimated to have caused 13 680 deaths (8780 men and 4900 women) in 2013. Clear cell renal cell carcinoma (ccRCC) is the most common subtype of kidney cancer, contributing approximately 80% of all reported cases, whereas the papillary and chromophobe subtypes contribute 15 and 5%, respectively.1
Currently, there are no biomarkers for ccRCC early diagnosis, and the standard method of treatment (i.e., surgery) is unsatisfactory. This is because patients undergoing surgery are likely to relapse at a rate of 20–50% and have a higher chance of developing metastatic tumor, which is incurable.2,3 Therefore, there is the urgent need to identify biomarkers for early detection and to predict or monitor the recurrence of ccRCC after surgery.
The complexity (dynamic range of approximately 1012) of the plasma proteome is of great concern in biomarker discovery studies. This is because tissue and secreted cell surface protein products, which are indicators of a disease and/or healthy state, are of low abundance in blood plasma. For example, current clinical biomarkers including prostate specific antigen (PSA) and Her2/neu are present at low nanograms per milliliter concentration in plasma,4 and the ability to identify such molecular markers requires a comprehensive multi-dimensional analytical approach.
Several analytical platforms have been devised to overcome plasma complexity. One such method is targeted enrichment of glycosylated proteins. This approach is sensitive and specific because it involves the characterization of a subpopulation of proteins whose alterations are associated with many diseases, including cancer.5 Protein glycosylation is one of the most diverse and frequently occurring post-translational modifications involved in a number of cell processes,6 and aberrant changes in glycosylation profile during the development and progression of cancer is known. Another method is immuno-affinity depletion, which targets the removal of high-abundance proteins, enabling a deeper mining of low-level proteins. These strategies have been used either alone or in combination to enhance protein biomarker discovery studies.
A number of groups have reported the use of high-abundance proteins depletion and enrichment of target glycoproteins and have observed differential protein expression and alterations in protein glycosylation in cancer samples.7−10 These observations suggest that the integration of protein depletion and enrichment of target glycoproteins enhance proteomics and glycoproteomics studies, leading to the identification of potential candidate markers.
ccRCC plasma biomarker discovery is lagging behind other disease studies, although early diagnosis of ccRCC can lead to a cure by surgery. To date, only a handful of ccRCC plasma proteomics biomarker discovery studies have been reported,7,11 and there are not yet any reports on N-glycan profiles in the literature to the best of our knowledge. Therefore, we attempted to use a comprehensive comparative omics approach, namely, proteomics, glycoproteomics, and N-glycomics, to study ccRCC plasma before (disease) and after (non-disease) curative nephrectomy, and we evaluated the alterations associated with histological status. Our goal was to identify potential candidate markers of biological interest in ccRCC development and their potential utility to monitor ccRCC recurrence after curative nephrectomy.
Our laboratory previously developed an automated high-throughput multi-lectin affinity chromatography (HP-M-LAC) platform that combines two high-abundance proteins (albumin and IgG) depletion and multi-lectins (Con A, WGA, and JAC) fractionation.12 In the current study, we have expanded the HP-M-LAC approach to incorporate 12 high-abundance proteins depletion (12P) and multi-lectins (Sambucus nigra (SNA), Aleuria aurantia (AAL), and Phytohemagglutinin-L (PHA-L)) enrichment with the overall goal of improving the proteomic and/or glycoproteomic depth. AAL, SNA, and PHA-L lectins have specificities toward core (α1,6) fucose,13 sialic acid, and N-acetyl glucosamine14 as well as highly branched glycans of terminal galactose and mannose15 oligosaccharides. These lectins were selected to capture the population of glycan structures frequently implicated in cancer progression and metastasis.16−21 Nano-LC–MS/MS analysis of trypsin-digested, 12P-depleted plasma and M-LAC fractions (bound and unbound) enabled relative quantification via spectral counting.8 Furthermore, N-glycans released from M-LAC fractions were profiled, and detailed structural annotation was conducted. We identified several low-abundance proteins and glycoproteins with significant differential abundance levels in ccRCC cancer samples. Glycosylation alterations in cancer plasma (before) compared to noncancer plasma (after) were evident on the basis of glycoproteins differential binding to the M-LAC column and N-glycan profiles.
2. Materials and Methods
2.1. Materials
Capture select 12P depletion resin and PEEK columns were purchased from Life Technology (Milford, MA). Gravity omnifit glass column was provided by Biochem Fluidics (Boonton, NJ). POROS R1 50 μm bulk media (reversed-phase packing) and HPLC self-packing device were purchased from Applied Biosystems (Framingham, MA). All lectins were obtained from Vector Laboratories (Burlingame, CA). Sequencing grade modified trypsin was purchased from Promega (Madison, WI). Bis-Tris sodium dodecyl sulfate polyacrylamide gel electrophoresis (SDS-PAGE) gels (4–12%) and NuPAGE MES SDS running buffer (10×) were purchased from Invitrogen (Carlsbad, CA). HPLC-MS grade water, formic acid, acetonitrile, and other buffer reagents were all purchased from Thermo Fisher Scientific (Waltham, MA).
2.2. Sample Population
Clear cell renal cell carcinoma (ccRCC) patients enrolled in this study gave their consent via protocols 01-130 approved by the Institutional Review Board at Massachusetts General Hospital and provided to us by Dr. Othon Iliopoulos’s laboratory at Massachusetts General Hospital. Twenty ccRCC plasma samples before nephrectomy and 20 ccRCC plasma samples after nephrectomy were pooled to give one disease (RCC (+)) and one non-disease (RCC (−)) sample. Pooling was necessary for this discovery study due to the limited amount of samples and also to reduce variability among patients. Pooled plasma samples were stored in −80 °C and did not undergo more than two freeze/thaw cycles.
2.3. High-Abundance Proteins Depletion and Glycoprotein Affinity Fractionation
An automated HPLC platform used for high-abundance protein depletion and glycoprotein fractionation has been described previously,12 and we have applied this fractionation platform with moderate changes. Briefly, pooled plasma samples were depleted using a 12 (albumin, IgG, IgM, IgA, free light chains, fibrinogen, transferrin, α1 antitrypsin, apolipoprotein A1, α2 macroglobulin, haptoglobin, and α1 acid glycoprotein) abundance protein depletion column packed in-house into a PEEK column (4.6 mm × 100 mm) followed by glycoprotein fractionation with a multi-lectin affinity column (M-LAC) containing equal mixtures of lectins: Aleuria aurantia lectin (AAL), Sambucus nigra lectin (SNA), and Phaseolus vulgaris leucoagglutinin (PHA-L). Eluted fractions were desalted on a R1 reversed-phase column. Three columns (12P, M-LAC, and R1 reversed phase), each attached to a separate valve, were connected in series on a two-dimensional HPLC system (Shimadzu, Columbia, MD) equipped with an on/off switch to control the valves. During sample fractionation, the columns were first equilibrated with a binding buffer (25 mM Tris, 0.5 M sodium chloride, 1 mM MnCl2, 1 mM CaCl2, and 0.05% sodium azide, pH 7.4) at a flow rate of 2.0 mL/min for 15 min followed by plasma loading at a flow rate of 0.5 mL/min for 25 min. Depleted plasma (12P unbound), M-LAC bound, and M-LAC unbound fractions were eluted separately via valve switching and desalted on an R1 reversed-phase column using a 70% solvent B (0.1% trifluoroacetic acid in acetonitrile) and 30% solvent A (0.1% trifluoroacetic acid in Milli-Q water) gradient. Elution buffers for 12P depletion and M-LAC fractions were 0.1 M glycine (pH 2.5) and 0.1 M acetic acid (pH 2.5), respectively. Total protein concentration measurements of all collected fractions were performed using Qubit fluorescence assay (Life Technologies, Inc., Carlsbad, CA) following the manufacturer’s instructions.
2.4. N-Glycan Release and LC–ESI–MS Analysis
N-Linked glycans were isolated using a previously described method.22 Briefly, 20 μg of total protein per sample (2 analytical replicates of each fraction) was brought to 100 μL volume with ultrapure water and 9 volumes of acetone added followed by overnight precipitation at −20 °C. Precipitated proteins were centrifuged briefly, acetone was removed, and the samples were speed vacuumed to dryness followed by resolubilization of the protein pellet in 10 μL urea (8 M). The protein solution was dot blotted onto a 100% (v/v) methanol-activated PVDF membrane (Millipore) surface and dried at room temperature. Protein spots were visualized using Direct Blue 71 (Sigma-Aldrich) and destained with 40% (v/v) ethanol and 10% (v/v) acetic acid. Protein spots were excised and placed into separate wells of a 96-well plate. The membrane was then blocked with 1% (w/v) PVP40 solution followed by 3 washes of 5 min each with water. PNGase F (2.5 U; Flavobacterium meningospeticum, Roche) was added, and the mixture was incubated at 37 °C for 15 min and further incubated at 37 °C overnight after an additional 10 μL of water was added. N-Glycans were extracted in the following fashion: 5 min sonication of the 96-well plate containing glycans and three washes with 20 μL of water. Supernatants from the washes were pooled into one Eppendorf tube for individual samples. Samples were acidified with 10 μL of 100 mM ammonium acetate (pH 5) and incubated at room temperature for 1 h. Samples were subsequently dried via speed vacuum and reduced with 20 μL of 1 M NaBH4 in 50 mM KOH at 50 °C for 3 h. The reaction was stopped by addition of 2 μL of acetic acid and desalted using AG 50W X8 cation exchange resin (Bio-Rad). Desalted samples were collected in water and dried by vacuum centrifugation. Methanol was added to remove any residual borate and allowed to evaporate in the vacuum centrifuge. This step was repeated four or five times until the white residue disappeared. Desalted samples were kept at −80 °C if not used immediately. Separation of the N-glycan alditols was performed using a Hypercarb PGC (5 μm Hypercarb, 180 μ × 100 mm; Thermo Fisher Scientific) connected on the HPLC system (Agilent 1100) over an 85 min gradient from 0 to 45% acetonitrile in 10 mM ammonium bicarbonate, and eluted N-glycans were analyzed in an ESI–MS/MS on a Agilent MSD three-dimensional ion-trap XCT Plus mass spectrometer. Settings for the MS/MS were as follows: drying gas flow, 7 L/min; drying gas temperature, 325 °C; nebulizer gas, 18 psi; skimmer, −40.0 V; trap drive, −99.1 V; and capillary exit, −166 V. Smart fragmentation was used with starting and ending amplitudes of 30 and 200, respectively. Ions were detected in ion charge control targeted at 100 000 ions with a maximum accumulation time of 200 ms. MS spectra were obtained in negative ion mode with two scan events: a full scan range between m/z 100 and 2200 at a scan speed of 8100 m/z/s and a dependent MS/MS scan after CID of the top two most intense precursor ions with threshold 30 000 and relative threshold of 5% base peak. Dynamic inclusion was inactivated for MS/MS of closely eluting glycans. Precursors were observed mainly in charged states −1 and/or −2. Mass accuracy calibration of instrument was performed using tuning mix (Agilent), and N-glycans released from bovine fetuin served as positive controls before each data set run.
2.5. Gel Nano-LC–MS/MS Proteomic and Glycoproteomic Analysis
Twenty micrograms of total protein from the depleted plasma and M-LAC fractions was resolved on a 4–12% Bis-Tris SDS-PAGE gel (Novex NuPAGE, Life Technologies) followed by trypsin (Promega, Madison, WI) digestion of the excised gel pieces as previously described.23 Briefly, lanes were cut into four bands, and each band was cut into 1 × 1 mm2 pieces. Gel pieces were trypsin (0.04 μg/μL) digested following destaining with 50 mM ammonium bicarbonate buffer at pH 8.0 and acetonitrile, reduction (25 mM dithiothreitol) at 56 °C for 30 min, and alkylation (50 mM iodoacetamide) at room temperature for 30 min in darkness. Trypsin digests were extracted with 100 μL of 50% (v/v) acetonitrile/0.1% (v/v) formic acid in HPLC grade water three times and speed vacuumed to dryness. Mass spectrometry analysis of depleted plasma and M-LAC fractions was performed on an LTQ-Orbitrap Elite instrument (Thermo Fisher Scientific, Waltham, MA) equipped with an Ultimate 3000 HPLC (LC Packings-Dionex, Marlton, NJ) and nano-ESI source. A reversed-phase C18 column packed in-house with a 75 μm metal spray tip (Michrom Bioresources, Auburn, CA) was used. Peptides were separated at a flow rate of 200 nL/min on the C18 column using the following 100 min gradient: 5–40% buffer B for 80 min, 40–90% buffer B for 15 min, and 90–2% buffer B for 5 min. Mobile phase A consisted of 0.1% v/v formic acid in HPLC grade water, and mobile phase B consisted of 0.1% v/v formic acid in acetonitrile. The mass spectrometer was operated in a data-dependent mode, with the 8 most abundant precursor ions selected for collision induced dissociation (CID) MS/MS fragmentation in a full MS scan range of m/z 400–2000 with a mass resolution of 120 000. Dynamic exclusion parameters were set to 1 repeat count (repeat duration, 30 s; exclusion list size, 100; exclusion duration, 45 s; and exclusion mass width, 1.0 m/z low and 1.50 m/z high).
2.6. Data Processing and Statistical Analysis
Analysis of N-glycan data was performed using ESI-Compass 1.3 (Bruker Daltonics). Monoisotopic masses obtained were searched against GlycoMod (http://web.expasy.org/glycomod/) for possible glycan compositions and subsequently verified by their corresponding MS/MS spectra. The relative abundance of each glycan in a sample was determined using the peak area of each glycan against the sum of peak areas of all glycans from extracted ion chromatograms, which has been shown to be a reasonably accurate method for relative N-glycan quantitation.24 LC–MS/MS proteomic and glycoproteomic data were searched against an annotated human database (release 2013_1; 34 157 entries) using the SEQUEST algorithm (Thermo Electron Corp, San Jose, CA) in the Thermo Fisher Proteome Discoverer 1.4 suite. Peptide identification was based on the HUPO criteria, which included ΔCn ≥ 0.1, peptide probability < 0.001, and Xcorr ≥ 1.9, 2.5, and 3.8 for singly, doubly, and triply charged ions, respectively. Confidence in identification was further increased by applying the reverse database with a false discovery rate (FDR) targeted at 1% at the peptide level. Other search parameters included a maximum of 2 missed cleavages, full trypsin as enzyme, carbamidomethylation on cysteine as a static modification, and deamidation of asparagine as a dynamic modification; precursor ion mass tolerance and fragment ion mass tolerance were set at 5 ppm and 0.8 Da, respectively. PANTHER (Protein ANalysis THrough Evolutionary Relationships) database (http://pantherdb.org/) was used for gene ontology classification. A label free semiquantitative method using spectral count was applied to select proteins of interest with abundance changes and was used to evaluate M-LAC differential binding in RCC samples as previously described.8 Briefly, ratios of spectral count in disease to spectral count in non-disease allowed us to select proteins with potential abundance level changes after normalization with a reference ratio calculated from total spectral counts. Glycoprotein candidates with M-LAC differential binding were selected on the basis of the ratios of the spectral count of the M-LAC bound fraction considered theoretical (non-disease_Bound measured × (disease_Unbound measured/non-disease_Unbound measured)) to the spectral counts of the experimental M-LAC bound fraction (disease_Bound). In instances where no peptides (0) were observed for a particular protein under consideration, 1 was added for meaningful ratio calculations. Proteins or glycoproteins with a fold change ≥ 3 or ≤ 3 were identified as differentially expressed. Excel software (Microsoft Office 2010) was used to generate p-values by calculating standard Student’s t-test and to investigate N-glycome and N-glycoproteome differential expression by considering p-values ≤ 0.05 as statistically significant.
3. Results and Discussion
3.1. Analytical Strategy
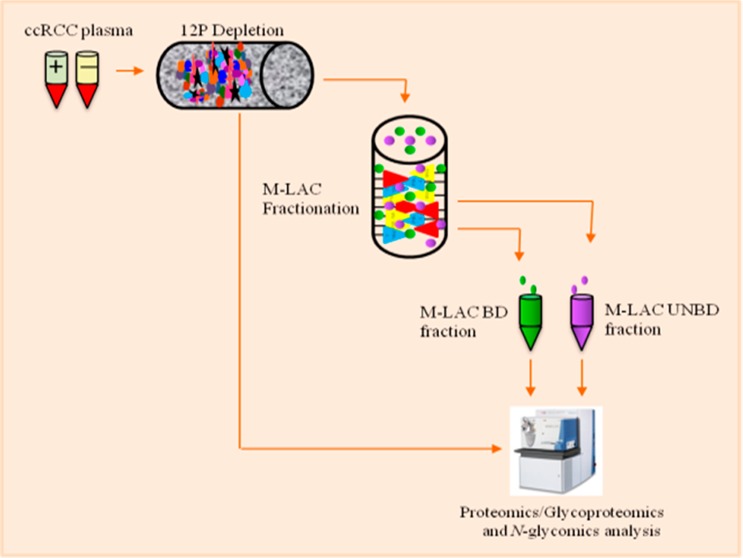
The global profiles of the proteome, glycoproteome, and N-glycome of ccRCC plasma were achieved by designing an analytical strategy that focused on deeper mining of low-abundance disease-associated nonglycoproteins, glycoproteins, and N-glycans (Figure 1). In our previous publications, we have shown that a multi-dimensional platform is a valuable approach to comprehensively characterize the proteome and glycoproteome of biological samples to enhance the identification of potential biomarker candidates present at low amounts.8,23,25 In the current study, plasma samples were initially purified to reduce the large dynamic range of plasma concentration by depleting the top 12 high-abundance proteins (12P). Furthermore, a semitargeted approach was used as a second fractionation strategy, in which equal mixtures of three lectins, Aleuria aurantia (AAL), Sambucus nigra (SNA), and Phaseolus vulgaris leucoagglutinin (PHA-L), were packed into an HPLC PEEK column to enrich the subglycoproteome. Lectins have previously been used to target glycan structures commonly altered in carcinogenesis.10,26,27 In a serum breast cancer proteomic study, Zeng et al. observed that differential protein affinities toward selected lectins was indicative of changes in glycan expression level in cancer versus control samples.8 Similarly, Abbott et al. used PHA-L lectin to capture potential breast carcinoma biomarkers elevated in breast carcinoma tissues at different stages.10
Figure 1.

Experimental workflow showing the process used in the characterization of clear cell renal cell carcinoma plasma (ccRCC). ccRCC plasma samples were depleted of the top 12 most highly abundant proteins followed by glycoproteins enrichment and LC–MS/MS analysis of depleted plasma and M-LAC of bound and unbound fractions.
In this study, we focused on 40 plasma samples obtained from 20 patients diagnosed with clear cell renal cell carcinoma (Supporting Information Table S1). Plasma samples taken before (RCC (+)) and after (RCC (−)) curative nephrectomy were pooled into two groups: disease (before nephrectomy, n = 20) and non-disease (after nephrectomy, n = 20). Pooling was necessary to reduce patient variability28 and to improve the effective depletion of plasma while increasing protein detection coverage as previously established.23 Also, pooling allowed for a sufficient amount of samples to be available for two analytical replicates of each omic analysis. 12P-depleted plasma and M-LAC fractions were subjected to proteomics, glycoproteomics, and N-glycomic analysis using analytical platforms described in the Materials and Methods.
3.2. The 12P-M-LAC Analytical Platform
Advances in proteomic analysis have pointed out the importance of minimizing interference from high-abundance proteins that may mask and/or prevent the detection of low-level proteins in disease samples.23,29 Therefore, an analytical technology that improves the identification of low-level proteins and increases the depth of proteomic data is desirable.
In the current study, we utilized a developed 12P-M-LAC fractionation platform and evaluated its performance in replicate analysis using reference plasma (Bioreclamation, Jericho, NY). First, the loading capacity of the platform was investigated to ensure minimal run-to-run carry over and sample losses, and 25 μL of reference plasma volume was determined to be the optimal loading amount. We then used the optimized loading amount to assess the platform based on total protein recoveries, reproducibility, and efficiency. The total protein recovery measurements using BCA assay (Thermo Scientific) showed an average of 92% of the starting material (data not shown), which agrees with an earlier report.12 Similarly, Coomassie Blue stained gels for three analytical replicates of 12P column target (bound) proteins and M-LAC fractions revealed an identical band pattern and band intensity in replicate samples, indicating good reproducibility of analytical replicates (Supporting Information Figure 1). Furthermore, we observed gel band differences in the M-LAC bound and unbound fractions, suggesting that the M-LAC column fractionates the glycoproteome into subpopulations.
3.3. Overview of Proteomics and Glycoproteomics Data
12P-depleted plasma fractions were analyzed to evaluate protein abundance changes in proteomics analysis using 1D SDS-PAGE and nano-LC–MS/MS. Similarly, glycoproteomics of 12P-M-LAC bound and unbound fractions enabled the evaluation of proteins with potential glycosylation changes. Overall, 215 and 248 unique proteins were identified from two analytical replicates in the proteomic and glycoproteomic analyses, respectively. All proteins reported were identified with 99% confidence (1% FDR) and ≥2 unique peptides (Supporting Information Table S2). One peptide hit proteins were not included in the data analysis. Details of the distribution of proteins and peptides are presented in Supporting Information Table S3. Low-abundance glycoproteins and non-glycoproteins identified fell into one of the following functional classification: proteases, lipid associated proteins, cytoskeletal associated proteins, and complement factors; these functional categories have recently been reported to correlate with disease states.25,30
3.4. Quantification and Selection of Differentially Expressed Proteins Present in 12P-Depleted ccRCC Plasma Proteome
A label-free semiquantitation method based on spectral counts was utilized to quantify proteins expressed at different amounts in ccRCC plasma samples as previously described.8 Briefly, 1D gel-nano-LC–MS/MS analysis was performed on equal amounts of 12P-depleted plasma samples followed by data normalization using a reference ratio factor (total peptide hits of disease/total peptide hits of control), as detailed in Section 2.6. The data was normalized to reduce variations introduced during sample preparation. In addition, spectral counts were validated by measurements of peak areas of extracted ion chromatograms and manual inspection of MS/MS spectra in random selected cases, as shown in earlier published work.9,23
Differentially expressed proteins were selected on the basis of ratios of spectral count fold changes observed between RCC (+) and RCC (−) after normalization. Potential candidate markers were selected if they were detected in two analytical replicates and exhibited ≥ 3 or ≤ 3 fold changes, p ≤ 0.05. As shown in Table 1, the majority (approximately 74%) of potential candidate markers were upregulated in the disease proteome. These include lipid transport and metabolic process proteins (e.g., cholesteryl ester transfer protein, apolipoprotein F, apolipoprotein L1, and phospholipid transfer protein), immune system process proteins (e.g., basement membrane-specific heparan sulfate proteoglycan core protein, coagulation factor XI, and prostaglandin D2 synthase (21kD) brain), and signal transduction proteins (e.g., cell surface glycoprotein MUC18, pantetheinase, and junction plakoglobin). We used the gene ontology (GO) classification system to characterize both the biological process and molecular function of selected potential candidate markers (Figure 2A,B).
Table 1. List of Proteins with Significant Abundance Changes in ccRCC 12P-Depleted Fraction.
| gene name | description | disease* | control* | abundance changes | glycosylation status (PTM) | renal and/or cancer significance |
|---|---|---|---|---|---|---|
| YWHAZ | 14-3-3 protein zeta/delta | 2 | 14 | ↓ | no | N/A |
| ADIPOQ | adiponectin | 1 | 10 | ↓ | yes | √ √ |
| APOF | apolipoprotein F | 11 | 1 | ↑ | yes | N/A |
| APOL1 | apolipoprotein L1 | 16 | 2 | ↑ | no | √ √ |
| ATRN | attractin | 2 | 76 | ↓ | yes | √ |
| HSPG2 | basement membrane-specific heparan sulfate proteoglycan core protein | 94 | 2 | ↑ | yes | √ √ |
| CD146 | cell surface glycoprotein MUC18 | 34 | 2 | ↑ | yes | √ √ |
| CETP | cholesteryl ester transfer protein | 10 | 1 | ↑ | yes | √ √ |
| F11 | coagulation factor XI | 19 | 3 | ↑ | yes | √ |
| C4B | complement component C4B (Childo blood group) | 57 | 2 | ↑ | yes | √ √ |
| DSP | desmoplakin | 123 | 5 | ↑ | no | √ |
| ECM1 | extracellular matrix protein 1 | 21 | 3 | ↑ | yes | √ |
| FBLN1 | fibulin-1 | 13 | 1 | ↑ | yes | √ |
| GPX3 | glutathione peroxidase 3 | 9 | 1 | ↑ | no | √ √ |
| HIST2H2AC | histone H2A type 2-C | 16 | 3 | ↑ | no | N/A |
| HIST1H2BM | histone H2B type 1-M | 8 | 1 | ↑ | yes | N/A |
| HIST1H3D | histone H3.1 | 9 | 1 | ↑ | no | √ |
| HIST1H4I | histone H4 | 8 | 1 | ↑ | no | √ |
| HABP2 | isoform 2 of hyaluronan-binding protein 2 | 5 | 33 | ↓ | yes | √ √ |
| CRTAC1 | isoform 3 of cartilage acidic protein 1 | 18 | 2 | ↓ | yes | N/A |
| FN1 | isoform 5 of fibronectin | 68 | 3 | ↓ | yes | N/A |
| JUP | junction plakoglobin | 22 | 3 | ↑ | no | √ √ |
| SELL | L-selectin | 16 | 1 | ↑ | yes | √ √ |
| LYVE1 | lymphatic vessel endothelial hyaluronic acid receptor 1 | 15 | 2 | ↑ | yes | √ |
| PGLYRP2 | N-acetylmuramoyl-l-alanine amidase | 7 | 1 | ↑ | yes | √ |
| SYNE1 | nesprin-1 | 230 | 9 | ↑ | no | √ √ |
| VNN1 | pantetheinase | 17 | 2 | ↑ | yes | √ |
| GPLD1 | phosphatidylinositol-glycan-specific phospholipase D | 14 | 1 | ↑ | yes | √ |
| PLTP | phospholipid transfer protein | 21 | 4 | ↑ | yes | N/A |
| YTHDC2 | probable ATP-dependent RNA helicase YTHDC2 | 2 | 36 | ↓ | no | N/A |
| PTGDS | prostaglandin D2 synthase (21kD, brain) | 9 | 1 | ↑ | yes | √ √ |
| SERPINA10 | protein Z-dependent protease inhibitor | 21 | 1 | ↑ | yes | √ √ |
| ROCK2 | Rho-associated protein kinase 2 | 56 | 3 | ↑ | no | √ |
| SHBG | sex hormone-binding globulin | 1 | 17 | ↓ | yes | √ |
| PTPN23 | tyrosine-protein phosphatase nonreceptor type 23 | 3 | 24 | ↓ | no | √ |
| VCAM1 | vascular cell adhesion protein 1 | 25 | 1 | ↑ | yes | √ √ |
| VCAM1 | vitamin K-dependent protein C heavy chain | 15 | 2 | ↑ | yes | √ √ |
| MAGI3 | membrane-associated guanylate kinase, WW and PDZ domain-containing protein 3 | 3 | 51 | ↓ | no | √ |
| BARD1 | BRCA1-associated RING domain protein 1 | 12 | 1 | ↑ | no | √ |
Average spectral count of two technical replicates. For meaningful ratio calculations, proteins with no spectral counts were replaced with one (1). ↓, downregulation; ↑, upregulation; N/A, not identified
Figure 2.
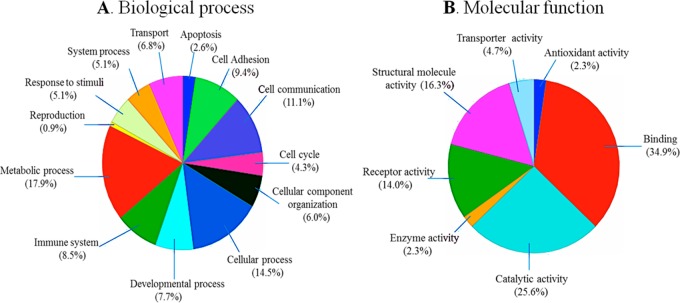
GO functional classification of selected differentially expressed proteins. (A) Molecular function classification, and (B) biological process classification. The abundance of both molecular function and biological process is represented by their relative percentage. PANTHER, a free online database, was used for this characterization.
Upon further exploration, we established disease associations and glycosylation status of potential candidate markers using Novoseek, a data mining tool resident in the GeneCards repository (www.genecards.org). The Novoseek score, which defines the relevance of the disease to the gene/protein, is based on their literature text-mining algorithms. Disease associations were established on the basis of their scores: the higher the score, the more significant the protein is to the disease. Two unique observations were made: (1) a strong correlation among potential candidate markers and various kidney and cancer diseases was found and (2) the majority of potential candidate markers are glycosylated (Table 1). Proteins such as basement membrane-specific heparan sulfate proteoglycan core protein (HSPG2), cell surface glycoprotein MUC18 (CD146), L-selectin (SELL), vascular cell adhesion protein 1 (VCAM1), and protein Z-dependent protease inhibitor (SERPINA10) have been implicated in several disease states, including clear cell renal cell carcinoma, renal failure, gastric cancer, hepatocellular cancer, prostate cancer, lung cancer, ovarian cancer, breast cancer, and skin cancer.31−33
CD146, a novel cell adhesion molecule, was recently reported to be a potential marker for clear cell renal cell carcinoma recurrence. Feng et al. observed significantly higher levels of CD146 gene expression in patients with metastatic ccRCC compared to that in patients with localized ccRCC and concluded that the recurrence of ccRCC is directly related to the levels of CD146 gene expression.31,34−36 In another publication, the presence of CD146 and elevated levels of adiponectin in patients with chronic renal failure were associated with potential indication of endothelial damage and increased cardiovascular risk.37 These findings further strengthen our current data wherein a 16-fold abundance increase of CD146 was observed in RCC (+) plasma compared to that in RCC (−) plasma. Future structural studies of CD146 may provide more information in our understanding of the presence of high amounts of CD146 protein and its role in ccRCC plasma.
3.5. Identification and Selection of Proteins of Interest Showing Differential M-LAC Column Binding
It is established that changes in M-LAC binding affinities (low or high) of glycoproteins maybe indicative of the response of glycan structural changes in disease samples.38 Hence, glycoproteins in M-LAC fractions (bound and unbound) with glycan alterations were evaluated on the basis of differential M-LAC binding. Relative quantification was performed (see Materials and Methods) using spectral counts obtained from ccRCC glycoproteome data. In Table 2, we show a list of glycoproteins with significant differential M-LAC binding (≥3 or ≤ 3 fold changes, significance level p ≤ 0.05) and their potential sites of glycosylation based on literature information (www.uniprot.org). The association between glycan alterations and cancer is well-known, and our current observation of altered glycoproteins is consistent with earlier reports.39,40
Table 2. List of Glycoproteins of Interest with Significant Differential M-LAC Binding.
| gene name | description | disease FT* | control FT* | disease BD* | control BD* | M-LAC changes | glycosylation sites |
|---|---|---|---|---|---|---|---|
| GC | vitamin D-binding protein | 34 | 36 | 24 | 2 | ↑ | N-288 |
| C2 | complement C2 | 18 | 26 | 9 | 1 | ↑ | N-29, 112, 290, 33, 467, 471, 621, 651 |
| KLKB1 | plasma kallikrein heavy chain | 25 | 1 | 16 | 26 | ↓ | N-127, 308, 396, 453, 494 |
| MAN2B1 | lysosomal alpha-mannosidase | 30 | 20 | 1 | 18 | ↓ | N-133, 310, 367, 497, 645, 651, 692, 766, 832, 930, 989 |
| C1R | complement C1r subcomponent | 20 | 1 | 1 | 13 | ↓ | N-125, 221, 514, 581 |
| AHSG | alpha-2-HS-glycoprotein | 14 | 1 | 7 | 11 | ↓ | N-156, 176; O-256, 270, 346 |
| APOB | apolipoprotein B-100 | 163 | 81 | 54 | 6 | ↑ | N-34, 185, 983, 1368, 1377, 1523, 2239, 2560, 2779, 2982, 3101, 3224, 3336, 3358, 3411, 3465, 3895, 4237, 4431 |
| C4A | complement C4-A | 1 | 1 | 59 | 4 | ↑ | N-226, 862, 1328, 1391; O-1244 |
| LGALS3BP | galectin-3-binding protein | 4 | 1 | 9 | 5 | ↑ | N-69, 125, 192, 362, 398, 551, 580 |
| ITIH4 | interalpha-trypsin inhibitor heavy chain H4 | 39 | 41 | 4 | 29 | ↓ | N-81, 207, 517, 577; O-720 |
| FN1 | isoform 14 of fibronectin | 47 | 59 | 64 | 1 | ↑ | N-430, 528, 542, 877, 1007, 1244; O-2064, 2065 |
| CLU | clusterin | 20 | 22 | 29 | 1 | ↑ | N-86, 103, 145, 291, 317, 354, 374 |
| SERPINA3 | alpha-1-antichymotrypsin | 33 | 30 | 34 | 1 | ↑ | N-33, 93, 106, 127, 186, 271 |
Average spectral count of two technical replicates. For meaningful ratio calculations, proteins with zero (0) spectral counts were replaced with one (1). ↓, downregulation; ↑, upregulation; N/A, not identified
For instance, clusterin, a heavily glycosylated protein with seven potential asparagine-linked glycan sites showed increased differential M-LAC binding in disease samples vs controls. Clusterin is associated with tumor advancement and carcinogenesis,41 and recent reports have indicated the presence of clusterin glycan alterations in cancer vs noncancer samples. In stomach cancer studies, Bones et al. showed the linearity between decreased levels of clusterin glycans and the progression of cancer.29 In addition, clear cell renal cell carcinoma plasma studies revealed significant glycoform changes between RCC (+) and RCC (−) samples of released clusterin glycans.42 More recently, we have observed a significant site-specific glycoform alteration of biantennary digalactosylated disialylated (A2G2S2) and core fucosylated biantennary digalactosylated disialylated (FA2G2S2) glycans in disease vs non-diseased ccRCC plasma (manuscript in preparation).
Similarly, vitamin D-binding protein (DBP) showed increased binding to the M-LAC column in ccRCC disease samples. The relationship between the glycosylation status and function of DBP in cancer patients is still unclear. Earlier data suggested that there is a direct correlation between decreased levels of oligosaccharides present on DBP and inactivity of Gc macrophage activating factor (GcMAF) in cancer patients.43−45 Recently however, Rehder et al. investigated DBP glycans levels and observed a high abundance of oligosaccharides in cancer patients, which is in contrast to earlier suggestions.46 The current study showed an increase in M-LAC binding of DBP in disease compared to non-disease ccRCC samples, suggesting potential glycosylation alterations. However, the focus of this study was not to investigate the function of DBP; therefore, further studies are required to provide information on the association of DBP’s glycosylation with ccRCC.
While GeLC–MS identified interesting proteins based on differential expression, it did not provide information about post-translational modifications (PTM) such as glycosylation alterations, and because many biological functions are mediated through glycans, altered glycosylation is a now an established feature of cancer. Therefore, the advantage of M-LAC is that it is able to capture some of these subtle changes in order to identify potential biomarkers.
3.6. Characterization of N-Glycan Moieties Released from Depleted M-LAC Fractions by Porous Graphitized Carbon (PGC) LC–ESI–IT MS/MS
In this discovery-based study, our goal is to understand the global profile of N-glycans released from low-abundance glycoproteins enriched through depletion of 12 proteins followed by lectin fractionation. Changes in these low-level glycans may be of potential utility in understanding the presence, progression, and disease recurrence of ccRCC. To this end, total N-glycans of depleted M-LAC fractions of pooled disease RCC (+) and non-disease RCC (−) samples were characterized. N-Glycans were released by PNGase F via dot-blotting, online-separated on a porous graphitized carbon (PGC) column, and analyzed using LC–ESI tandem mass spectrometry in negative ion mode. Utilizing MS retention times, charge states, and MS/MS fragmentation pattern, oligosaccharide structures were deduced.
Thirty six structurally different N-glycans corresponding to 23 N-glycan monosaccharide compositions were identified from two analytical replicates with minimum variation (average % CV <2.5) (Figure 3). Neutral, sialylated (monosialo, disialo, trisialo, and tetrasialo), fucosylated, and high mannose N-glycans were observed. The identification of N-glycans with various degrees of isomerization was consistent with previous studies of PGC chromatography.47
Figure 3.

N-Glycans identified in clear cell renal cell carcinoma plasma. Confidence is based on MS/MS identification. Yellow circle, galactose; blue square, N-acetylglucosamine; green circle, mannose; purple diamond, sialic acid; red triangle, fucose; core = (GlcNAc)2(Man)3.
3.7. N-Glycan Structures Alteration Analysis
Even though the N-glycan profiles of RCC (+) and RCC (−) M-LAC fractions were similar in overall appearance (Supporting Information Figure S2), a detailed analysis revealed significant differences between disease and non-disease M-LAC fractions. First, the mean of the relative intensities of the two analytical replicates was calculated, and the data was normalized as previously described.48 Briefly, the relative intensities of each glycan in a sample was determined using the ratio of the extracted ion chromatography (EIC) peak area of each N-glycan over the sum of the EIC peak areas of all N-glycans in the sample. Total glycan structures were expressed as a percentage after normalization, and relative intensities were established on the basis of relative quantification, not absolute measurements. The resulting relative abundance of individual N-glycans was compared across different samples. A detailed list showing the composition, type, isoforms, observed m/z, theoretical mass, and relative intensities (%) of N-glycans identified is presented in Supporting Information Table S4.
Following normalization, a comparative qualitative approach was taken to evaluate the 36 observed and normalized N-glycans from RCC (+) and RCC (−) M-LAC (bound and unbound) fractions. Three unique observations were made (see Supporting Information Table S4): (1) sialylated N-glycans were expressed in high levels, and afucosylated disialo-N-glycan, m/z 1111.42–, was observed to be the most abundant glycan structure in all analyzed fractions. In a recent report that involved tissue samples, fucosylated glycans were observed to be the most abundant form,49 indicating differences in glycan profiles of different disease models. Afucosylated disialo-N-glycans are a frequently observed occurrence in many cancer glycomic studies.50,51 In the present data, we observed two structural isomers for afucosylated disialo-N-glycan with different levels of expression: structure no. 15a with both terminal sialic acid residues in α2,6-linkages eluting prior to structure no. 15b, which has both terminal sialic acid residues in α2,6/α2,3-linkages. (2) N-Glycan expression levels in M-LAC bound fractions were higher compared to that in M-LAC unbound fractions, which is consistent with our aim of enriching target glycans using the M-LAC column. In addition, this observation correlates with M-LAC’s ability to segregate glycan variations into bound and unbound fractions. (3) The majority of N-glycans were expressed with different amounts when comparing RCC (+) and RCC (−), and some N-glycan structures (nos. 13b, 18a, 18b, 21b, and 21c) were observed to be either missing or expressed at extremely low levels in M-LAC fractions and therefore were difficult to quantitate. However, this unique observation may point to a potential glycan-specific molecular feature to differentiate disease and non-disease clear cell renal cell carcinoma plasma samples.
After establishing qualitative differences between disease and non-disease fractions, relative quantification and statistical analysis were performed to identify differentially expressed N-glycans. For N-glycans with zero (0) relative abundance, 0.1 was added for meaningful ratio calculations. Standard Student’s t-test revealed that 44% of identified N-glycans (16 structures) differ significantly (average p < 0.011), with an observation of over- or underexpression of N-glycans in RCC (+) M-LAC fractions. Differentially expressed N-glycans are summarized in Table 3. A notable feature from the differentially expressed glycans was the upregulation of high degree sialylated and high mannose glycans. We observed highly branched sialylated N-glycans, nos. 18a, 18b, 21b, and 23b, to be upregulated in disease M-LAC fractions (bound and unbound). The observation of upregulation of sialylated glycans was recently reported in a study involving tissues of renal cell carcinoma,52 and our data is in agreement with this report. Elevated levels of highly branched sialylated glycans are associated with increased activity of sialyltransferases, an enzyme that regulates biosynthesis of sialic acid residues.20,53 Several studies have reported an effect of alterations of sialic acids composition on cell adhesion, a factor implicated in metastasis.54,55 In breast cancer, for example, Lin et al. reported that increased amounts of sialic acid correlate with a decrease in cell–cell adhesion and an increase in cell invasiveness.55
Table 3. List of Glycans with Significant Differential Expression in ccRCC M-LAC Fractions.
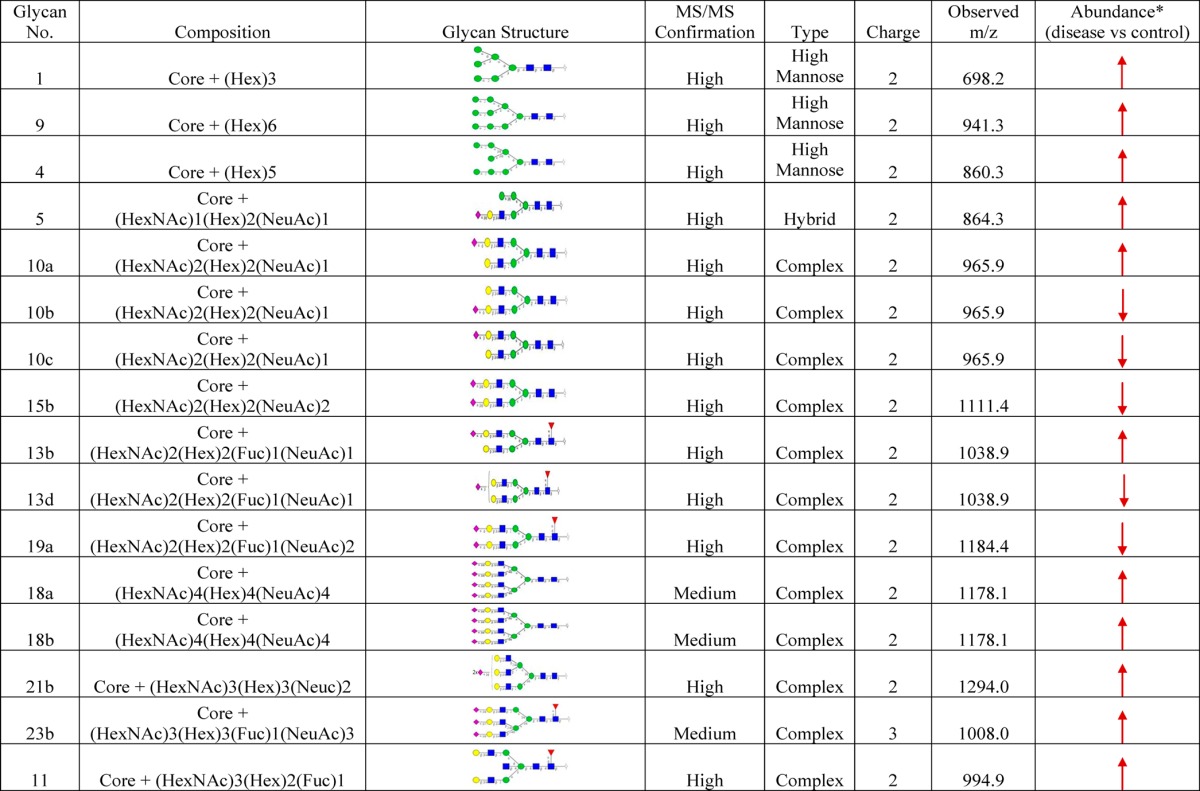
M-LAC bound and unbound; core = (GlcNAc)2(Man)3; ↓, downregulation; ↑, upregulation. For meaningful ratio calculations, glycans with zero (0) relative abundance were replaced with 0.1.
An increased level of high mannose structures (glycans nos. 1, 9, and 4) was another distinct feature in this study. Elevation of high mannose type glycans have been indicated in various cancer types. High levels of high mannose glycans were reported to correlate with breast cancer progression,56 and a similar trend was reported in head and neck tumor studies.57 Higher or lower levels of glycans are a hallmark of cancer progression, and their alterations may be related to changes in the expression levels of enzymes involved in the glycan biosynthesis pathway. Therefore, the goal of these studies was to assess the potential of N-glycans as biomarker candidates for clear cell renal cell carcinoma.
3.8. Validation of Differentially Expressed N-Glycans by Extracted Ion Chromatograms
Extracted ion chromatograms (EICs) of some selected N-glycans were used to validate different amounts of N-glycan expression in M-LAC fractions. In Figure 4A,B, the EIC of N-glycan no. 1 [Core + (Hex)3] m/z (698.22–), N-glycan no. 9 [Core + (Hex)6] m/z (941.32–), N-glycan no. 18a (Isomer a) [Core + (HexNAc)4(Hex)4(NeuAc)4] m/z (1178.13–), and N-glycan no. 18b (Isomer b) [Core + (HexNAc)4(Hex)4(NeuAc)4] m/z (1178.13–) highlights an elevation of high mannose and tetra-antennary sialo-type oligosaccharides in RCC (+) M-LAC fractions. All N-glycan structural identifications were confirmed via MS/MS fragmentation (Supporting Information Figure S3). In summary, our N-glycan data correlates with the glycoproteomics data in which M-LAC differential binding suggests potential glycosylation (glycan-specific) changes in ccRCC cancer fractions, and our current article marks a novel mapping of glycans in ccRCC plasma.
Figure 4.

Extracted ion chromatograms to illustrate differentially expressed glycans in M-LAC bound and unbound fractions. (A) The extracted ion chromatograms of glycan no. 1 (left) and glycan no. 9 (right) show that both N-glycans are expressed at higher levels in M-LAC bound before ccRCC surgery (upper panels) compared to those observed after ccRCC surgery (lower panels). (B) The extracted ion chromatograms of isomers glycan no. 18a (a) and glycan no. 18b (b) show that both N-glycans are expressed at higher levels in MLAC unbound and bound fractions before ccRCC surgery (1st and 3rd panels) compared to those observed after ccRCC surgery (2nd and 4th panels). Yellow circle, galactose; blue square, N-acetylglucosamine; green circle, mannose; purple diamond, sialic acid; red triangle, fucose; core = (GlcNAc)2(Man)3.
4. Conclusions
We have successfully performed fractionation of pooled plasma from 20 patients diagnosed with clear cell renal cell carcinoma (ccRCC) using the immuno-affinity depletion of 12 high-abundance proteins and a multi-lectin affinity chromatography (M-LAC) platform. Alterations in the plasma proteome, glycoproteome, and N-glycome of ccRCC patients were studied for the identification of low-level potential candidate markers that may be of interest for early diagnosis or used as a utility to monitor ccRCC recurrence. We report that low-abundance proteins with significant expression changes, such as cell surface glycoprotein MUC18, basement membrane-specific heparan sulfate proteoglycan core protein, L-selectin, and vascular cell adhesion protein 1, may be potential candidates after further validation because of their observed association with various cancers and renal-related diseases. Furthermore, proteins with glycan alterations with differential M-LAC column binding confirm reports of the ability of lectins to target potential glyco-biomarker candidates. Complex-type sialylated fucose glycans released from enriched glycoproteins were observed with alterations in ccRCC disease patients that could be related to alterations of glycosylation at the onset of clear cell renal cell carcinoma. This study was conducted as a first step in identifying potential candidate markers of interest in ccRCC plasma, and the current platform can be well-utilized in the analysis of candidate biomarkers. In the future, we plan to follow up by confirming observed protein abundance and glycan alterations in individual ccRCC patients and validate the observed changes in clinical assays such as ELISA, MRM, and antibody–lectin sandwich microarray in a larger cohort.
Acknowledgments
This work was supported by the Early Detection Research Network grant no. 1U01CA152653-01 from the National Cancer Institute (NCI).
Glossary
Abbreviations
- ccRCC
clear cell renal cell carcinoma
- FDR
false discovery rate
- N-glycan
glycoproteomics; curative nephrectomy
- M-LAC
multi-lectin affinity chromatography
Supporting Information Available
Figure S1: 1D SDS-PAGE analysis of reference plasma fractions from 12P-M-LAC platform to evaluate reproducibility. Figure S2: Representative average MS spectral of M-LAC bound and unbound fractions (∼35–60min) m/z range 650–1600. Figure S3: MS/MS fragmentation of N-glycans identified. Table S1: Patient information of ccRCC plasma samples; average age of patients is 52 years. Table S2: Sum of proteins and glycoproteins identified from two analytical replicates in the proteomic and glycoproteomic analysis used for quantitation. Table S3: Details of the number of total peptides and proteins identified from two analytical replicates. Table S4: Released N-glycans identified from ccRCC samples by PGC–LC–MS/MS (CID). This material is available free of charge via the Internet at http://pubs.acs.org.
The authors declare no competing financial interest.
Funding Statement
National Institutes of Health, United States
Supplementary Material
References
- Linehan W. M.; Walther M. M.; Zbar B. The genetic basis of cancer of the kidney. J. Urol. 2003, 170, 2163–72. [DOI] [PubMed] [Google Scholar]
- Pantuck A. J.; Zisman A.; Belldegrun A. S. The changing natural history of renal cell carcinoma. J. Urol. 2001, 166, 1611–23. [PubMed] [Google Scholar]
- Weiss R. H.; Lin P. Y. Kidney cancer: identification of novel targets for therapy. Kidney Int. 2006, 69, 224–32. [DOI] [PubMed] [Google Scholar]
- Herrmann W.; Stockle M.; Sand-Hill M.; Hubner U.; Herrmann M.; Obeid R.; Wullich B.; Loch T.; Geisel J. The measurement of complexed prostate-specific antigen has a better performance than total prostate-specific antigen. Clin. Chem. Lab. Med. 2004, 42, 1051–7. [DOI] [PubMed] [Google Scholar]
- Yang Z.; Hancock W. S. Approach to the comprehensive analysis of glycoproteins isolated from human serum using a multi-lectin affinity column. J. Chromatogr. A 2004, 1053, 79–88. [PubMed] [Google Scholar]
- Chen S.; LaRoche T.; Hamelinck D.; Bergsma D.; Brenner D.; Simeone D.; Brand R. E.; Haab B. B. Multiplexed analysis of glycan variation on native proteins captured by antibody microarrays. Nat. Methods 2007, 4, 437–44. [DOI] [PubMed] [Google Scholar]
- Teng P. N.; Hood B. L.; Sun M.; Dhir R.; Conrads T. P. Differential proteomic analysis of renal cell carcinoma tissue interstitial fluid. J. Proteome Res. 2011, 10, 1333–42. [DOI] [PubMed] [Google Scholar]
- Zeng Z.; Hincapie M.; Pitteri S. J.; Hanash S.; Schalkwijk J.; Hogan J. M.; Wang H.; Hancock W. S. A proteomics platform combining depletion, multi-lectin affinity chromatography (M-LAC), and isoelectric focusing to study the breast cancer proteome. Anal. Chem. 2011, 83, 4845–54. [DOI] [PMC free article] [PubMed] [Google Scholar]
- Plavina T.; Wakshull E.; Hancock W. S.; Hincapie M. Combination of abundant protein depletion and multi-lectin affinity chromatography (M-LAC) for plasma protein biomarker discovery. J. Proteome Res. 2007, 6, 662–71. [DOI] [PubMed] [Google Scholar]
- Abbott K. L.; Aoki K.; Lim J. M.; Porterfield M.; Johnson R.; O’Regan R. M.; Wells L.; Tiemeyer M.; Pierce M. Targeted glycoproteomic identification of biomarkers for human breast carcinoma. J. Proteome Res. 2008, 7, 1470–80. [DOI] [PMC free article] [PubMed] [Google Scholar]
- Gao Y.; Ma F.; Zhang W.; Zhong F.; Tang H.; Xu D.; Zhao L. O-Glycan profiling of serum glycan for potential renal cancer biomarkers. Sci. China: Life Sci. 2013, 56, 739–44. [DOI] [PubMed] [Google Scholar]
- Kullolli M.; Hancock W. S.; Hincapie M. Automated platform for fractionation of human plasma glycoproteome in clinical proteomics. Anal. Chem. 2010, 82, 115–20. [DOI] [PMC free article] [PubMed] [Google Scholar]
- Matsumura K.; Higashida K.; Ishida H.; Hata Y.; Yamamoto K.; Shigeta M.; Mizuno-Horikawa Y.; Wang X.; Miyoshi E.; Gu J.; Taniguchi N. Carbohydrate binding specificity of a fucose-specific lectin from Aspergillus oryzae: a novel probe for core fucose. J. Biol. Chem. 2007, 282, 15700–8. [DOI] [PubMed] [Google Scholar]
- Fischer E.; Brossmer R. Sialic acid-binding lectins: submolecular specificity and interaction with sialoglycoproteins and tumour cells. Glycoconjugate J. 1995, 12, 707–13. [DOI] [PubMed] [Google Scholar]
- Li W. P.; Zuber C.; Roth J. Use of Phaseolus vulgaris leukoagglutinating lectin in histochemical and blotting techniques: a comparison of digoxigenin- and biotin-labelled lectins. Histochemistry 1993, 100, 347–56. [DOI] [PubMed] [Google Scholar]
- Dall’Olio F.; Chiricolo M. Sialyltransferases in cancer. Glycoconjugate J. 2001, 18, 841–50. [DOI] [PubMed] [Google Scholar]
- Pousset D.; Piller V.; Bureaud N.; Monsigny M.; Piller F. Increased α2,6 sialylation of N-glycans in a transgenic mouse model of hepatocellular carcinoma. Cancer Res. 1997, 57, 4249–56. [PubMed] [Google Scholar]
- Recchi M. A.; Hebbar M.; Hornez L.; Harduin-Lepers A.; Peyrat J. P.; Delannoy P. Multiplex reverse transcription polymerase chain reaction assessment of sialyltransferase expression in human breast cancer. Cancer Res. 1998, 58, 4066–70. [PubMed] [Google Scholar]
- Takada A.; Ohmori K.; Yoneda T.; Tsuyuoka K.; Hasegawa A.; Kiso M.; Kannagi R. Contribution of carbohydrate antigens sialyl Lewis A and sialyl Lewis X to adhesion of human cancer cells to vascular endothelium. Cancer Res. 1993, 53, 354–61. [PubMed] [Google Scholar]
- Dube D. H.; Bertozzi C. R. Glycans in cancer and inflammation—potential for therapeutics and diagnostics. Nat. Rev. Drug Discovery 2005, 4, 477–88. [DOI] [PubMed] [Google Scholar]
- Turner G. A.; Skillen A. W.; Buamah P.; Guthrie D.; Welsh J.; Harrison J.; Kowalski A. Relation between raised concentrations of fucose, sialic acid, and acute phase proteins in serum from patients with cancer: choosing suitable serum glycoprotein markers. J. Clin. Pathol. 1985, 38, 588–92. [DOI] [PMC free article] [PubMed] [Google Scholar]
- Jensen P. H.; Karlsson N. G.; Kolarich D.; Packer N. H. Structural analysis of N- and O-glycans released from glycoproteins. Nat. Protoc. 2012, 7, 1299–310. [DOI] [PubMed] [Google Scholar]
- Gbormittah F. O.; Haab B. B.; Partyka K.; Garcia-Ott C.; Hancapie M.; Hancock W. S. Characterization of glycoproteins in pancreatic cyst fluid using a high-performance multiple lectin affinity chromatography platform. J. Proteome Res. 2014, 13, 289–99. [DOI] [PMC free article] [PubMed] [Google Scholar]
- Leymarie; et al. Interlaboratory study on differential analysis of protein glycosylation by mass spectrometry: the ABRF glycoprotein research multi-institutional study 2012. Mol. Cell. Proteomics 2013, 12, 2935–2951. [DOI] [PMC free article] [PubMed] [Google Scholar]
- Plavina T.; Hincapie M.; Wakshull E.; Subramanyam M.; Hancock W. S. Increased plasma concentrations of cytoskeletal and Ca2+-binding proteins and their peptides in psoriasis patients. Clin. Chem. 2008, 54, 1805–14. [DOI] [PubMed] [Google Scholar]
- Yang Z.; Harris L. E.; Palmer-Toy D. E.; Hancock W. S. Multilectin affinity chromatography for characterization of multiple glycoprotein biomarker candidates in serum from breast cancer patients. Clin. Chem. 2006, 52, 1897–905. [DOI] [PubMed] [Google Scholar]
- Abbott K. L.; Lim J. M.; Wells L.; Benigno B. B.; McDonald J. F.; Pierce M. Identification of candidate biomarkers with cancer-specific glycosylation in the tissue and serum of endometrioid ovarian cancer patients by glycoproteomic analysis. Proteomics 2010, 10, 470–81. [DOI] [PMC free article] [PubMed] [Google Scholar]
- Batruch I.; Lecker I.; Kagedan D.; Smith C. R.; Mullen B. J.; Grober E.; Lo K. C.; Diamandis E. P.; Jarvi K. A. Proteomic analysis of seminal plasma from normal volunteers and post-vasectomy patients identifies over 2000 proteins and candidate biomarkers of the urogenital system. J. Proteome Res. 2011, 10, 941–53. [DOI] [PubMed] [Google Scholar]
- Bones J.; Byrne J. C.; O’Donoghue N.; McManus C.; Scaife C.; Boissin H.; Nastase A.; Rudd P. M. Glycomic and glycoproteomic analysis of serum from patients with stomach cancer reveals potential markers arising from host defense response mechanisms. J. Proteome Res. 2011, 10, 1246–65. [DOI] [PubMed] [Google Scholar]
- Zheng X.; Wu S. L.; Hincapie M.; Hancock W. S. Study of the human plasma proteome of rheumatoid arthritis. J. Chromatogr. A 2009, 1216, 3538–45. [DOI] [PubMed] [Google Scholar]
- Feng G.; Fang F.; Liu C.; Zhang F.; Huang H.; Pu C. CD146 gene expression in clear cell renal cell carcinoma: a potential marker for prediction of early recurrence after nephrectomy. Int. Urol. Nephrol. 2012, 44, 1663–9. [DOI] [PubMed] [Google Scholar]
- Wu G. J.; Wu M. W.; Wang S. W.; Liu Z.; Qu P.; Peng Q.; Yang H.; Varma V. A.; Sun Q. C.; Petros J. A.; Lim S. D.; Amin M. B. Isolation and characterization of the major form of human MUC18 cDNA gene and correlation of MUC18 over-expression in prostate cancer cell lines and tissues with malignant progression. Gene 2001, 279, 17–31. [DOI] [PubMed] [Google Scholar]
- Wu Z.; Li J.; Yang X.; Wang Y.; Yu Y.; Ye J.; Xu C.; Qin W.; Zhang Z. MCAM is a novel metastasis marker and regulates spreading, apoptosis and invasion of ovarian cancer cells. Tumor Biol. 2012, 33, 1619–28. [DOI] [PMC free article] [PubMed] [Google Scholar]
- Imbert A. M.; Garulli C.; Choquet E.; Koubi M.; Aurrand-Lions M.; Chabannon C. CD146 expression in human breast cancer cell lines induces phenotypic and functional changes observed in epithelial to mesenchymal transition. PLoS One 2012, 7, e43752. [DOI] [PMC free article] [PubMed] [Google Scholar]
- Schon M.; Kahne T.; Gollnick H.; Schon M. P. Expression of gp130 in tumors and inflammatory disorders of the skin: formal proof of its identity as CD146 (MUC18, Mel-CAM). J. Invest. Dermatol. 2005, 125, 353–63. [DOI] [PubMed] [Google Scholar]
- Kristiansen G.; Yu Y.; Schluns K.; Sers C.; Dietel M.; Petersen I. Expression of the cell adhesion molecule CD146/MCAM in non-small cell lung cancer. Anal. Cell. Pathol. 2003, 25, 77–81. [DOI] [PMC free article] [PubMed] [Google Scholar]
- Malyszko J.; Malyszko J. S.; Brzosko S.; Wolczynski S.; Mysliwiec M. Adiponectin is related to CD146, a novel marker of endothelial cell activation/injury in chronic renal failure and peritoneally dialyzed patients. J. Clin. Endocrinol. Metab. 2004, 89, 4620–7. [DOI] [PubMed] [Google Scholar]
- Yang Z.; Hancock W. S. Approach to the comprehensive analysis of glycoproteins isolated from human serum using a multi-lectin affinity column. J. Chromatogr. A 2004, 1053, 79–88. [PubMed] [Google Scholar]
- Pawlik T. M.; Hawke D. H.; Liu Y.; Krishnamurthy S.; Fritsche H.; Hunt K. K.; Kuerer H. M. Proteomic analysis of nipple aspirate fluid from women with early-stage breast cancer using isotope-coded affinity tags and tandem mass spectrometry reveals differential expression of vitamin D binding protein. BMC Cancer 2006, 6, 68. [DOI] [PMC free article] [PubMed] [Google Scholar]
- Woltje M.; Tschoke B.; von Bulow V.; Westenfeld R.; Denecke B.; Graber S.; Jahnen-Dechent W. CCAAT enhancer binding protein beta and hepatocyte nuclear factor 3beta are necessary and sufficient to mediate dexamethasone-induced up-regulation of alpha2HS-glycoprotein/fetuin-A gene expression. J. Mol. Endocrinol. 2006, 36, 261–77. [DOI] [PubMed] [Google Scholar]
- Andersen C. L.; Schepeler T.; Thorsen K.; Birkenkamp-Demtroder K.; Mansilla F.; Aaltonen L. A.; Laurberg S.; Orntoft T. F. Clusterin expression in normal mucosa and colorectal cancer. Mol. Cell. Proteomics 2007, 6, 1039–48. [DOI] [PubMed] [Google Scholar]
- Tousi F.; Bones J.; Iliopoulos O.; Hancock W. S.; Hincapie M. Multidimensional liquid chromatography platform for profiling alterations of clusterin N-glycosylation in the plasma of patients with renal cell carcinoma. J. Chromatogr. A 2012, 1256, 121–8. [DOI] [PMC free article] [PubMed] [Google Scholar]
- Yamamoto N.; Naraparaju V. R.; Asbell S. O. Deglycosylation of serum vitamin D3-binding protein leads to immunosuppression in cancer patients. Cancer Res. 1996, 56, 2827–31. [PubMed] [Google Scholar]
- Yamamoto N.; Naraparaju V. R.; Urade M. Prognostic utility of serum alpha-N-acetylgalactosaminidase and immunosuppression resulted from deglycosylation of serum Gc protein in oral cancer patients. Cancer Res. 1997, 57, 295–9. [PubMed] [Google Scholar]
- Yamamoto N.; Suyama H.; Ushijima N. Immunotherapy of metastatic breast cancer patients with vitamin D-binding protein-derived macrophage activating factor (GcMAF). Int. J. Cancer 2008, 122, 461–7. [DOI] [PubMed] [Google Scholar]
- Rehder D. S.; Nelson R. W.; Borges C. R. Glycosylation status of vitamin D binding protein in cancer patients. Protein Sci. 2009, 18, 2036–42. [DOI] [PMC free article] [PubMed] [Google Scholar]
- Everest-Dass A. V.; Jin D.; Thaysen-Andersen M.; Nevalainen H.; Kolarich D.; Packer N. H. Comparative structural analysis of the glycosylation of salivary and buccal cell proteins: innate protection against infection by Candida albicans. Glycobiology 2012, 22, 1465–79. [DOI] [PubMed] [Google Scholar]
- Nakano M.; Saldanha R.; Gobel A.; Kavallaris M.; Packer N. H. Identification of glycan structure alterations on cell membrane proteins in desoxyepothilone B resistant leukemia cells. Mol. Cell. Proteomics 2011, 10, M111.009001. [DOI] [PMC free article] [PubMed] [Google Scholar]
- Borzym-Kluczyk M.; Radziejewska I.; Darewicz B. Glycosylation of proteins in healthy and pathological human renal tissues. Folia Histochem. Cytobiol. 2012, 50, 599–604. [DOI] [PubMed] [Google Scholar]
- Dall’olio F. Protein glycosylation in cancer biology: an overview. Clin. Mol. Pathol. 1996, 49, M126–35. [DOI] [PMC free article] [PubMed] [Google Scholar]
- Kim Y. J.; Varki A. Perspectives on the significance of altered glycosylation of glycoproteins in cancer. Glycoconjugate J. 1997, 14, 569–76. [DOI] [PubMed] [Google Scholar]
- Yoshimura M.; Nishikawa A.; Ihara Y.; Taniguchi S.; Taniguchi N. Suppression of lung metastasis of B16 mouse melanoma by N-acetylglucosaminyltransferase III gene transfection. Proc. Natl. Acad. Sci. U.S.A. 1995, 92, 8754–8. [DOI] [PMC free article] [PubMed] [Google Scholar]
- Gessner P.; Riedl S.; Quentmaier A.; Kemmner W. Enhanced activity of CMP-neuAc:Galβ1-4GlcNAc:α2,6-sialyltransferase in metastasizing human colorectal tumor tissue and serum of tumor patients. Cancer Lett. 1993, 75, 143–9. [DOI] [PubMed] [Google Scholar]
- Kannagi R. Molecular mechanism for cancer-associated induction of sialyl Lewis X and sialyl Lewis A expression-The Warburg effect revisited. Glycoconjugate J. 2004, 20, 353–64. [DOI] [PubMed] [Google Scholar]
- Lin S.; Kemmner W.; Grigull S.; Schlag P. M. Cell surface α2,6 sialylation affects adhesion of breast carcinoma cells. Exp. Cell Res. 2002, 276, 101–10. [DOI] [PubMed] [Google Scholar]
- de Leoz M. L.; Young L. J.; An H. J.; Kronewitter S. R.; Kim J.; Miyamoto S.; Borowsky A. D.; Chew H. K.; Lebrilla C. B. High-mannose glycans are elevated during breast cancer progression. Mol. Cell. Proteomics 2011, 10, M110.002717. [DOI] [PMC free article] [PubMed] [Google Scholar]
- Lattova E.; Varma S.; Bezabeh T.; Petrus L.; Perreault H. Mass spectrometric profiling of N-linked oligosaccharides and uncommon glycoform in mouse serum with head and neck tumor. J. Am. Soc. Mass Spectrom. 2008, 19, 671–85. [DOI] [PubMed] [Google Scholar]
Associated Data
This section collects any data citations, data availability statements, or supplementary materials included in this article.