Abstract
The reliability and information content of diethylpyrocarbonate (DEPC) as a covalent probe of protein surface structure has been improved when used appropriately with mass spectrometric detection. Using myoglobin, cytochrome c, and β-2-microglobulin as model protein systems, we demonstrate for the first time that DEPC can modify Ser and Thr residues in addition to His and Tyr residues. This result expands the capability of DEPC as a structural probe because about 25% of the sequence of the average protein can now be covered using this covalent labeling reagent. In addition, we establish a new approach based on mass spectrometry to ensure the structural integrity of proteins during amino acid-specific covalent labeling reactions. This approach involves monitoring the extent of modification as a function of reagent concentration and allows any small-scale or local perturbations caused by the covalent label to be readily identified and avoided. Results indicate that these dose-response plots are much more reliable and generally applicable probes of possible protein structural changes than fluorescence or circular dichroism spectroscopies. These dose-response plots also provide a means of quantitatively comparing the reactivity of each modified residue. Based on comparisons to known X-ray crystal structures, we find that the solvent accessibility of the reactive atom in the side chain and the presence of a nearby charged residue most affect modification rates. Finally, this improved surface mapping method has been used to determine the effect of Cu(II) binding on the structure of β-2-microglobulin. Results confirm that Cu(II) binds His31, but not any of the other three His residues, and changes the solvent accessibility of residues near His31 and near the N-terminus.
Introduction
Because of the relationship between protein structure and function, determining the molecular structure of proteins continues to be important in molecular biology. X-ray crystallography and NMR are able to provide detailed information about a protein's spatial arrangement; however, both of these techniques have some limitations. As such, methods based on mass spectrometry (MS) that overcome some of the shortcomings associated with these techniques are being developed to study higher-order protein structure.
Because mass spectral measurements occur in the gas phase, however, MS does not directly provide amino-acid level information about 3D protein structure in solution. Instead some means of encoding this structural information in the mass-to-charge (m/z) ratio of the measured ions must be applied. To accomplish this, two general approaches have been used, non-covalent and covalent labeling. Hydrogen deuterium exchange (HDX) coupled with MS has been extensively and successfully used as a non-covalent labeling tool to study protein structure and dynamics in solution.1-3 This approach reports on a protein's backbone structure, but back-exchange during the various stages of analysis (e.g. LC, MS/MS) can result in the loss of pertinent data and can complicate data interpretation. In contrast, covalent labeling techniques provide information about protein side chains, which can be complementary to HDX methods, while avoiding issues of back exchange. A common covalent labeling approach is chemical cross-linking. Cross-linking agents are used to analyze protein structure and can provide information on the distance between nearby residues.4-6 The accurate assignment of cross-linked sites can sometimes be difficult, though, because cross-linking approaches make new bonds between sites that are often distant from one another in the primary sequence. Other covalent labeling approaches rely on reagents that irreversibly modify either specific amino acids7-9 or most amino acids (e.g. hydroxyl radicals10,11). These reagents provide information about protein structure by identifying amino acids that are exposed to solvent. The amino acid specific labels have the advantage of simplicity, requiring reagents and conditions that are readily accessible and generally easy to use, while the methods based on hydroxyl radicals usually require special radiation sources to produce the reactive species.
While covalent labels usually provide information that is complementary to HDX methods, they do have some advantages that make covalent labeling methods worth further investigation. First, the possibilities of back-exchange and scrambling are basically non-existent. Second, confident detection and identification of modified residues and/or regions of a protein can be readily done with most types of mass spectrometers because of the greater mass shifts that occur upon labeling. For example, confident assignment of the number of exchanged hydrogens in HDX methods can be difficult for multiply-charged ions when using low-resolution mass spectrometers such as quadrupole ion traps. Finally, observation of small and locally restricted structural changes in proteins is potentially more straightforward because the labels can typically be localized to single amino acids. The main drawback of using covalent labels in comparison to HDX is the greater influence that the probe can have on protein structure. Due to the relatively large size of typical covalent labels, protein structure is more likely to be perturbed by these labels than when D is used to probe structure.
Given its simplicity and advantages, amino acid-specific covalent labeling of proteins with detection by MS has been used to map protein surfaces, identify ligand-binding sites, study protein-protein and protein-nucleic acid complexes, and detect ligand-induced conformational changes.12-20 Because protein conformational changes affect their surface topology, amino acid residues involved in the structural changes can be identified from differential modification patterns. Information from surface mapping experiments is reliable, though, only if the structural integrity of a protein is preserved during the reaction. Given the relatively large size of typical amino acid-specific labels, this can be a serious concern, so appropriate checks are required to ensure that the labeling reaction does not distort the protein's structure and thus provide incorrect information. Despite the importance of such checks, a survey of over 60 publications (see Supporting Information) that use MS and amino acid-specific labeling indicates that over 60% of these studies did nothing to ensure the structural integrity of the studied protein. Another 33% of these studies either used circular dichroism (CD) spectroscopy or activity assays to check protein structure, but these approaches are probably not sufficient to identify small-scale or local structural changes. CD spectroscopy provides only the population-weight average properties of a protein sample and may not be sensitive to local regions of a protein, and activity assays will only change significantly if a protein's structure around its active site is sufficiently perturbed. About 5% of the reports used fluorescence spectroscopy, which can provide information about local protein structural changes but only around tryptophan residues. Finally, only one of the 60+ articles used the fail-safe method of limiting the number of modifications to 1 per protein molecule, but this approach makes detection of the modified residues more difficult. Clearly, a reliable approach that both ensures protein structural integrity during amino-acid specific labeling experiments and provides readily detectable modifications is necessary.
To address this need, we report an improved amino acid-specific modification and MS-based approach for protein surface mapping. We demonstrate that measuring the kinetics of the covalent labeling reactions ensures that the covalent probe does not disrupt a protein's structure during the labeling reaction. Careful determination of the reaction rate coefficients also provides a quantitative basis for more fully understanding the factors that influence amino acid reactivity, which could enhance the structural information possible with this approach. In addition, we show that diethylpyrocarbonate, which is a very convenient and easy-to-use label, may have some promise as a general covalent label because of its ability to probe up to 25% of the residues in the average protein. We then apply our improved method to obtain further insight into Cu(II)'s interaction with β-2-microglobulin (β2m), which is a protein that forms amyloid fibrils upon exposure to stoichiometric levels of Cu(II).21,22
Experimental Section
Materials
Human β-2-microglobulin (β2m) was obtained from Fitzgerald Industries International, Inc. (Concord, MA). Diethylpyrocarbonate (DEPC), imidazole, dithiothreitol (DTT), copper(II) sulfate (CuSO4), 3-morpholinopropanesulfonic acid (MOPS), potassium acetate, equine heart cytochrome c, and equine skeletal muscle myoglobin were obtained from Sigma-Aldrich (St. Louis, MO). Tris(hydroxymethyl)-aminomethane (Tris) and tris(hydroxymethyl)aminomethane hydrochloride (Tris-HCl) were purchased from EM Science (Gladstone, NJ). Ammonium acetate, methanol, acetonitrile, and acetic acid were obtained from Fisher Scientific (Fair Lawn, NJ). Urea was purchased from Mallinckrodt Chemicals (Phillipsburg, NJ). Trypsin was from Promega (Madison, WI), and chymotrypsin was purchased from Roche Diagnostics (Indianapolis, IN). Centricon molecular weight cutoff (MWCO) filters were obtained from Millipore (Burlington, MA). Deionized water was prepared from a Millipore (Burlington, MA) Simplicity 185 water purification system.
DEPC Modification
The covalent modification reactions were performed for 1 min at 37 °C with 100 μM protein and 50 mM ammonium acetate at pH 7 and were initiated by adding various molar excesses of DEPC in acetonitrile. The total reaction volume was 100 μL for cytochrome c and myoglobin, and the total amount of acetonitrile was 1 %. The DEPC reactions of β2m were performed for 1 min at 37 °C with 100 μM protein, 200 mM potassium acetate and 25 mM MOPS at pH 7.4 and were initiated by adding various molar excesses of DEPC. For the β2m-Cu samples, 100 μM CuSO4 was added, and the solutions were allowed to equilibrate for 2 minutes prior to addition of the DEPC. The total reaction volume for the experiments with β2m was 50 μL, and the total amount of acetonitrile was 1%. All the covalent modification reactions were quenched by adding 10 mM imidazole. The DEPC-treated samples were then purified using a 10,000 MWCO filter and reconstituted with deionized water to a final concentration of 250 μM.
Proteolytic Digestion
Before the addition of trypsin, 80 μL solutions containing 1 μg/μL of unmodified or DEPC-modified proteins in 50 mM Tris-HCl (pH = 7) and 5 mM CaCl2 were incubated with 10 μL of acetonitrile at 40 °C for 45 minutes. Also, to reduce the disulfide bonds in myoglobin and β2m, the proteins were reacted with 10 mM DTT at 40 °C for 45 minutes prior to addition of the acetonitrile. Trypsin (0.5 μg/μL) was then added to yield a final enzyme:substrate ratio of 1:20. For the β2m samples, chymotrypsin (0.5 μg/μL) was added together with the trypsin. All samples were incubated at 37 °C for 16 hours. The enzymes were inactivated by adding 2 μL of acetic acid, and the samples were immediately frozen at −10 °C and analyzed within 24 hours.
HPLC Analysis
An HP1100 (Agilent, Wilminton, DE) HPLC system with a C18 column (15 cm × 2.1 mm, 5 μm particle size, Supelco, St. Louis, MO) was used for all LC experiments. Tryptic fragments were eluted using a linear gradient of methanol containing 0.1% acetic acid that increased from 5% to 90% methanol over 30 min at a flow rate of 0.250 mL/min. The LC effluent was split at a ratio of 1:4 with the smaller fraction of the split flow being fed into the mass spectrometer.
Mass Spectrometry
Mass spectra were acquired on a Bruker Esquire-LC (Billerica, MA) quadrupole ion trap mass spectrometer, which is equipped with an electrospray ionization source. Typically, the electrospray needle voltage was kept at 3-3.5 kV, and the capillary temperature was set to 300 °C. The voltages for the transfer optics between the electrospray source and the ion trap were usually optimized for maximum signal, but typical values for the most important ion lenses were the following: a voltage of 30-40 V was applied to skimmer 1 and a voltage of 50-60 V was applied to the capillary offset. For direct injection experiments similar source conditions were used, but sample was delivered at 1 μL/min using a syringe pump. Tandem mass spectra were acquired using isolation widths of 1.0 Da and excitation voltages between 0.6 and 1.0 V. Peptide sequences were determined from the MS/MS data via de novo sequencing or with the help of BioTools™ (Bruker Daltonics, Billerica, MA). The sequence coverage for cytochrome c and β2m was 100%, while the sequence coverage for myoglobin was approximately 90%.
Determination of Solvent Accessibility
The 3D structures of cytochrome c and myoglobin were examined using the structures obtained from the Protein Data Bank (PDB) (1AKK for cytochrome c and 1DWR for myoglobin). Solvent accessibility was calculated from the PDB coordinate files using GETAREA. A probe radius of 1.4 Å, representing the van der Waals sphere of water, was used.
Fluorescence Measurements
Fluorescence spectra were acquired with a Photon Technology International Quantamaster-4 SE. Tryptophan fluorescence measurements were obtained using slit widths of 2 nm and an excitation wavelength of 280 nm. Protein solutions (100 μM, 50 mM ammonium acetate at pH 7) were initially incubated at 37 °C for 30 min prior to addition of DEPC. Emission scans from 300-390 nm were taken at different time points after the addition of DEPC. Fluorescence intensity measurements immediately before and 1 to 5 min after the addition of DEPC were performed to determined the effect of DEPC modification on protein structure.
Circular Dichroism (CD) experiments
CD experiments were performed at 37 °C using a Jasco-710 spectropolarimeter. All experiments were done in 50 mM ammonium acetate at pH 7. Spectra were measured with a sample cell having a 0.1 cm path length and at a scan resolution of 0.2 nm, a scan rate of 50 nm/min, and a response time of 4 s.
Results and Discussion
Carbethoxylation of Histidine, Tyrosine, Serine and Threonine
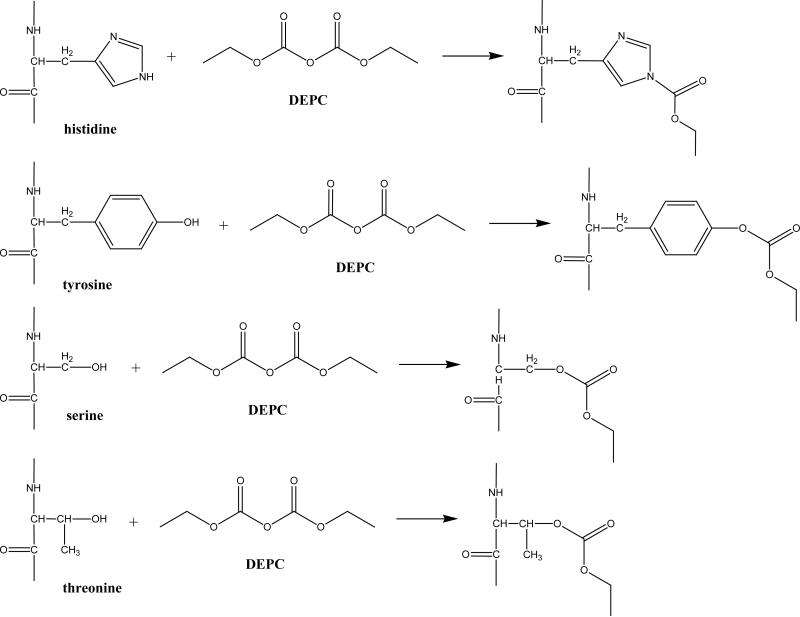
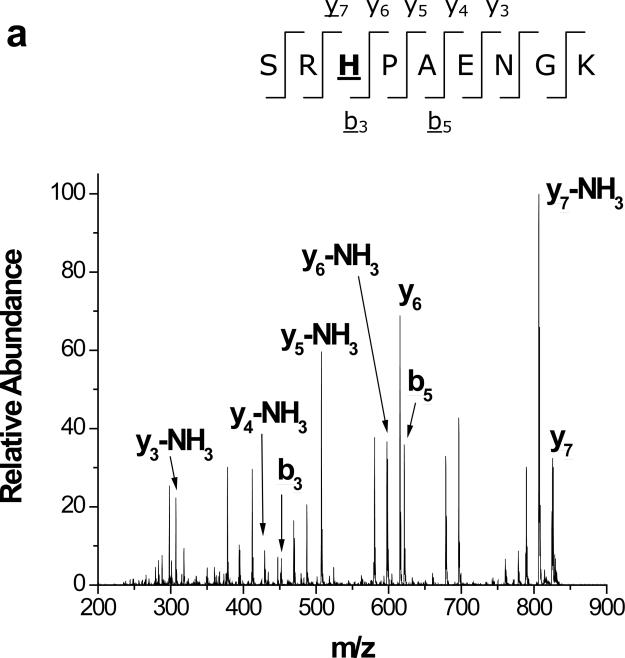
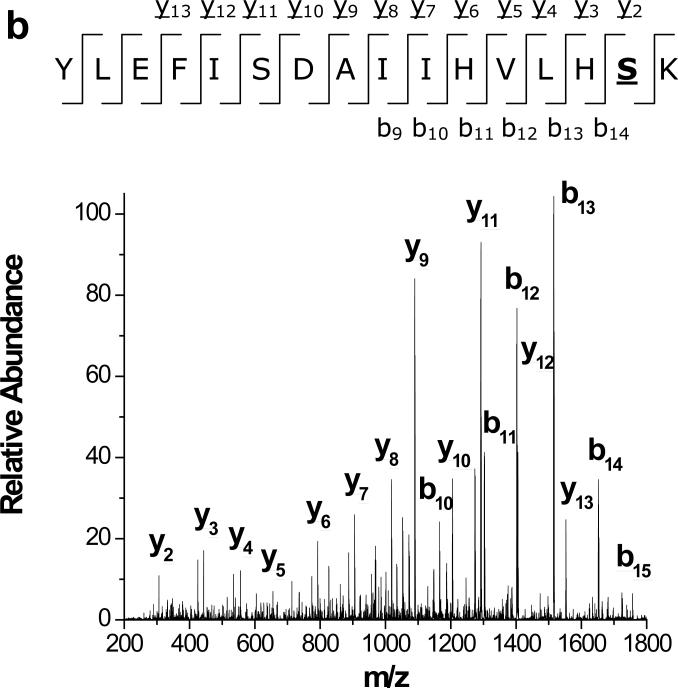
Diethylpyrocarbonate (DEPC) reacts somewhat specifically with histidine residues at near-physiological pHs (Scheme 1), but it can also react with tyrosine, cysteine, and lysine residues.12,23,24 Covalent modification experiments with DEPC are usually performed for 30-120 min at pH ~ 7,23-25 but in our experiments a 1 min reaction time was chosen to minimize the effect of DEPC hydrolysis on the kinetics of the modification reactions. DEPC hydrolysis is known to occur with a reaction half-life of 9 min at 25 °C and pH = 7.26 In addition, the reaction time was kept short to improve the temporal resolution of the modification procedure and decrease the possibility that major protein structural changes occur during modification. The reagent dose was also kept relatively low to minimize any structural changes caused by the reagent. Under our reaction conditions, LC-MS/MS data (e.g. Figure 1) show that many solvent exposed His, Tyr, Ser and Thr residues are modified by DEPC (Tables 1 and 2). Most of the modified amino acids have solvent accessible surface area (SASA) percentages above 30. The failure to observe modifications to Lys residues is probably due to the short reaction time used because the protonated side chain of Lys causes this amino acid to react slowly at pH 7.0.12 Figure 1 shows two example MS/MS spectra indicating that modifications can be readily determined with single amino acid resolution. For example, unmodified y3, y4, y5, and y6 product ions along with modified y7 and y8 ions indicate that His13 is the modified residue in the Ser11-Lys19 fragment of β2m (Figure 1a). Similarly, unmodified b ions from b8 through b14, a modified b15 ion, and a complete series of modified y ions from y2 to y13 indicate that Ser117 is the modified residue in the Tyr103-Lys119 fragment of myoglobin (Figure 1b). The MS/MS spectra for the remaining 15 modified peptides are included in the Supporting Information, and these spectra confirm the modification sites that are reported in Tables 1 and 2.
Scheme 1.
Reactions of histidine, tyrosine, threonine, and serine with DEPC.
Figure 1.
MS/MS spectra of (a) Ser11-Lys19 of β2m, confirming the modification at His13 and (b) Tyr103-Ly118 of myoglobin, confirming the modification Ser117. The underlined product ions correspond to the product ions that contain the DEPC modification.
Table 1.
DEPC modification rate coefficients for histidine residues.
| Protein | Residue | % SASA Ratioa | SASA of Nε2a | pKab | kc (M−1 s−1) |
|---|---|---|---|---|---|
| Cytochrome C | His18 | 15 | 3.9 | 4.3 | 0 |
| His26 | 34 | 6.8 | 6.5 | 0.069 | |
| His33 | 49 | 0.3 | 6.4 | 0 | |
| Myoglobin | His24 | 3 | 0 | 4.6 | 0 |
| His36 | 33 | 11.7 | 6.1 | 0.070 | |
| His48 | 65 | 6.4 | 6.7 | 0.067 | |
| His64 | 27 | 5.9 | 4.5 | 0.009 | |
| His81 | 89 | 18.8 | 7.4 | 0.053 | |
| His82 | 45 | 0 | 7.1 | 0 | |
| His93 | 35 | 17.1 | 4.4 | 0 | |
| His97 | 43 | 13.5 | 6.4 | 0.036 | |
| His113 | 43 | 9.9 | 6.2 | 0 | |
| His116 | 44 | 0.6 | 6.4 | 0 | |
| His119 | 20 | 0 | 6.2 | 0 | |
| β2m | His13 | 56 | 15.7 | 7.4 | 0.041 |
| His31 | 25 | 11.5 | 7.2 | 0.010 | |
| His51 | 44 | 10.2 | 6.2 | 0.036 | |
| His84 | 0 | 0 | 7.3 | 0 |
SASA calculated using GETAREA 1.1. 1.4 Å is used as the probe radius, and the calculated SASA is compared to the surface area of the side chain in a Gly-X-Gly tripeptide generating a % ratio. Residues with % ratio below 20 are typically considered buried whereas those with ratios above 30% are regarded as solvent exposed
pKa calculated using PROPKA
Rate coefficients from dose-response plots
Table 2.
DEPC modification rate coefficients for tyrosine, serine and threonine residues.
| Protein | Residuea | % SASA Ratiob | SASA of Nε2b | pKac | kd (M−1 s−1) |
|---|---|---|---|---|---|
| Cytochrome C | Tyr48 | 26 | 30.9 | 9.8 | 0.050 |
| Tyr67 | 10 | 9.0 | 12.5 | 0.017 | |
| Tyr74 | 27 | 8.5 | 10.2 | 0.015 | |
| Tyr97 | 8 | 7.9 | 10.9 | 0 | |
| Myoglobin | Tyr103 | 15 | 17.1 | 11.9 | 0 |
| Tyr146 | 4 | 0 | 10.1 | 0 | |
| Ser3 | 64 | 3.6 | -- | 0.031 | |
| Ser117 | 51 | 31.5 | -- | 0.028 | |
| β2m | Thr4 | 63 | 25.8 | -- | 0.078 |
| Ser33 | 43 | 25.2 | -- | 0.0008 | |
| Ser88 | 97 | 25.7 | -- | 0.021 |
All Tyr residues are included for each protein, but only modified Ser and Thr residues are included.
SASA calculated using GETAREA 1.1. 1.4 Å is used as the probe radius, and the calculated SASA is compared to the surface area of the side chain in a Gly-X-Gly tripeptide generating a % ratio. Residues with % ratio below 20 are typically considered buried whereas those with ratios above 30% are regarded as solvent exposed
pKa calculated using PROPKA
Rate coefficients from dose-response plots
DEPC is known to react with Tyr residues in addition to His residues, but the modification of Ser and Thr residues is previously unreported as far as we are aware. Like Tyr residues, Ser and Thr have weakly nucleophilic alcohol groups capable of reacting with DEPC (Scheme 1). The reactivity of Ser and Thr residues is mostly limited, though, to those residues that are highly exposed (i.e. SASA % ratios > 50%), and so only 21% and 5% of the Ser and Thr residues, respectively, are modified in the three proteins studied here. Nonetheless, this observation dramatically expands the potential of DEPC as a probe of protein structure. Histidine and tyrosine residues cover only 2.2% and 3.3%, respectively, of the sequence of a typical protein.27 In contrast, Ser and Thr cover 7.4% and 6.0% of the sequence of a typical protein.27 Indeed, Ser is the third most abundant residue in proteins. Because Lys (5.8% frequency) and Cys (1.8% frequency) can also be modified by DEPC, this reagent has the potential to cover about 25% of the sequence of a typical protein. This degree of coverage could make DEPC a very general surface mapping reagent for those proteins having typical numbers of His, Tyr, Ser, Thr, Lys, and Cys residues.
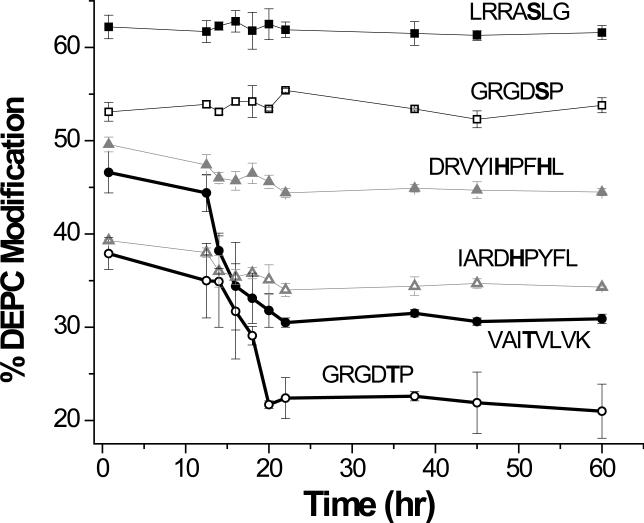
The failure to see more modified Ser and Thr residues might be due to two reasons. First, residues that are modified at very low rates can be difficult to detect under normal LC-MS conditions. Second, covalent modification by DEPC is known to be reversible for His and Tyr; the dissociation reaction of modified His, for example, has a t1/2 of 55 hr at pH = 7. The modifications of Ser and Thr might also be reversible and could conceivably have shorter t1/2, making them even more difficult to detect. To test this second possibility, the reversibility of this reaction was tested for six model peptides that each had at least one Ser, His, or Thr residue. After reacting these peptides with DEPC for 1 min, the products were stored at 37 °C for 22 hr to mimic the digestion conditions and then were stored at −10 °C for the remaining time to mimic the storage conditions used for all the peptides shown in Tables 1, 2, and 3. Aliquots of these reaction mixtures were analyzed at the stated time periods to generate Figure 2. Clearly, the extents of modification to the Ser and His residues do not decrease for up to 60 hours, but the extents of modification to the Thr residues start to decrease after about 10 to 12 hours before leveling off when the samples are frozen. These data suggest that the reaction with Thr is somewhat reversible and may explain why only a small percentage (~ 5%) of modified Thr residues is detected. Further work is needed to fully characterize the reversibility of this reaction, and methods to avoid this situation will be important in order to expand the practical sequence coverage possible with DEPC.
Table 3.
DEPC modification rate coefficients for β2m residues in the presence and absence of Cu(II).
| Fragment | β2m | β2m-Cu | |
|---|---|---|---|
| β2m | -- | 0.078 ± 0.005 | 0.034 ± 0.006 |
| Thr4 | Thr4-Tyr10 | 0.082 ± 0.004 | 0.052 ± 0.009 |
| His13 | His13-Lys19 Ser11-Lys19 |
0.041 ± 0.003 | 0.033 ± 0.005 |
| His31 | Val27-Lys41a | 0.010 ± 0.001 | 0.003 ± 0.001 |
| Ser33 | Val27-Lys41a | 0.010 ± 0.002 | 0.004 ± 0.001 |
| His51 | Val49-Trp60 | 0.036 ± 0.003 | 0.030 ± 0.004 |
| Ser88 | Val82-Lys94 | 0.029 ± 0.007 | 0.020 ± 0.006 |
His31- and Ser33-modified fragments are distinguished because the two modified forms are separated by HPLC and detected separately by MS.
Figure 2.
Changes in DEPC modification percentages over time for peptides containing Ser, His, and Thr residues. Each plot is labeled with the sequence of the peptide that corresponds to the data. The lines are not mathematical fits of the data but are included to help visualize the qualitative trend. The thicker lines are for the peptides containing Thr.
Dose-response Curves as Indicators of Changes in Protein Structure
Information from surface mapping experiments is reliable only if the structural integrity of a protein is preserved during the reaction. Some previous surface mapping studies have used spectroscopic methods such as CD or fluorescence spectroscopy to monitor the effect of modification on the protein structure, or they have assumed that as long as the number of modifications is kept low the protein's structure will not be affected by the label. At best, these approaches may make identification of modified residues difficult by limiting the average number of modifications. At worst, these approaches may lead to errors. CD, for example, provides only the population-weight average properties of a protein sample and may not be sensitive to local structural changes or intra- and intermolecular interactions between protein molecules. Fluorescence spectroscopy can provide local structural information but usually only at Trp residues. Finally, the assumption that limiting the number of modifications will ensure protein integrity may be too simplistic. Some proteins may be able to suffer multiple modifications to surface exposed amino acids without disrupting structure, while the structures of other proteins might be significantly altered by a single modification at just the right site.
Monitoring the extent of protein modification as a function of reagent concentration should be a sensitive method for ensuring that a protein's structure is maintained during the modification reaction. Under the conditions that we use, the reaction of DEPC with a protein is a second-order reaction, and ensuring that this reaction order is maintained at low reagent doses can serve as the means by which protein structural integrity is assured. A second-order reaction can be described by equations 1 and 2, where [P]o is the initial concentration of unmodified protein, [X]o is the initial concentration of DEPC, [P] is the unmodified protein concentration at time t, [X] is the DEPC concentration at time t, and k is the second-order rate coefficient.
| (1) |
| (2) |
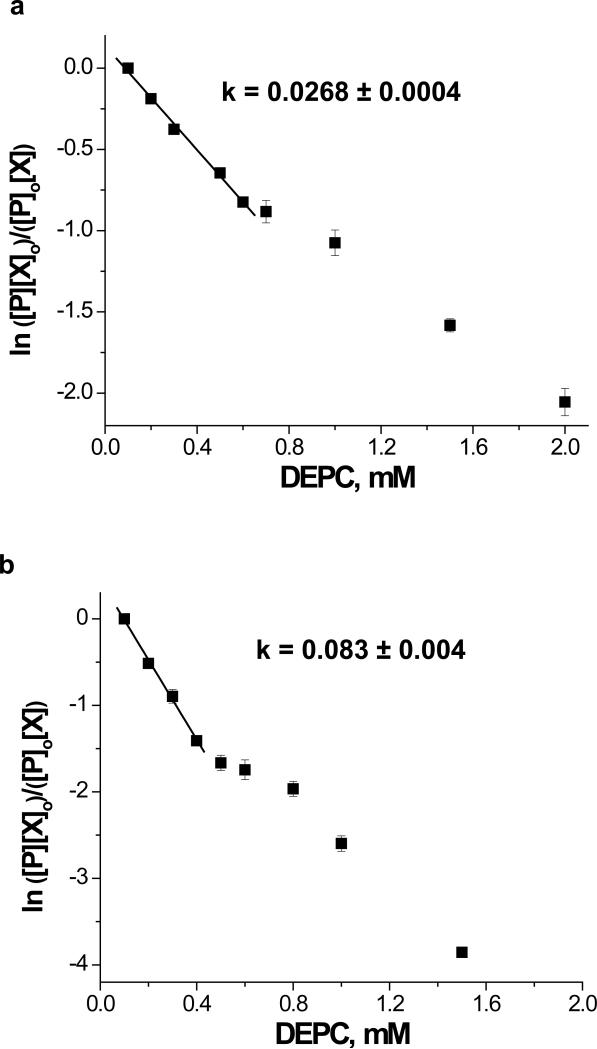
If a reaction is second order, then a plot of ln([P][X]o)/([P]o[X]) vs. [X]o (or t) will result in a straight line. We assume that the second-order modification rate coefficient will be constant as long as the protein's structure remains unchanged, and such a dose-response plot will thus remain linear. Deviations from linearity or changes in the plot's slope will indicate a change in the reaction dynamics that are caused by changes in a residue's microenvironment. Thus, these plots should be very sensitive to any modification-induced structural changes that occur. Measurements of the unmodified protein (and not the modified protein) will also ensure that the initial protein state is being monitored.
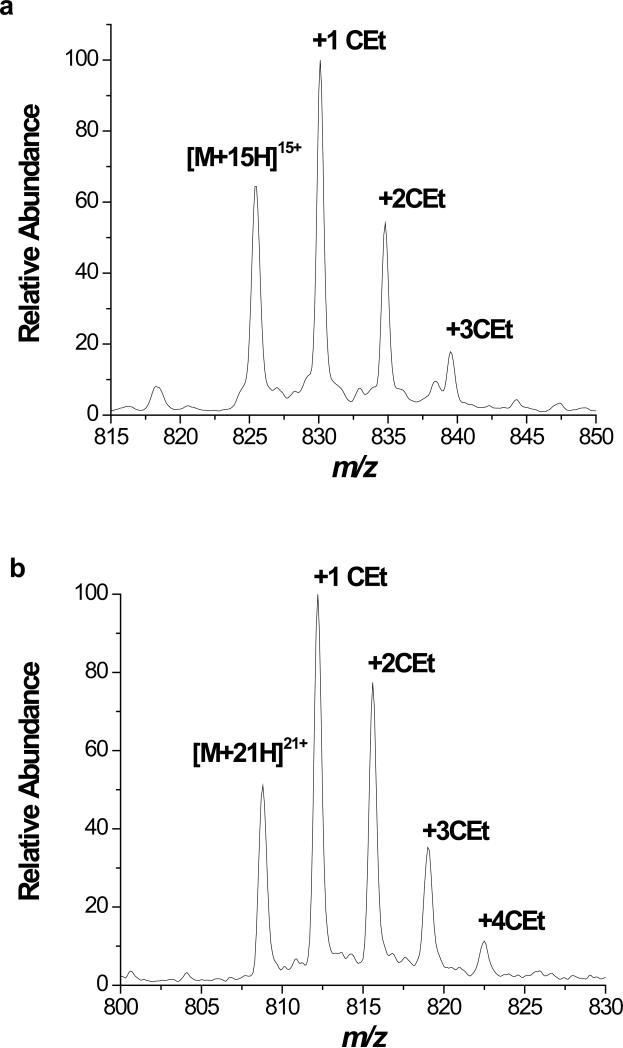
Because DEPC hydrolyzes over time, the reaction time was kept constant (1 min), and different DEPC concentrations were used to generate the second-order reaction plots. At low DEPC concentrations, linear relationships are observed between the unmodified protein and the DEPC concentrations, suggesting second-order kinetics and the proteins’ 3D structures are maintained during the covalent modification reactions of cytochrome c and myoglobin (Figure 3). Deviations from linearity occur at DEPC concentrations above 0.6 mM and 0.4 mM for cytochrome c and myoglobin, respectively, which suggests that the proteins’ structures are disrupted during 1 min reactions with DEPC above these concentrations. Figure 4 shows expanded views of the mass spectra of cytochrome c and myoglobin after reactions with 0.6 mM and 0.4 mM DEPC, respectively. Up to 3 and 4 DEPC adducts are possible for cytochrome c and myoglobin before deviations from linearity are noted. At these DEPC concentrations, the average numbers of modifications per molecule are 1.48 and 0.91 for cytochrome c and myoglobin, respectively. In addition, the modification rate coefficient, k, obtained from the slope of the lines in Figure 3 indicates that myoglobin is more reactive with DEPC than cytochrome c. This is most likely due to the greater number of exposed His residues in myoglobin.
Figure 3.
Dose-response plots for the reactions of DEPC with (a) cytochrome c and (b) myoglobin. The plot for each protein is produced from the ESI-MS data of the DEPC-treated proteins. The [P]/[P]0 ratio is obtained by dividing the peak area for the unmodified protein by the sum of the peak areas for the modified and unmodified protein. The difference between the [P] and [P]o is used to determine the concentration of DEPC, [X]. The k values are obtained by dividing the measured slopes by the reaction time.
Figure 4.
Expanded view of mass spectrum showing the extent of DEPC modification for the (a) +15 charge state of cytochrome c and (b) +21 charge state of myoglobin. CEt refers to a carbethoxy group, which is added upon reaction with DEPC.
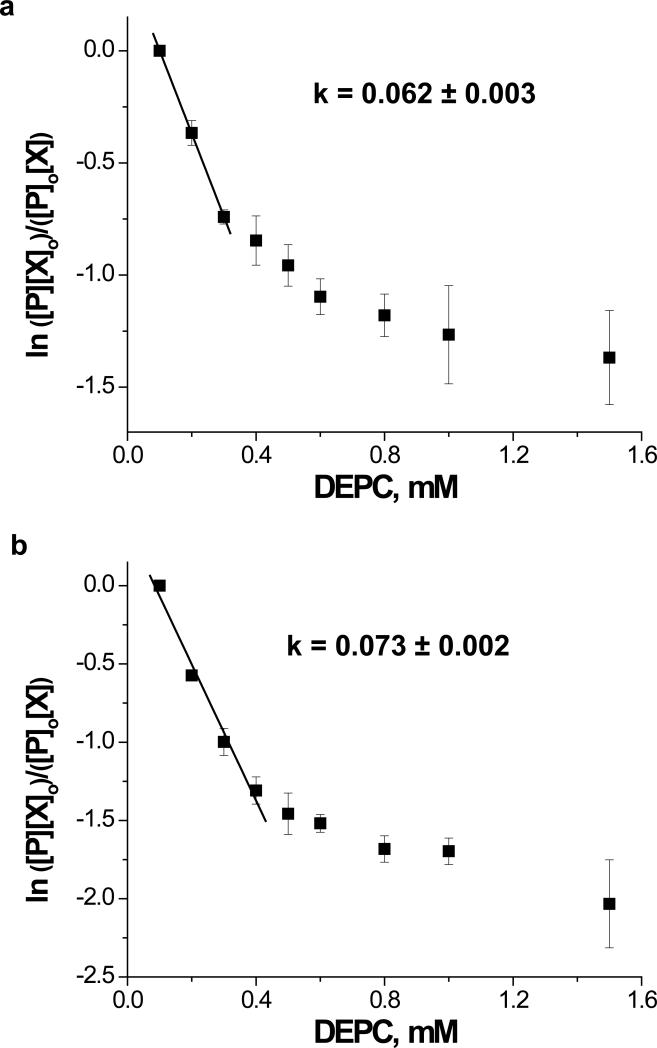
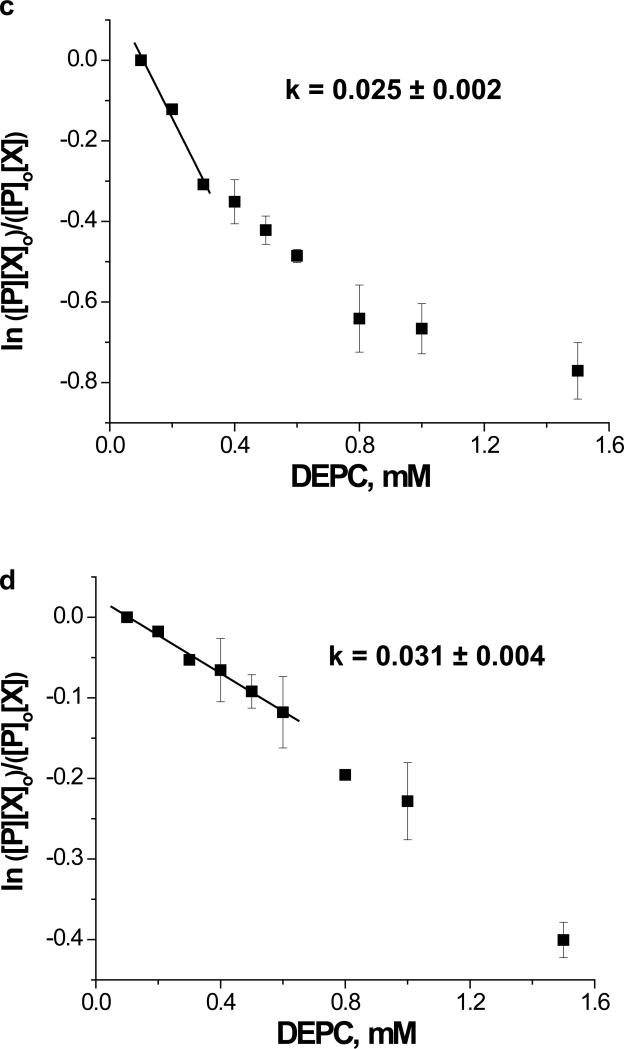
While second-order reaction plots of the whole protein data indicate that global changes to protein structure occur above certain DEPC concentrations, an assessment of local changes in protein structure can be obtained by generating second-order reaction plots for individual proteolytic fragments of the proteins. LC-MS analysis of the tryptic peptides of these proteins reveal that the labeling reactions follow second-order kinetics, but there are differences for each fragment both in the concentration at which deviations from linearity are observed and in the modification rate coefficients (Figure 5). These observations are important for two reasons. First, deviations from linearity at different DEPC concentrations indicate that certain regions of a protein lose their native structure more readily than others upon reactions with DEPC. Second, the rate coefficients are quantitative indicators of a residue's reactivity and might correlate with a residue's SASA, thus providing more precise structural insight (see below).
Figure 5.
Dose-response plots for selected proteolytic fragments of myoglobin after reactions with DEPC. (a) Proteolytic fragment Leu32-Lys45, which contains His36; (b) Proteolytic fragment His48-Lys56; (c) Proteolytic fragment Lys79-Lys96, which contains His81; (d) Proteolytic fragment Gly1-Lys16 which contains Ser3. The plot for each reactive residue is produced from LC-MS data of the proteolytic digests of the modified protein. The ion abundances for the modified and unmodified peptide fragments containing the residue of interest are used to determine [P], [P]o, [X] and [X]o in a manner similar to that described in the caption of Figure 3.
A Comparison with Structural Information from Spectroscopic Techniques
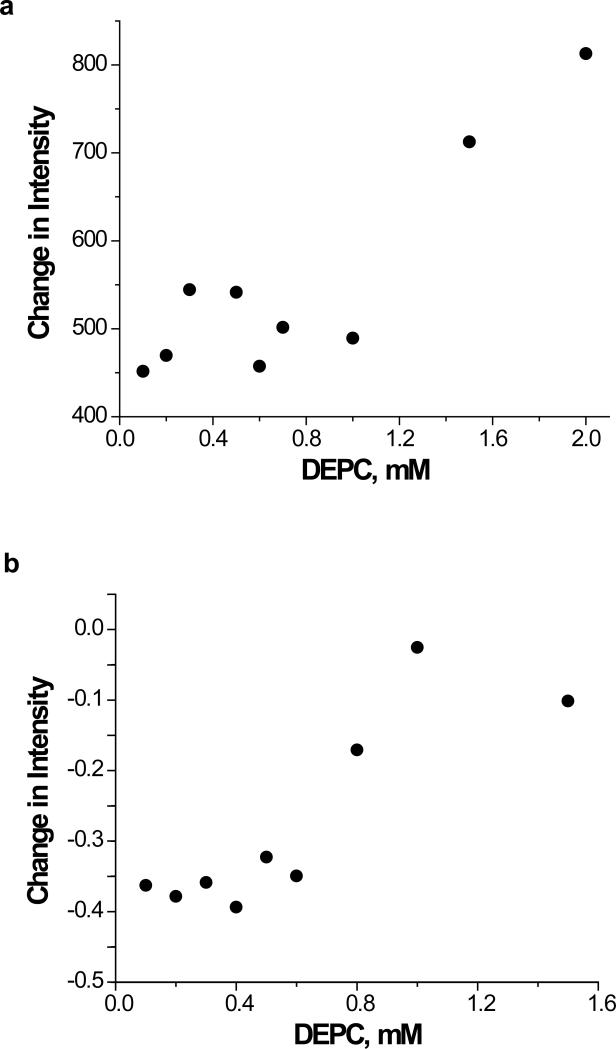
The information obtained from the dose-response plots can be compared to CD and fluorescence data in order to (1) check whether the dose-response plots are valid approaches for testing the maintenance of structural integrity and (2) confirm our hypothesis that the dose-response plots are more sensitive to local structural changes in a protein. Tryptophan fluorescence, far-UV CD, and near-UV CD measurements of cytochrome c and myoglobin were made as a function of reagent concentration. Tryptophan fluorescence is commonly used to monitor structural changes in a protein because the fluorescence intensity of this amino acid residue is very sensitive to local structural changes. Fluorescence measurements (Figure 6) of the proteins are consistent with the MS data in Figure 3. Changes in the fluorescence intensity of cytochrome c and myoglobin at 1.5 and 0.8 mM DEPC, respectively, suggest that there are structural changes in the proteins at these concentrations. Even though the structural changes monitored by fluorescence occur at higher DEPC concentrations than are observed in Figure 3, a comparison of the data from proteolytic fragments containing a Trp residue is most relevant. The DEPC concentration (0.8 mM) at which the fluorescence of myoglobin changes is the same concentration at which the linearity of the dose-response plot for the proteolytic fragment Gly1-Lys16 changes (Figure 5b). This peptide fragment contains myoglobin's two Trp residues at positions 7 and 14, and the DEPC-modified Ser residue in this fragment is at position 3. Evidently, the extent of modification that occurs on myoglobin at DEPC concentrations > 0.8 mM is enough to cause a structural change in the N-terminal region of the protein that is reflected in both the fluorescence and MS data. DEPC-modified fragments containing Trp residues were not detected for cytochrome c, so this same comparison could not be done for this protein. Even though it is only one comparison, the consistency between the MS and fluorescence data for fragment 1-16 supports the idea that the dose-response plots can act as indicators of protein structural changes. Moreover, the fluorescence data can only provide information about the microenvironment of Trp, which is the least commonly occurring amino acid residue. The dose-response plots from LC-MS analyses, on the other hand, enable multiple sites in a protein to be monitored. This appears to be essential for both proteins studied here as the dose-response plots indicate that structural changes occur for some regions of the protein at lower DEPC concentrations than the fluorescence data indicate.
Figure 6.
Fluorescence measurements of (a) cytochrome c and (b) myoglobin after reactions with different concentrations of DEPC. Changes in intensity refer to the difference in protein fluorescence immediately before addition of DEPC and 1 min after the addition of DEPC. Fluorescence was measured at 340 nm for cytochrome c and 320 nm for myoglobin.
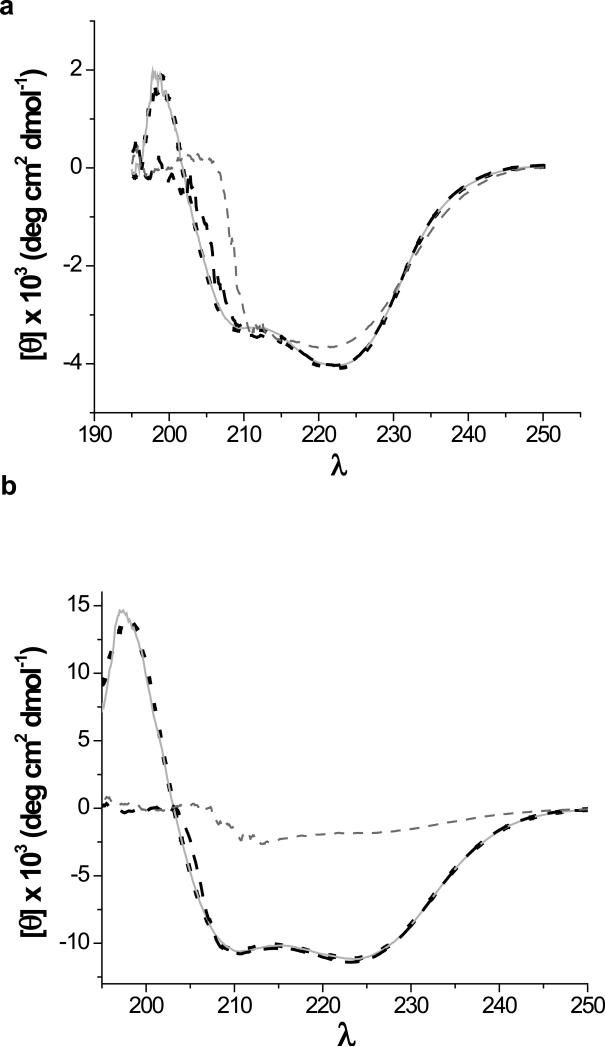
CD spectroscopy is another method that is used to monitor protein structural changes, but this method is much less sensitive to local structural changes. When the far-UV (Figure 7) and near-UV (data not shown) spectra of the proteins in the presence of DEPC are obtained, the results are almost identical to the CD spectra of the native proteins, even for DEPC concentrations up to 2 mM (50-fold excess). For comparison, CD spectra of the proteins in the presence of the denaturant urea are shown to indicate spectral differences that can occur upon changes in protein structure. These results indicate that CD spectroscopy is not as sensitive as the dose-response curves for detecting structural changes that occur upon covalent modification. Several studies have used CD spectroscopy to check changes in protein structure during covalent labeling experiments (see refs. 17 and 19 as examples), but our results suggest that CD spectroscopy may not always be a reliable approach for ensuring protein structural integrity during the modification reactions.
Figure 7.
Far-UV CD spectra of (a) cytochrome c and (b) myoglobin acquired under native conditions (dotted black line), after a 1 min reaction with a 50-fold excess (5 mM) of DEPC (solid light gray line), in the presence of 1 M urea (dashed black line), and in the presence of 9 M urea (dashed gray line).
Concentration Effects
Because the rate coefficient for DEPC modification is second-order, the initial protein concentration plays a role in the extent of modification observed. Modification with 10 μM and 100 μM cytochrome c results in different degrees of modification. The average numbers of modifications per cytochrome c molecule are 0.07 and 0.38 for the 10 μM and 100 μM solutions, respectively, at 0.6 mM DEPC. However, we do not expect the rate coefficient to vary with any change in protein concentration. The modification rate coefficients obtained for the two cytochrome c solutions are identical within experimental error with a k = 0.027 ± 0.001 for the 10 μM solution and a k = 0.0268 ± 0.0004 for the 100 μM solution (see Supporting Information). In addition, the range where linearity holds for the 10 μM solution of cytochrome c is higher when compared to the 100 μM solution. In the 10 μM case, the linearity of the plot holds at 10-fold molar excesses of DEPC whereas linearity is lost in the 100 μM solution at molar excesses above 6-fold. These results are not surprising as the higher concentrations of protein and DEPC increase the rate of the reaction, while not changing the rate coefficient for the reaction. A greater number of modifications occur after 1 min in the 100 μM solution, and modification-induced structural changes thus occur at lower DEPC ratios under these conditions. The relevance of these concentration studies has become apparent because of the recent oxidative labeling studies by Konermann and co-workers.28 Their recent covalent labeling experiments with hydroxyl radicals showed that protein concentration has a critical impact on the level of modification, and if not accounted for correctly, data interpretation ambiguities can occur in oxidative labeling studies of protein-protein interactions.28 Our results clearly show that the second-order plots account for protein concentrations adequately in our covalent labeling studies.
Factors Affecting the Reactivity of Functional Groups
In addition to providing the range of DEPC concentrations over which a protein's structural integrity is maintained, the dose-response curves provide reaction rate coefficients that allow quantitative comparisons between the reactivity of different residues. Previous studies have shown that reactivity is influenced mainly by the solvent accessibility of the amino acid and of the reactive atom.23,25,29,30 The rate coefficients in Tables 1 and 2 indicate that there is not a simple correlation between the modification rates and the solvent accessibility of the entire side chain. The % SASA ratio does not seem to always correlate with the reaction rates. For example, His33 of cytochrome c is not reactive with DEPC despite its high SASA. A better indicator of reactivity appears to be the solvent accessibility of the reactive atom, which is the Nε2 atom in His residues. In cytochrome c, for example, His26 is more reactive with DEPC than His33 despite its lower overall SASA. This is probably due to the higher accessibility of its Nε2 atom. This could also explain why Tyr48 and Tyr74 of cytochrome c do not have the same reactivity with DEPC even though these residues have similar % SASA ratios. Tyr48 is more reactive because its hydroxyl group is more solvent accessible than the hydroxyl group of Tyr74. The lower reactivity of Tyr67, despite a similar OH group SASA as Tyr74, is due to its location in the heme pocket of myoglobin. GETAREA does not calculate SASA with the heme present, so the actual SASA of Tyr67 is surely lower. Similar reasoning explains the lack of reactivity of His93 and His64 of myoglobin and His18 of cytochrome c; the SASA of these residues are artificially high because the heme is not included in the SASA calculation. When the modification rate coefficients for all 18 of the histidine residues from the three proteins in this study are considered, it is clear that only those His residues with Nε2 SASA above 6 Å2 are modified (Tables 1 and 3) with the exception of 2 His residues. The failure of these two His residues (His93 and His113 from myoglobin) to react with DEPC despite Nε2 SASA above 6 Å2 is actually enlightening about the factors that affect His reactivity. His93 is bound to the heme in myoglobin, so as mentioned above its calculated SASA is incorrect. His113 is probably unreactive because of its close proximity (~ 3.3 Å) to Arg31. This nearby Arg residue might H-bond with His113 or its positive charge might hinder the reaction of His113 with DEPC by influencing the partial positive character of the reactive carbonyl carbon of DEPC. The only other His residue in the three proteins that is also close (< 8 Å) to an Arg residue is His31 in β2m. This His residue is reactive, but the modification rate coefficient for this residue is much lower (0.010 M−1s−1) than expected based on its relatively high Nε2 SASA (11.5 Å2). The effect of a nearby charged residue might also be used to explain the lack of reactivity of Tyr103 from myoglobin. Despite its hydroxyl group having a very high SASA, the electrostatic effect of nearby Glu38 (~ 4.3 Å) may lower Tyr103's reactivity. No other Tyr residue has a charged residue so close. The relatively few Ser and Thr residues that are reactive make it difficult to assess the factors that affect the reactivity of these residues.
Even stronger quantitative correlations between modification rate coefficients and the accessibility of the reactive atom are difficult to obtain because of the other potential factors that affect reactivity, such as ionization state, H-bonding, and electrostatic effects of nearby residues. Examples of possible electrostatic effects were briefly mentioned above for His113 and Tyr103 of myoglobin and His31 of β2m. A good example of the effect of ionization state is observed upon considering the reactivity of His81 in myoglobin. Despite having the highest Nε2 SASA, the modification rate coefficient of this residue is modest (0.053 M−1s−1). Not coincidentally, this His residue also has the highest calculated pKa of all the His residues, indicating that under the experimental conditions His81 is protonated in most of the protein molecules. Histidine reacts with DEPC only when deprotonated. Because of the many factors that can influence DEPC reactivity, any quantitative description will clearly require the study of a greater number of proteins.
DEPC reactions of β2m
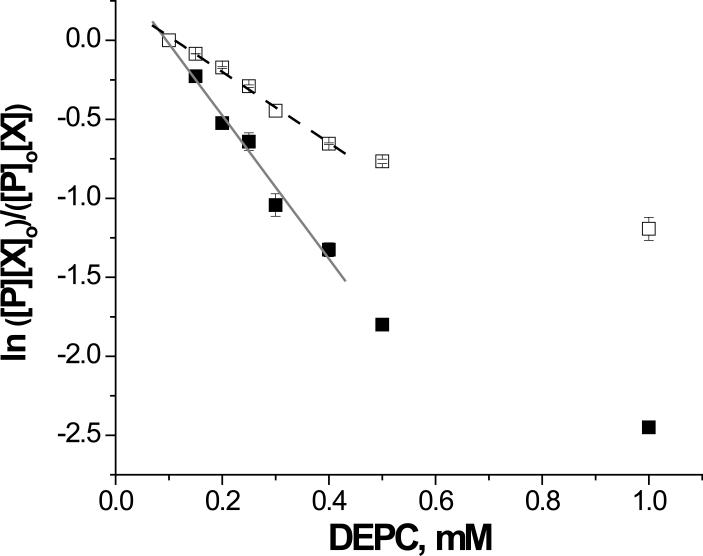
The improved DEPC labeling approach was used to explore the structural changes associated with Cu(II) binding to β2m. β2m accumulates as amyloid fibrils in the musculoskeletal system of long-term hemodialysis patients, leading to a condition known as dialysis-related amyloidosis (DRA). Studies have shown that in vitro interactions of stoichiometric amounts of Cu(II) under near physiological conditions result in fibril formation.31,32 The exact structural changes undergone by the protein as a result of Cu(II) binding, however, are unclear. To gather some insight into possible structural changes associated with Cu(II) binding, the reactions of DEPC with β2m in the presence and absence of Cu(II) were performed. Figure 8 shows that linear relationships are observed at low DEPC concentrations for each condition, indicating that the protein's global structure is maintained at DEPC concentrations below 0.4 mM for both native β2m and β2m in the presence of Cu(II). The extent of β2m modification decreased upon addition of Cu(II) for all the different DEPC concentrations used. This observation is consistent with previous studies of other proteins that show that Cu(II) binding protects residues from DEPC modification.33,34
Figure 8.
Dose-response plots of the reaction of β2m with different concentrations of DEPC in the presence (dashed black line) and absence of Cu(II) (solid gray line).
Six residues in β2m are found to be modified upon reaction with DEPC. Three of the four histidine residues are modified; only the buried His84 was unreactive. Three other solvent accessible residues, namely Thr4, Ser33 and Ser88, were also modified. Similar to the results for cytochrome c and myoglobin, there are slight differences both in the range of concentrations where linearity holds and in the modification rate coefficients for the β2m proteolytic fragments. Three of the six modified residues had statistically the same reactivity whether Cu(II) was present or not (Table 3). These results suggest that there are no significant structural changes in the immediate regions surrounding His13, His51 and Ser88 upon β2m binding Cu(II). In contrast, the reactivity of His31, Ser33, and Thr4 decreased notably upon addition of Cu(II). These observations are consistent with previous studies31,35 that indicate that one of the groups binding to Cu(II) is His31. The 3-fold decrease in reactivity of His31 implies that this histidine residue is protected by Cu(II) from DEPC modification. The reduced reactivity of Ser33 might simply be explained by the nearby binding of Cu(II) to His31, which prevents ready access of DEPC to the side chain of Ser33. Alternatively, others have reported that Cu(II) binding induces a cis to trans backbone isomerization of the Pro32 residue.36 A β2m variant that closely resembles this isomerized structure was designed and its atomic structure was solved using X-ray diffraction (PDB 2F8O). In this crystal structure, the protein adopts a slightly different conformation that places Ser33 closer to the suspected Cu(II) binding site, which would make it less accessible and therefore less reactive. Thus, the drop in Ser33's reactivity observed in our studies may be caused by a similar structural change upon binding Cu(II). The decreased reactivity of Thr4 is also insightful. In addition to binding to His31, Cu(II) is thought to bind to the N-terminal amine and the amide bond between Ile1 and Gln2.35 The decreased reactivity of Thr4 suggests that the orientation of the N-terminal strand, which includes Thr4, is altered enough upon binding Cu(II) to change the solvent accessibility of this residue. No changes in the reactivity of His51 are also somewhat informative. The literature is contradictory with regards to His51's interaction with Cu(II). Our group and others31,35 have found no evidence for Cu(II) binding to His51, whereas an NMR study22 implies that Cu(II) does bind His51 based on the broadening of resonances associated with this residue. The present work provides additional evidence that Cu(II) does not interact with His51, perhaps indicating that the previous NMR results could simply be due to increased conformational flexibility at this residue when Cu(II) binds to β2m.
Conclusions
An improved method of protein surface mapping using covalent modification in conjunction with MS has been described in this work. Results demonstrate that DEPC can react with Ser and Thr residues in addition to His and Tyr residues, which dramatically expands the sequence coverage possible with this reagent. Given the prevalence of Ser and Thr residues in proteins, DEPC may be able to compete with non-specific reagents like hydroxyl radicals as a standalone reagent for protein surface mapping. The lesser number of possible products from DEPC modification makes identification of its modification sites more straightforward when compared to hydroxyl radicals that react with many amino acid residues, generating a variety of possible oxidation products. Another advantage of DEPC over hydroxyl radicals is that it does not require the use of expensive synchrotron or other X-ray sources. Further improvements to the method will be necessary to fully access this potential. Improvements such as better detection of modified Ser and Thr residues will expand the practical sequence coverage possible with DEPC.
This present work also establishes a reliable approach for ensuring protein structural integrity during the modification reactions. Most amino acid-specific covalent labeling studies fail to do this. Dose-response plots are shown to be a useful approach for making sure that the intact structure of a protein is being monitored during the covalent modification reactions. By generating these plots for individual peptide fragments, any small-scale or local perturbations caused by the covalent label can be readily identified and avoided. Furthermore, these plots are more reliable and generally applicable than CD and fluorescence spectroscopies. The dose-response plots provide the added benefit of quantitative information about residue reactivity, which could possibly provide more precise structural information. While our results cannot currently provide a quantitative description of all the factors that affect reactivity, modification rate coefficients seem to reflect both the reactive atom's solvent accessibility and amino acid microenvironment. Finally, initial application of this method to study Cu(II)-β2m interactions provides additional insight into the effect of Cu(II) on this protein's structure. The DEPC reactivity of β2m in the presence of Cu(II) confirms the involvement of His31 in the binding site and further rules out the interaction of His51 with Cu(II). Additional covalent labeling studies are needed to more fully understand the Cu(II)-induced structural changes of β2m that precede amyloid fibril formation of this protein.
Supplementary Material
Acknowledgements
This work was supported by a grant from the National Institutes of Health (RO1 GM075092). V. M. also acknowledges support via a National Research Service Award T32 GM08515 from the National Institutes of Health. We thank Prof. Lila Gierasch for allowing us to use the spectropolarimeter for the CD measurements.
Footnotes
Supporting Information Available
The 60+ references surveyed in the introduction, the MS/MS spectra of all of the modified peptides in Tables 1, 2, and 3, and the dose-response plots of cytochrome c at different protein concentrations are all included in the supporting information. This material is available free of charge via the Internet at http://pubs.acs.org.
References
- 1.Komives EA. Int. J. Mass Spec. 2005;240:285–290. [Google Scholar]
- 2.Eyles SJ, Kaltashov IA. Methods. 2004;34:88–99. doi: 10.1016/j.ymeth.2004.03.015. [DOI] [PubMed] [Google Scholar]
- 3.Wales TE, Engen JR. Mass Spectrom. Rev. 2006;25:158–170. doi: 10.1002/mas.20064. [DOI] [PubMed] [Google Scholar]
- 4.Vasilescu J, Figeys D. Curr. Opin. Biotechnol. 2006;17:394–399. doi: 10.1016/j.copbio.2006.06.008. [DOI] [PubMed] [Google Scholar]
- 5.Sinz A. Mass Spectrom. Rev. 2006;25:663–682. doi: 10.1002/mas.20082. [DOI] [PubMed] [Google Scholar]
- 6.Kluger R, Alagic A. Bioorg. Chem. 2004;32:451–472. doi: 10.1016/j.bioorg.2004.08.002. [DOI] [PubMed] [Google Scholar]
- 7.Suckau D, Mak M, Przybylski M. Proc. Natl. Acad. Sci. USA. 1992;89:5630–5634. doi: 10.1073/pnas.89.12.5630. [DOI] [PMC free article] [PubMed] [Google Scholar]
- 8.Yem AW, Epps DE, Mathews WR, Guido DM, Richard KA, Staite ND, Deibel MR. J. Biol. Chem. 1992;267:3122–3128. [PubMed] [Google Scholar]
- 9.Steiner RF, Albaugh S, Fenselau C, Murphy C, Vestling M. Anal. Biochem. 1991;196:120–125. doi: 10.1016/0003-2697(91)90127-f. [DOI] [PubMed] [Google Scholar]
- 10.Takamoto K, Chance MR. Annu. Rev. Biophys. Biomol. Struct. 2006;35:251–276. doi: 10.1146/annurev.biophys.35.040405.102050. [DOI] [PubMed] [Google Scholar]
- 11.Guan J, Chance MR. Trends Biochem. Sci. 2005;30:583–592. doi: 10.1016/j.tibs.2005.08.007. [DOI] [PubMed] [Google Scholar]
- 12.Dage JL, Sun H. Halsall H.B. Anal. Biochem. 1998;257:176–185. doi: 10.1006/abio.1997.2552. [DOI] [PubMed] [Google Scholar]
- 13.Mailfait S, Belaiche D, Kouach M, Dallery N, Chavette P, Formstecher P, Sablonnière B. Biochemistry. 2000;39:2183–2192. doi: 10.1021/bi9914006. [DOI] [PubMed] [Google Scholar]
- 14.Scholten A, Visser NFC, van den Heuvel RHH, Heck AJ. R. J. Am. Soc. Mass Spectrom. 2006;17:983–994. doi: 10.1016/j.jasms.2006.03.005. [DOI] [PubMed] [Google Scholar]
- 15.Marie G, Serani L, Laprévote O, Cahuzac B, Guittet E, Felenbok B. Prot. Sci. 2001;10:99–107. doi: 10.1110/ps.28201. [DOI] [PMC free article] [PubMed] [Google Scholar]
- 16.Carven GJ, Stern LJ. Biochemistry. 2005;44:13625–13637. doi: 10.1021/bi050972p. [DOI] [PubMed] [Google Scholar]
- 17.Hassani O, Mansuelle P, Cestele S, Bourdeaux M, Rochat H, Sampieri F. Eur. J. Biochem. 1999;260:76–86. doi: 10.1046/j.1432-1327.1999.00152.x. [DOI] [PubMed] [Google Scholar]
- 18.Ehrhardm B, Misselwitz R, Welfle K, Hausdorf G, Glaser RW, Schneider-Mergener J, Welfle H. Biochemistry. 1996;35:9097–9105. doi: 10.1021/bi9603534. [DOI] [PubMed] [Google Scholar]
- 19.Akashi S, Shirouzu M, Terada T, Ito Y, Yokohama S, Takio K. Anal. Biochem. 1997;248:15–25. doi: 10.1006/abio.1997.2122. [DOI] [PubMed] [Google Scholar]
- 20.Šantrůček J, Strohalm M, Kadlčík V, Hynek R, Kodíček M. Biochem. Biophys. Res. Comm. 2004;323:1151–1156. doi: 10.1016/j.bbrc.2004.08.214. [DOI] [PubMed] [Google Scholar]
- 21.Morgan CJ, Gelfans M, Atreya C, Miranker AD. J. Mol. Biol. 2001;309:339–345. doi: 10.1006/jmbi.2001.4661. [DOI] [PubMed] [Google Scholar]
- 22.Villanueva J, Hoshino M, Katou H, Kardos J, Hasegawa K, Naiki H, Goto Y. Prot. Sci. 2004;13:797–809. doi: 10.1110/ps.03445704. [DOI] [PMC free article] [PubMed] [Google Scholar]
- 23.Glocker MO, Kalkum M, Yamamoto R, Schreurs J. Biochemistry. 1996;35:14625–14633. doi: 10.1021/bi961199o. [DOI] [PubMed] [Google Scholar]
- 24.Tsubaki M, Kobayashi K, Ichise T, Takeuchi F, Tagawa S. Biochemistry. 2000;39:3276–3284. doi: 10.1021/bi991883d. [DOI] [PubMed] [Google Scholar]
- 25.Kalkum M, Przybylski M, Glocker MO. Bioconjugate Chem. 1998;9:226–235. doi: 10.1021/bc970162t. [DOI] [PubMed] [Google Scholar]
- 26.Lundblad RL, Noyes CM. Chemical Reagents for Protein Modification. CRC Press; Boca Raton, FL: 1984. pp. 105–126. [Google Scholar]
- 27.Trinquier G, Sanejouand YH. Protein Eng. 1998;11:153–169. doi: 10.1093/protein/11.3.153. [DOI] [PubMed] [Google Scholar]
- 28.Tong X, Wren JC, Konermann L. Anal. Chem. 2007;79:6376–6382. doi: 10.1021/ac070724u. [DOI] [PubMed] [Google Scholar]
- 29.Strohalm M, Šantrůček J, Hynek R, Kodíček M. Biochem. Biophys. Res. Comm. 2004;323:1134–1138. doi: 10.1016/j.bbrc.2004.08.217. [DOI] [PubMed] [Google Scholar]
- 30.Novak P, Kruppa GH, Young MM, Schoeniger JJ. Mass Spectrom. 2004;39:322–328. doi: 10.1002/jms.587. [DOI] [PubMed] [Google Scholar]
- 31.Eakin CM, Knight JD, Morgan CJ, Gelfand MA, Miranker AD. Biochemistry. 2002;41:10646–10656. doi: 10.1021/bi025944a. [DOI] [PubMed] [Google Scholar]
- 32.Eakin CM, Attenello FJ, Morgan CJ, Miranker AD. Biochemistry. 2004;43:7808–7815. doi: 10.1021/bi049792q. [DOI] [PubMed] [Google Scholar]
- 33.Li C, Rosenberg RC. J. Inorg. Biochem. 1993;51:727–735. doi: 10.1016/0162-0134(93)85005-s. [DOI] [PubMed] [Google Scholar]
- 34.Qin K, Yang Y, Mastrangelo P, Westaway DJ. Biol. Chem. 2002;277:1981–1990. doi: 10.1074/jbc.M108744200. [DOI] [PubMed] [Google Scholar]
- 35.Lim J, Vachet RW. Anal. Chem. 2004;76:3498–3504. doi: 10.1021/ac049716t. [DOI] [PubMed] [Google Scholar]
- 36.Eakin CM, Berman AJ, Miranker AD. Nature Struct. Mol. Biol. 2006;13:202–208. doi: 10.1038/nsmb1068. [DOI] [PubMed] [Google Scholar]
Associated Data
This section collects any data citations, data availability statements, or supplementary materials included in this article.


