

Abstract
Alzheimer’s disease (AD) is a large and growing public health problem. It is characterized by the accumulation of amyloid-β peptides and abnormally phosphorylated tau proteins that are associated with cognitive decline and dementia. Much has been learned about the genomics of AD from linkage analyses and more recently, genome-wide association studies. Several but not all aspects of the genomic landscape are involved in amyloid-metabolism. The moderate concordance of disease among twins suggests other factors, potentially epigenomic factors, are related to AD. We are at the earliest stages of examining the relation of the epigenome to the clinical and pathologic phenotypes that characterize AD. Our literature review suggests that there is some evidence of age-related changes in human brain methylation. Unfortunately, studies of AD have been relatively small with limited coverage of methylation sites and microRNA, let alone other epigenomic marks. We are in the midst of two large studies of human brains including coverage of more than 420,000 autosomal cytosine-guanine dinucleotides (CGs) with the Illumina Infinium HumanMethylation 450K BeadArray, and histone acetylation with chromatin immunoprecipitation-sequencing. We present descriptive data to help inform other researchers what to expect from these approaches in order to better design and power their studies. We then discuss future directions to inform on the epigenomic architecture of AD.
Keywords: Epigenomics, Alzheimer’s disease, methylation, histone acetylation, chromatin states
AGING AND DEMENTIA
Persons over the age of 65 are the most rapidly growing segment of the population throughout the developed world as a result of increasing life expectancy and declining fertility over the past century. This demographic trend will continue throughout the 21st century, and similar trends are forecast for developing countries in the latter half of this century. Thus, the world’s population is aging rapidly making common chronic conditions of aging an urgent and growing public health problem. Looming large on this landscape is age-related cognitive decline, which can progress to mild cognitive impairment (MCI), i.e., obvious cognitive impairment in which most activities of daily living remain intact, followed by dementia, i.e., cognitive impairment contributing to impaired activities of daily living. The incidence and prevalence of dementia increase markedly with age. There are numerous causes of dementia. The most common cause is Alzheimer’s disease (AD); however, cerebrovascular disease (CVD), Lewy body disease (LBD), and hippocampal sclerosis (HS) are also well-recognized causes. More recently, TAR DNA-binding protein 43 (TDP-43), originally thought to be a relatively rare pathology, has been shown to be quite common and also associated with dementia in aging populations. Thus, while Alzheimer’s disease may play a large role in dementia, many other processes contribute to aging-related cognitive decline.
The projected impact of dementia in general and AD in particular on both health care costs and pension plan has recently captured the attention of economists, politicians and other policy makers.1–5 This is of particular concern in Western European countries with publically funded health and pension systems. Thus, the USA and many European countries now have or are developing “National Plans.”6–12 France was the first country with a National Dementia Plan, launched in 2001. The Netherlands launched their National Dementia Plan in 2008, followed by the UK in 2009, Denmark in 2010, and others have followed suit. The US Congress unanimously passed the National Alzheimer’s Project Act (NAPA; P.L. 111-375) in 2010 and the initial plan was unveiled in 2012. British Prime Minister David Cameron, G8 president in 2013, announced at a G8 Dementia Summit, that the G8 would lead a global plan to address AD.13–14
CLINICAL AND NEUROPATHOLOGIC FEATURES OF ALZHEIMER’S DISEASE
Clinical manifestations
AD is the most common cause of dementia in old age. However, progress over the past quarter century has led to new conceptualization of AD as a chronic disease that begins with a subclinical pathophysiologic process, followed by subtle cognitive decline, MCI due to AD, and finally to AD dementia which is now considered end stage AD.15–17 The core feature of AD is memory loss. Memory is the recording, storage, and retrieval of information and accounts for all behavioral changes based on prior experience from single cell organisms to complex human behaviors. There are many forms of memory. The clinical hallmark of AD is progressive loss of episodic memory, the explicit recall of the times, places, and associated contextual characteristics that comprise the autobiography of one’s life. However, all cognitive abilities are eventually affected, and in many cases, multiple cognitive abilities are affected early in the disease process. The pace of cognitive decline varies widely and can range from a year to two decades. Although defined by its effect on cognition, AD affects a wide range of other abilities including gait, physical frailty and other motor abilities, smell, and sleep, and can be accompanied by depression, delusions and hallucinations.18–22
About 5 million people in the US are affected by AD dementia.23–25 While the CDC reported fewer than 90,000 deaths based on death certificates in 2010, a recent study estimated that more than 500,000 excess deaths were associated with AD in 2010, putting it on a par with cancer and heart disease.26 If MCI due to AD was included in these estimates based on the new consensus criteria both numbers would be higher.27–28
Pathologic features of AD
The neuropathologic hallmarks of AD are the extracellular deposition of a 40-42 amino acid amyloid-β protein in the form of plaques and the phosphorylation of intracellular microtubule associated tau proteins in the form of neurofibrillary tangles.29 In line with the recently accepted chronic disease model of AD, the pathologic indicators can be present in people without cognitive impairment, in addition to those with MCI due to AD and AD dementia.29–30 Further, there is good evidence that the deposition of amyloid-β precedes the accumulation of tangles and that both develop pathologies accumulate prior to the onset of overt cognitive impairment.31–32 Further, using positron emission tomography, amyloid is seen in persons at genetic risk years prior to their estimated disease onset.33 There are a variety of other ancillary changes in the brain such as degeneration of the cholinergic basal forebrain and other subcortical and brainstem nuclei, inflammation, and oxidative stress.34–40
Mixed disease and AD dementia and MCI
AD is among the most common chronic diseases of aging and its occurrence is strikingly related to age. Thus, it often is accompanied by co-morbid conditions, including other diseases that cause dementia. These conditions include CVD, LBD, HS, and more recently, TDP-43.41–44 The vast majority of data suggest that these pathologies have an additive effect on the odds of dementia, although one study reported that AD and CVD had a multiplicative effect on the odds of dementia.45–49 The result is that mixed diseases are the most common cause of dementia, including AD dementia.50–51 Thus, it may be best to categorize the contribution of AD and other conditions to dementia. For example, the term vascular dementia is no longer preferred and has been replaced by vascular cognitive impairment.52 Further, although the five conditions listed above appear to account for nearly all cases of dementia, it turns out that they only account for about half of the variability of cognitive decline.53 These observations have profound implications for how we interpret studies of risk factors for AD. Specifically, it means that some risk factors for AD may be related to a co-morbid disease such as diabetes with cerebrovascular disease.54–55 By contrast, other risk factors for AD may be unrelated to any extant pathology such as early and late cognitive activity.56–57 These observations are equally important when considering genomic and epigenomic risk factors as will be discussed below.
HERITABILITY OF AD
Evidence of the heritability of AD comes from both family studies and twin studies.
Family studies
Familial aggregation in AD has been recognized for many years with persons with a first degree relative with AD having a two- to four-fold risk of AD.58–61 Interestingly, because AD is so common in older persons and genomic risk factors tend to have variable penetrance, AD risk among first degree relatives varies by age such that the risk is highest among relatives of probands with earlier ages of onset compared to relatives of probands with later ages of onset.62 Further, AD endophenotypes such as impairment of episodic memory and plasma amyloid-β levels have also been shown to be heritable.63–64 Finally, in rare and primarily early onset cases, the disease has been found to run in families in an autosomal dominant fashion.65–67
Twin Studies
Numerous twin studies also demonstrate the heritability of AD.68–71 However, the concordance rate varies widely and is substantially less than 100%, suggesting that factors other than genomic sequence influence disease occurrence.
GENETICS OF AD
Genetic linkage studies employed in the 1990’s successfully yielded the identification of mutations in three genes that contribute to autosomal dominant early onset AD, and two common polymorphisms associated with late-onset AD. Following the sequencing of the human genome and the development of genome-wide association studies (GWAS), many additional polymorphisms were identified in the past five years.
Mutations and cytogenetic alterations
It has long been known that adults with trisomy 21 (Down’s syndrome) develop the clinical and pathologic features of AD in mid life.72–78 This led to an intensive search for a mutation on chromosome 21.79 A mutation in the gene that encodes the amyloid precursor protein (APP) was eventually identified.80–82 This was followed by linkage to chromosome 14, and the eventual discovery of a mutation in PSEN1 that codes for the protein presenilin-1.83–87 The third gene, PSEN2 which codes for the protein presenilin-2, was identified after linkage to chromosome 1.88–90
Polymorphisms
Linkage to chromosome 19 resulted in the identification of two polymorphisms in the apolipoprotein E gene associated with AD: the APOE ε4 haplotype is associated with an increased risk of AD, and the APOE ε2 haplotype is associated with decreased risk.91–94 Over the past five years, the GWAS era has yielded a number of additional polymorphisms. There are now nine loci containing susceptibility alleles that are considered confirmed including (ABCA7, BIN1, CD33, CLU, CR1, CD2AP, EPHA1, MS4A6A-MS4A4E and PICALM that have been confirmed by a number of different studies.95–100 The most recent GWAS with nearly 75,000 subjects identified these, as well as SORL1 (which had previously been suggested to be a susceptibility locus), and 11 novel loci including HLA-DRB5/HLA-DRB1, PTK2B, SLC24A4-RIN3, DSG2, MEF2C, INPP5D, NME8, ZCWPW1, CELF1, FERMT2, and CASS4.101
Biologic mechanisms linking genomic risk factors to AD
Mutations in APP, PSEN1 and PSEN2 played a crucial role in advancing our understanding of AD. APP is a transmembrane protein that, when cleaved, yields the amyloid-β 1-42 peptide that represents an essential pathologic hallmark of AD. APP cleavage is accomplished by a set of three secretases, α, β, and γ.102–106 β-secretase is the protein BACE-1.107–108 Cleavage with this secretase is a prerequisite for generating the amyloid-β peptide. α-secretase cleaves within the amyloid-β 1-42 peptide sequence preventing the generation of the amyloid-β protein. By contrast, γ-secretase cleaves elsewhere and leaves the amyloid-β fragment intact allowing the generation of the amyloid-β peptide. Presenilin-1 and -2 are both components of γ-secretase and lead to the development of AD. Mutations in BACE are not known to cause AD.
There is extensive evidence that APOE is somehow involved in amyloid deposition most likely via clearance of amyloid-β.109–113 It is likely, however, that two or more mechanisms are involved. Despite the fact that APOE ε4 is sufficiently common to make it a practical genotype-specific target for drug development and more than two decades of research, APOE ε4 remains a research tool and has very limited clinical utility.114 Identifying and validating therapeutic targets in the pathway(s) linking these genomic variants to AD is among the most urgent issues in the field.
The relation of the other genetic risk factors to classic AD pathology has only recently been the subject of investigation. Approaches include associations with neuropathologic traits at autopsy or with imaging or biofluid biomarkers. The data to date suggest that some but not all of the newly discovered genomic variants are related to classic AD pathology such as amyloid and that the effect sizes tend to be small, as one might suspect in view of the strength of associations in the GWAS. The results are variable but include CR1, ABCA7, CD2AP, CD33, PICALM and SORL1.115–121
EPIGENETICS OF AD
The highly variable and relatively low concordance rates for AD among identical twins clearly indicate that factors in addition to sequence variation must play an important role in AD susceptibility, raising the possibility of a role for epigenetics. In the only study of a pair of monozygotic twins discordant for AD, a lower global 5-methylcytosine fluorescence intensity was seen in the temporal neocortex of the affected twin providing further support for a role of epigenetics (Table 2, reference 146). Further, there is evidence supporting age-related differences in human blood and brain methylation in advanced age (see below).
Table 2.
Summary of studies on DNA Methylation and AD using Human Tissue
| Reference | Methodology | Main Approach | Samples/Tissue | N | Primary Finding |
|---|---|---|---|---|---|
| 142 | Southern blot | Target gene analysis (APP) | Human temporal lobe (Brodmann area 38) | 1 female AD, 1 female non-AD dementia, and 1 female control | A site in APP is not methylated in AD |
| 143 | Western Blot | Target analysis on PP2A(C) | Human middle frontal gyrus (Brodmann areas 9 or 46), superior temporal gyrus (Brodmann area 22), and the cerebellum | 48 AD and 24 matched controls | Decreased PP2A(C) methylation levels in AD |
| 124 | PCR | Target gene analysis (50 loci, covering primarily 5′ CG islands of genes related to CNS growth and development) | Human temporal cortex | 17 fetal, 15 child and 93 adults, among adults 18 AD. | increased DNA methylation for SORBS3 and S100A2 in AD |
| 144 | MALDI-TOF mass spectrometry | Target gene analysis (12 AD susceptibility loci) | Human prefrontal cortex | 24 AD and 10 matched controls | significant epigenetic difference between AD and controls; age-specific epigenetic drift in AD; genes participating in amyloid-β processing (PSEN1, APOE) and methylation homeostasis (MTHFR, DNMT1) show a significant interindividual epigenetic variability |
| 145 | PCR | Target genes analysis (RAGE, ADORA2A, UCHL1, MAPT, PSEN1, and APP) | Human frontal cortex and hippocampus | AD including 17 stage I-II; 15 stage III-IV; and 12 V-VI, and 26 controls | No differences in CG methylation between cases and controls |
| 146 | Immunohistochemistry | Global methylation(5-methylcytosine [5mC]) | Human temporal neocortex | A pair of monozygotic twins discordant for AD | Reduce level of DNA methylation in AD twin. |
| 147 | Immunohistochemistry | Global methylation (two DNA methylation markers of 5-methylcytosine and 5-methylcytidine, and eight methylation maintenance factors) | Human entorhinal cortex | 20 AD and 20 controls | Reduce level of DNA methylation in AD. |
| 148 | Bisulfite sequencing | Target analysis on APP | Human cortex and cerebellum | 6 familial AD cases | no methylation in APP associated CG-island |
| 149 | qPCR pyrosequencing | Target analysis on repetitive elements of Alu, LINE-1 and SAT-α | Human whole blood | 43 AD and 38 matched controls | LINE-1 methylation was increased in AD |
| 150 | Illumina Infinium HumanMethylati on27 BeadArray; and PCR | Genome wide DNA methylation association study (27,578 CGs); and target genes analysis | Human glioblastoma H4 cells and APP695-Swedish mutant | - | Reduced global DNA methylation in H4-sw cells. Target gene analysis shows CTIF, NXT2 are hypomethylated and DDR2 hypermethylated in H4-sw cells |
| 151 | real-time PCR | Target gene analysis (FAAH) | Human peripheral blood mononuclear cells | 33 LOAD; 33 age/sex-matched controls | Methylation at the gene promoter is significantly less in LOAD. |
| 152 | real-time PCR | Target genes analysis | Human frontal cortex (Brodmann area 9) | 10 AD and 10 age matched controls | CG islands in promoter regions for COX-2 and NF-κB are hypomethylated in AD, and those for BDNF and CREB are hypermethylated. |
| 153 | Mass spectrometry using the Sequenom EpiTYPER platform | Target gene analysis (SNAP25) | Human entorhinal, auditory cortices and hippocampus; and peripheral blood leukocytes | 10 healthy elderly and 10 AD (brain); 22 young and 23 elderly controls and 24 AD (blood) | No difference in SNAP25 promoter DNA methylation |
| 154 | real-time PCR | Target gene analysis (PIN1) | Human peripheral blood mononuclear cells | 32 LOAD; 28 age-matched controls | Methylation at the gene promoter is significantly less in LOAD. |
| 155 | Illumina Infinium HumanMethylation27 BeadArray | Genome wide DNA methylation association atudy (27,578 CGs) | Human frontal cortex | 12 LOAD; 12 age/sex matched controls | 948 CG sites from 918 genes show association with LOAD. The top hit is in promoter of TMEM59. |
| 156 | Real Time PCR and MALDI-TOF mass spectrometry | Target gene analysis (SORL1 and SIRL1) | Human entorhinal and auditory cortices and hippocampus; peripheral blood leukocytes | 12 AD; 10 controls (brain); 36 AD; 25 young and 23 elderly controls(blood) | Neither genes show different in promoter DNA methylation in blood or brain |
| 157 | Custom microarray (Illumina’s VeraCode GoldenGate DNA methylation assay); Pyrosequencing and Immunoblot analysis | The array includes 384 mouse genes, enriched in genes related to sensory perception, cognition, neuroplasticity, brain physiology and mental diseases. The average interrogated CGs is 2.7. | Human frontal cortex (Brodmann area 9] | 20 AD [Braak stage V-VI] and 20 age/sex matched controls (human) | Four genes [TBXA2R, F2RL2, SORBS3 and SPTBN4] were hypermethylated in the frontal cortex of transgenic AD mice. Three of them were hypermethylated in humans. |
| 158 | dot blot immunochemistry | Global methylation (5-methylcytosine [5mC]; 5-hydroxymethylcytosine [5hmC], 5-formylcytosine [5fC] and 5-carboxylcytosine [5caC]) | Human hippocampus/parahippoc ampal gyrus (HPG) and cerebellum | 5 age-matched controls, 5 preclinical AD (PAD) and 7 late-stage AD (LAD) | Increased levels of 5mC and 5hmC, and decreased levels of 5fC and 5caC in the HPG of AD subjects. |
| 159 | Immunohistoche mistry and image analysis | Global methylation (5-methylcytidine [5-mC] and 5-hydroxymethylcytidine [5-hmC] | Human hippocampus | 10 AD, and 10 age matched controls; and a pair of monozygotic twins discordant for AD | Decrease in the hippocampal levels of 5-mC and 5-hmC in AD hippocampus. |
| 160 | Immunohistochemistry | Global methylation (5-methylcytosine [5mC]; 5-hydroxymethylcytosine [5hmC]) | Human middle frontal gyrus (MFG) and middle temporal gyrus (MTG) | 13 AD (MFG) and 13 age matched controls; 29 AD (MTG) and 29 age matched controls | Hypermethylation and increased level of 5hmC in both AD MFG and MTG. |
| 161 | pyrosequencing | Target analysis on ACE, APOE, APP, BACE1, GSK3B, MAPT and PSEN1 | Human inferior temporal lobe, the superior parietal lobe and the cerebellum | 62 AD 106 Controls |
15 CGs among APP, GSK3B, MAPT were differentially methylated in AD |
| 162 | methylation-sensitive high-resolution melting (MS-HRM) quantitative assay | Target analysis on repetitive elements of LINE-1 | Human blood | 28 Colombian LOAD and 30 controls | No differences in LINE-1 methylation levels |
| 163 | real-time PCR | Target analysis on 5-lipoxygenase (5-LOX) | Human blood | 27 LOAD and 28 Age matched controls | Reduced methylation at 5-LOX gene promoter in AD |
| 164 | Mass spectrometry using the Sequenom EpiTYPER platform | Target analysis on CNP and DPYSL2 | Human entorhinal and auditory cortices and hippocampus | 10-11 AD; and 8-9 Controls | No differences in CNP and DPYSL2 promoter DNA methylation |
| 165 | 385K DNA Methylation microarrays; Site-specific qPCR | Global and site specific methylation | Human neuroblastoma cells with and without AB treatment | - | AB changes DNA methylation of cell fate genes |
| 166 | mass spectrometry | Target analysis of two chaperones, HSPA8 and HSPA9 | Human entorhinal and auditory cortices and hippocampus; peripheral blood leukocytes | 12 AD; 10 controls (brain); 34 AD; 23 elderly controls(blood) | No DNA methylation differences are observed between AD and controls |
| 167 | Illumina Infinium HumanMethylati on450 BeadChip | Genome-wide DNA methylation analysis | Human buccal epithelial cells | 10 adults with Down Syndrome and 10 controls | 5 CpGs are correlated with cognitive function including two in the TSC2 gene. |
| 168 | Immunohistochemistry | Four cytosine modifications, including 5-methylcytosine (5-mC), 5-hydroxymethylcytosine (5-hmC), 5-formylcytosine (5-fC) and 5-carboxylcytosine (5-caC) | Human entorhinal cortex and cerebellum | 13 AD and 8 controls | decrease in global 5-hmC in AD; and a significant difference in 5-fC between brain regions in AD |
Nearly all epigenomic studies of AD to date are relatively small, targeted, and limited to one epigenomic mark. There are a few custom microarrays and data from first generation DNA methylation chip technology, e.g., Illumina Infinium HumanMethylation27 BeadArray that interrogates a very small and non-random fraction of the methylome. Thus, the landscape is either biased or sparse and resembles the early days of genomics prior to the large GWAS studies. Most candidate SNP studies were simply not replicated, and it took large unbiased studies to identify the common genetic variants other than APOE ε4. However, the epigenome is much more complicated with a relatively large number of epigenomic marks. We also have limited knowledge regarding their correlation structure, their cell type specificity, and the potential for reverse causality (where the trait of interest such as AD influences the epigenome). So, the complexities of interrogating the epigenome relative to GWAS are compounded many fold. These issues make it impossible to draw any definitive conclusions regarding the relation of the epigenome to AD at this time. Below, we briefly discuss studies published to date and then share some descriptive work relating to different approaches of measuring epigenomic profiles in brain and to assessing data from a large number of human brains profiled with the Illumina Infinium HumanMethylation450K BeadArray, the one platform capable of high-throughput work. There is as yet no published data of such large-scale studies. Thus, while this field holds great promise, it is nascent, and the first generation of large studies are beginning to define the key parameters needed to perform epigenomic epidemiology studies.
DNA methylation
Cytosine-guanine (CG) dinucleotides are prominent sites for DNA methylation and are variably distributed across the genome. There are an estimated 23 million CG sites in the human genome, which can be interrogated by a variety of approaches. Interrogating the whole methylome remains labor intensive and expensive and is not yet amenable to high throughput.
We found 20 studies from 1999 to date on the relation of DNA methylation to age (Table 1).122–141 Of these, six were of brain and the rest of peripheral biospecimens. Of the brain studies, only three had sample sizes greater than 100. One of these studies was a targeted study of 50 CG sites using PCR.124 The other two studies used the Illumina Infinium HumanMethylation27 BeadArray.130,133 All three studies showed relatively robust positive correlations between methylation and age.
Table 1.
Summary of studies on DNA Methylation and Age using Human Tissue
| Reference | Methodology | Main Approach | Samples/Tissue | N | Primary Finding |
|---|---|---|---|---|---|
| 122 | PCR | Target gene analysis (APP) | Human parietal cortex (superior parietal lobule or supramarginal gyrus) | 10 subjects (six males and four females, aged 35–90 years) | Methylcytosines decrease with age in the APP promoter region |
| 123 | PCR | Target gene analysis (tau) | Human parietal cortex | 16 subjects (14 males and two females, aged 35–90 years) | Methylcytosines decrease with age in the promoter region of the tau gene |
| 124 | PCR | Target gene analysis (50 loci, covering primarily 5′ CG islands of genes related to CNS growth and development) | Human temporal cortex | 17 fetal, 15 child and 93 adults. | Increased DNA methylation in 8 loci (GABRA2, GAD1, HOXA1, NEUROD1, NEUROD2, PGR, STK11, SYK) across the age span |
| 125 | Illumina GoldenGate Methylation assay | Selected CG sites in the array (280 high quality probes in 250 genes) | Whole blood | 23 MZ twin-pairs; 23 DZ twin-pairs (N = 92) 96 healthy controls | 22% of interrogated sites are related to age, including six loci of ACVR1, IL6, CARD15, PDGFRA, NFKB1, ELK3; 23% are highly heritable including AXL, GSTM1, TIAM1 and TEK |
| 126 | Illumina GoldenGate methylation bead arrays; Pyrosequencing | 1,413 autosomal CGs in 773 genes | Nonpathologic human tissues | 12 brain; 53 lung; 85 blood; 18 pleural; 11 head/neck anatomic site; 5 bladder; 6 kidney; 5 small intestine; 19 placenta | Methylation increases with age CG islands; decrease with age in non-CG islands site |
| 127 | Illumina HumanMethylatio n27 BeadChips | genome-wide DNA methylation analysis | Human whole blood; CD14+ monocytes and CD4+ T-cells; buccal cells | 31 twin pairs and 31 singletons (blood); 25 singletons (monocytes and T-cells); 10 (buccal cells) | Aging-associated differentially methylated regions (aDMRs) are found in multiple tissues. Aging-associated hypermethylation occurs predominantly at bivalent chromatin domain promoters |
| 128 | Illumina HumanMethylatio n27 microarrays | genome-wide DNA methylation analysis | Mesenchymal stromal cells (MSC) | 4 young (21–50 years) and 4 elderly donors (53–85 years) | 295 CGs are hypermethylated, and 349 CGs are hypomethylated upon aging |
| 129 | Illumina HumanMethylatio n27 microarrays | genome-wide DNA methylation analysis | Saliva | 34 male identical twin pairs between 21 and 55 years of age | 88 CG sites near 80 genes are significantly correlated with age |
| 130 | Illumina HumanMethylatio n27 BeadChips | genome-wide DNA methylation analysis | Human frontal cortex, temporal cortex, pons and cerebellum | 387 subjects between the ages of 1 and 102 years | Majority of associated CGs are within CG islands and methylation are positively correlated with age. |
| 131 | Illumina HumanMethylatio n27 BeadChips | genome-wide DNA methylation analysis | Human dermal fibroblasts | 9 young (<23 years) and 6 elderly donors (>60 years) | 75 CG sites differ their methylation level by more than 15% between the age groups |
| 132 | Bisulfite sequencing | Target gene analysis (MCHR1) | Blood | 49 | DNA methylation at MCHR1 is allele-specific, age-dependent, BMI-associated and affects transcription |
| 133 | Illumina HumanMethylatio n27 BeadChips | genome-wide DNA methylation analysis | Human prefrontal cortex | 108 subjects | DNA methylation shows unique temporal patterns across life. |
| 134 | Illumina Infinium HumanMethylatio n450 BeadChip | genome-wide DNA methylation analysis | Human whole blood | 64 subjects | 3 regions of ELOVL2, FHL2, and PENK genes strongly correlated with age |
| 135 | PCR | Longitudinal target genes analysis | Human blood | 784 elderly men | Aging was associated with decreased methylation of GCR, iNOS and TLR2 and with increased methylation of IFNγ, F3, CRAT and OGG |
| 136 | MALDI-TOF mass spectrometry | 4 target regions in the imprinted IGF2/H19 locus | Whole blood | 376 age/sex matched individuals that differ in ancestral geographical origin and place of living (cohort 1); 31 MZ and 16 DZ twin couples of different ages, but homogeneous for geographic origin | No differences in methylation by ancestry/geography; In MZ twins intra-couple variations increased after the age of 60 years two IGF2/H19 regions |
| 137 | Illumina HumanMethylatio n27 BeadChips | genome-wide DNA methylation analysis | Whole blood | 172 female twins aged 32 to 80; 44 younger adult MZ twins aged 20 to 61 | Majority of age-related changes in methylation are not associated with phenotypic measures of healthy ageing in later life. |
| 138 | Whole-genome bisulfite sequencing (WGBS); and Illumina Infinium HumanMethylatio n450 BeadChip | genome-wide DNA methylation analysis | Blood | 1 newborn (male Caucasian) and 1 centenarian [WGBS]; 19 newborns (Caucasians) and 19 nonagenarians (Caucasians) | More hypomethylated DNA sequences in the advanced age group |
| 139 | Illumina HumanMethylatio n27 BeadChips | genome-wide DNA methylation analysis | Blood | 398 boys, aged 3–17 yr | significant age association with DNA methylation at 2078 loci |
| 140 | high-throughput ELISA-based method | Global DNA methylation | Peripheral blood leukocytes | 126 older individuals | Methylation is lower in older age |
| 141 | Illumina Infinium HumanMethylatio n450 BeadChip | genome-wide DNA methylation analysis | Whole blood | 656 human individuals, aged 19 to 101 | Differences in aging rates explains epigenetic drift |
We also found 28 studies from 1995 to date on the relation of DNA methylation to AD (Table 2).124,142–168 Of these,20 were of brain and the remainder of peripheral tissues. Only one of the studies of brain had a sample size exceeding 100.161 Only one study of brain used the Illumina HumanMethylation27 BeadArray, and the remainder interrogated far fewer CG sites.155 The study of 12 cases and 12 matched controls using the Illumina platform reported that the AD brains were slightly hypomethylated. The remaining studies were quite variable with some suggesting hypermethylation, others hypomethylation, and some without obvious differences.
Histone acetylation
We found only a single 2012 study of histone marks, H3K18/K23 acetylation in persons with and without AD (Table 3).169 The study employed selective reaction monitoring liquid chromatography-mass spectrometry (SRM LC-MS) to quantify histone acetylation in 11 AD and 4 control brains and found down-regulation of these marks in AD brains. One study found that protein level of histone deacetylase 2 (HDAC2) was elevated in AD brains.170
Table 3.
Summary of studies on Histone Marker and AD using Human Tissue
| Reference | Methodology | Main Approach | Samples/Tissue | N | Primary Finding |
|---|---|---|---|---|---|
| 169 | SRM-based targeted proteomics | H3 K18/K23 acetylation | Human temporal lobe tissue | 5 AD with minor CAA; 6 AD with severe CAA, and 4 age matched controls | histone H3 K18/K23 acetylation is down-regulated in AD |
microRNA
We identified 18 AD studies of microRNA (miR) from 2008 to present (Table 4).171–188 Of these all but two were in human brain.183,186 None of the studies had a sample size in excess of 100. Further, only one of the studies of human brain interrogated more than one or a few targeted miR’s.186 Overall, the results of studies of brain tissue were highly variable with some miR’s up-regulated and others down-regulated.
Table 4.
Summary of studies on miRNA and AD using Human Tissue
| Reference | Methodology | Main Approach | Samples/Tissue | N | Primary Finding |
|---|---|---|---|---|---|
| 170 | Microarray | miRNA profiling | Human temporal cortex | 34 dementia and 21 non-dementia (5 cases and 5 controls used for miRNA profiling) | miR-29a/b-1 level decreased in AD and is associated with abnormally high BACE1 protein |
| 171 | miRNA array and Northern blot | Target miRNA analysis | Human temporal cortex | 6 AD, and 6 controls | Upregulated miRNA-9, miRNA-125b and miRNA-146a in AD |
| 172 | probe-specific Taqman miRNA assays | Target miRNA analysis | Human temporal cortex or cerebellum | 19 dementia; 11 non-dementia | Decreased miR-106b expression in AD |
| 173 | microarrays | Genome-wide analysis | Human parietal lobe cortex | 4 AD and 4 age matched controls | miRNA and target mRNA associations are changed in AD. |
| 174 | Real time qPCR | Target miRNA analysis (miR-29a, miR-29b and miR-338-3p) | Human frontal cortex | 7 AD patients and 14 non-AD | miR-29a is down-regulated in AD |
| 175 | Real time qPCR | Target miRNA analysis (miR-485-5p) | Human parietal lobe and cerebellum (Set 1); Human superior frontal gyrus, entorhinal cortex, hippocampus and cerebellum (Set 2) | 5 AD and 5 matched controls for each region (Set 1); 35 AD and 35 matched controls (Set 2) | miR-485-5p is down-regulated in AD |
| 176 | Fluorescent miRNA array and northern dot-blot | Target miRNA analysis (miR-146a) | Human superior temporal cortex (Brodmann area A22), hippocampus, brain stem, thalamus, or cerebellum | 36 AD and 30 controls | miR-146a is up-regulated in AD, which differentially regulates IRAK-1 and IRAK-2 expression. |
| 177 | Real time qPCR | Traget miRNA analysis (miR-107) | Human temporal cortex | 19 elderly aged 73 and above | Lower level of miR-107 expression is associated with increased neuritic plaque counts and neurofibrillary tangles |
| 178 | Microarrays and northern blot | Target miRNA analysis | Human superior and middle temporal cortex (Brodmann Areas 21/22) | 10 elderly females | Differential white matter and gray matter changes in miRNAs by AD pathologies |
| 179 | Real time qPCR | Target miRNA analysis (miR-137, -181c, -9, 29a, 29b-1, -15, -124) | Human neocortical brain samples | 7 AD and 7 controls | Loss of miR-137, -181c, -9, and 29a/b-1 increases SPT and in turn Aβ levels |
| 180 | Real time qPCR | Target miRNA analysis (miR-124) | Human anterior temporal cortex | 11 dementia and 11 non-demented controls | miR-124 is down-regulated in AD |
| 181 | Real time qPCR | Target miRNA analysis | Human frontal and temporal neocortex (Brodmann areas 6 and 22) | 12 AD and 6 controls | Lower level of miR-128a/b in AD |
| 182 | Real time qPCR | Target miRNA analysis (miR-137, -181c, -9, 29a, 29b) | Human blood serum | 7 AD, 7 MCI, and 7 controls | miRNA levels were down-regulated in the sera of probable AD and amnestic MCI/probable early AD |
| 183 | Western blot | Target miRNA analysis | Human frontal cortex | 20 AD and 5 age matched controls | Reduced miR-339-5p levels in AD brain |
| 184 | nCounter Human miRNA assay Kit | Medium-throughput miRNAs profiling | Human prefrontal cortex and hippocampus | 42 AD (7 for each Braak Stage) and 7 controls; (prefrontal cortex) 41 LOAD; 23 controls (hippocampus) | deregulation of a subset of microRNAs in the hippocampus and prefrontal cortex in AD |
| 185 | IlluminaHiSeq 2000 sequencing; and Real time qPCR | next-generation sequencing; and target analysis of 12-miRNA signaturess | Human blood | 48 AD and 5 age matched controls (sequencing); 202 (target analysis) | 140 unique miRNAs show different expression levels in AD |
| 186 | Illumina Truseq Small RNA sequencing platform; qRT-PCR | Deep sequencing of miRNA sequences; Target analysis of miR-132 | Human temporal cortex (Brodmann areas 21/22) | 5 AD and 2 controls (sequencing) 8 AD and 8 controls (Validation) |
No apparent difference in miRNA. |
| 187 | Real time qPCR | Target miRNA analysis (40 selected brain-enriched miRNAs) | Human temporal cortex | 6 mild AD (Braak III), 6 severe AD (Braak VI) and age matched controls | miR-132 and miR-212 are downregulated in AD brains |
Overall, it is clear that the study of epigenomics in AD is a nascent field, without robust results at this time. The studies of aging-related changes in the brain’s epigenome do appear to have returned reasonable evidence supporting that many CG sites throughout the methylome are more highly methylated with advancing age. However, it is not yet clear how this relates to brain function or addresses the relevance of these changes to the local chromatin architecture at specific sites.
EXPERIENCE WITH HIGH TRHOUGHPUT APPROACHES TO THE EPIGENOME IN HUMAN BRAIN
The review of the literature to date suggests that there is very little published epigenomic data from the currently available high throughput approaches to the epigenome from large numbers of human brains. Over the past few years, we have generated DNA methylation data from several hundred human brains using the Illumina Infinium HumanMethylation450 BeadArray and genome wide histone acetylation data using chromatin immunoprecipitation-sequencing (ChIP-Seq). Here we describe our experience and share some basic descriptive information with the reader. The data are intended to inform future researchers regarding what they can expect from these approaches in order to better design and power studies of the brain methylome.
Brain DNA methylation using Infinium Humanmethylation450k Beadchip
We are unaware of any published studies of human brain using the Illumina Infinium HumanMethylation450 BeadArray, which is the current platform of choice for high throughput methylation studies. Here, we describe the basic characteristics of DNA methylation profiles from 740 postmortem human brains from participants in two ongoing longitudinal clinical pathologic studies of aging and dementia, the Religious Orders Study and the Rush Memory and Aging Project.189–190 All participants signed an informed consent and an anatomical gift act for organ donation. Both studies were approved by the Institutional Review Board of Rush University Medical Center and conform to ethical guidelines for human research. While very little of these data have been published in peer-reviewed journals, additional data presented at national and international meetings are also in the public domain.191–197
Their average age was 88 (SD=6.7, range 66–108), 36% (N=269) were males, and 330 had AD or other dementia, 175 mild cognitive impairment, and 235 were without cognitive impairment proximate to death. DNA was extracted from frozen dorsolateral prefrontal cortex (DLPFC) tissue. Methylation data was generated using the Illumina Infinium HumanMethylation450K BeadArray. For each brain sample, our dataset, after quality control, consists of methylation measures of a total of 420,132 autosomal CGs which are distributed across the entire genome.
First, we observe that DNA methylation at these 420,132 CG sites features a distinct bimodal distribution such that approximately a third of CGs are extremely hyper-methylated (i.e., mean methylation > 0.8) and another third are extremely hypo-methylated (i.e., mean methylation ≤ 0.2) (Figure 1). This bimodal pattern is preserved in all 22 autosomes (Figure 2). Since the coverage offered by the Illumina chip is targeting methylation sites primarily at CG islands and genic regions, we examine the distribution of CGs and methylation pattern by CG islands as well as surrounding shelves and shores. A total of 135,303 (32.2%) CGs are located in CG islands, 98,653 (23.5%) in CG shores, 39,141 (9.3%) in CG shelves and the remaining 147,035 (35.0%) in regions not related to CG islands. Interestingly, the distribution of mean methylation varies across the regions, as shown in figure 3. For example, in the case of CG island related features, only the CGs sites in the north and south shores (regions flanking a CG island) show a bimodal pattern of methylation levels, while the distributions in the CG island proper and the more distal north and south shelves are more polarized. Specifically, the majority of CGs (82.9%) in shelves are hypermethylated (i.e. mean methylation ≥0.5). By contrast, 83.8% of CGs in CG islands are hypo-methylated, among which 75.7% are extremely hypo-methylated. Notably, the mean methylation level in CG islands is much lower when compared with non-CG island regions (0.20±0.29 vs. 0.62±0.30; p<0.0001).
Figure 1.

Distribution of mean methylation of CGs in HumanMethylation450K.
Figure 2.

Distribution of mean methylation of CGs in HumanMethylation450K by Autosomes.
Figure 3. Distribution of mean methylation level (across 740 samples) of CpG sites located at different genomic features.
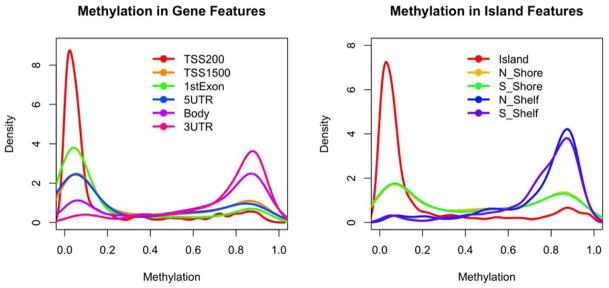
(Left) Genic features; (Right) Island features.
DNA methylation is an attractive epigenomic mark to study because it is relatively simple to extract from tissue and because the Illumina platform offers an option for automated high-throughput data generation, which minimizes technical variation in the data. However, the platform only samples a small fraction of the epigenome and does not differentiate between cytosine methylation and hydroxymethylation. These marks are distinct, and their relative role is just beginning to be explored. Thus, while DNA methylation provides a reasonable platform for the first generation of epigenomic studies, it is not sufficient, and alternative strategies are needed.
Histone acetylation data and other chromatin MARKS with ChIP-Seq
In contrast to methylation, profiled on DNA which is easily extracted from human tissues, profiling histone marks requires the capture of chromatin fragments that bear the mark of interest using immunoprecipitation. This process is time-consuming and not currently automated for high throughput. Its success is very dependent on the antibody clone and batch selected for the experiment, and use of the appropriate tissue type. Below, we illustrate our evaluation of different human brain-derived starting material, i.e., fresh frozen vs. paraformaldehyde fixed human brain. We also describe the experimental pipeline for chromatin immunoprecipitation followed by sequencing (ChIP-Seq) that yields genome-wide data on the location of a target chromatin mark, in this case H3K9Ac. Again, the data presented here are intended to inform future researchers regarding what they can expect from these methods in order to better design and power studies of human brain histone marks. While very little of these data have been published in peer-reviewed journals, additional data presented at national and international meetings are also in the public domain.198–199
To generate ChiP-Seq data from the brain samples that were used in the DNA methylation experiment described above, we first identified the Millipore anti-H3K9ac mAb (catalog # 06-942, lot: 31636) as a robust monoclonal antibody for ChIP experiments out of four different antibodies tested and used a single batch of this antibody for all experiments that explore the pattern of H3K9Ac in the human dorsolateral prefrontal cortex. This particular mark was selected given evidence suggesting that (1) histone deacetylases may have an effect on AD pathology,200 and (2) this mark accumulates in sharply defined, discrete areas at the transcription start site of actively transcribed genes as well as enhancers of such genes. For our pilot study, we explored the utility of using fresh vs. fixed brain tissue. Approximately 500mg of fixed tissue and 50mg of frozen tissue were needed to generate similar DNA yields of about 50 ug per sample (Supplementary Table 1). The larger fixed tissue requirement suggests that longer periods of fixation reduce the ability to completely reverse cross-linking within a sample fixed at autopsy.
Starting from a well-described ChIP-Seq protocol,201 we first optimized DNA fragmentation, a key step in constructing libraries following enrichment by ChIP of target sequences. We did not observe the expected increase in the targeted 150–700 bp DNA fragments with increasing sonication in fixed tissue specimens but did document this trend in the frozen tissue specimens (Supplementary Figure 1). Neither the post mortem interval nor the fixation interval strongly influenced the performance of the fixed material in this respect; Supplementary Table 2 reports these parameters for all tested samples. The optimum fragment size range is the length of 1–3 nucleosomes, or 150–700bp. As illustrated in Supplementary Figure 1B, a sonication time of 4–6 minutes appears to be optimal to enhance the proportion of DNA fragments in the target range while avoiding an increase in the <150 bp fragment that enhance the background. Further, we tested two methods of tissue homogenization and find a 10% increase in the target range of fragment size, with a corresponding 10% decrease in the >700 bp fragment range and no change in the low size range when using the Tissue Lyser II approach compared to the standard Dounce homogenizer. There is no decrease in total DNA yields using the Tissue Lyser II approach (Supplementary Figure 1 B). Libraries produced from fixed and frozen tissue were sequenced.
Sequencing data from fresh vs. fixed tissue
Sequencing data were produced using the Illumina Genome Analyzer II platform. Libraries were not multiplexed. Supplementary Table 3 reports the summary statistics of sequencing output in terms of total reads produced, reads which passed Illumina quality filter, its percentage and number of filtered reads with percentage, which were successfully aligned to the human reference genome and number of duplicate reads from each sample. Given rapid improvements in sequencing technology, the number of output reads per lane increased from our pilot 1 study to our pilot 2 study for which data were generated 3 months apart.
As shown in Supplementary Table 3, sequence data were of high quality, with, on average, more than ~80% of reads from the sequencing passing the Illumina quality filter. 97% of these filtered reads were uniquely mapped to the human reference genome. Using the Picard pipeline, we also assessed the quality of sequencing by looking at the quality score distribution and sequencing coverage in different regions of genome based on GC-content. The normalized coverage of mapped sequence reads to genomic regions with varying GC-content is reported in Supplementary Figure 2 (A, B and C). The control sample without immunoprecipitation provides an estimate of the un-enriched genome-wide baseline distribution of sequences; it has the expected slight bias against GC-content that reflects the genome-wide skew in GC content found in the sequenced human genome (Supplementary Figure 2A). Given that H3K9Ac, our target epigenomic mark, is enriched near the transcription start site of genes that are, on average, GC-rich relative to the genome-wide average, we expect an enrichment for GC content in sequences selected by ChIP. While the library generated from a fixed tissue sample (Supplementary Figure 2B) shows a slight enrichment in GC content, we see the expected very substantial skew towards greater GC content in the frozen sample (Supplementary Figure 2C) that suggests successful enrichment by ChIP. Supplementary Figure 2D illustrates the much better enrichment in target sequence that is achieved when using frozen rather than fixed tissue sample as a target for ChIP.
To visualize the ChIP enrichment and further assess the quality of our data production pipeline, we generated a read tag density distribution plot using the Integrated Genomic Viewer (IGV; http://www.broadinstitute.org/igv/) (Supplementary Figure 3). Here, we see that samples from fixed brain tissue have a similar sequence read distribution as the control sample without ChIP, consistent with the lack of significant enrichment in GC content documented in Figure 2B. On the other hand, frozen samples show very clear and distinct peaks of H3K9Ac that are similar across samples from different individuals.
Overall, this pilot study illustrates the finding that fresh-frozen autopsy tissue is the preferred substrate for ChIP-seq data generation: fixed material failed to generate data in our pilot study. While the protocol based on fixed material can doubtlessly be improved and optimized, it is clearly not as easy to use as frozen material; nonetheless, optimization is indicated in circumstances where tissue availability is limited to fixed material.
Reference Chromatin maps
Through a collaboration with the NIH’s Epigenomic Roadmap, we next generated ChiP-Seq data for six chromatin marks in two subjects who were cognitively non-impaired at the time of death and displayed minimal burden of age-related neuropathologies at the time of death. Six different chromatin marks were targeted, including three marks associated with condensed, transcriptionally repressed chromatin (H3K36me3, H3K9me3, and H3K27me3) and three marks associated with transcriptionally active regions (H3K4me3, H3K9ac, and H3K4me1). For each mark, we therefore have genome-wide data regarding the location where each of these chromatin modifications was found. This information can be collapsed by assessing each 200 bp segment of the genome and annotating the extent to which each of these marks is found in each segment and using the resulting pattern to estimate the state of the chromatin found in that particular segment. Each state reflects the extent to which a segment of DNA is accessible for transcription and what function it may exert. For example, the ChromHMM software can be used to derive such a chromatin map of profiled tissues, and we can bin the segments into different states. We employed an 11-state profile. However, the number is increasing and is now a 15-state model and is likely to increase soon. Seven maps were generated in the Roadmap effort: the targeted regions include the angular gyrus, anterior caudate, cingulate gyrus, dorsolateral prefrontal cortex, inferior temporal cortex, mid-hippocampus and substantia nigra. Thus, we have a sampling of the state of chromatin in the gray matter of different cortical and subcortical regions. Further, Figure 4 illustrates that the proportions of CG sites with different mean methylation varies by chromatin state. A majority (more than 60%) of CG sites in weak and transcription regions are extremely hyper-methylated, while more than 90% of CG sites in strong promoters are extremely hypo-methylated. Thus, information can be integrated across different types of epigenomic data to interpret the association of given regions of the genome with SNPs, RNA expression and ultimately a trait of interest such as clinical or pathologic AD. Overall, these chromatin states and methylation patterns, and the extent to which they vary across individuals, will rapidly enrich our understanding of the basic organization of the epigenome.
Figure 4.

Proportions of CG sites with different mean methylation by chromatin
FUTURE DIRECTIONS
Technological improvements will soon allow better interrogation of the epigenome by increasing the proportion of the genome that can be sampled effectively in a high-throughput manner. This advance will enable the execution of studies on the large scale that is needed for disease-related studies. Studies to date suggest that many loci may be associated with AD, and the better coverage will therefore provide both (1) better resolution of the association within each locus and (2) a comprehensive assessment of the genome. On the other hand, improvements in our understanding of the correlation structure between different epigenomic features will enable us to more efficiently interrogate the methylome and structure of chromatin and to understand how these features relate to another. This information will also be leveraged to inform the design of the molecular networks that drive AD pathology: mapping the epigenomic features that relate to AD identifies regions of the genome in which transcriptional potential is altered in disease. A key challenge remains whether these epigenomic changes are a cause or an effect of the pathologic process, and therefore, it is essential to study subjects at risk of developing dementia as well as subjects with dementia. We have already demonstrated that subjects who are not impaired at the time of death but have AD pathology exhibit epigenomic changes seen in demented subjects, suggesting that these changes are not a feature of terminal dementia.202 To assess whether these changes predate early evidence of Alzheimer pathology (such as amyloid pathology), we need to evaluate their relation to other risk factors such as genetic and experiential factors. However, early analyses suggest that genetic factors appear to have largely independent effects in relation to epigenomic factors. An evaluation of younger subjects without amyloid pathology but with life experiences such as depression that contribute to dementia risk will also be necessary to investigate the role of non-genetic factors. These critical data derived from human samples will need to be supplemented by careful dissection of the causal chain events using in vitro models such as neuronal cells differentiated from induced pluripotent stem cells and murine and other models of AD.
The methylation data and reference chromatin map derived from different cortical and subcortical tissues are an excellent initial evaluation of epigenetic changes in different regions of the aging brain. However, the profiles are based on cortical tissue, and we cannot resolve cell-autonomous effects at this point. Initial efforts to estimate the neuronal burden within a brain sample have been published,203 but we need a better set of reference epigenomic profiles for different cell types. Such resources will be essential to begin to identify the cells which are affected by a given epigenomic feature discovered to be associated with AD in profiles of CNS tissues that are performed today. Such data will begin to address important questions relating to the observation that the differences in methylation relating to AD may be modest (1% difference in methylation levels, on average): is this difference is due to a small proportion of cells of a common cell type that are changing? Is a rare cell population is changing en bloc? Or, do these small changes represent the presence of infiltrating inflammatory cells?
In coming years, larger studies using better technologies will enhance the data that we can analyze to understand how chromatin structure influences the role of susceptibility variants and whether it may mediate some of the experiential risk factors associated with AD susceptibility. DNA methylation is likely to remain the mark of choice, but the study of histone protein modifications will be necessary to understand the fine architecture of loci implicated in AD. This will be supplemented by ChIP-Seq studies targeting pertinent transcription factors that regulate gene expression within susceptibility loci. All of these results will inform the identification and refinement of the molecular networks that lead to AD and are influenced by AD pathology. Despite its many challenges, epigenomic studies of AD will play an important role in the research community’s efforts to delineate the sequence of events leading from health to dementia.
Supplementary Material
Acknowledgments
We thank the participants in the Religious Orders Study and Rush Memory and Aging Project. We also thank the faculty and staff who work on these projects at the Rush Alzheimer’s Disease Center, the Brigham and Women’s Hospital, and the Broad Institute. This work was supported by National Institute on Aging grants P30AG10161, R01AG15819, R01AG17917, R01AG36042, U01AG46152, R01AG36836, and RC2AG36547, and the Illinois Department of Public Health.
Footnotes
All authors have read the journal’s policy on disclosure of potential conflicts of interest and the authors have no conflicts of interest to report.
All authors have read the journal’s authorship agreement and the manuscript has been revised by and approved by all named authors.
Publisher's Disclaimer: This is a PDF file of an unedited manuscript that has been accepted for publication. As a service to our customers we are providing this early version of the manuscript. The manuscript will undergo copyediting, typesetting, and review of the resulting proof before it is published in its final citable form. Please note that during the production process errors may be discovered which could affect the content, and all legal disclaimers that apply to the journal pertain.
References
- 1.Prince M, Bryce R, Albanese E, Wimo A, Ribeiro W, Ferri CP. The global prevalence of dementia: a systematic review and metaanalysis. Alzheimers Dement. 2013;9:63–75. doi: 10.1016/j.jalz.2012.11.007. [DOI] [PubMed] [Google Scholar]
- 2.Alzheimer’s Research Trust. [accessed Nov 8, 2013];Dementia 2010: the economic burden of dementia and associated research funding in the United Kingdom. http://www.herc.ox.ac.uk/pubs/downloads/dementiafullreport.
- 3.Hurd MD, Martorell P, Delavande A, Mullen KJ, Langa KM. Monetary costs of dementia in the United States. N Engl J Med. 2013;368:1326–34. doi: 10.1056/NEJMsa1204629. [DOI] [PMC free article] [PubMed] [Google Scholar]
- 4.Luengo-Fernandez R, Leal J, Gray AM. UK research expenditure on dementia, heart disease, stroke and cancer: are levels of spending related to disease burden? European journal of neurology: the official journal of the European Federation of Neurological Societies. 2012;19:149–54. doi: 10.1111/j.1468-1331.2011.03500.x. [DOI] [PubMed] [Google Scholar]
- 5.Alzheimer’s Disease International. World Alzheimer Report. [accessed Nov 8, 2013];Journey of caring: an analysis of long-term care for dementia. 2013 http://www.alz.co.uk/research/world-report-2013.
- 6.Department of Health. [accessed Nov 8, 2013];The dementia challenge: fighting back against dementia. http://dementiachallenge.dh.gov.uk/
- 7.US Department of Health and Human Services. [accessed Nov 8, 2013];National Alzheimer’s Project Act. http://aspe.hhs.gov/daltcp/napa/
- 8.Nakanishi M, Nakashima T. Features of the Japanese national dementia strategy in comparison with international dementia policies: How should a national dementia policy interact with the public health- and social-care systems? Alzheimers Dement. 2013 doi: 10.1016/j.jalz.2013.06.005. [DOI] [PubMed] [Google Scholar]
- 9.Alzheimer Europe. [accessed Nov 8, 2013];National Dementia Plans. http://www.alzheimer-europe.org/Policy-in-Practice2/National-Dementia-Plans.
- 10. [accessed Nov 8, 2013];National Alzheimer’s Project Act. http://aspe.hhs.gov/daltcp/napa/
- 11.Khachaturian ZS, Khachaturian AS, Thies W. The draft “National Plan” to address Alzheimer’s disease - National Alzheimer’s Project Act (NAPA) Alzheimers Dement. 2012;8:234–6. doi: 10.1016/j.jalz.2012.04.004. [DOI] [PubMed] [Google Scholar]
- 12.Khachaturian ZS. Prospects for designating Alzheimer’s disease research a national priority. Alzheimers Dement. 2011;7:557–61. doi: 10.1016/j.jalz.2011.10.001. [DOI] [PubMed] [Google Scholar]
- 13.Fox NC, Petersen RC. The G8 Dementia Research Summit--a starter for eight? Lancet. 2013;382:1968–9. doi: 10.1016/S0140-6736(13)62426-5. [DOI] [PubMed] [Google Scholar]
- 14. [accessed Nov 8, 2013];G8 Dementia Summit: Prime Minister’s speech. https://www.gov.uk/government/speeches/g8-dementia-summit-prime-ministers-speech.
- 15.Sperling RA, Aisen PS, Beckett LA, et al. Toward defining the preclinical stages of Alzheimer’s disease: recommendations from the National Institute on Aging-Alzheimer’s Association workgroups on diagnostic guidelines for Alzheimer’s disease. Alzheimers Dement. 2011;7:280–92. doi: 10.1016/j.jalz.2011.03.003. [DOI] [PMC free article] [PubMed] [Google Scholar]
- 16.Albert MS, DeKosky ST, Dickson D, et al. The diagnosis of mild cognitive impairment due to Alzheimer’s disease: recommendations from the National Institute on Aging-Alzheimer’s Association workgroups on diagnostic guidelines for Alzheimer’s disease. Alzheimers Dement. 2011;7:270–9. doi: 10.1016/j.jalz.2011.03.008. [DOI] [PMC free article] [PubMed] [Google Scholar]
- 17.McKhann GM, Knopman DS, Chertkow H, et al. The diagnosis of dementia due to Alzheimer’s disease: recommendations from the National Institute on Aging-Alzheimer’s Association workgroups on diagnostic guidelines for Alzheimer’s disease. Alzheimers Dement. 2011;7:263–9. doi: 10.1016/j.jalz.2011.03.005. [DOI] [PMC free article] [PubMed] [Google Scholar]
- 18.Schneider JA, Li J-l, Li Y, Wilson RS, Kordower JH, Bennett DA. Substantia nigra tangles are related to gait impairment in older persons. Annals of neurology. 2006;59:166–73. doi: 10.1002/ana.20723. [DOI] [PubMed] [Google Scholar]
- 19.Buchman AS, Yu L, Wilson RS, Schneider JA, Bennett DA. Association of brain pathology with the progression of frailty in older adults. Neurology. 2013;80:2055–61. doi: 10.1212/WNL.0b013e318294b462. [DOI] [PMC free article] [PubMed] [Google Scholar]
- 20.Wilson RS, Arnold SE, Schneider JA, Tang Y, Bennett DA. The relationship between cerebral Alzheimer’s disease pathology and odour identification in old age. J Neurol Neurosurg Psychiatry. 2007;78:30–5. doi: 10.1136/jnnp.2006.099721. [DOI] [PMC free article] [PubMed] [Google Scholar]
- 21.Lim ASP, Yu L, Kowgier M, Schneider JA, Buchman AS, Bennett DA. Modification of the relationship of the apolipoprotein E ε4 allele to the risk of Alzheimer disease and neurofibrillary tangle density by sleep. JAMA neurology. 2013;70:1544–51. doi: 10.1001/jamaneurol.2013.4215. [DOI] [PMC free article] [PubMed] [Google Scholar]
- 22.Wilson RS, Nag S, Boyle PA, et al. Brainstem aminergic nuclei and late-life depressive symptoms. JAMA Psychiatry. 2013;70:1320–8. doi: 10.1001/jamapsychiatry.2013.2224. [DOI] [PMC free article] [PubMed] [Google Scholar]
- 23.Hebert LE, Scherr PA, Bienias JL, Bennett DA, Evans DA. Alzheimer disease in the US population: prevalence estimates using the 2000 census. Arch Neurol. 2003;60:1119–22. doi: 10.1001/archneur.60.8.1119. [DOI] [PubMed] [Google Scholar]
- 24.Wilson RS, Weir DR, Leurgans SE, et al. Sources of variability in estimates of the prevalence of Alzheimer’s disease in the United States. Alzheimers Dement. 2011;7:74–9. doi: 10.1016/j.jalz.2010.11.006. [DOI] [PMC free article] [PubMed] [Google Scholar]
- 25.Brookmeyer R, Evans DA, Hebert L, et al. National estimates of the prevalence of Alzheimer’s disease in the United States. Alzheimers Dement. 2011;7:61–73. doi: 10.1016/j.jalz.2010.11.007. [DOI] [PMC free article] [PubMed] [Google Scholar]
- 26.James BD, Leurgans S, Hebert LE, Scherr PA, Yaffe K, Bennett BD. Attributable risk of mortality from incident Alzheimer’s disease. Neurology. 2014 doi: 10.1212/WNL.0000000000000240. [DOI] [PMC free article] [PubMed] [Google Scholar]
- 27.Plassman BL, Langa KM, Fisher GG, et al. Prevalence of cognitive impairment without dementia in the United States. Ann Intern Med. 2008;148:427–34. doi: 10.7326/0003-4819-148-6-200803180-00005. [DOI] [PMC free article] [PubMed] [Google Scholar]
- 28.Plassman BL, Langa KM, McCammon RJ, et al. Incidence of dementia and cognitive impairment, not dementia in the United States. Annals of neurology. 2011;70:418–26. doi: 10.1002/ana.22362. [DOI] [PMC free article] [PubMed] [Google Scholar]
- 29.Hyman BT, Phelps CH, Beach TG, et al. National Institute on Aging-Alzheimer’s Association guidelines for the neuropathologic assessment of Alzheimer’s disease. Alzheimers Dement. 2012;8:1–13. doi: 10.1016/j.jalz.2011.10.007. [DOI] [PMC free article] [PubMed] [Google Scholar]
- 30.Montine TJ, Phelps CH, Beach TG, et al. National Institute on Aging-Alzheimer’s Association guidelines for the neuropathologic assessment of Alzheimer’s disease: a practical approach. Acta neuropathologica. 2012;123:1–11. doi: 10.1007/s00401-011-0910-3. [DOI] [PMC free article] [PubMed] [Google Scholar]
- 31.Bennett DA, Wilson RS, Boyle PA, Buchman AS, Schneider JA. Relation of neuropathology to cognition in persons without cognitive impairment. Annals of neurology. 2012;72:599–609. doi: 10.1002/ana.23654. [DOI] [PMC free article] [PubMed] [Google Scholar]
- 32.Bennett DA, Schneider JA, Wilson RS, Bienias JL, Arnold SE. Neurofibrillary tangles mediate the association of amyloid load with clinical Alzheimer disease and level of cognitive function. Arch Neurol. 2004;61:378–84. doi: 10.1001/archneur.61.3.378. [DOI] [PubMed] [Google Scholar]
- 33.Bateman RJ, Xiong C, Benzinger TLS, et al. Clinical and biomarker changes in dominantly inherited Alzheimer’s disease. N Engl J Med. 2012;367:795–804. doi: 10.1056/NEJMoa1202753. [DOI] [PMC free article] [PubMed] [Google Scholar]
- 34.Whitehouse PJ, Price DL, Struble RG, Clark AW, Coyle JT, Delon MR. Alzheimer’s disease and senile dementia: loss of neurons in the basal forebrain. Science. 1982;215:1237–9. doi: 10.1126/science.7058341. [DOI] [PubMed] [Google Scholar]
- 35.Rasool CG, Svendsen CN, Selkoe DJ. Neurofibrillary degeneration of cholinergic and noncholinergic neurons of the basal forebrain in Alzheimer’s disease. Annals of neurology. 1986;20:482–8. doi: 10.1002/ana.410200407. [DOI] [PubMed] [Google Scholar]
- 36.Wilson RS, Nag S, Boyle PA, et al. Neural reserve, neuronal density in the locus ceruleus, and cognitive decline. Neurology. 2013;80:1202–8. doi: 10.1212/WNL.0b013e3182897103. [DOI] [PMC free article] [PubMed] [Google Scholar]
- 37.Aluise CD, Robinson RAS, Cai J, Pierce WM, Markesbery WR, Butterfield DA. Redox proteomics analysis of brains from subjects with amnestic mild cognitive impairment compared to brains from subjects with preclinical Alzheimer’s disease: insights into memory loss in MCI. Journal of Alzheimer’s disease: JAD. 2011;23:257–69. doi: 10.3233/JAD-2010-101083. [DOI] [PubMed] [Google Scholar]
- 38.Butterfield DA, Reed TT, Perluigi M, et al. Elevated levels of 3-nitrotyrosine in brain from subjects with amnestic mild cognitive impairment: implications for the role of nitration in the progression of Alzheimer’s disease. Brain Res. 2007;1148:243–8. doi: 10.1016/j.brainres.2007.02.084. [DOI] [PMC free article] [PubMed] [Google Scholar]
- 39.Lue LF, Brachova L, Civin WH, Rogers J. Inflammation, A beta deposition, and neurofibrillary tangle formation as correlates of Alzheimer’s disease neurodegeneration. Journal of neuropathology and experimental neurology. 1996;55:1083–8. [PubMed] [Google Scholar]
- 40.Blalock EM, Geddes JW, Chen KC, Porter NM, Markesbery WR, Landfield PW. Incipient Alzheimer’s disease: microarray correlation analyses reveal major transcriptional and tumor suppressor responses. Proc Natl Acad Sci U S A. 2004;101:2173–8. doi: 10.1073/pnas.0308512100. [DOI] [PMC free article] [PubMed] [Google Scholar]
- 41.Strozyk D, Dickson DW, Lipton RB, et al. Contribution of vascular pathology to the clinical expression of dementia. Neurobiology of aging. 2010;31:1710–20. doi: 10.1016/j.neurobiolaging.2008.09.011. [DOI] [PMC free article] [PubMed] [Google Scholar]
- 42.Nelson PT, Smith CD, Abner EL, et al. Hippocampal sclerosis of aging, a prevalent and high-morbidity brain disease. Acta neuropathologica. 2013;126:161–77. doi: 10.1007/s00401-013-1154-1. [DOI] [PMC free article] [PubMed] [Google Scholar]
- 43.Nelson PT, Schmitt FA, Lin Y, et al. Hippocampal sclerosis in advanced age: clinical and pathological features. Brain. 2011;134:1506–18. doi: 10.1093/brain/awr053. [DOI] [PMC free article] [PubMed] [Google Scholar]
- 44.Wilson RS, Yu L, Trojanowski JQ, et al. TDP-43 pathology, cognitive decline, and dementia in old age. JAMA neurology. 2013;70:1418–24. doi: 10.1001/jamaneurol.2013.3961. [DOI] [PMC free article] [PubMed] [Google Scholar]
- 45.Neuropathology Group. Medical Research Council Cognitive F, Aging S. Pathological correlates of late-onset dementia in a multicentre, community-based population in England and Wales. Neuropathology Group of the Medical Research Council Cognitive Function and Ageing Study (MRC CFAS) Lancet. 2001;357:169–75. doi: 10.1016/s0140-6736(00)03589-3. [DOI] [PubMed] [Google Scholar]
- 46.White L, Small BJ, Petrovitch H, et al. Recent clinical-pathologic research on the causes of dementia in late life: update from the Honolulu-Asia Aging Study. J Geriatr Psychiatry Neurol. 2005;18:224–7. doi: 10.1177/0891988705281872. [DOI] [PubMed] [Google Scholar]
- 47.Sonnen JA, Larson EB, Crane PK, et al. Pathological correlates of dementia in a longitudinal, population-based sample of aging. Annals of neurology. 2007;62:406–13. doi: 10.1002/ana.21208. [DOI] [PubMed] [Google Scholar]
- 48.O’Brien RJ, Resnick SM, Zonderman AB, et al. Neuropathologic studies of the Baltimore Longitudinal Study of Aging (BLSA) Journal of Alzheimer’s disease: JAD. 2009;18:665–75. doi: 10.3233/JAD-2009-1179. [DOI] [PMC free article] [PubMed] [Google Scholar]
- 49.Schneider JA, Arvanitakis Z, Yu L, Boyle PA, Leurgans SE, Bennett DA. Cognitive impairment, decline and fluctuations in older community-dwelling subjects with Lewy bodies. Brain. 2012;135:3005–14. doi: 10.1093/brain/aws234. [DOI] [PMC free article] [PubMed] [Google Scholar]
- 50.Schneider JA, Arvanitakis Z, Bang W, Bennett DA. Mixed brain pathologies account for most dementia cases in community-dwelling older persons. Neurology. 2007;69:2197–204. doi: 10.1212/01.wnl.0000271090.28148.24. [DOI] [PubMed] [Google Scholar]
- 51.Schneider JA, Arvanitakis Z, Leurgans SE, Bennett DA. The neuropathology of probable Alzheimer disease and mild cognitive impairment. Annals of neurology. 2009;66:200–8. doi: 10.1002/ana.21706. [DOI] [PMC free article] [PubMed] [Google Scholar]
- 52.Gorelick PB, Scuteri A, Black SE, et al. Vascular contributions to cognitive impairment and dementia: a statement for healthcare professionals from the american heart association/american stroke association. Stroke; a journal of cerebral circulation. 2011;42:2672–713. doi: 10.1161/STR.0b013e3182299496. [DOI] [PMC free article] [PubMed] [Google Scholar]
- 53.Boyle PA, Wilson RS, Yu L, et al. Much of late life cognitive decline is not due to common neurodegenerative pathologies. Annals of neurology. 2013;74:478–89. doi: 10.1002/ana.23964. [DOI] [PMC free article] [PubMed] [Google Scholar]
- 54.Arvanitakis Z, Wilson RS, Bienias JL, Evans DA, Bennett DA. Diabetes mellitus and risk of Alzheimer disease and decline in cognitive function. Arch Neurol. 2004;61:661–6. doi: 10.1001/archneur.61.5.661. [DOI] [PubMed] [Google Scholar]
- 55.Arvanitakis Z, Schneider JA, Wilson RS, et al. Diabetes is related to cerebral infarction but not to AD pathology in older persons. Neurology. 2006;67:1960–5. doi: 10.1212/01.wnl.0000247053.45483.4e. [DOI] [PubMed] [Google Scholar]
- 56.Wilson RS, Scherr PA, Schneider JA, Tang Y, Bennett DA. Relation of cognitive activity to risk of developing Alzheimer disease. Neurology. 2007;69:1911–20. doi: 10.1212/01.wnl.0000271087.67782.cb. [DOI] [PubMed] [Google Scholar]
- 57.Wilson RS, Boyle PA, Yu L, Barnes LL, Schneider JA, Bennett DA. Life-span cognitive activity, neuropathologic burden, and cognitive aging. Neurology. 2013;81:314–21. doi: 10.1212/WNL.0b013e31829c5e8a. [DOI] [PMC free article] [PubMed] [Google Scholar]
- 58.Farrer LA, O’Sullivan DM, Cupples LA, Growdon JH, Myers RH. Assessment of genetic risk for Alzheimer’s disease among first-degree relatives. Annals of neurology. 1989;25:485–93. doi: 10.1002/ana.410250511. [DOI] [PubMed] [Google Scholar]
- 59.Mayeux R, Sano M, Chen J, Tatemichi T, Stern Y. Risk of dementia in first-degree relatives of patients with Alzheimer’s disease and related disorders. Arch Neurol. 1991;48:269–73. doi: 10.1001/archneur.1991.00530150037014. [DOI] [PubMed] [Google Scholar]
- 60.Devi G, Ottman R, Tang MX, Marder K, Stern Y, Mayeux R. Familial aggregation of Alzheimer disease among whites, African Americans, and Caribbean Hispanics in northern Manhattan. Arch Neurol. 2000;57:72–7. doi: 10.1001/archneur.57.1.72. [DOI] [PubMed] [Google Scholar]
- 61.Sleegers K, Roks G, Theuns J, et al. Familial clustering and genetic risk for dementia in a genetically isolated Dutch population. Brain. 2004;127:1641–9. doi: 10.1093/brain/awh179. [DOI] [PubMed] [Google Scholar]
- 62.Silverman JM, Ciresi G, Smith CJ, Marin DB, Schnaider-Beeri M. Variability of familial risk of Alzheimer disease across the late life span. Archives of general psychiatry. 2005;62:565–73. doi: 10.1001/archpsyc.62.5.565. [DOI] [PubMed] [Google Scholar]
- 63.Wilson RS, Barral S, Lee JH, et al. Heritability of different forms of memory in the Late Onset Alzheimer’s Disease Family Study. Journal of Alzheimer’s disease: JAD. 2011;23:249–55. doi: 10.3233/JAD-2010-101515. [DOI] [PMC free article] [PubMed] [Google Scholar]
- 64.Ertekin-Taner N, Graff-Radford N, Younkin LH, et al. Heritability of plasma amyloid beta in typical late-onset Alzheimer’s disease pedigrees. Genetic epidemiology. 2001;21:19–30. doi: 10.1002/gepi.1015. [DOI] [PubMed] [Google Scholar]
- 65.Goudsmit J, White BJ, Weitkamp LR, Keats BJ, Morrow CH, Gajdusek DC. Familial Alzheimer’s disease in two kindreds of the same geographic and ethnic origin. A clinical and genetic study. Journal of the neurological sciences. 1981;49:79–89. doi: 10.1016/0022-510x(81)90190-8. [DOI] [PubMed] [Google Scholar]
- 66.Spence MA, Heyman A, Marazita ML, Sparkes RS, Weinberg T. Genetic linkage studies in Alzheimer’s disease. Neurology. 1986;36:581–4. doi: 10.1212/wnl.36.4.581. [DOI] [PubMed] [Google Scholar]
- 67.Bird TD, Lampe TH, Nemens EJ, Miner GW, Sumi SM, Schellenberg GD. Familial Alzheimer’s disease in American descendants of the Volga Germans: probable genetic founder effect. Annals of neurology. 1988;23:25–31. doi: 10.1002/ana.410230106. [DOI] [PubMed] [Google Scholar]
- 68.Raiha I, Kaprio J, Koskenvuo M, Rajala T, Sourander L. Alzheimer’s disease in Finnish twins. Lancet. 1996;347:573–8. doi: 10.1016/s0140-6736(96)91272-6. [DOI] [PubMed] [Google Scholar]
- 69.Pedersen NL, Gatz M, Berg S, Johansson B. How heritable is Alzheimer’s disease late in life? Findings from Swedish twins Annals of neurology. 2004;55:180–5. doi: 10.1002/ana.10999. [DOI] [PubMed] [Google Scholar]
- 70.Gatz M, Pedersen NL, Berg S, et al. Heritability for Alzheimer’s disease: the study of dementia in Swedish twins. The journals of gerontology Series A, Biological sciences and medical sciences. 1997;52:M117–25. doi: 10.1093/gerona/52a.2.m117. [DOI] [PubMed] [Google Scholar]
- 71.Breitner JC, Welsh KA, Gau BA, et al. Alzheimer’s disease in the National Academy of Sciences-National Research Council Registry of Aging Twin Veterans. III. Detection of cases, longitudinal results, and observations on twin concordance. Arch Neurol. 1995;52:763–71. doi: 10.1001/archneur.1995.00540320035011. [DOI] [PubMed] [Google Scholar]
- 72.Heston LL, Mastri AR. The genetics of Alzheimer’s disease: associations with hematologic malignancy and Down’s syndrome. Archives of general psychiatry. 1977;34:976–81. doi: 10.1001/archpsyc.1977.01770200114017. [DOI] [PubMed] [Google Scholar]
- 73.Owens D, Dawson JC, Losin S. Alzheimer’s disease in Down’s syndrome. American journal of mental deficiency. 1971;75:606–12. [PubMed] [Google Scholar]
- 74.Ball MJ, Nuttall K. Neurofibrillary tangles, granulovacuolar degeneration, and neuron loss in Down Syndrome: quantitative comparison with Alzheimer dementia. Annals of neurology. 1980;7:462–5. doi: 10.1002/ana.410070512. [DOI] [PubMed] [Google Scholar]
- 75.Masters CL, Simms G, Weinman NA, Multhaup G, McDonald BL, Beyreuther K. Amyloid plaque core protein in Alzheimer disease and Down syndrome. Proc Natl Acad Sci U S A. 1985;82:4245–9. doi: 10.1073/pnas.82.12.4245. [DOI] [PMC free article] [PubMed] [Google Scholar]
- 76.Lai F, Williams RS. A prospective study of Alzheimer disease in Down syndrome. Arch Neurol. 1989;46:849–53. doi: 10.1001/archneur.1989.00520440031017. [DOI] [PubMed] [Google Scholar]
- 77.Wisniewski KE, Wisniewski HM, Wen GY. Occurrence of neuropathological changes and dementia of Alzheimer’s disease in Down’s syndrome. Annals of neurology. 1985;17:278–82. doi: 10.1002/ana.410170310. [DOI] [PubMed] [Google Scholar]
- 78.Margallo-Lana ML, Moore PB, Kay DWK, et al. Fifteen-year follow-up of 92 hospitalized adults with Down’s syndrome: incidence of cognitive decline, its relationship to age and neuropathology. J Intellect Disabil Res. 2007;51:463–77. doi: 10.1111/j.1365-2788.2006.00902.x. [DOI] [PubMed] [Google Scholar]
- 79.St George-Hyslop PH, Tanzi RE, Polinsky RJ, et al. The genetic defect causing familial Alzheimer’s disease maps on chromosome 21. Science. 1987;235:885–90. doi: 10.1126/science.2880399. [DOI] [PubMed] [Google Scholar]
- 80.Goate A, Chartier-Harlin MC, Mullan M, et al. Segregation of a missense mutation in the amyloid precursor protein gene with familial Alzheimer’s disease. Nature. 1991;349:704–6. doi: 10.1038/349704a0. [DOI] [PubMed] [Google Scholar]
- 81.Murrell J, Farlow M, Ghetti B, Benson MD. A mutation in the amyloid precursor protein associated with hereditary Alzheimer’s disease. Science. 1991;254:97–9. doi: 10.1126/science.1925564. [DOI] [PubMed] [Google Scholar]
- 82.Chartier-Harlin MC, Crawford F, Houlden H, et al. Early-onset Alzheimer’s disease caused by mutations at codon 717 of the beta-amyloid precursor protein gene. Nature. 1991;353:844–6. doi: 10.1038/353844a0. [DOI] [PubMed] [Google Scholar]
- 83.Schellenberg GD, Bird TD, Wijsman EM, et al. Genetic linkage evidence for a familial Alzheimer’s disease locus on chromosome 14. Science. 1992;258:668–71. doi: 10.1126/science.1411576. [DOI] [PubMed] [Google Scholar]
- 84.Mullan M, Houlden H, Windelspecht M, et al. A locus for familial early-onset Alzheimer’s disease on the long arm of chromosome 14, proximal to the alpha 1-antichymotrypsin gene. Nature genetics. 1992;2:340–2. doi: 10.1038/ng1292-340. [DOI] [PubMed] [Google Scholar]
- 85.St George-Hyslop P, Haines J, Rogaev E, et al. Genetic evidence for a novel familial Alzheimer’s disease locus on chromosome 14. Nature genetics. 1992;2:330–4. doi: 10.1038/ng1292-330. [DOI] [PubMed] [Google Scholar]
- 86.Van Broeckhoven C, Backhovens H, Cruts M, et al. Mapping of a gene predisposing to early-onset Alzheimer’s disease to chromosome 14q24. 3. Nature genetics. 1992;2:335–9. doi: 10.1038/ng1292-335. [DOI] [PubMed] [Google Scholar]
- 87.Sherrington R, Rogaev EI, Liang Y, et al. Cloning of a gene bearing missense mutations in early-onset familial Alzheimer’s disease. Nature. 1995;375:754–60. doi: 10.1038/375754a0. [DOI] [PubMed] [Google Scholar]
- 88.Levy-Lahad E, Wijsman EM, Nemens E, et al. A familial Alzheimer’s disease locus on chromosome 1. Science. 1995;269:970–3. doi: 10.1126/science.7638621. [DOI] [PubMed] [Google Scholar]
- 89.Levy-Lahad E, Wasco W, Poorkaj P, et al. Candidate gene for the chromosome 1 familial Alzheimer’s disease locus. Science. 1995;269:973–7. doi: 10.1126/science.7638622. [DOI] [PubMed] [Google Scholar]
- 90.Rogaev EI, Sherrington R, Rogaeva EA, et al. Familial Alzheimer’s disease in kindreds with missense mutations in a gene on chromosome 1 related to the Alzheimer’s disease type 3 gene. Nature. 1995;376:775–8. doi: 10.1038/376775a0. [DOI] [PubMed] [Google Scholar]
- 91.Pericak-Vance MA, Bebout JL, Gaskell PC, et al. Linkage studies in familial Alzheimer disease: evidence for chromosome 19 linkage. American journal of human genetics. 1991;48:1034–50. [PMC free article] [PubMed] [Google Scholar]
- 92.Strittmatter WJ, Saunders AM, Schmechel D, et al. Apolipoprotein E: high-avidity binding to beta-amyloid and increased frequency of type 4 allele in late-onset familial Alzheimer disease. Proc Natl Acad Sci U S A. 1993;90:1977–81. doi: 10.1073/pnas.90.5.1977. [DOI] [PMC free article] [PubMed] [Google Scholar]
- 93.Corder EH, Saunders AM, Strittmatter WJ, et al. Gene dose of apolipoprotein E type 4 allele and the risk of Alzheimer’s disease in late onset families. Science. 1993;261:921–3. doi: 10.1126/science.8346443. [DOI] [PubMed] [Google Scholar]
- 94.Corder EH, Saunders AM, Risch NJ, et al. Protective effect of apolipoprotein E type 2 allele for late onset Alzheimer disease. Nature genetics. 1994;7:180–4. doi: 10.1038/ng0694-180. [DOI] [PubMed] [Google Scholar]
- 95.Harold D, Abraham R, Hollingworth P, et al. Genome-wide association study identifies variants at CLU and PICALM associated with Alzheimer’s disease. Nature genetics. 2009;41:1088–93. doi: 10.1038/ng.440. [DOI] [PMC free article] [PubMed] [Google Scholar]
- 96.Lambert J-C, Heath S, Even G, et al. Genome-wide association study identifies variants at CLU and CR1 associated with Alzheimer’s disease. Nature genetics. 2009;41:1094–9. doi: 10.1038/ng.439. [DOI] [PubMed] [Google Scholar]
- 97.Seshadri S, Fitzpatrick AL, Ikram MA, et al. Genome-wide analysis of genetic loci associated with Alzheimer disease. JAMA: the journal of the American Medical Association. 2010;303:1832–40. doi: 10.1001/jama.2010.574. [DOI] [PMC free article] [PubMed] [Google Scholar]
- 98.Jun G, Naj AC, Beecham GW, et al. Meta-analysis confirms CR1, CLU, and PICALM as alzheimer disease risk loci and reveals interactions with APOE genotypes. Arch Neurol. 2010;67:1473–84. doi: 10.1001/archneurol.2010.201. [DOI] [PMC free article] [PubMed] [Google Scholar]
- 99.Naj AC, Jun G, Beecham GW, et al. Common variants at MS4A4/MS4A6E, CD2AP, CD33 and EPHA1 are associated with late-onset Alzheimer’s disease. Nature genetics. 2011;43:436–41. doi: 10.1038/ng.801. [DOI] [PMC free article] [PubMed] [Google Scholar]
- 100.Hollingworth P, Harold D, Sims R, et al. Common variants at ABCA7, MS4A6A/MS4A4E, EPHA1, CD33 and CD2AP are associated with Alzheimer’s disease. Nature genetics. 2011;43:429–35. doi: 10.1038/ng.803. [DOI] [PMC free article] [PubMed] [Google Scholar]
- 101.Lambert J-C, Ibrahim-Verbaas CA, Harold D, et al. Meta-analysis of 74,046 individuals identifies 11 new susceptibility loci for Alzheimer’s disease. Nature genetics. 2013;45:1452–8. doi: 10.1038/ng.2802. [DOI] [PMC free article] [PubMed] [Google Scholar]
- 102.Tanzi RE. The genetics of Alzheimer disease. Cold Spring Harb Perspect Med. 2012:2. doi: 10.1101/cshperspect.a006296. [DOI] [PMC free article] [PubMed] [Google Scholar]
- 103.Schellenberg GD, Montine TJ. The genetics and neuropathology of Alzheimer’s disease. Acta neuropathologica. 2012;124:305–23. doi: 10.1007/s00401-012-0996-2. [DOI] [PMC free article] [PubMed] [Google Scholar]
- 104.Goate A, Hardy J. Twenty years of Alzheimer’s disease-causing mutations. J Neurochem. 2012;120 (Suppl 1):3–8. doi: 10.1111/j.1471-4159.2011.07575.x. [DOI] [PubMed] [Google Scholar]
- 105.Selkoe D, Mandelkow E, Holtzman D. Deciphering Alzheimer disease. Cold Spring Harb Perspect Med. 2012;2:a011460. doi: 10.1101/cshperspect.a011460. [DOI] [PMC free article] [PubMed] [Google Scholar]
- 106.Bertram L, Tanzi RE. The genetics of Alzheimer’s disease. Prog Mol Biol Transl Sci. 2012;107:79–7100. doi: 10.1016/B978-0-12-385883-2.00008-4. [DOI] [PubMed] [Google Scholar]
- 107.Vassar R, Bennett BD, Babu-Khan S, et al. Beta-secretase cleavage of Alzheimer’s amyloid precursor protein by the transmembrane aspartic protease BACE. Science. 1999;286:735–41. doi: 10.1126/science.286.5440.735. [DOI] [PubMed] [Google Scholar]
- 108.Yan R, Bienkowski MJ, Shuck ME, et al. Membrane-anchored aspartyl protease with Alzheimer’s disease beta-secretase activity. Nature. 1999;402:533–7. doi: 10.1038/990107. [DOI] [PubMed] [Google Scholar]
- 109.Verghese PB, Castellano JM, Holtzman DM. Apolipoprotein E in Alzheimer’s disease and other neurological disorders. Lancet neurology. 2011;10:241–52. doi: 10.1016/S1474-4422(10)70325-2. [DOI] [PMC free article] [PubMed] [Google Scholar]
- 110.Holtzman DM, Herz J, Bu G. Apolipoprotein E and apolipoprotein E receptors: normal biology and roles in Alzheimer disease. Cold Spring Harb Perspect Med. 2012;2:a006312. doi: 10.1101/cshperspect.a006312. [DOI] [PMC free article] [PubMed] [Google Scholar]
- 111.Mahley RW, Huang Y, Weisgraber KH. Detrimental effects of apolipoprotein E4: potential therapeutic targets in Alzheimer’s disease. Current Alzheimer research. 2007;4:537–40. doi: 10.2174/156720507783018334. [DOI] [PubMed] [Google Scholar]
- 112.Kline A. Apolipoprotein E, amyloid-ss clearance and therapeutic opportunities in Alzheimer’s disease. Alzheimers Res Ther. 2012;4:32. doi: 10.1186/alzrt135. [DOI] [PMC free article] [PubMed] [Google Scholar]
- 113.Bennett DA, De Jager PL, Leurgans SE, Schneider JA. Neuropathologic intermediate phenotypes enhance association to Alzheimer susceptibility alleles. Neurology. 2009;72:1495–503. doi: 10.1212/WNL.0b013e3181a2e87d. [DOI] [PMC free article] [PubMed] [Google Scholar]
- 114.Goldman JS, Hahn SE, Catania JW, et al. Genetic counseling and testing for Alzheimer disease: joint practice guidelines of the American College of Medical Genetics and the National Society of Genetic Counselors. Genetics in medicine: official journal of the American College of Medical Genetics. 2011;13:597–605. doi: 10.1097/GIM.0b013e31821d69b8. [DOI] [PMC free article] [PubMed] [Google Scholar]
- 115.Chibnik LB, Shulman JM, Leurgans SE, et al. CR1 is associated with amyloid plaque burden and agerelated cognitive decline. Annals of neurology. 2011;69:560–9. doi: 10.1002/ana.22277. [DOI] [PMC free article] [PubMed] [Google Scholar]
- 116.Biffi A, Shulman JM, Jagiella JM, et al. Genetic variation at CR1 increases risk of cerebral amyloid angiopathy. Neurology. 2012;78:334–41. doi: 10.1212/WNL.0b013e3182452b40. [DOI] [PMC free article] [PubMed] [Google Scholar]
- 117.Felsky D, Szeszko P, Yu L, et al. The SORL1 gene and convergent neural risk for Alzheimer’s disease across the human lifespan. Mol Psychiatry. 2013 doi: 10.1038/mp.2013.142. [DOI] [PMC free article] [PubMed] [Google Scholar]
- 118.Shulman JM, Chen K, Keenan BT, et al. Genetic susceptibility for Alzheimer disease neuritic plaque pathology. JAMA neurology. 2013;70:1150–7. doi: 10.1001/jamaneurol.2013.2815. [DOI] [PMC free article] [PubMed] [Google Scholar]
- 119.Hohman TJ, Koran ME, Thornton-Wells T. Epistatic genetic effects among Alzheimer’s candidate genes. PloS one. 2013:8. doi: 10.1371/journal.pone.0080839. [DOI] [PMC free article] [PubMed] [Google Scholar]
- 120.Cruchaga C, Kauwe JSK, Harari O, et al. GWAS of cerebrospinal fluid tau levels identifies risk variants for Alzheimer’s disease. Neuron. 2013;78:256–68. doi: 10.1016/j.neuron.2013.02.026. [DOI] [PMC free article] [PubMed] [Google Scholar]
- 121.Bradshaw EM, Chibnik LB, Keenan BT, et al. CD33 Alzheimer’s disease locus: altered monocyte function and amyloid biology. Nature neuroscience. 2013;16:848–50. doi: 10.1038/nn.3435. [DOI] [PMC free article] [PubMed] [Google Scholar]
- 122.Tohgi H, Utsugisawa K, Nagane Y, Yoshimura M, Genda Y, Ukitsu M. Reduction with age in methylcytosine in the promoter region -224 approximately -101 of the amyloid precursor protein gene in autopsy human cortex. Brain Res Mol Brain Res. 1999;70:288–92. doi: 10.1016/s0169-328x(99)00163-1. [DOI] [PubMed] [Google Scholar]
- 123.Tohgi H, Utsugisawa K, Nagane Y, Yoshimura M, Ukitsu M, Genda Y. The methylation status of cytosines in a tau gene promoter region alters with age to downregulate transcriptional activity in human cerebral cortex. Neurosci Lett. 1999;275:89–92. doi: 10.1016/s0304-3940(99)00731-4. [DOI] [PubMed] [Google Scholar]
- 124.Siegmund KD, Connor CM, Campan M, et al. DNA methylation in the human cerebral cortex is dynamically regulated throughout the life span and involves differentiated neurons. PloS one. 2007:2. doi: 10.1371/journal.pone.0000895. [DOI] [PMC free article] [PubMed] [Google Scholar]
- 125.Boks MP, Derks EM, Weisenberger DJ, et al. The relationship of DNA methylation with age, gender and genotype in twins and healthy controls. PloS one. 2009;4:e6767. doi: 10.1371/journal.pone.0006767. [DOI] [PMC free article] [PubMed] [Google Scholar]
- 126.Christensen BC, Houseman EA, Marsit CJ, et al. Aging and environmental exposures alter tissuespecific DNA methylation dependent upon CpG island context. PLoS genetics. 2009:5. doi: 10.1371/journal.pgen.1000602. [DOI] [PMC free article] [PubMed] [Google Scholar]
- 127.Rakyan VK, Down TA, Maslau S, et al. Human aging-associated DNA hypermethylation occurs preferentially at bivalent chromatin domains. Genome research. 2010;20:434–9. doi: 10.1101/gr.103101.109. [DOI] [PMC free article] [PubMed] [Google Scholar]
- 128.Bork S, Pfister S, Witt H, et al. DNA methylation pattern changes upon long-term culture and aging of human mesenchymal stromal cells. Aging cell. 2010;9:54–63. doi: 10.1111/j.1474-9726.2009.00535.x. [DOI] [PMC free article] [PubMed] [Google Scholar]
- 129.Bocklandt S, Lin W, Sehl ME, et al. Epigenetic predictor of age. PloS one. 2011:6. doi: 10.1371/journal.pone.0014821. [DOI] [PMC free article] [PubMed] [Google Scholar]
- 130.Hernandez DG, Nalls MA, Gibbs JR, et al. Distinct DNA methylation changes highly correlated with chronological age in the human brain. Human molecular genetics. 2011;20:1164–72. doi: 10.1093/hmg/ddq561. [DOI] [PMC free article] [PubMed] [Google Scholar]
- 131.Koch CM, Suschek CV, Lin Q, et al. Specific age-associated DNA methylation changes in human dermal fibroblasts. PloS one. 2011;6:e16679. doi: 10.1371/journal.pone.0016679. [DOI] [PMC free article] [PubMed] [Google Scholar]
- 132.Stepanow S, Reichwald K, Huse K, et al. Allele-specific, age-dependent and BMI-associated DNA methylation of human MCHR1. PloS one. 2011:6. doi: 10.1371/journal.pone.0017711. [DOI] [PMC free article] [PubMed] [Google Scholar]
- 133.Numata S, Ye T, Hyde TM, et al. DNA methylation signatures in development and aging of the human prefrontal cortex. American journal of human genetics. 2012;90:260–72. doi: 10.1016/j.ajhg.2011.12.020. [DOI] [PMC free article] [PubMed] [Google Scholar]
- 134.Garagnani P, Bacalini MG, Pirazzini C, et al. Methylation of ELOVL2 gene as a new epigenetic marker of age. Aging cell. 2012;11:1132–4. doi: 10.1111/acel.12005. [DOI] [PubMed] [Google Scholar]
- 135.Madrigano J, Baccarelli A, Mittleman MA, et al. Aging and epigenetics: longitudinal changes in genespecific DNA methylation. Epigenetics: official journal of the DNA Methylation Society. 2012;7:63–70. doi: 10.4161/epi.7.1.18749. [DOI] [PMC free article] [PubMed] [Google Scholar]
- 136.Pirazzini C, Giuliani C, Bacalini MG, et al. Space/population and time/age in DNA methylation variability in humans: a study on IGF2/H19 locus in different Italian populations and in mono- and dizygotic twins of different age. Aging. 2012;4:509–20. doi: 10.18632/aging.100476. [DOI] [PMC free article] [PubMed] [Google Scholar]
- 137.Bell JT, Tsai P-C, Yang T-P, et al. Epigenome-wide scans identify differentially methylated regions for age and age-related phenotypes in a healthy ageing population. PLoS genetics. 2012:8. doi: 10.1371/journal.pgen.1002629. [DOI] [PMC free article] [PubMed] [Google Scholar]
- 138.Heyn H, Li N, Ferreira HJ, et al. Distinct DNA methylomes of newborns and centenarians. Proc Natl Acad Sci U S A. 2012;109:10522–7. doi: 10.1073/pnas.1120658109. [DOI] [PMC free article] [PubMed] [Google Scholar]
- 139.Alisch RS, Barwick BG, Chopra P, et al. Age-associated DNA methylation in pediatric populations. Genome research. 2012;22:623–32. doi: 10.1101/gr.125187.111. [DOI] [PMC free article] [PubMed] [Google Scholar]
- 140.Gomes MVM, Toffoli LV, Arruda DW, et al. Age-related changes in the global DNA methylation profile of leukocytes are linked to nutrition but are not associated with the MTHFR C677T genotype or to functional capacities. PloS one. 2012:7. doi: 10.1371/journal.pone.0052570. [DOI] [PMC free article] [PubMed] [Google Scholar]
- 141.Hannum G, Guinney J, Zhao L, et al. Genome-wide methylation profiles reveal quantitative views of human aging rates. Mol Cell. 2013;49:359–67. doi: 10.1016/j.molcel.2012.10.016. [DOI] [PMC free article] [PubMed] [Google Scholar]
- 142.West RL, Lee JM, Maroun LE. Hypomethylation of the amyloid precursor protein gene in the brain of an Alzheimer’s disease patient. Journal of molecular neuroscience: MN. 1995;6:141–6. doi: 10.1007/BF02736773. [DOI] [PubMed] [Google Scholar]
- 143.Sontag E, Hladik C, Montgomery L, et al. Downregulation of protein phosphatase 2A carboxyl methylation and methyltransferase may contribute to Alzheimer disease pathogenesis. Journal of neuropathology and experimental neurology. 2004;63:1080–91. doi: 10.1093/jnen/63.10.1080. [DOI] [PubMed] [Google Scholar]
- 144.Wang SC, Oelze B, Schumacher A. Age-specific epigenetic drift in late-onset Alzheimer’s disease. PloS one. 2008;3:e2698. doi: 10.1371/journal.pone.0002698. [DOI] [PMC free article] [PubMed] [Google Scholar]
- 145.Barrachina M, Ferrer I. DNA methylation of Alzheimer disease and tauopathy-related genes in postmortem brain. Journal of neuropathology and experimental neurology. 2009;68:880–91. doi: 10.1097/NEN.0b013e3181af2e46. [DOI] [PubMed] [Google Scholar]
- 146.Mastroeni D, McKee A, Grover A, Rogers J, Coleman PD. Epigenetic differences in cortical neurons from a pair of monozygotic twins discordant for Alzheimer’s disease. PloS one. 2009:4. doi: 10.1371/journal.pone.0006617. [DOI] [PMC free article] [PubMed] [Google Scholar]
- 147.Mastroeni D, Grover A, Delvaux E, Whiteside C, Coleman PD, Rogers J. Epigenetic changes in Alzheimer’s disease: decrements in DNA methylation. Neurobiology of aging. 2010;31:2025–37. doi: 10.1016/j.neurobiolaging.2008.12.005. [DOI] [PMC free article] [PubMed] [Google Scholar]
- 148.Brohede J, Rinde M, Winblad B, Graff C. A DNA methylation study of the amyloid precursor protein gene in several brain regions from patients with familial Alzheimer disease. Journal of neurogenetics. 2010;24:179–81. doi: 10.3109/01677063.2010.503978. [DOI] [PubMed] [Google Scholar]
- 149.Bollati V, Galimberti D, Pergoli L, et al. DNA methylation in repetitive elements and Alzheimer disease. Brain, behavior, and immunity. 2011;25:1078–83. doi: 10.1016/j.bbi.2011.01.017. [DOI] [PMC free article] [PubMed] [Google Scholar]
- 150.Sung HY, Choi EN, Ahn Jo S, Oh S, Ahn JH. Amyloid protein-mediated differential DNA methylation status regulates gene expression in Alzheimer’s disease model cell line. Biochemical and biophysical research communications. 2011;414:700–5. doi: 10.1016/j.bbrc.2011.09.136. [DOI] [PubMed] [Google Scholar]
- 151.D’Addario C, Di Francesco A, Arosio B, et al. Epigenetic regulation of fatty acid amide hydrolase in Alzheimer disease. PloS one. 2012:7. doi: 10.1371/journal.pone.0039186. [DOI] [PMC free article] [PubMed] [Google Scholar]
- 152.Rao JS, Keleshian VL, Klein S, Rapoport SI. Epigenetic modifications in frontal cortex from Alzheimer’s disease and bipolar disorder patients. Transl Psychiatry. 2012:2. doi: 10.1038/tp.2012.55. [DOI] [PMC free article] [PubMed] [Google Scholar]
- 153.Furuya TK, Silva PNO, Payao SLM, et al. Analysis of SNAP25 mRNA expression and promoter DNA methylation in brain areas of Alzheimer’s Disease patients. Neuroscience. 2012;220:41–6. doi: 10.1016/j.neuroscience.2012.06.035. [DOI] [PubMed] [Google Scholar]
- 154.Arosio B, Bulbarelli A, Bastias Candia S, et al. Pin1 contribution to Alzheimer’s disease: transcriptional and epigenetic mechanisms in patients with late-onset Alzheimer’s disease. Neuro-degenerative diseases. 2012;10:207–11. doi: 10.1159/000333799. [DOI] [PubMed] [Google Scholar]
- 155.Bakulski KM, Dolinoy DC, Sartor MA, et al. Genome-wide DNA methylation differences between late-onset Alzheimer’s disease and cognitively normal controls in human frontal cortex. Journal of Alzheimer’s disease: JAD. 2012;29:571–88. doi: 10.3233/JAD-2012-111223. [DOI] [PMC free article] [PubMed] [Google Scholar]
- 156.Furuya TK, da Silva PN, Payao SL, et al. SORL1 and SIRT1 mRNA expression and promoter methylation levels in aging and Alzheimer’s Disease. Neurochemistry international. 2012;61:973–5. doi: 10.1016/j.neuint.2012.07.014. [DOI] [PubMed] [Google Scholar]
- 157.Sanchez-Mut JV, Aso E, Panayotis N, et al. DNA methylation map of mouse and human brain identifies target genes in Alzheimer’s disease. Brain. 2013;136:3018–27. doi: 10.1093/brain/awt237. [DOI] [PMC free article] [PubMed] [Google Scholar]
- 158.Bradley-Whitman MA, Lovell MA. Epigenetic changes in the progression of Alzheimer’s disease. Mechanisms of ageing and development. 2013;134:486–95. doi: 10.1016/j.mad.2013.08.005. [DOI] [PMC free article] [PubMed] [Google Scholar]
- 159.Chouliaras L, Mastroeni D, Delvaux E, et al. Consistent decrease in global DNA methylation and hydroxymethylation in the hippocampus of Alzheimer’s disease patients. Neurobiology of aging. 2013;34:2091–9. doi: 10.1016/j.neurobiolaging.2013.02.021. [DOI] [PMC free article] [PubMed] [Google Scholar]
- 160.Coppieters N, Dieriks BV, Lill C, Faull RL, Curtis MA, Dragunow M. Global changes in DNA methylation and hydroxymethylation in Alzheimer’s disease human brain. Neurobiology of aging. 2013 doi: 10.1016/j.neurobiolaging.2013.11.031. [DOI] [PubMed] [Google Scholar]
- 161.Iwata A, Nagata K, Hatsuta H, et al. Altered CpG methylation in sporadic Alzheimer’s disease is associated with APP and MAPT dysregulation. Human molecular genetics. 2014;23:648–56. doi: 10.1093/hmg/ddt451. [DOI] [PubMed] [Google Scholar]
- 162.Hernandez HG, Mahecha MF, Mejia A, Arboleda H, Forero DA. Global long interspersed nuclear element 1 DNA methylation in a colombian sample of patients with late-onset Alzheimer’s disease. Am J Alzheimers Dis Other Demen. 2014;29:50–3. doi: 10.1177/1533317513505132. [DOI] [PMC free article] [PubMed] [Google Scholar]
- 163.Di Francesco A, Arosio B, Gussago C, et al. Involvement of 5-lipoxygenase in Alzheimer’s disease: a role for DNA methylation. Journal of Alzheimer’s disease: JAD. 2013;37:3–8. doi: 10.3233/JAD-130506. [DOI] [PubMed] [Google Scholar]
- 164.Silva PN, Furuya TK, Sampaio Braga I, et al. CNP and DPYSL2 mRNA expression and promoter methylation levels in brain of Alzheimer’s disease patients. Journal of Alzheimer’s disease: JAD. 2013;33:349–55. doi: 10.3233/JAD-2012-121192. [DOI] [PubMed] [Google Scholar]
- 165.Taher N, McKenzie C, Garrett R, Baker M, Fox N, Isaacs GD. Amyloid-β alters the DNA methylation status of cell-fate genes in an Alzheimer’s disease model. Journal of Alzheimer’s disease: JAD. 2014;38:831–44. doi: 10.3233/JAD-131061. [DOI] [PubMed] [Google Scholar]
- 166.Silva PN, Furuya TK, Braga IL, et al. Analysis of HSPA8 and HSPA9 mRNA expression and promoter methylation in the brain and blood of Alzheimer’s disease patients. Journal of Alzheimer’s disease: JAD. 2014;38:165–70. doi: 10.3233/JAD-130428. [DOI] [PubMed] [Google Scholar]
- 167.Jones MJ, Farre P, McEwen LM, et al. Distinct DNA methylation patterns of cognitive impairment and trisomy 21 in Down syndrome. BMC medical genomics. 2013;6:58. doi: 10.1186/1755-8794-6-58. [DOI] [PMC free article] [PubMed] [Google Scholar]
- 168.Condliffe D, Wong A, Troakes C, et al. Cross-region reduction in 5-hydroxymethylcytosine in Alzheimer’s disease brain. Neurobiology of aging. 2014 doi: 10.1016/j.neurobiolaging.2014.02.002. [DOI] [PMC free article] [PubMed] [Google Scholar]
- 169.Zhang K, Schrag M, Crofton A, Trivedi R, Vinters H, Kirsch W. Targeted proteomics for quantification of histone acetylation in Alzheimer’s disease. Proteomics. 2012;12:1261–8. doi: 10.1002/pmic.201200010. [DOI] [PMC free article] [PubMed] [Google Scholar]
- 170.Graff J, Rei D, Guan JS, et al. An epigenetic blockade of cognitive functions in the neurodegenerating brain. Nature. 2012;483:222–6. doi: 10.1038/nature10849. [DOI] [PMC free article] [PubMed] [Google Scholar]
- 171.Hebert SS, Horre K, Nicolai L, et al. Loss of microRNA cluster miR-29a/b-1 in sporadic Alzheimer’s disease correlates with increased BACE1/beta-secretase expression. Proc Natl Acad Sci U S A. 2008;105:6415–20. doi: 10.1073/pnas.0710263105. [DOI] [PMC free article] [PubMed] [Google Scholar]
- 172.Sethi P, Lukiw WJ. Micro-RNA abundance and stability in human brain: specific alterations in Alzheimer’s disease temporal lobe neocortex. Neurosci Lett. 2009;459:100–4. doi: 10.1016/j.neulet.2009.04.052. [DOI] [PubMed] [Google Scholar]
- 173.Hebert SS, Horre K, Nicolai L, et al. MicroRNA regulation of Alzheimer’s Amyloid precursor protein expression. Neurobiology of disease. 2009;33:422–8. doi: 10.1016/j.nbd.2008.11.009. [DOI] [PubMed] [Google Scholar]
- 174.Nunez-Iglesias J, Liu C-C, Morgan TE, Finch CE, Zhou XJ. Joint genome-wide profiling of miRNA and mRNA expression in Alzheimer’s disease cortex reveals altered miRNA regulation. PloS one. 2010:5. doi: 10.1371/journal.pone.0008898. [DOI] [PMC free article] [PubMed] [Google Scholar]
- 175.Shioya M, Obayashi S, Tabunoki H, et al. Aberrant microRNA expression in the brains of neurodegenerative diseases: miR-29a decreased in Alzheimer disease brains targets neurone navigator 3. Neuropathol Appl Neurobiol. 2010;36:320–30. doi: 10.1111/j.1365-2990.2010.01076.x. [DOI] [PubMed] [Google Scholar]
- 176.Faghihi MA, Zhang M, Huang J, et al. Evidence for natural antisense transcript-mediated inhibition of microRNA function. Genome Biol. 2010:11. doi: 10.1186/gb-2010-11-5-r56. [DOI] [PMC free article] [PubMed] [Google Scholar]
- 177.Cui JG, Li YY, Zhao Y, Bhattacharjee S, Lukiw WJ. Differential regulation of interleukin-1 receptor-associated kinase-1 (IRAK-1) and IRAK-2 by microRNA-146a and NF-kappaB in stressed human astroglial cells and in Alzheimer disease. The Journal of biological chemistry. 2010;285:38951–60. doi: 10.1074/jbc.M110.178848. [DOI] [PMC free article] [PubMed] [Google Scholar]
- 178.Nelson PT, Wang WX. MiR-107 is reduced in Alzheimer’s disease brain neocortex: validation study. Journal of Alzheimer’s disease: JAD. 2010;21:75–9. doi: 10.3233/JAD-2010-091603. [DOI] [PMC free article] [PubMed] [Google Scholar]
- 179.Wang WX, Huang Q, Hu Y, Stromberg AJ, Nelson PT. Patterns of microRNA expression in normal and early Alzheimer’s disease human temporal cortex: white matter versus gray matter. Acta neuropathologica. 2011;121:193–205. doi: 10.1007/s00401-010-0756-0. [DOI] [PMC free article] [PubMed] [Google Scholar]
- 180.Geekiyanage H, Chan C. MicroRNA-137/181c regulates serine palmitoyltransferase and in turn amyloid β, novel targets in sporadic Alzheimer’s disease. J Neurosci. 2011;31:14820–30. doi: 10.1523/JNEUROSCI.3883-11.2011. [DOI] [PMC free article] [PubMed] [Google Scholar]
- 181.Smith P, Al Hashimi A, Girard J, Delay C, Hebert SS. In vivo regulation of amyloid precursor protein neuronal splicing by microRNAs. J Neurochem. 2011;116:240–7. doi: 10.1111/j.1471-4159.2010.07097.x. [DOI] [PubMed] [Google Scholar]
- 182.Culpan D, Kehoe PG, Love S. Tumour necrosis factor-alpha (TNF-alpha) and miRNA expression in frontal and temporal neocortex in Alzheimer’s disease and the effect of TNF-alpha on miRNA expression in vitro. Int J Mol Epidemiol Genet. 2011;2:156–62. [PMC free article] [PubMed] [Google Scholar]
- 183.Geekiyanage H, Jicha GA, Nelson PT, Chan C. Blood serum miRNA: non-invasive biomarkers for Alzheimer’s disease. Experimental neurology. 2012;235:491–6. doi: 10.1016/j.expneurol.2011.11.026. [DOI] [PMC free article] [PubMed] [Google Scholar]
- 184.Long JM, Ray B, Lahiri DK. MicroRNA-339–5p downregulates protein expression of the β-site amyloid precursor protein cleaving enzyme 1 (BACE1) in human primary brain cultures and is reduced in brain tissue specimens of Alzheimer’s disease subjects. The Journal of biological chemistry. 2013 doi: 10.1074/jbc.M113.518241. [DOI] [PMC free article] [PubMed] [Google Scholar]
- 185.Lau P, Bossers K, Janky R, et al. Alteration of the microRNA network during the progression of Alzheimer’s disease. EMBO molecular medicine. 2013;5:1613–34. doi: 10.1002/emmm.201201974. [DOI] [PMC free article] [PubMed] [Google Scholar]
- 186.Leidinger P, Backes C, Deutscher S, et al. A blood based 12-miRNA signature of Alzheimer disease patients. Genome Biol. 2013:14. doi: 10.1186/gb-2013-14-7-r78. [DOI] [PMC free article] [PubMed] [Google Scholar]
- 187.Hebert SS, Wang W-X, Zhu Q, Nelson PT. A study of small RNAs from cerebral neocortex of pathology-verified Alzheimer’s disease, dementia with lewy bodies, hippocampal sclerosis, frontotemporal lobar dementia, and non-demented human controls. Journal of Alzheimer’s disease: JAD. 2013;35:335–48. doi: 10.3233/JAD-122350. [DOI] [PMC free article] [PubMed] [Google Scholar]
- 188.Wong H-KA, Veremeyko T, Patel N, et al. De-repression of FOXO3a death axis by microRNA-132 and -212 causes neuronal apoptosis in Alzheimer’s disease. Human molecular genetics. 2013;22:3077–92. doi: 10.1093/hmg/ddt164. [DOI] [PubMed] [Google Scholar]
- 189.Bennett DA, Schneider JA, Arvanitakis Z, Wilson RS. Overview and findings from the Religious Orders Study. Current Alzheimer research. 2012;9:628–45. doi: 10.2174/156720512801322573. [DOI] [PMC free article] [PubMed] [Google Scholar]
- 190.Bennett DA, Schneider JA, Buchman AS, Barnes LL, Boyle PA, Wilson RS. Overview and findings from the rush Memory and Aging Project. Current Alzheimer research. 2012;9:646–63. doi: 10.2174/156720512801322663. [DOI] [PMC free article] [PubMed] [Google Scholar]
- 191.Ziller MJ, Gu H, Muller F, et al. Charting a dynamic DNA methylation landscape of the human genome. Nature. 2013;500:477–81. doi: 10.1038/nature12433. [DOI] [PMC free article] [PubMed] [Google Scholar]
- 192.Chibnik LB, Keenan BT, Srivastava G, et al. Relation of DNA methylation in AD susceptibility genes with Alzheimer’s disease phenotypes. The 12th Alzheimer’s Association International Conference; Vancouver, BC. July 17, 2012. [Google Scholar]
- 193.Rosenkrantz LL, Srivastava G, Kaliszewska A, et al. Correlation between CpG DNA methylation levels in peripheral CD4+ T cells and dorsal lateral prefrontal cortex tissue. Alzheimer’s Association International Conference; Boston, MA. July 16, 2013. [Google Scholar]
- 194.BK, Srivastava G, Chibnik L, De Jager PL, Bennett DA, Schneider JA. An exploration of a functional unit of DNA methylation in the aging brain. Alzheimer’s & Dementia: The Journal of the Alzheimer’s Association. 2013;9:P172. [Google Scholar]
- 195.De Jager PL, Srivastava G, Eaton ML, et al. Genome-wide exploration of DNA methylation in the aging brain and its relation to Alzheimer’s disease. Alzheimer’s Association International Conference; Vancouver, BC. July 18, 2012. [Google Scholar]
- 196.Yu L, Srivastava G, Chibnik LB, et al. Gene based association analysis of Brain DNA methylation with Alzheimer’s disease pathology using random permutation. Annual Meeting of the American Society of Human Genetics; Boston, MA. October 23, 2013. [Google Scholar]
- 197.Lim AS, Srivastava GP, Yu L, et al. Diurnal rhythms of clock gene DNA methylation and their relationship to rhythms of clock gene expression in the human cerebral cortex. Annual Meeting of the American Society of Human Genetics; Boston, MA. October 23, 2013. [Google Scholar]
- 198.Zhu J, Adli M, Zou JY, et al. Genome-wide chromatin state transitions associated with developmental and environmental cues. Cell. 2013;152:642–54. doi: 10.1016/j.cell.2012.12.033. [DOI] [PMC free article] [PubMed] [Google Scholar]
- 199.Eaton ML, Srivastava G, Kundaje A, et al. Integrating genotype, methylome, chromatin states and disease state in a cohort of 750 individuals. Annual Meeting of the American Society of Human Genetics; Boston, MA. October 23, 2013. [Google Scholar]
- 200.Chuang DM, Leng Y, Marinova Z, Kim HJ, Chiu CT. Multiple roles of HDAC inhibition in neurodegenerative conditions. Trends in neurosciences. 2009;32:591–601. doi: 10.1016/j.tins.2009.06.002. [DOI] [PMC free article] [PubMed] [Google Scholar]
- 201.Ernst J, Kheradpour P, Mikkelsen TS, et al. Mapping and analysis of chromatin state dynamics in nine human cell types. Nature. 2011;473:43–9. doi: 10.1038/nature09906. [DOI] [PMC free article] [PubMed] [Google Scholar]
- 202.De Jager PL, Srivastava G, Eaton ML, et al. Genome-wide scan of DNA methylation in the aging brain and its relation to Alzheimer’s disease. Annual Meeting of the American Society of Human Genetics; San Francisco, CA. November 9, 2012. [Google Scholar]
- 203.Guintivano J, Aryee MJ, Kaminsky ZA. A cell epigenotype specific model for the correction of brain cellular heterogeneity bias and its application to age, brain region and major depression. Epigenetics: official journal of the DNA Methylation Society. 2013;8:290–302. doi: 10.4161/epi.23924. [DOI] [PMC free article] [PubMed] [Google Scholar]
Associated Data
This section collects any data citations, data availability statements, or supplementary materials included in this article.