

Abstract
In crop species, the impact of temperature on plant development is classically modelled using thermal time. We examined whether this method could be used in a non‐crop species, Arabidopsis thaliana, to analyse the response to temperature of leaf initiation rate and of the development of two leaves of the rosette. The results confirmed the large plant‐to‐plant variability in the studied isogenic line of the Columbia ecotype: 100‐fold differences in leaf area among plants sown on the same date were commonly observed at a given date. These differences disappeared in mature leaves, suggesting that they were due to a variability in plant developmental stage. The whole population could therefore be represented by any group of synchronous plants labelled at the two‐leaf stage and followed during their development. Leaf initiation rate, duration of leaf expansion and maximal relative leaf expansion rate varied considerably among experiments performed at different temperatures (from 6 to 26 °C) but they were linearly related to temperature in the range 6–26 °C, with a common x‐intercept of 3 °C. Expressing time in thermal time with a threshold temperature of 3 °C unified the time courses of leaf initiation and of individual leaf development for plants grown at different temperatures and experimental conditions. The two leaves studied (leaf 2 and leaf 6) had a two‐phase development, with an exponential phase followed by a phase with decreasing relative elongation rate. Both phases had constant durations for a given leaf position if expressed in thermal time. Changes in temperature caused changes in both the rate of development and in the expansion rate which mutually compensated such that they had no consequence on leaf area at a given thermal time. The resulting model of leaf development was applied to ten experiments carried out in a glasshouse or in a growth chamber, with plants grown in soil or hydroponically. Because it predicts accurately the stage of development and the relative expansion rate of any leaf of the rosette, this model facilitates precise planning of sampling procedures and the comparison of treatments in growth analyses.
Key words: Arabidopsis thaliana, thermal time, leaf initiation, leaf expansion, model, temperature
INTRODUCTION
Although its physiological base is still relatively unclear, thermal time is commonly used for modelling the development of crop species. Phenological stages such as plant emergence, leaf initiation and leaf appearance occur at a precise thermal time after germination (e.g. in millet, Ong, 1983; in pea, Turc and Lecoeur, 1997; and in sunflower, Granier and Tardieu, 1998b). Cell division rate, leaf expansion rate and the reciprocal of the durations of cell division or leaf expansion are stable within a genotype if expressed in thermal time (Ben Haj Salah and Tardieu, 1995; Granier and Tardieu, 1998b). The calculation of thermal time is mathematically correct when the rate of the studied process is proportional to organ temperature. If so, a linear relationship can be integrated over time, so that thermal time is the cumulative daily effective temperature (mean daily temperature minus the x‐intercept of the relationship between the considered rate and temperature). If all the processes involved in plant development have a common x‐intercept, it is possible to consider thermal time as a measure of the ‘physiological age’ of the plant. The plant has the same characteristics (e.g. same number of initiated leaves, same number of visible leaves, same leaf area, same cell number per leaf) at a given thermal time after germination, regardless of the temperature scenario, if other environmental conditions do not vary. Common x‐intercepts for different processes have been found in millet (for leaf initiation, leaf appearance and leaf expansion; Ong, 1983) and in sunflower (for leaf initiation, cell division and leaf expansion rates, and for the reciprocal of the duration of each of these processes; Granier and Tardieu, 1998b).
The linear character of the relationships between organ temperature and the rates involved in plant development is unexpected from a physiological point of view, because the activity of enzymes is usually exponentially related to temperature (Johnson and Thornley, 1985). It has been proposed that this apparent linearity could be a statistical artefact: linear fitting on an exponential function over a small range of temperatures (Bonhomme, 2000). However, for example, a linear fitting holds over a wide range of temperatures, from 12 to 35 °C, for tissue expansion and cell division rates in maize leaves (Ben Haj Salah and Tardieu, 1995). The common x‐intercept associated with several rates involved in plant development is even less expected or understandable from a physiological point of view because different combinations of enzymes are involved in each individual rate. The probability of a common x‐intercept seems low. These unexpected results might be an indirect consequence of the selection of crop species by man over thousands of years. Because plants always grow in fluctuating temperatures, the possibility exists that particular responses to temperature, such as a simple and common response to temperature for several processes, may have been unintentionally selected for over centuries. This could have led to stability of crop phenotype and of homogeneous crop harvest time which were major criteria for selection.
The present investigation tested the hypothesis that leaf development of Arabidopsis thaliana, a non‐crop species which has been little selected by human intervention, could be modelled using thermal time as for crop species. One difficulty in the analysis of leaf development in A. thaliana is that plants from the same genotype, sown on the same date, show a ten‐fold variability in leaf area and leaf expansion rate (Leister et al., 1999). This variability causes a methodological difficulty in the comparison of leaf development among experimental treatments or among genotypes. In the work reported here, the variability in leaf development was first quantified and then the effect of temperature on leaf initiation rate and on the development rate of two leaves of the rosette was analysed within a framework of analysis described previously (Granier and Tardieu, 1998a). Using these data, a model of leaf expansion has been developed for Arabidopsis thaliana plants grown in soil and in hydroponic conditions.
MATERIALS AND METHODS
Plant culture and experimental sets
Seeds of Arabidopsis thaliana (L.) Heynh. ecotype Columbia‐0 (Col‐0) were obtained from the Nottingham Stock Centre, UK. Plants were grown in a glasshouse (Gh‐experiments), in a growth‐chamber (Gc‐experiments) and in pots outdoors (Od‐experiment) at Montpellier, southern France. Photon flux density was measured continuously at plant level using a PPFD sensor (LI‐190SB; LI COR, Lincoln, NB, USA). Air temperature and relative humidity were measured at 20 s intervals (HMP35A; Vaisala Oy, Helsinki, Finland). Leaf temperature was first estimated by measuring soil temperature with a copper–constantan thermocouple (0·4 mm diameter) from leaf initiation to leaf emergence. Then the copper–constantan thermocouple was appressed to the lower side of the lamina after leaf emergence. All measurements of temperature, PPFD and relative humidity were averaged and stored every 600 s in a datalogger (LTD‐ CR10 Wiring Panel; Campbell Scientific, Shepshed, UK). Environmental conditions are presented in Table 1.
Table 1.
Environmental conditions in the glasshouse (Gh), the growth chamber (Gc) and outdoors (Od)
| Growing conditions | Experiments | Air temperature (°C) | Cumulative PPFD (mol m–2 d–1) |
| Soil | Gc‐14 °C | 14·0 | 11·5 |
| Gc‐21·5 °C | 21·5 | 14·4 | |
| Gc‐22 °C | 22·0 | 8·8 | |
| Gc‐26 °C | 26·2 | 23·0 | |
| Gh‐22 °C | 21·7 | 14·9 | |
| Gh‐20 °C | 20·3 | 21·0 | |
| Gh‐21 °C | 20·8 | 19·8 | |
| Od‐6·5 °C | 6·5 | 15 | |
| Hydroponic | Gc‐20·5 °C | 20·6 | 17·6 |
| Gh‐22·5 °C | 22·5 | 19·8 |
Means of air temperature and incident PPFD were calculated from plant emergence to the end of expansion of leaf 6. Cumulative PPFD was calculated by multiplying incident PPFD and the length of the day.
Pot experiments.
Eight experiments were carried out (Table 1). Seeds were stored for at least 3 d at 4 °C before sowing and then sown in 20 pots (12 × 12 × 12 cm) containing a 75 : 25 mixture (v/v) of loamy soil and organic compost. The medium was maintained at field capacity by watering the pots once a day with either water or a modified one‐tenth strength Hoagland solution with additional micronutrients. Light in the growth chamber was provided by a bank of cool‐white fluorescent tubes and sodium lamps for a photoperiod of 16 h (except for Gc‐22 °C, photoperiod of 10 h). Natural day length was enhanced in the glasshouse by a bank of sodium lamps, maintaining a photoperiod of 16 h during all growing periods. No additional light was provided during the outdoor experiment. Air temperature in the growth chamber was automatically regulated in such a way that leaf temperature was kept at a constant value of 14, 21·5, 22 and 26 °C, respectively in experiments Gc‐14 °C, Gc‐21·5 °C, Gc‐22 °C and Gc‐26 °C (Table 1). In the glasshouse (Gh‐20 °C, Gh‐21°C and Gh‐22 °C) and outdoor (Od‐6·5 °C) experiments, air temperature varied freely during the growing periods. Air vapour pressure deficit (VPD) was maintained at values below 1·3 kPa.
Hydroponic experiments.
Two batches of plants were grown hydroponically in a glasshouse (Gh‐22·5 °C) or in a growth chamber (Gc‐21 °C), under the environmental conditions presented in Table 1. Four polystyrene rafts (30 × 30 cm), each with 49 holes, were placed in four basins (10 l) containing 5 l of nutrient solution (KNO3 1 m; Ca(NO2)2 0·5 m; KH2PO4 0·5 m; MgSO4 0·5 m; NaFeEDTA 50 mm; micronutrients). Cut tubes (1 cm in diameter × 1·5 cm), plugged by a screen (mesh of 0·2 mm) and filled with sand were placed in the holes. The edges of the basins were covered with aluminium foil. Seeds were germinated directly on the sand (three to five seeds per tube). The nutrient solution was renewed once a week during the first two weeks after plant emergence and twice a week thereafter. For uniformity, young seedlings were thinned to one plant per tube 10 d after plant germination.
Growth measurements
Sampling procedure.
It was observed in preliminary experiments that initial growth rate was highly variable among plants sown on the same date. To deal with this variability, a sampling procedure was designed (see Results). A batch of ten plants was selected at plant emergence and considered as reference plants. At each sampling date, the five harvested plants were chosen as having the same leaf number and similar leaf area as the reference plants.
Leaf initiation.
Five plants were harvested at intervals of 2–6 d (in experiments with high or low temperature, respectively). Plants were dissected in a drop of water and the smallest visible leaf on the apex was identified using a microscope (Leica stereomicroscope; wild F8Z, Leica Wetzlar, Germany) at a magnification of 160×. Its area was measured by image analysis (Optimas V6.5; Media Cybernetics, Silver Spring, MD, USA). A leaf was considered to be initiated when its primordium could be detected on the apex, corresponding to a leaf area close to 0·001 mm2. The date of leaf initiation was calculated for each leaf by linear extrapolation, to 0·001 mm2, of the curve relating leaf area to time on a logarithmic scale. Plant emergence was determined as the day when the second leaf of the rosette was initiated. It coincided with the emergence of hypocotyls and of cotyledons.
Individual leaf development.
In the experiments presented in Table 1 (except Gc‐22 °C), areas of five leaves at positions 2 and 6 on the rosette were measured at intervals of 2 to 3 d from initiation to the end of expansion of the leaf, by dissecting the apex in a drop of water under the microscope, excising the studied leaf and measuring its area with an image analyser.
In experiment Gc‐22 °C, areas of the leaves at position 6 on the rosette were measured for the 204 plants sown, 8 d after the initiation of leaf 6. Plants were placed under a microscope and the area of leaf 6 was measured using an image analyser. The distribution of values of the area of leaf 6 for the whole population was characterized by its mean, median, variance, and by the leaf area below which 25 and 75 % of the distribution occurred (respectively, the first and third quartile). From this date until the end of the expansion of leaf 6, six plants with areas of leaf 6 close to the median value and four plants with areas of leaf 6 close to the first and third quartiles were selected, and the area of their leaf 6 was measured three times a week by a non‐destructive method (binocular and image analysis).
Calculations of leaf initiation rate, plastochron, relative individual leaf expansion rate and duration of expansion
Leaf initiation rate (IR) was calculated as the mean slope of the relationship between leaf number (N) and date of leaf initiation (t, determined as described above) during the whole period of initiation of new leaves on the apex:
IR = dN/dt(1)
Plastochron (P, interval between the initiation of two successive leaves) was calculated as the reciprocal of leaf initiation rate:
P = 1/IR(2)
Leaf relative expansion rate at time j (RERj) was calculated from initiation to the end of expansion as the local slope (at time j) of the relationship between the logarithm of leaf area (A) and time (see Granier and Tardieu, 1998a):
RERj = [d(ln A)/dt]j(3)
Maximum relative leaf expansion rate (RERmax) was calculated as the mean slope of the relationship between leaf area and time on a logarithmic scale during the period that this relationship is near‐linear (see Results).
Leaf expansion was considered to begin on the day when the leaf was initiated on the apex and to end on the day when it reached 95 % of its final area. Final leaf area was calculated as the mean of leaves measured after expansion had ceased.
Calculation of thermal time
Thermal time was calculated by daily integration of leaf temperatures minus the threshold temperature of 3 °C (common intercept of the relationships between all growth variables and leaf temperature in an analysis of covariance; see Results). For example, after 2 d at 23 °C, time in thermal units was 40 °Cd [2 × (23–3)]. Durations and rates were calculated in thermal time, by substituting thermal time for time in corresponding equations (see Granier and Tardieu, 1998b).
RESULTS
Variability in leaf area at a given date; consequences for sampling procedures
Eight days after the initiation of leaf 6, there was a 100‐fold variation in the area of leaf 6 among plants sown on the same date, ranging from 0·04 to 4 mm2 (Fig. 1). The frequency distribution departed significantly from a normal distribution, and was skewed towards low values. Most plants still had a very small leaf 6, but a small proportion had a leaf 6 larger than 1 mm2. Very wide and skewed distributions were observed in three other experiments (not shown), and can therefore be considered as usual in a population of Arabidopsis thaliana plants. However, this variability tended to decrease with time. In the experiment described in Fig. 1, groups of plants with leaves located within the three quartiles of the frequency distribution were followed non‐destructively until the end of the expansion of leaf 6. On the first sampling date, the area of leaves of the first quartile was 75 % lower than that of leaves of the third quartile (Fig. 1 and Fig. 2, inset A). However, the mean area of the three groups of leaves did not differ significantly at the end of the development of leaf 6, with a tendency toward a lower final area for leaves which had the largest area at the first sampling date (Fig. 2, inset B). The three groups of leaves, which had very different areas at the first sampling date, therefore had kinetics of development that were similar, but delayed by several days, to those of leaves with the smallest area at the first sampling date. This suggests that any homogenous group of leaves can represent the kinetics of expansion of the whole population, the variability observed on one date being due to delay in leaf development. Instead of carrying out a systematic random sampling at each date, the variability of which would impede any comparison of treatments, a group of plants that was close to the median of the distribution was followed in the rest of the study. To do this, reference plants were identified at the beginning of plant development. At each sampling date, plants similar to these reference plants (same leaf number, same leaf area) were sampled to establish the kinetics of leaf development in each treatment.

Fig. 1. Distribution of area of leaf 6 for 204 Arabidopsis thaliana plants sown on the same date and measured by a non‐destructive method 8 d after the initiation of leaf 6. The three vertical arrows represent the sizes of the sixth leaf below which 25, 50 and 75 %, respectively, of the whole distribution occurred, corresponding to the first quartile, the median value and the third quartile.

Fig. 2. Changes over time in the area of leaf 6 for plants located in the first quartile (triangles), the median value (squares) and the third quartile (upside‐down triangles) of the distribution presented in Fig. 1. Each point is the mean of three (first and third quartile) or six plants (median). Bars indicate confidence limit at P < 0·05 (n = 3 or 6). Insets: mean area of leaf 6 for four plants from the first and third quartiles, and six plants from the median, 8 d after leaf initiation (inset A) and at the end of expansion of leaf 6 (inset B).
Time courses of leaf initiation and of leaf development
Under a 16 h photoperiod, the rosettes of plants grown in soil and hydroponically contained approx. nine leaves at flowering (Table 2). Leaf initiation rate was approximately constant from the initiation of leaf 3 to that of leaf 9, and it increased markedly with temperature (Fig. 3A). At 21 °C, it was similar in plants grown in soil and in nutrient solution, at 0·99 and 0·94 leaf d–1, respectively (Tables 1 and 2).
Table 2.
Final leaf number in the rosette and mean leaf initiation rate for plants in the different experiments presented in Table 1
| Growing conditions | Experiments | Final leaf number in the rosette | Leaf initiation rate (leaf d–1) |
| Soil | Gc‐14 °C | 9·2 | 0·68 |
| Gc‐21·5 °C | 9·3 | 1·06 | |
| Gc‐22 °C | – | – | |
| Gc‐26 °C | 9·0 | 1·49 | |
| Gh‐22 °C | 9·1 | 1·14 | |
| Gh‐20 °C | 9·4 | 0·82 | |
| Gh‐21 °C | 9·0 | 0·99 | |
| Od‐6·5 °C | – | – | |
| Hydroponic | Gc‐20·5 °C | 9·2 | 0·94 |
| Gh‐22·5 °C | 9·0 | 0·96 |
Final leaf number was calculated as the mean leaf number among ten plants at flowering. Final leaf number and leaf initiation rate were not measured for the Od‐6·5 °C and Gc‐22 °C experiments as these experiments were not performed until the end of vegetative development.

Fig. 3. A, Changes over time in leaf number for Arabidopsis thaliana grown in soil with a 16 h photoperiod at 26 (triangles), 21·5 (circles) or 14 °C (squares), respectively, during the experiments Gc‐26 °C, Gc‐21·5 °C and Gc‐14 °C. Inset: relationship between leaf initiation rate (I) and plant temperature for experiments in soil and in hydroponic conditions: Gc‐14 °C (open square), Gh‐22 °C (closed circle), Gh‐20 °C (closed square), Gh‐21°C (closed triangle), Gh‐22·5 °C (closed diamond), Gc‐21·5 °C (open circle), Gc‐20·5 °C (open diamond) and Gc‐26 °C (open triangle). The solid line is a linear regression fitted to the data, r2 = 0·78. B, Changes with thermal time in leaf number for Arabidopsis thaliana grown in soil at a 16 h photoperiod at 26, 21·5 or 14 °C (same experiments and symbols as in A).
The time course of expansion of leaf 2 was similar in plants grown in soil or in nutrient solution when temperature, light and air vapour pressure deficit (VPD) were the same (Fig. 4A; Table 1). On a logarithmic scale, leaf area increased rapidly and almost linearly with time during a first period which lasted approx. one‐third of the whole duration of leaf expansion (Fig. 4B). During this period, the relative expansion rate was maintained at values higher than 0·7 mm2 mm–2 d–1, following a bell‐shaped curve for approx. 8 d (Fig. 4C). During the last two‐thirds of leaf development, leaf area increased almost linearly with time (Fig. 4A). Relative leaf expansion rate decreased during this period (Fig. 4C).
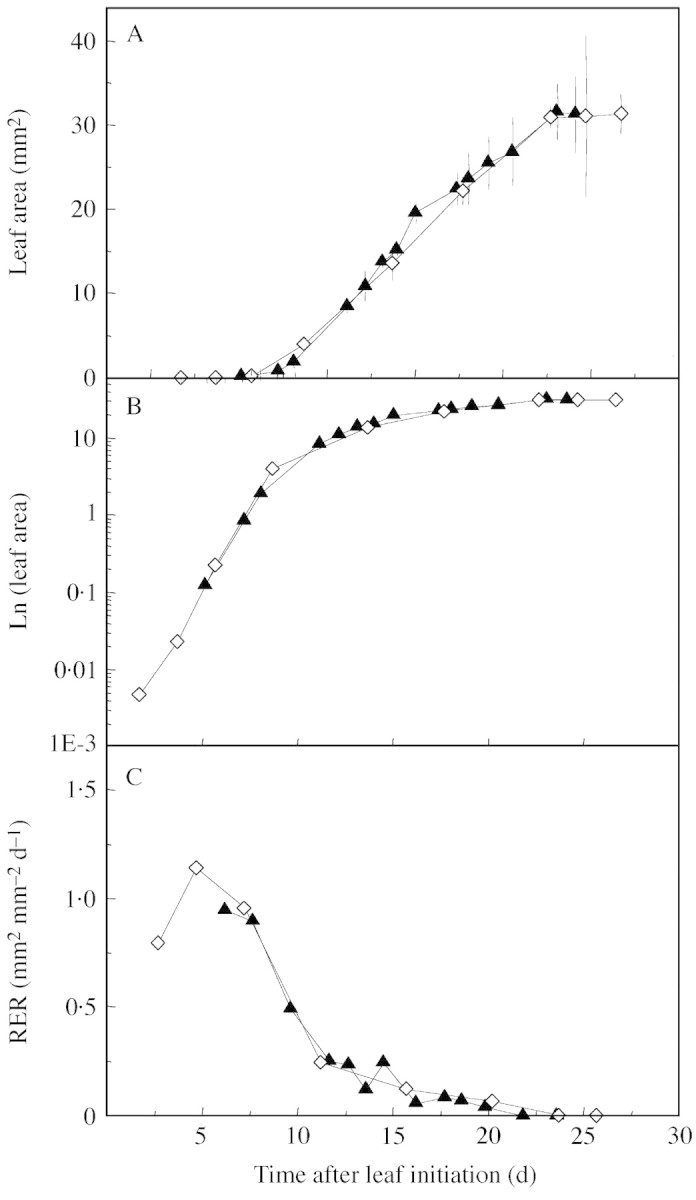
Fig. 4. Changes over time in the area of leaf 2 (A), in the area of leaf 2 on a logarithmic scale (B), and in the corresponding relative expansion rate (RER, C) for plants grown under similar temperatures and cumulative PPFD: either in soil (Gh‐21 °C, triangles), or in hydroponic conditions (Gc20·5 °C, diamonds). Vertical bars in A represent confidence limit at P < 0·05 (n = 5).
Effect of temperature on leaf initiation and individual leaf expansion
Leaf initiation rate was linearly related to apex temperature, with an x‐intercept close to 2·5 °C (Fig. 3A, inset). A common linear relationship was shown by plants grown in soil or in nutrient solution, in the glasshouse as well as in the growth chamber (Fig. 3A inset; Table 2). The maximum relative expansion rate (Fig. 5A and B) and the reciprocal of leaf expansion duration (Fig. 5C and D) were also linearly related to leaf temperature from 6 to 26 °C for both leaves 2 and 6. The same relationships were common to plants grown in soil or in nutrient solution either in a glasshouse, or a growth chamber or outdoors.

Fig. 5. Relationships between maximal relative leaf expansion rate and leaf temperature for leaf 2 (A) and leaf 6 (B) in soil and hydroponic conditions, and relationships between the reciprocal of leaf expansion duration and leaf temperature for leaf 2 (C) and leaf 6 (D). Gc‐14 °C (open square), Gh‐22 °C (closed circle), Gh‐20 °C (closed square), Gh‐21 °C (closed triangle), Gh‐22·5 °C (closed diamond), Gc‐21·5,°C (open circle), Gc‐20·5 °C (open diamond), Gc‐26,°C (open triangle), and Od‐6·5,°C (asterisk). Solid lines are linear regressions fitted to the data: r2 = 0·92 (A), r2 = 0·98 (B), r2 = 0·91 (C) and r2 = 0·93 (D).
The hypothesis that all of these relationships were consistent and had a common x‐intercept was tested as follows. Each response curve was normalized to its value at 21·5 °C. Normalized linear regressions (Fig. 6) did not differ significantly, and the common x‐intercept was close to 3 °C (2·65 °C ± 1·2). It was then established that a common linear relationship applied to several processes of leaf development, for plants grown at different temperatures in a nutrient solution as well as in soil, in the glasshouse as well as in the growth chamber.

Fig. 6. Relationships between leaf temperature and normalized growth variables, namely leaf initiation rate (closed circles), relative expansion rate of leaf 2 (closed squares), relative expansion rate of leaf 6 (closed triangles), the reciprocal of duration of leaf 2 expansion (open squares) and the reciprocal of duration of leaf 6 expansion (open triangles) for plants grown in soil and hydroponic conditions. Growth variables were normalized by their corresponding value during the experiment Gc‐21·5 °C. For example, the normalized value of relative expansion rate (RER) corresponding to leaves grown in experiment Gc‐26 °C was obtained by dividing the actual RER of these leaves by RER of the leaves during the experiment Gc‐21·5 °C. The solid line is the linear regression fitted to the data, r2 = 0·89 and the x‐intercept = 2·65 °C.
A thermal time‐based programme of leaf development that applies to a wide range of experimental conditions
In contrast to the findings from plants grown in different cultivation media at the same temperature (Fig. 4), the time course of relative expansion rate differed markedly among experiments carried out at a range of temperatures from 6 to 21·5 °C (Fig. 7A and B). Both the maximum rates and the durations of leaf development differed between experiments: the longest durations were observed at low temperature (e.g. 60 d at 6 °C vs. 20 d at 21·5 °C for leaf 2), and the fastest rates were observed at the highest temperatures. However, the time courses of expansion were common for each leaf studied if expressed as a function of thermal time rather than of calendar time (Fig. 7C and D). In leaf 2, the relative expansion rate began to decrease steeply at 100 °Cd after leaf initiation, and expansion stopped at 355 ± 34 °Cd after leaf initiation. In leaf 6, the decrease was later and less steep than in leaf 2, and expansion stopped at 334 ± 12 °Cd after leaf initiation. Moreover, the values of relative expansion rate at each time were nearly unified if expressed per unit of thermal time (mm2 mm–2 °Cd–1) rather than per unit calendar time (Fig. 7E and F). Maximal relative expansion rate per unit of thermal time was common to plants grown at all studied temperatures for leaf 2 (0·054 ± 0·006 mm2 mm–2 °Cd–1) and leaf 6 (0·050 ± 0·002 mm2 mm–2 °Cd–1).

Fig. 7. Changes with time in relative expansion rate (RER) for leaves 2 (A) and 6 (B) of plants grown at three different temperatures for leaf 2 (6, 14 and 21·5 °C) and two different temperatures for leaf 6 (14 and 21·5 °C). Changes with thermal time in relative expansion rate expressed in calendar time (RER, C, D) and relative expansion rate expressed in thermal time (RERtt, E, F) for leaves 2 (C, E) and 6 (D, F). Experiments are: Od‐6·5 °C (asterisk), Gc‐21·5 °C (circles) and Gc‐14 °C (squares). Thermal time was calculated with a temperature threshold of 3 °C.
In the same way, plastochrons expressed in calendar time varied from 1·5 d at 14 °C to 0·7 d at 26 °C but became common to all experiments if expressed in thermal time with a base temperature of 3 °C (17·6 ± 1·2 °Cd, mean of all experiments in soil and hydroponic conditions). Expressed in thermal time, the duration of the phase of initiation of new leaves was also common to all experiments, 123 ± 8 °Cd after plant emergence (Fig. 3B).
A visual illustration of the use of thermal time is presented in Fig. 8. As leaves developed faster at high temperature than at low temperature, the area of leaf 2 was smaller at low temperature than at high temperature at the same number of days from initiation (Fig. 8A–C). In contrast, leaves reached similar areas at a given thermal time from leaf initiation regardless of temperature (Fig. 8D–F).
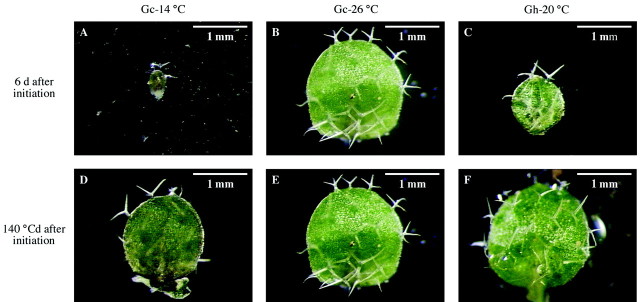
Fig. 8. Photographs of leaf 2, 6 d after its initiation in plants grown at 14 (A), 26·2 (B) or 20·3 °C (C), respectively, during the experiments Gc‐14 °C, Gc‐26 °C and Gh‐20 °C. Leaf areas were 0·06, 2·2 and 0·9 mm2, respectively. Photographs of leaf 2, approx. 140 °Cd after its initiation in plants grown at 14 (D), 26·2 (E) or 20·3 °C (F), respectively, during the same experiments as in A, B and C. Leaf areas were 1·9, 2·2 and 2·3 mm2, respectively. Photographs were taken after dissection using a microscope at a magnification of 64×.
DISCUSSION
Variability of leaf area on a given date is probably due to differences in the date of plant germination: consequences for sampling methods
High variability of root or leaf development among Arabidopsis thaliana plants at a given time after sowing has been reported elsewhere (Leister et al., 1999; van der Weele et al., 2000). A method to select plants that are representative of the whole population at different dates is therefore a prerequisite for analyses of the effect of environmental conditions or for comparing genotypes. It has been proposed, for studies of root development, to select a group of representative plants by measuring all root lengths at a given date and by retaining only those plants with similar primary root length (van der Weele et al., 2000). This method is not suitable for leaves because measurements of area at early stages of leaf development can be achieved only after dissection of the shoot apex to identify the studied leaf. In two recent papers, the leaf plastochron index has been used as a time variable instead of chronological age in order to reduce plant‐to‐plant variability (Groot and Meicenheimer, 2000a, b). This is an efficient method, although determining the rate of leaf appearance can cause errors in dicotyledonous species because development and growth characteristics cannot be distinguished. This can cause appreciable errors when genotypes or experimental treatments are compared (Granier and Tardieu, 1998b). The results presented here indicate that the kinetics of individual leaf development are common to leaves with different areas at a given date, suggesting that the variability in leaf area at one date is due to a shift in the date of germination. It is therefore proposed to select plants by comparison with a group of three to five plants with similar leaf area at an early stage of development which are labelled at that time and followed until the end of development (reference plants). This permits the identification of a group of synchronous plants in the population. Because plant‐to‐plant variability on one date is essentially due to differences in the date of germination, the growth curve of this group of synchronous plants can be considered to be representative of that of the whole leaf population. To compare plants belonging to several treatments or genotypes, reference plants corresponding to each treatment or genotype should have a leaf area close to the median of the considered leaf population on the first sampling date.
The ‘physiological age’ of Arabidopsis thaliana and the rates involved in leaf development from different experiments can be unified by the use of thermal time
Three conclusions can be derived from the series of experiments presented here. First, the sequence of events involved in leaf development (time of leaf initiation, initial expansion rate, duration of expansion) respond to temperature in a unique way in different experiments carried out at different dates, in different environments (glasshouse, growth chamber, outdoors), and for plants grown in soil as well as in nutrient solution. Therefore, leaves of Arabidopsis thaliana have a pattern of development that is as predictable as that of crops, such as maize or sunflower, which have been selected by man. Secondly, the relationships between organ temperature and processes involved in development are linear over a wide range of temperatures (6–26 °C). These processes are leaf initiation rate, relative expansion rate of two leaves of the rosette and the reciprocal of the duration of leaf expansion for two leaves of the rosette. The range of temperatures over which responses are linear was similar to that observed in crop species (13–30 °C in maize; 12–26 °C in sunflower). These linear relationships would certainly fail if the temperature exceeded the maximum value. Thirdly, the x‐intercept of all studied relationships did not differ significantly among relationships and was close to 3 °C. Thermal time can, therefore, be calculated using a unique threshold temperature of 3 °C for all studied processes.
The conditions for a simple expression of ‘physiological age’ by thermal time are, therefore, fulfilled. The duration of leaf development phases and the leaf relative expansion rate measured at each thermal time were stable and can be considered as characteristics of the ecotype (Columbia), as it is the case for sunflower leaves (Granier and Tardieu, 1998b), maize leaves (Tardieu et al., 2000) and maize internodes (Fournier and Andrieu, 2000). Processes linked to the cell cycle, such as cell division rate, the duration of cell cycle or the duration of cell cycle phases, could not be studied here because A. thaliana leaves pose special problems when using kinematic (large cell‐to‐cell variability in cell area) or flow cytometry techniques (polyploidy). However, results from sunflower (Granier and Tardieu, 1998b) and other species (Tardieu and Granier, 2000) suggest that these durations and rates may also be expressed in thermal time units. The use of thermal time implies that, for A. thaliana, the stage of leaf development (‘physiological age’) is the same after 2 d at 23 °C [2 × (23 – 3) = 40 °Cj] as after 4 d at 13 °C [4 × (13 – 3) = 40 °Cj]. This is illustrated in Fig. 8.
This non‐crop species, classified as a weed, displays the same synchronies as do cultivated crops, calling into question the hypothesis raised in the Introduction, namely that the linear character of relationships and the common x‐intercepts of the relationship between rates and organ temperature can be considered to be a consequence of breeding selection. Arabidopsis thaliana has proved to be an appropriate genetic material for the analysis of the physiological causes of such unexpected linear relationships.
Practical implications for the analysis of plant development
Experiments on leaf and root development, and on nutrient uptake, have been carried out with different cultivation systems, under different temperatures and under different micrometeorological conditions (e.g. Clarke et al., 1999; Lejay et al., 1999; Zhang and Forde, 2000). It is important to determine whether experiments on different aspects of development can be considered together, or whether differences in cultivation systems make common interpretation irrelevant. Here, leaf development was similar for plants grown in soil and in hydroponic conditions under the same micrometeorological conditions (Fig. 4). If temperature differed among the experiments, the programme of development would not be altered substantially because the relationships between all processes studied and temperature were common to plants grown either in soil or in nutrient solution (Figs 5 and 6). These relationships, however, did not account for leaf development of plants grown in Petri dishes (not shown).
Quantitative analyses of individual leaf expansion in Arabidopsis thaliana are rare (Pyke et al., 1991; Donnelly et al., 1999; Groot and Meicenheimer, 2000a). Until now, A. thaliana mutants have normally been compared using leaf shape (Lincoln et al., 1994; Tsuge et al., 1996; Kim et al., 1998; Groot and Meicenheimer, 2000b) or the timing of appearance of trichomes on leaves (Telfer et al., 1997; Clarke et al., 1999). The combination of micrometeorological measurement, developmental analysis and modelling presented here could be useful in the current search for ‘phenotyping’ mutants or ecotypes of A. thaliana. Because rates and time courses are unique for a given leaf of the ecotype Columbia, studied here, they are a reproducible characteristic of the genotype. This approach could facilitate the dissection of the phenotypic variability of leaf area or shape into differences in rates or in durations of several processes. The pattern of leaf expansion was common to leaves 2 and 6 in Columbia despite much variability in leaf shape and venation pattern between these two leaves (Clarke et al., 1999). The total duration of leaf expansion and the maximal relative leaf expansion rate were not significantly different between those two leaves, but the decrease in relative leaf expansion rate occurred earlier in leaf 2 than in leaf 6. The rate of decrease in relative leaf expansion rate also differed between the two leaves studied and was higher in leaf 2 than in leaf 6. In Columbia, leaf 2 is formed during the juvenile phase and has a smaller mature area than leaf 6 which is formed during the adult phase (Clarke et al., 1999). The methods presented here clarify how this heteroblastic difference in size arises. A precise knowledge of where, when, and at which rate leaf expansion occurs in a plant could help to identify genes or proteins involved in the regulation of organ development. This has been shown recently in the case of the regulation of cell cycle in maize leaves (Granier et al., 2000).
ACKNOWLEDGEMENTS
We thank H. Baudot for providing seeds and for advice on cultivation of Arabidopsis thaliana in the different growing media, M. Bernoux for data collection during the Gc‐22 °C experiment and J. J. Thioux for technical assistance during the experiments. This work was funded by an INRA grant ‘Ecogene’.
Supplementary Material
Received: 1 October 2001; Returned for revision: 20 November 2001; Accepted: 25 January 2002.
References
- Ben Haj SalahH, Tardieu F.1995. Temperature affects expansion rate of maize leaves without change in spatial distribution of cell length. Analysis of the coordination between cell division and cell expansion. Plant Physiology 109: 861–870. [DOI] [PMC free article] [PubMed] [Google Scholar]
- BonhommeR.2000. Bases and limits to using ‘degree.day’ units. European Journal of Agronomy 13: 1–10. [Google Scholar]
- ClarkeJH, Tack D, Findlay K, Van Montagu M, Van Lijsebettens M.1999. The SERRATE locus controls the formation of the early juvenile leaves and phase length in Arabidopsis Plant Journal 20: 493–501. [DOI] [PubMed] [Google Scholar]
- DonnellyPM, Bonetta D, Tsukaya H, Dengler RE, Dengler NG.1999. Cell cycling and cell enlargement in developing leaves of Arabidopsis Developmental Biology 215: 407–419. [DOI] [PubMed] [Google Scholar]
- FournierC, Andrieu B.2000. Dynamics of elongation of internodes in maize (Zea mays L.): analysis of phases of elongation and their relationships to phytomer development. Annals of Botany 86: 551–563. [Google Scholar]
- GranierC, Tardieu F.1998a Spatial and temporal analyses of expansion and cell cycle in sunflower leaves. A common pattern of development for all zones of a leaf and different leaves of a plant. Plant Physiology 116: 991–1001. [DOI] [PMC free article] [PubMed] [Google Scholar]
- GranierC, Tardieu F.1998b Is thermal time adequate for expressing the effects of temperature on sunflower leaf development? Plant Cell and Environment 21: 695–703. [Google Scholar]
- GranierC, Inzé D, Tardieu F.2000. Spatial distribution of cell division rate can be deduced from that of p34cdc2 kinase activity in maize leaves grown at contrasting temperatures and soil water conditions. Plant Physiology 124: 1393–1412. [DOI] [PMC free article] [PubMed] [Google Scholar]
- GrootEP, Meicenheimer RD.2000a Short‐day‐grown Arabidopsis thaliana satisfies the assumptions of the plastochron index as a time variable in development. International Journal of Plant Sciences 161: 749–756. [Google Scholar]
- GrootEP, Meicenheimer RD.2000bComparison of leaf plastochron index and allometric analyses of tooth development in Arabidopsis thaliana Journal of Plant Growth Regulation 19: 77–89. [DOI] [PubMed] [Google Scholar]
- JohnsonIR, Thornley JHM.1985. Temperature dependence of plant and crop processes. Annals of Botany 55: 1–24. [Google Scholar]
- KimGT, Tsukaya H, Uchimiya H.1998. The CURLY LEAF gene controls both division and elongation of cells during the expansion of the leaf blade in Arabidopsis thaliana Planta 206: 175–183. [DOI] [PubMed] [Google Scholar]
- LeisterD, Varotoo C, Pesaresi P, Niwergall A, Salamini F.1999. Large‐scale evaluation of plant growth in Arabidopsis thaliana by non‐invasive image analysis. Plant Physiology and Biochemistry 37: 671–678. [Google Scholar]
- LejayL, Tillard P, Lepetit M, Olive FD, Filleur S, Daniel‐Vedele F, Gojon A.1999. Molecular and functional regulation of two NO3– uptake systems by N‐ and C‐status of Arabidopsis plants. Plant Journal 18: 509–519. [DOI] [PubMed] [Google Scholar]
- LincolnC, Long JA, Yamaguchi J, Serikawa K, Hake S.1994. A Knotted1‐like homeobox gene in Arabidopsis is expressed in the vegetative meristem and dramatically alters leaf morphology when overexpressed in transgenic plants. Plant Cell 6: 1859–1876. [DOI] [PMC free article] [PubMed] [Google Scholar]
- OngCK.1983. Response to temperature in a stand of pearl millet. I. Vegetative development. Journal of Experimental Botany 34: 337–348. [Google Scholar]
- PykeKA, Marrison JL, Leech RM.1991. Temporal and spatial development of the cells of the expanding first leaf of Arabidopsis thaliana (L.) Heynh. Journal of Experimental Botany 42: 1407–1416. [Google Scholar]
- TardieuF, Granier C.2000. Quantitative analysis of cell division in leaves: methods, developmental patterns and effects of environmental conditions. Plant Molecular Biology 43: 555–567. [DOI] [PubMed] [Google Scholar]
- TardieuF, Reymond M, Hamard H, Granier C, Muller B.2000. Spatial distributions of expansion rate, cell division rate and cell size in maize leaves: a synthesis of the effects of soil water status, evaporative demand and temperature. Journal of Experimental Botany 51: 1505–1514. [DOI] [PubMed] [Google Scholar]
- TelferA, Bollman KM, Poethig RS.1997. Phase change and the regulation of trichome distribution in Arabidopsis thaliana Development 124: 645–654. [DOI] [PubMed] [Google Scholar]
- TsugeT, Tsukaya H, Uchimiya H.1996. Two independent and polarized processes of cell elongation regulate leaf blade expansion in Arabidopsis thaliana (L.) Heynh. Development 122: 1589–1600. [DOI] [PubMed] [Google Scholar]
- TurcO, Lecoeur J.1997. Leaf primordium initiation and expanded leaf production are co‐ordinated through similar response to air temperature in pea (Pisum sativum L.) Annals of Botany 80: 265–273. [Google Scholar]
- Van der WeeleCM, Spollen WG, Sharp RE, Baskin TI.2000. Growth of Arabidopsis thaliana seedlings under water deficit studied by control of water potential in nutrient‐agar media. Journal of Experimental Botany 51: 1555–1562. [DOI] [PubMed] [Google Scholar]
- ZhangH, Forde BG.2000. Regulation of Arabidopsis root development by nitrate availability. Journal of Experimental Botany 51: 51–59. [PubMed] [Google Scholar]
Associated Data
This section collects any data citations, data availability statements, or supplementary materials included in this article.