Significance
Sarcoidosis is a disease involving abnormal collection of granulomas that develop in the lung and other organs. The origin of the disease is unknown, clinical data are very limited, and there is no current effective treatment. This paper develops a mathematical model with simulations that are validated by the available clinical data. The model is then used to explore potential treatments of the disease, to suggest therapeutic targets that may reduce the disease activity, and thus to predict treatment responses in preclinical settings.
Keywords: sarcoidosis, granuloma, math modeling
Abstract
Sarcoidosis is a disease involving abnormal collection of inflammatory cells forming nodules, called granulomas. Such granulomas occur in the lung and the mediastinal lymph nodes, in the heart, and in other vital and nonvital organs. The origin of the disease is unknown, and there are only limited clinical data on lung tissue of patients. No current model of sarcoidosis exists. In this paper we develop a mathematical model on the dynamics of the disease in the lung and use patients’ lung tissue data to validate the model. The model is used to explore potential treatments.
Sarcoidosis is a disease involving an abnormal collection of inflammatory cells that can interact to form nodules, called granulomas, which are capable of altering the functions of affected tissues and organ systems. The granulomas contain macrophages, T lymphocytes whose functions are regulated by inflammatory mediators such as TNF-α, IFN-γ, IL-2, IL-10, IL-12 and TGF-β. The sarcoidosis granulomas are most commonly detected in the lungs and mediastinal lymph nodes; however, recent technological advances have improved disease detection in other organs, such as the heart, which is now recognized to be involved in one-third of cases, and other vital and nonvital organs (1–4). Sarcoidosis of the lungs and heart contributes to disability and increased mortality in these patients.
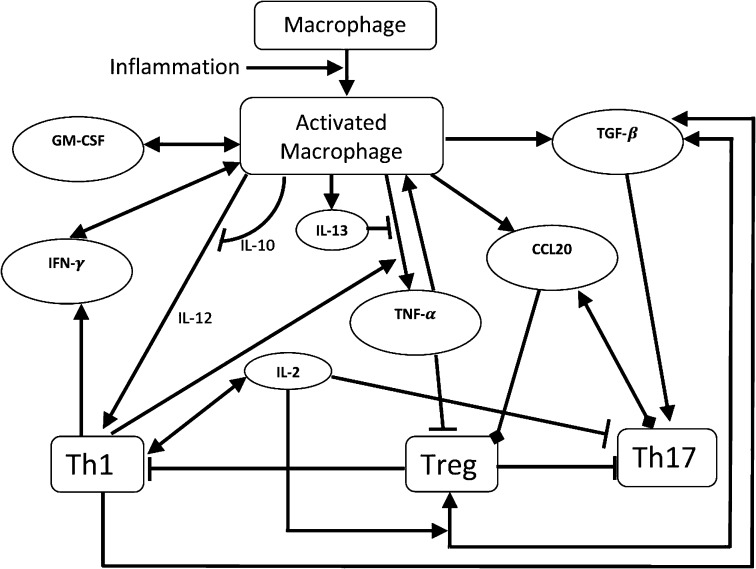
The primary cause of sarcoidosis remains a mystery, and progress has been limited by the lack of relevant disease models. It is unknown to what extent genetic predisposition or specific environmental exposures (e.g., antigens derived from infectious organisms) trigger the inflammatory immune response. It is reasonable, however, to assume that, in the lung, inflammation is initiated following inhalation of an environmental antigen, which leads to a typical Th1 immune response that is initiated by macrophages. Activated macrophages secrete proinflammatory cytokines such as IL-12 (5) and TNF-α (6, 7) and anti-inflammatory cytokine IL-10 (8) and IL-13 (9); they and Th17 cells secrete chemokine (C-C motif) ligand 20 (CCL20) CCL20 (10, 11). The CD4+ T cells in sarcoidosis are primarily Th1, Th17, and Treg. Th1 is activated by IL-12, and activated Th1 cells produce IFN-γ, which further activates macrophages; these processes are inhibited by IL-10 (12, 13). Cytokine CCL20 chemoattracts both Treg and Th17 cells (14) into the granuloma. Treg and Th17 are both activated by TGF-β (15). IL-2 secreted by Th1 (16) increases the proliferation of Th1 cells (16), blocks the proliferation of Th17 cells (17), and enhances the activation of Treg by TGF-β (18, 19); TGF-β is secreted by activated macrophages and Treg (20, 21).
A detailed diagram of the network involving the interactions among all these immune cells and cytokines, including GM-CSF production by macrophages, is shown schematically in Fig. 1.
Fig. 1.
Schematic network of sarcoidosis. Arrowhead means production or activation, rectangle means inhibition, and oval means chemoattraction.
No current models of sarcoidosis exist. In this paper we develop a mathematical model of sarcoidosis based on the diagram shown in Fig. 1. The model is represented by a system of partial differential equations. Parameters are determined by using the clinical data on cytokine levels in healthy lung tissue as reported in Crouser et al. (22). The model is then validated by data on cytokine levels in lung tissue of patients (22).
We use the model to explore the effect of anti–TNF-α (currently in use) and potential drugs, anti–IL-12, anti–IFN-γ, and TGF-β enhancement, in decreasing the size of sarcoid granulomas.
Mathematical Model
The variables of the model are listed in Table 1. Here we assume that the granuloma occupies a region that varies in time and that macrophages and T cells are in movement with velocity u within the granuloma. The need to use a spatial model arises from the facts that granulomas are regions that evolve in time, and chemotaxis by chemokine CCL20 plays an important role in attracting both Th17 and Treg cells.
Table 1.
The variables of the model
| Variable | Description |
| Density of macrophages | |
| R | Density of Treg cells |
| Concentration of IL-12 | |
| Concentration of IL-13 | |
| Concentration of IFN-γ | |
| Concentration of TNF-α | |
| Concentration of TGF-β | |
| T | Density of Th1 cells |
| H | Density of Th17 cells |
| Concentration of IL-2 | |
| Concentration of IL-10 | |
| G | Concentration of GM-CSF |
| C | Concentration of CCL20 |
| u | Fluid velocity in |
Concentration and densities are in units of .
We assume that all species are dispersing or diffusing, in the granuloma, with appropriate diffusion coefficients. The equation for each species has the form
| [1] |
where is the Laplace operator, is the diffusion coefficient, and is a function that depends on all of the species and expresses the result of their interactions on the growth of . The term for cells means dispersion, which decreases crowding, and for cytokines it means diffusion. Because cells are much larger than cytokines, their dispersion coefficients are much smaller than the diffusion coefficients of cytokines. The term represent movement by advection: for cells but for cytokines (cytokines are very small and move only by diffusion). In determining the structure of , we use, for simplicity, the linear mass conservation law. For instance, if , then , where m is the production rate of . However, this law will apply only when and are unlimited. If, for example, represents cells and represents molecules that are bound and internalized by , then the internalization of may be limited due to the limited rate of receptor recycling. In this case, we use the Michaelis–Menten law ; we do not use Hill’s law because we want to keep the linear conservation law for small concentrations.
Equation for Activated Macrophages .
Alveolar macrophages are M2 macrophages (23). They are activated by IFN-γ (24), GM-CSF (25), and TNF-α (26).
The density of the activated macrophages follows the equation
| [2] |
where f indicates the inflammation. As mentioned above, the use of the Michaelis–Menten law, for instance, , expresses the fact that internalization of may be limited due to the limited rate of receptor recycling. The Michaelis–Menten law is similarly used throughout this paper.
Equation for Th1 Cells .
The density of Th1 cells satisfies the equation
| [3] |
In the first term on the right-hand side, Th1 cells are activated by IL-12 and direct contact with MHCII of activated macrophages and inhibited by IL-10 (12, 13). IL-2 increases the proliferation of Th1 cells (16). These processes are inhibited by Treg (27). Internalization of IL-12 is much smaller than the inhibition by IL-10, and therefore the term was neglected in the denominator of the first term of the right-hand side (i.e., , in SI Text).
Equation for Treg cells .
The density of Treg cells satisfies the equation
| [4] |
Treg cells are activated by TGF-β in the presence of IL-2 (18, 19) and direct contact with activated macrophages and chemoattracted by CCL20 (14). TNF-α resists activation of Treg (28), and this resistance is assumed to be significantly higher than the internalization of TGF-β (which is neglected here).
Equation for Th17 Cells .
Th17, in direct contact with activated macrophages, is activated by TGF-β (15) and other cytokines including IL-6, IL-21, and IL-23 (29). For simplicity we include only TGF-β in our model and accordingly adjust its activation rate . This activation is resisted by Treg (via IL-6) (30) as well as by IL-2 (17). Th17 is also chemoattracted by CCL20 (14). Hence the equation for the density of Th17 cells is given by
| [5] |
Equation for IFN-γ .
The concentration of IFN-γ is modeled by
| [6] |
IFN-γ is secreted by Th1 lymphocytes and by activated macrophages (24).
Equation for TGF-β .
TGF-β is secreted by Treg (21), activated macrophages (20), and Th1 lymphocytes (21). Hence the TGF-β concentration satisfies the equation
| [7] |
Equation for IL-12 .
IL-12 comes in two forms, IL-12 p40 and IL-12 p70 (5). Both forms are produced by activated macrophages and inhibited by IL-10 (31). This process is enhanced by IFN-γ, but the production of IL-12 p70 is negligible without the participation of IFN-γ (5). Hence the equations for the concentration of IL-12 are given by
| [8] |
Equation for TNF-α .
The concentration of TNF-α evolves according to the equation
| [9] |
TNF-α is secreted by activated macrophages (6, 7), a process enhanced by IFN-γ (32) and inhibited by IL-13 (33).
Equation for IL-2 .
IL-2 is produced by Th1 cells (16):
| [10] |
Equations for Other Cytokines: GM-CSF (G), IL-13 , IL-10 , and CCL20 (C).
Activated alveolar macrophages produce GM-CSF (34), IL-10 (8), IL-13 (9), and CCL20 (10). Hence,
| [11] |
| [12] |
| [13] |
| [14] |
The absorption term in Eq. 12 is based on the fact that IL-10 enters macrophages to block production of IL-12 at the transcription level (31). The rate of absorption depends on the level of IL-12 in the microenvironment and is taken to be .
Eq. 14 includes a loss due to the chemotaxis by CCL20, which is bound and internalized by Treg and Th17 that are chemoattracted by CCL20.
Equations for the Velocity u.
We assume that the cells are distributed uniformly throughout the granuloma, and their total density is 0.1 g/mL (35), so that
We also assume that all cells have approximately the same volume and surface area, so that the diffusion coefficients of all cell types are the same. By adding Eqs. 2–5, we get
| [15] |
Results
The parameter values of the system of Eqs. 1–14 are given SI Text. In this section we simulate the mathematical model developed in the previous section. For computational simplicity, we assume that the granuloma is a sphere with radius and all of the variables are radially symmetric [that is, functions of ], satisfying a no-flux boundary condition. The boundary is moving by the kinematic law
| [16] |
where u is the component of the velocity u in the radial direction. We take the initial state to be that of a healthy individual. Some of the unknown parameters of the model were chosen so that the cytokine levels in healthy lung tissue coincide with the levels reported in ref. 22.
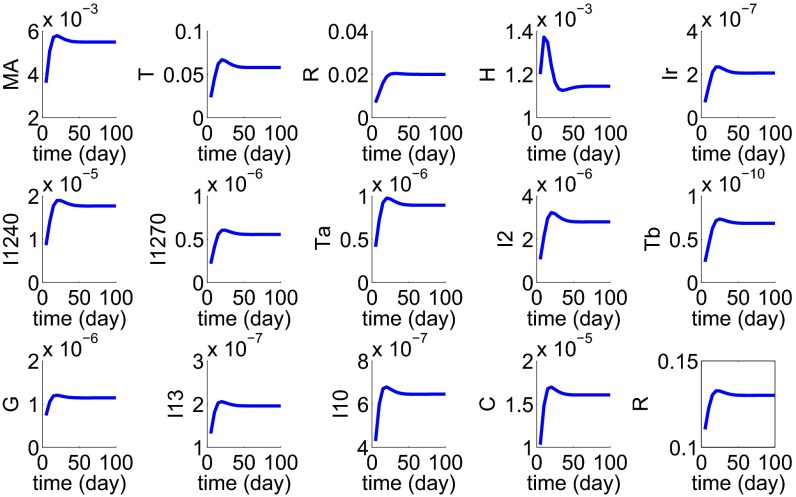
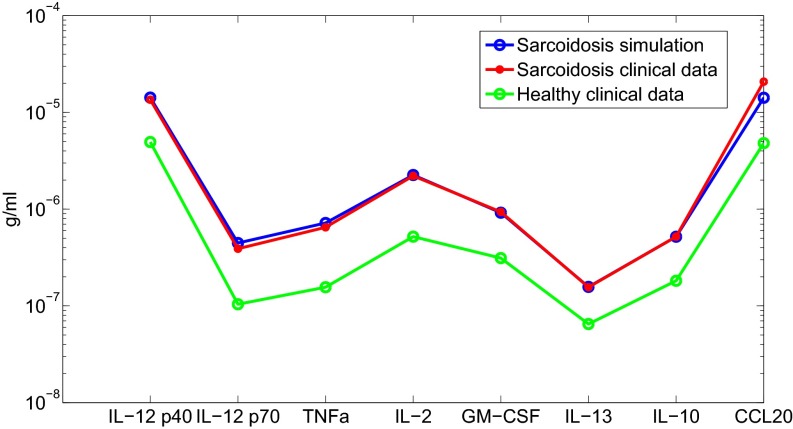
To validate the model, we assume that the initial stage of the disease triggers macrophage inflammatory reaction. We then simulated the development of a granuloma by taking a spherical tissue with initial radius cm and an inflammation level in Eq. 2. Fig. 2 shows the profiles of all of the cells and cytokines for the first 100 d, at which time the disease reached steady state; note that the granuloma radius increased from cm to cm. Patient data (n = 11) of cytokine concentration in lung tissue are reported in ref. 22. We can compare our results (at day 100) with the data in ref. 22. Fig. 3 shows a good fit of our simulation results with the patient data.
Fig. 2.
Simulation results during the first 100 d since the start of the disease.
Fig. 3.
Comparison with clinical data.
The slight discrepancy in the level of CCL20 can be attributed to the fact that in ref. 22 it was chemokine MIP-1α that was measured rather than chemokine CCL20.
Treatment.
The most commonly used agents in the treatment of pulmonary sarcoidosis are corticosteroids; taken orally they provide relief of symptoms and control potentially disabling respiratory impairments (36). However, the exact mechanism of the action of the drugs is unknown, and they do not cure the disease (37). Infliximab, an anti–TNF-α drug, is used for chronic resistance sarcoidosis, but it has serious side effects and its effectiveness is uncertain (36).
From Fig. 2 we see that, starting from heathy state, the sarcoid granuloma radius will increase in 100 d from radius cm to radius cm. A complete recovery, in our model, will reduce the granuloma radius to 0.1 cm. Clinical tests for sarcoidosis use expression of FVC, cytokine expression in bronchoalveolar lavage (BAL), or BAL in fluid (BALF). Forced vital capacity (FVC) tests are easy to take; however, they do not provide a good representation of the state of the disease and may also be inconsistent. Data for anti–TNF-α reported in ref. 38 by FVC test show inconsistency in the effect of the drug over time, particularly as the level of the drug injection is increased. Using BAL measurements, it is reported in ref. 39 that TGF-β is a regulator of the inflammatory process in sarcoidosis. Expression of cytokine mRNA in BALF of patients with sarcoidosis and healthy controls is reported in ref. 40, including response to reduced Th1 cells.
Here we use our model to explore the efficacy of several drugs in terms of how they reduce the radius of the granuloma.
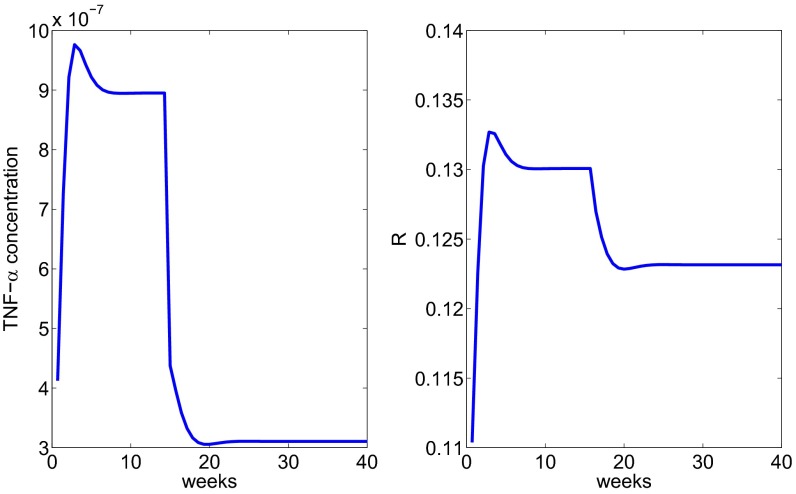
In the simulation of sarcoidosis in Fig. 3, we have taken the inflammation (in Eq. 1) to be . By day 100 the granuloma stabilized and all of the concentrations became constant. In the sequel, starting with these constant values, treatment will begin at day 100, it will be continuous, and we expect the granuloma radius to continuously decrease until it reaches some steady-state value. We begin with the anti–TNF-α drug and assume that treatment with anti–TNF-α reduces the growth rate in Eq. 8 by a factor . Fig. 4 shows how the radius decreases, reaching steady state around week 20.
Fig. 4.
The profile of the radius under anti–TNF-α treatment administered after week 15.
We proceed to use the model to explore other potential drugs: anti IL-12, anti IFN-γ, and injection of TGF-β.
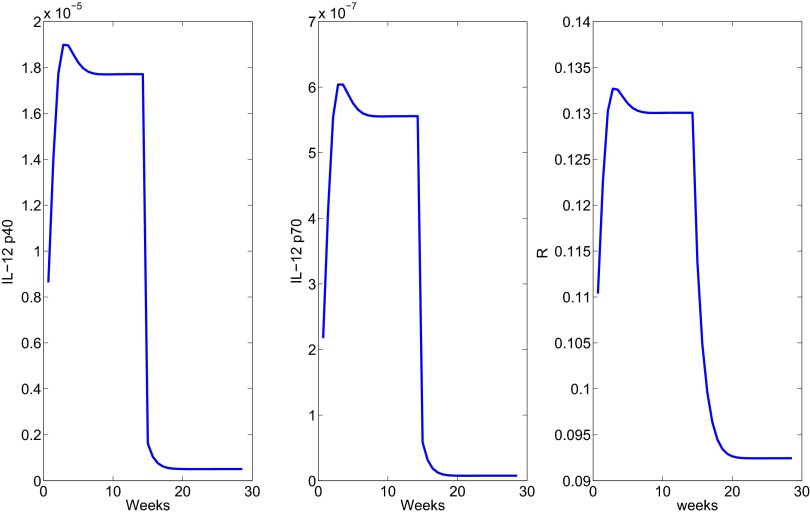
We represented the effect of anti–IL-12 by reducing by half the production rates and in Eq. 8. Fig. 5 shows a decrease in the granuloma radius. A steady state is reached after ∼20 wk.
Fig. 5.
The profile of the radius under anti–IL-12 treatment administered after week 15.
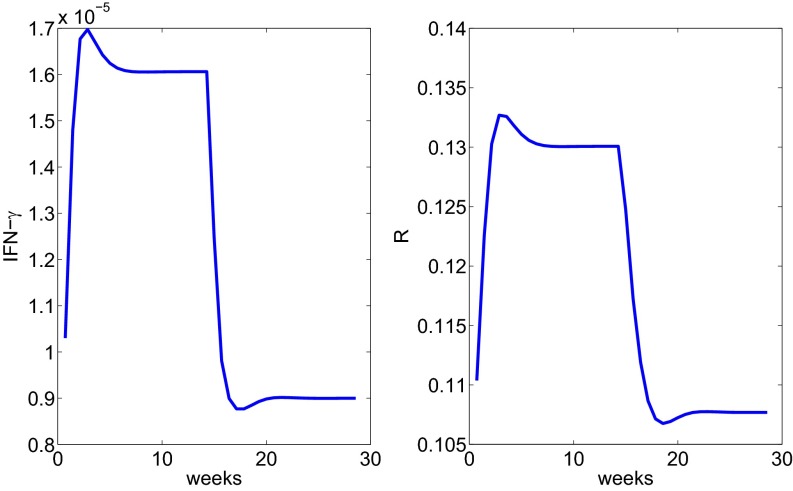
Next we consider anti–IFN-γ and represent its effect by reducing the production rates , by half in Eq. 6. Fig. 6 shows how radius changes under treatment.
Fig. 6.
The profile of the radius under anti–IFN-γ treatment administered after week 15.
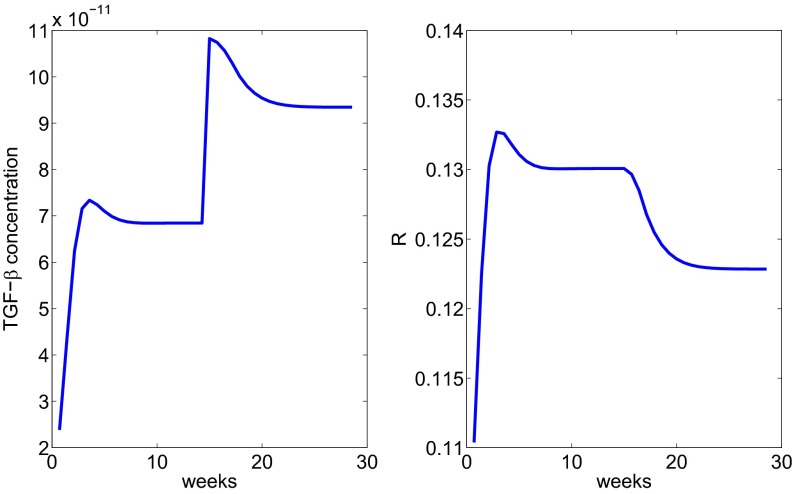
Finally we consider injection of TGF-β and represent its effect by introducing a source term ( g⋅mL−1⋅d−1) in Eq. 7. Fig. 7 shows the reduction of under TGF-β injection.
Fig. 7.
The profile of the radius under injection with TGF-β treatment administered after week 15.
We note that the steady states of in Figs. 6 and 7 are all different, and they depend on the “amount” of drug that was administered.
Discussion.
Sarcoidosis is a disease whose origin remains a mystery. Pulmonary chronic sarcoidosis is currently treated by drugs that are generally known to reduce inflammation, but not curative. Among these drugs, infliximab is perhaps the most specific, an anti–TNF-α drug. In an attempt to explore the progression of the disease, we developed in this paper a mathematical model based on patient data (22). The model is represented by a system of partial differential equations within a granuloma of varying radius . The variable quantities in the model are cells (macrophages and T cells) and cytokines. We assume that the disease is associated with initial inflammation, and we then use the model to simulate the growth/decrease of each of the variables and of the radius of the granuloma. The resulting model closely approximates the sustained multicellular, multicytokine inflammatory response (for the first 100 d) following antigen stimulation, which is characteristic of the Th1 immune response causing sarcoidosis. In particular, we have simulated the effect of infliximab on the decrease in the granuloma radius . We also explored the effect on of other potential treatments: anti IL-12, anti IFN-γ, and injection of TGF-β, which are viable therapeutic targets based upon clinical evidence implicating higher levels of IL-12 and IFN-γ (24, 41) and lower levels of TGF-β (39, 42) with chronic disease activity. Whereas no treatments directed specifically at these targets have been assessed in the clinical setting in terms of altering sarcoidosis disease burden (e.g., granuloma prevalence in the lung), the model suggests that these predicted therapeutic targets may reduce disease activity. Thus, the model could be used to predict treatment responses in the preclinical setting.
Our model of sarcoid granuloma was based on Fig. 1. A similar network can be used to describe granuloma in tuberculosis (TB), although in that case one has to consider both classically activated and alternatively activated macrophages (43). However, the source of inflammation in TB arises from the TB antigen (i.e., the Mycobacterium tuberculosis); hence some of the model parameters will have to be changed in the TB case, leading to different conclusions. Indeed, BAL measurements in pulmonary sarcoidosis and pulmonary TB show differences in the expression of cytokines (44, 45). Big differences may occur when some of the cytokines are overexpressed or underexpressed. For instance, a genetic variant associated with excessive IFN-γ production in response to TB antigens may predispose the lung to sustained granuloma formation (sarcoidosis) while protecting against TB (because it will kill the bacteria and hence limit the inflammation). On the other hand, if the genetic defect were associated with impaired IFN-γ production to the same antigenic challenge, this condition would favor the development of latent TB (inability to kill/clear the organism) but would protect against sarcoidosis (inflammation would be self-limited and would readily resolve).
The present work is a step toward a more comprehensive study of sarcoidosis and its treatment. As more data become available, the model could be further refined. It would be important to include in this refined model adverse side effects of drugs.
Methods
All of the computations used to solve the PDE system apply second-order finite difference discretization on the radial direction and a forward Euler method on the time direction.
To support the robustness of the simulation results, we ran sensitivity analysis on parameters that appear in the differential equations and in the boundary conditions; details are in SI Text.
The experimental results displayed in Fig. 3 were obtained by the following procedure: Gene expression analysis was performed on tissues obtained from patients with sarcoidosis at the time of diagnosis compared with normal lung tissue. Expression of select genes was further confirmed in lung tissue from a second series of patients with sarcoidosis and disease-free control subjects by semiquantitative RT-PCR. The expression of proteins corresponding to selected overexpressed genes was determined using fluorokine multiplex analysis, and immunohistochemistry.
Supplementary Material
Footnotes
The authors declare no conflict of interest.
This article contains supporting information online at www.pnas.org/lookup/suppl/doi:10.1073/pnas.1417789111/-/DCSupplemental.
References
- 1.Crouser ED, et al. The CD4+ lymphopenic sarcoidosis phenotype is highly responsive to anti-tumor necrosis factor-alpha therapy. Chest. 2010;137(6):1432–1435. doi: 10.1378/chest.09-2576. [DOI] [PubMed] [Google Scholar]
- 2.Mehta D, et al. Cardiac involvement in patients with sarcoidosis: Diagnostic and prognostic value of outpatient testing. Chest. 2008;133(6):1426–1435. doi: 10.1378/chest.07-2784. [DOI] [PubMed] [Google Scholar]
- 3.Patel MR, et al. Detection of myocardial damage in patients with sarcoidosis. Circulation. 2009;120(20):1969–1977. doi: 10.1161/CIRCULATIONAHA.109.851352. [DOI] [PMC free article] [PubMed] [Google Scholar]
- 4.Richie RC. Sarcoidosis: A review. J Insur Med. 2005;37(4):283–294. [PubMed] [Google Scholar]
- 5.Isler P, de Rochemonteix BG, Songeon F, Boehringer N, Nicod LP. Interleukin-12 production by human alveolar macrophages is controlled by the autocrine production of interleukin-10. Am J Respir Cell Mol Biol. 1999;20(2):270–278. doi: 10.1165/ajrcmb.20.2.3313. [DOI] [PubMed] [Google Scholar]
- 6.Fehrenbach H, et al. Alveolar macrophages are the main source for tumour necrosis factor-alpha in patients with sarcoidosis. Eur Respir J. 2003;21(3):421–428. doi: 10.1183/09031936.03.00083002. [DOI] [PubMed] [Google Scholar]
- 7.Ziegenhagen MW, et al. Sarcoidosis: TNF-alpha release from alveolar macrophages and serum level of sIL-2R are prognostic markers. Am J Respir Crit Care Med. 1997;156(5):1586–1592. doi: 10.1164/ajrccm.156.5.97-02050. [DOI] [PubMed] [Google Scholar]
- 8.Toossi Z, et al. Decreased production of TGF-beta 1 by human alveolar macrophages compared with blood monocytes. J Immunol. 1996;156(9):3461–3468. [PubMed] [Google Scholar]
- 9.Hancock A, Armstrong L, Gama R, Millar A. Production of interleukin 13 by alveolar macrophages from normal and fibrotic lung. Am J Respir Cell Mol Biol. 1998;18(1):60–65. doi: 10.1165/ajrcmb.18.1.2627. [DOI] [PubMed] [Google Scholar]
- 10.Nonaka M, et al. Synergistic induction of macrophage inflammatory protein-3α;/CCL20 production by interleukin-17A and tumor necrosis factor-α; in nasal polyp fibroblasts. World Allergy Organ J. 2009;2(10):218–223. doi: 10.1097/WOX.0b013e3181bdd219. [DOI] [PMC free article] [PubMed] [Google Scholar]
- 11.Kambouchner M, et al. Lymphatic and blood microvasculature organisation in pulmonary sarcoid granulomas. Eur Respir J. 2011;37(4):835–840. doi: 10.1183/09031936.00086410. [DOI] [PubMed] [Google Scholar]
- 12.Antoniou KM, et al. Upregulation of Th1 cytokine profile (IL-12, IL-18) in bronchoalveolar lavage fluid in patients with pulmonary sarcoidosis. J Interferon Cytokine Res. 2006;26(6):400–405. doi: 10.1089/jir.2006.26.400. [DOI] [PubMed] [Google Scholar]
- 13.Brooks DG, Walsh KB, Elsaesser H, Oldstone MB. IL-10 directly suppresses CD4 but not CD8 T cell effector and memory responses following acute viral infection. Proc Natl Acad Sci USA. 2010;107(7):3018–3023. doi: 10.1073/pnas.0914500107. [DOI] [PMC free article] [PubMed] [Google Scholar]
- 14.Iellem A, et al. Unique chemotactic response profile and specific expression of chemokine receptors CCR4 and CCR8 by CD4(+)CD25(+) regulatory T cells. J Exp Med. 2001;194(6):847–853. doi: 10.1084/jem.194.6.847. [DOI] [PMC free article] [PubMed] [Google Scholar]
- 15.Qin H, et al. TGF-beta promotes Th17 cell development through inhibition of SOCS3. J Immunol. 2009;183(1):97–105. doi: 10.4049/jimmunol.0801986. [DOI] [PMC free article] [PubMed] [Google Scholar]
- 16.Viallard JF, et al. Th1 (IL-2, interferon-gamma (IFN-gamma)) and Th2 (IL-10, IL-4) cytokine production by peripheral blood mononuclear cells (PBMC) from patients with systemic lupus erythematosus (SLE) Clin Exp Immunol. 1999;115(1):189–195. doi: 10.1046/j.1365-2249.1999.00766.x. [DOI] [PMC free article] [PubMed] [Google Scholar]
- 17.Laurence A, et al. Interleukin-2 signaling via STAT5 constrains T helper 17 cell generation. Immunity. 2007;26(3):371–381. doi: 10.1016/j.immuni.2007.02.009. [DOI] [PubMed] [Google Scholar]
- 18.Tischner D, Wiegers GJ, Fiegl H, Drach M, Villunger A. Mutual antagonism of TGF-beta and Interleukin-2 in cell survival and lineage commitment of induced regulatory T cells. Cell Death Differ. 2012;19(8):1277–1287. doi: 10.1038/cdd.2012.7. [DOI] [PMC free article] [PubMed] [Google Scholar]
- 19.Zheng SG, Wang J, Wang P, Gray JD, Horwitz DA. IL-2 is essential for TGF-beta to convert naive CD4+CD25- cells to CD25+Foxp3+ regulatory T cells and for expansion of these cells. J Immunol. 2007;178(4):2018–2027. doi: 10.4049/jimmunol.178.4.2018. [DOI] [PubMed] [Google Scholar]
- 20.Khalil N, Corne S, Whitman C, Yacyshyn H. Plasmin regulates the activation of cell-associated latent TGF-beta 1 secreted by rat alveolar macrophages after in vivo bleomycin injury. Am J Respir Cell Mol Biol. 1996;15(2):252–259. doi: 10.1165/ajrcmb.15.2.8703482. [DOI] [PubMed] [Google Scholar]
- 21.Li MO, Wan YY, Flavell RA. T cell-produced transforming growth factor-beta1 controls T cell tolerance and regulates Th1- and Th17-cell differentiation. Immunity. 2007;26(5):579–591. doi: 10.1016/j.immuni.2007.03.014. [DOI] [PubMed] [Google Scholar]
- 22.Crouser ED, et al. Gene expression profiling identifies MMP-12 and ADAMDEC1 as potential pathogenic mediators of pulmonary sarcoidosis. Am J Respir Crit Care Med. 2009;179(10):929–938. doi: 10.1164/rccm.200803-490OC. [DOI] [PMC free article] [PubMed] [Google Scholar]
- 23.Wikén M, et al. No evidence of altered alveolar macrophage polarization, but reduced expression of TLR2, in bronchoalveolar lavage cells in sarcoidosis. Respir Res. 2010;11:121. doi: 10.1186/1465-9921-11-121. [DOI] [PMC free article] [PubMed] [Google Scholar]
- 24.Robinson BW, McLemore TL, Crystal RG. Gamma interferon is spontaneously released by alveolar macrophages and lung T lymphocytes in patients with pulmonary sarcoidosis. J Clin Invest. 1985;75(5):1488–1495. doi: 10.1172/JCI111852. [DOI] [PMC free article] [PubMed] [Google Scholar]
- 25.Heidenreich S, Gong JH, Schmidt A, Nain M, Gemsa D. Macrophage activation by granulocyte/macrophage colony-stimulating factor. Priming for enhanced release of tumor necrosis factor-alpha and prostaglandin E2. J Immunol. 1989;143(4):1198–1205. [PubMed] [Google Scholar]
- 26.Pueringer RJ, Schwartz DA, Dayton CS, Gilbert SR, Hunninghake GW. The relationship between alveolar macrophage TNF, IL-1, and PGE2 release, alveolitis, and disease severity in sarcoidosis. Chest. 1993;103(3):832–838. doi: 10.1378/chest.103.3.832. [DOI] [PubMed] [Google Scholar]
- 27.Joller N, et al. Treg cells expressing the coinhibitory molecule TIGIT selectively inhibit proinflammatory Th1 and Th17 cell responses. Immunity. 2014;40(4):569–581. doi: 10.1016/j.immuni.2014.02.012. [DOI] [PMC free article] [PubMed] [Google Scholar]
- 28.Valencia X, et al. TNF downmodulates the function of human CD4+CD25hi T-regulatory cells. Blood. 2006;108(1):253–261. doi: 10.1182/blood-2005-11-4567. [DOI] [PMC free article] [PubMed] [Google Scholar]
- 29.Deenick EK, Tangye SG. Autoimmunity: IL-21: A new player in Th17-cell differentiation. Immunol Cell Biol. 2007;85(7):503–505. doi: 10.1038/sj.icb.7100114. [DOI] [PubMed] [Google Scholar]
- 30.McGovern JL, et al. Th17 cells are restrained by Treg cells via the inhibition of interleukin-6 in patients with rheumatoid arthritis responding to anti-tumor necrosis factor antibody therapy. Arthritis Rheum. 2012;64(10):3129–3138. doi: 10.1002/art.34565. [DOI] [PubMed] [Google Scholar]
- 31.Rahim SS, Khan N, Boddupalli CS, Hasnain SE, Mukhopadhyay S. Interleukin-10 (IL-10) mediated suppression of IL-12 production in RAW 264.7 cells also involves c-rel transcription factor. Immunology. 2005;114(3):313–321. doi: 10.1111/j.1365-2567.2005.02107.x. [DOI] [PMC free article] [PubMed] [Google Scholar]
- 32.Galve-de Rochemonteix B, Nicod LP, Dayer JM. Tumor necrosis factor soluble receptor 75: the principal receptor form released by human alveolar macrophages and monocytes in the presence of interferon gamma. Am J Respir Cell Mol Biol. 1996;14(3):279–287. doi: 10.1165/ajrcmb.14.3.8845179. [DOI] [PubMed] [Google Scholar]
- 33.Oliver JC, et al. Cytokine kinetics in an in vitro whole blood model following an endotoxin challenge. Lymphokine Cytokine Res. 1993;12(2):115–120. [PubMed] [Google Scholar]
- 34.Hallsworth MP, Soh CP, Lane SJ, Arm JP, Lee TH. Selective enhancement of GM-CSF, TNF-alpha, IL-1 beta and IL-8 production by monocytes and macrophages of asthmatic subjects. Eur Respir J. 1994;7(6):1096–1102. [PubMed] [Google Scholar]
- 35.Burke RR, Stone CH, Havstad S, Rybicki BA. Racial differences in sarcoidosis granuloma density. Lung. 2009;187(1):1–7. doi: 10.1007/s00408-008-9111-9. [DOI] [PMC free article] [PubMed] [Google Scholar]
- 36.Callejas-Rubio JL, López-Pérez L, Ortego-Centeno N. Tumor necrosis factor-alpha inhibitor treatment for sarcoidosis. Ther Clin Risk Manag. 2008;4(6):1305–1313. doi: 10.2147/tcrm.s967. [DOI] [PMC free article] [PubMed] [Google Scholar]
- 37.King TE, Flaherty KR, Hollingsworth H. 2014. Clinical manifestations and diagnosis of pulmonary sarcoidosis. Available at www.uptodate.com/contents/clinical-manifestations-and-diagnosis-of-pulmonary-sarcoidosis. Accessed July 25, 2014.
- 38.Baughman RP, et al. Sarcoidosis Investigators Infliximab therapy in patients with chronic sarcoidosis and pulmonary involvement. Am J Respir Crit Care Med. 2006;174(7):795–802. doi: 10.1164/rccm.200603-402OC. [DOI] [PubMed] [Google Scholar]
- 39.Zissel G, Homolka J, Schlaak J, Schlaak M, Müller-Quernheim J. Anti-inflammatory cytokine release by alveolar macrophages in pulmonary sarcoidosis. Am J Respir Crit Care Med. 1996;154(3 Pt 1):713–719. doi: 10.1164/ajrccm.154.3.8810610. [DOI] [PubMed] [Google Scholar]
- 40.Idali F, et al. Reduced Th1 response in the lungs of HLA-DRB1*0301 patients with pulmonary sarcoidosis. Eur Respir J. 2006;27(3):451–459. doi: 10.1183/09031936.06.00067105. [DOI] [PubMed] [Google Scholar]
- 41.Hata M, Sugisaki K, Miyazaki E, Kumamoto T, Tsuda T. Circulating IL-12 p40 is increased in the patients with sarcoidosis, correlation with clinical markers. Intern Med. 2007;46(17):1387–1393. doi: 10.2169/internalmedicine.46.6278. [DOI] [PubMed] [Google Scholar]
- 42.Jonth AC, et al. ACCESS Group TGF-beta 1 variants in chronic beryllium disease and sarcoidosis. J Immunol. 2007;179(6):4255–4262. doi: 10.4049/jimmunol.179.6.4255. [DOI] [PubMed] [Google Scholar]
- 43.Day J, Friedman A, Schlesinger LS. Modeling the immune rheostat of macrophages in the lung in response to infection. Proc Natl Acad Sci USA. 2009;106(27):11246–11251. doi: 10.1073/pnas.0904846106. [DOI] [PMC free article] [PubMed] [Google Scholar]
- 44.Thillai M, et al. Sarcoidosis and tuberculosis cytokine profiles: Indistinguishable in bronchoalveolar lavage but different in blood. PLoS ONE. 2012;7(7):e38083. doi: 10.1371/journal.pone.0038083. [DOI] [PMC free article] [PubMed] [Google Scholar]
- 45.Bloom CI, et al. Transcriptional blood signatures distinguish pulmonary tuberculosis, pulmonary sarcoidosis, pneumonias and lung cancers. PLoS ONE. 2013;8(8):e70630. doi: 10.1371/journal.pone.0070630. [DOI] [PMC free article] [PubMed] [Google Scholar]
Associated Data
This section collects any data citations, data availability statements, or supplementary materials included in this article.


