

Abstract
The properties of CO-inhibited Azotobacter vinelandii (Av) Mo-nitrogenase (N2ase) have been examined by the combined application of nuclear resonance vibrational spectroscopy (NRVS), extended X-ray absorption fine structure (EXAFS), and density functional theory (DFT). Dramatic changes in the NRVS are seen under high-CO conditions, especially in a 188 cm–1 mode associated with symmetric breathing of the central cage of the FeMo-cofactor. Similar changes are reproduced with the α-H195Q N2ase variant. In the frequency region above 450 cm–1, additional features are seen that are assigned to Fe-CO bending and stretching modes (confirmed by 13CO isotope shifts). The EXAFS for wild-type N2ase shows evidence for a significant cluster distortion under high-CO conditions, most dramatically in the splitting of the interaction between Mo and the shell of Fe atoms originally at 5.08 Å in the resting enzyme. A DFT model with both a terminal −CO and a partially reduced −CHO ligand bound to adjacent Fe sites is consistent with both earlier FT-IR experiments, and the present EXAFS and NRVS observations for the wild-type enzyme. Another DFT model with two terminal CO ligands on the adjacent Fe atoms yields Fe-CO bands consistent with the α-H195Q variant NRVS. The calculations also shed light on the vibrational “shake” modes of the interstitial atom inside the central cage, and their interaction with the Fe-CO modes. Implications for the CO and N2 reactivity of N2ase are discussed.
Introduction
Nitrogenase (N2ase) is the enzyme responsible for biological nitrogen fixation.1 In addition to N2 reduction to NH3, N2ase catalyzes the reduction of a variety of triply bonded substrates such as C2H2, N3–, and HCN,2 as well as reduction of protons to H2.3 It is now known that this enzyme can also produce CxHy hydrocarbons from CO4 and even CH4 from CO2.5 The highest resolution crystal structures are of the Mo-containing N2ase and these reveal a unique [Mo-7Fe-9S-Ci-homocitrate] cluster, called either the FeMo-cofactor or M center (Figure 1), at the active site of the MoFe protein component of N2ase.6 The interstitial ligand, referred to as Ci, is now known to be a carbide at the center of the prismatic 6-Fe cage.6b,7 Directed substitutions of functionalities near this FeMo-cofactor show that the homocitrate ligand and especially the side-chains of neighboring His-195,8 Gln-191, Arg-96, and Val-70 amino acids are all key features for the enzyme activity.1b The homocitrate and the first three residues may be involved in proton transport to the active site, whereas Val-70 appears to play a steric role in constraining the access and positioning of small molecule substrates.3b,9
Figure 1.

Comparison of the N2ase MoFe protein structure around the FeMo-cofactor for the wild-type enzyme (left, PDB 3U7Q(6b)) and the α-H195Q variant (right, PDB 1FP4(8)).
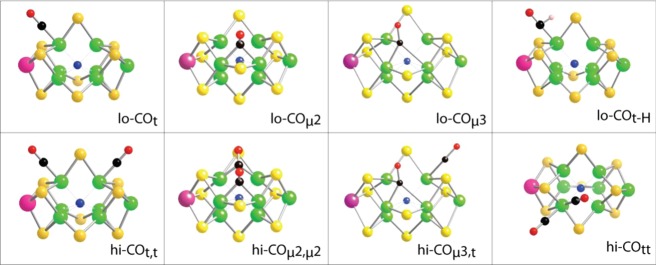
Under a CO atmosphere and turnover conditions, the N2ase resting-state S = 3/2 EPR signal originating from the FeMo-cofactor disappears, and either of two new S = 1/2 signals are induced, with their character depending primarily on the CO concentration. A rhombic lo-CO signal (g = [2.09, 1.97, 1.93]) appears under low CO partial pressure conditions (<0.08 atm CO), and an axial hi-CO signal (g = [2.17, 2.06, 2.06]) is seen under higher (≥0.5 atm CO) pressures.10 In addition, a third, S = 3/2 signal termed hi(5)-CO ([g ≅ 5]) has been reported.8,11 On the basis of the ENDOR properties of these species, structures have been proposed that involve terminal and bridging CO ligands (Figure 2).12
Figure 2.
Some proposed binding modes for CO to the N2ase FeMo-cofactor.
Stopped-flow IR9b,13 and IR-monitored photolysis14 of CO-inhibited N2ase have also identified a variety of species, some of which are distinct from those seen by EPR/ENDOR. Under high [CO] photolysis conditions, the major species all have more than one bound CO (or CO derivative).14 We labeled these photolyzable adducts Hi-1, with characteristic bands at 1973 and ∼1680 cm–1; Hi-2, with bands at 1932 and 1874 cm–1; and Hi-3, a major EPR-silent component, with coupled CO stretches at 1938 and 1911 cm–1.14b For Hi-3, our recent Density Functional Theory (DFT) modeling suggests two terminal CO ligands at the adjacent FeMo-cofactor sites Fe2 and Fe6.14b In a pair of other DFT studies,15 Dance has considered more than a dozen stable terminal and bridging CO species. Indications for a “formyl-like” Fe–CHO species in Hi-1 are consistent with the IR bands seen around 1670–1711 cm–1.14a In Figure 2 we have summarized some of the variety of candidates that have been proposed for both the lo-CO- and hi-CO-generating species.
Despite significant progress in the study of nitrogen-fixing intermediates,16 the details of the reaction mechanism for N2ase Fischer–Tropsch-like activity are almost totally lacking in spectroscopic constraints. Our understanding of N2ase reactivity and catalysis would certainly benefit from additional spectroscopic data for characterizing the structure of CO intermediates. Here we combine nuclear resonance vibrational spectroscopy (NRVS) with extended X-ray absorption fine structure (EXAFS) to probe experimentally the dynamical and structural consequences of CO binding. The NRVS measurement is a relatively new technique for N2ase studies, and it provides a spectrum that can be converted into a 57Fe partial vibrational density of states (PVDOS), similar to conventional IR and Raman spectra, but with intensity only from normal modes involving significant Fe motion along the direction of the incoming X-ray.17 In contrast, EXAFS has a long history of application to N2ase18 and other metalloproteins.19 It provides structural data (interatomic distances) around the Mo and Fe sites that complement the vibrational spectra. In addition, the experimental results are matched with candidate structures based on density functional theory (DFT) modeling. Recently, we demonstrated the power of the combined application of NRVS, EXAFS, and DFT in a study of the [4Fe-4S] cluster in the N2ase Fe protein.20 Here, we use the same methods triad to arrive at detailed proposals for the CO-bound FeMo-cofactor structures. This work concerns both the wild-type form of the enzyme as well as the α-H195Q variant. The α-H195Q variant was chosen because previous IR work has shown that a large fraction of the high-CO enzyme consists of FeMo cofactor with 2 terminal CO molecules;14b hence, it is likely to have significantly stronger Fe-CO mode intensity in the NRVS.
Results
NRVS Results
The NRVS-derived 57Fe PVDOS for both wild-type N2ase from Azotobacter vinelandii (Av) and its α-H195Q variant under resting state and “high-CO” conditions are compared in Figure 3. Since CO-inhibited N2ase usually consists of multiple species, we refer to the samples or conditions as “high-CO” if they were prepared under low-flux turnover conditions with 1 atm of CO and then concentrated under 2 atm CO. We use “low-CO” for similar preparations that were concentrated under 2 atm of Ar, which produces samples with the lo-CO EPR signal. The NRVS data contain contributions from both the 8 × Fe in the P-cluster as well as the 7 × Fe in the FeMo-cofactor. However, since under our low-flux conditions the P-cluster is presumed to be in an all-ferrous reduced state in all samples,21 we associate the observed spectral changes upon CO binding with modifications exclusively at the FeMo-cofactor.
Figure 3.
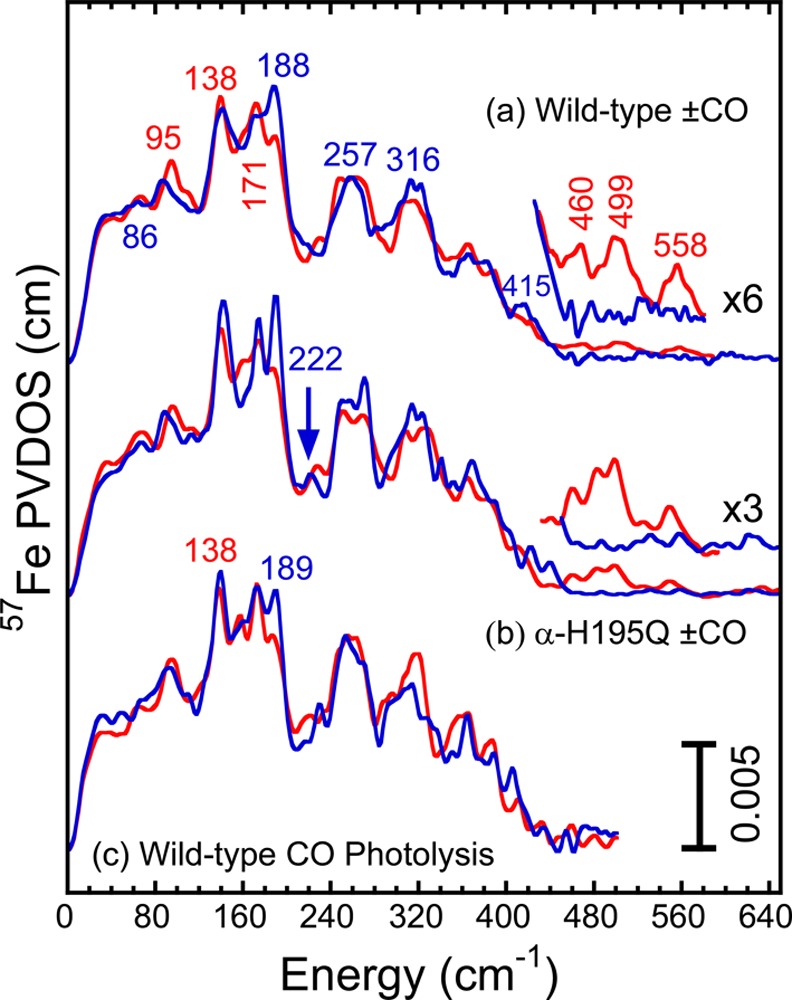
Top and middle: Comparison of the NRVS-derived 57Fe PVDOS spectra for (a) wild-type and (b) α-H195Q Av N2ase under as-isolated (blue line) and high-CO (red line) conditions. The CO data in this figure are presented as averages of 12CO and 13CO data sets to improve the overall statistics. This averaging is not expected to broaden Fe–S bands below 450 cm–1. The 12CO and 13CO data for the Fe-CO region are broken out separately in Figure 4. Bottom: (c) Comparison of NRVS for CO-inhibited wild-type Av N2ase before (red line) and after (blue line) photolysis.
Before discussing the spectra in detail, we discuss the signal-to-noise ratio for this emerging technique and how to evaluate the significance of different features. The reproducibility of Fe–S cluster breathing and stretching modes can be gauged by comparison of resting wild-type and α-H195Q N2ase spectra (Figure 3a,b), since no major differences are expected with α-His-195 → Glu substitution. Similarly, the reproducibility of the wild-type + CO PVDOS can be gauged by comparing features in top (a) and bottom (c) panels of Figure 3, since these represent independent data sets. Finally, the significance of the Fe-CO related modes in the region above 450 cm–1 can be gauged by comparison with the baselines for resting enzyme spectra in this region.
The clearest change in the PVDOS spectra for the wild-type enzyme after turnover under high-CO conditions is the diminished intensity of the global peak at ∼188 cm–1 (as seen in Figure 3). In previous studies this region has been associated with “breathing” modes of the FeMo-cofactor, which involve expansion and contraction of the [6Fe–Ci] core.22 It should be noted that this breathing mode is not present in the spectrum of the P-cluster, and can be considered a “fingerprint” of a symmetric FeMo cofactor (see Supporting Information). Other reproducible changes in the high-CO vs wild-type spectra include a gain of intensity and a 9 cm–1 blue-shift for a band around 86 cm–1 (to ∼95 cm–1), an apparent splitting of the Fe–S stretching feature near 257 cm–1, and the loss of intensity for bands near 316 and 415 cm–1. Finally, we point to the appearance of subtle but reproducible features above 450 cm–1 that are in the range expected for Fe-CO bending and stretching modes (amplified in the ×6 insert for Figure 3a).
For the most part, the NRVS data for the resting (as-isolated) and high-CO α-H195Q N2ase in Figure 3b echo those seen in the wild-type enzyme. The α-H195Q spectra are somewhat sharper, likely because the data were taken continuously in a single beamtime rather than averaged over multiple sessions. In the resting α-H195Q enzyme spectra, bands at ∼173 and ∼222 cm–1 are better resolved, while in the high-CO enzyme data there is a shoulder at 160 cm–1 that is more pronounced. Finally, with α-H195Q the features above 450 cm–1 that we associate with Fe-CO modes are about 2-fold stronger than in the wild-type (compare ×3 inset for Figure 3b vs × 6 inset for Figure 3a).
Each of the species of high-CO species of nitrogenase previously characterized by IR spectroscopy bind two CO ligands.14b It is therefore logical to ask which of the two CO ligands causes the majority of the structural changes detected by NRVS. Photolysis is known to convert the hi-CO EPR species, containing two CO ligands, into the lo-CO form, which has only one,23 and the results of such an NRVS-monitored photolysis experiment are shown in Figure 3c. Upon photolysis, we see an increase in intensity near 188 cm–1 and a loss of intensity at ∼95 cm–1, just the reverse of the differences seen between the resting and high-CO samples in Figure 3a,b. Since we know that a terminal CO is lost upon photolysis of the hi-CO species,14a it appears that addition of this second CO to the lo-CO FeMo-cofactor is the cause for a large fraction of the breathing mode changes.
We now turn to the weaker and higher frequency features in the interval between 460 and 560 cm–1, shown in more detail in Figure 4. Because only 1 or 2 out of 15 Fe atoms in the sample are expected to bind CO, we modified the data collection scan procedure to heavily weight the higher frequency region, as described in Supporting Information. Relative to the resting enzyme spectra in Figure 3a,b, it is clear that there are several high-frequency features, although weak, which are significantly above the baseline noise level. From comparison with literature frequencies,24 the new features are consistent with terminal Fe-CO stretching and/or bending modes.
Figure 4.
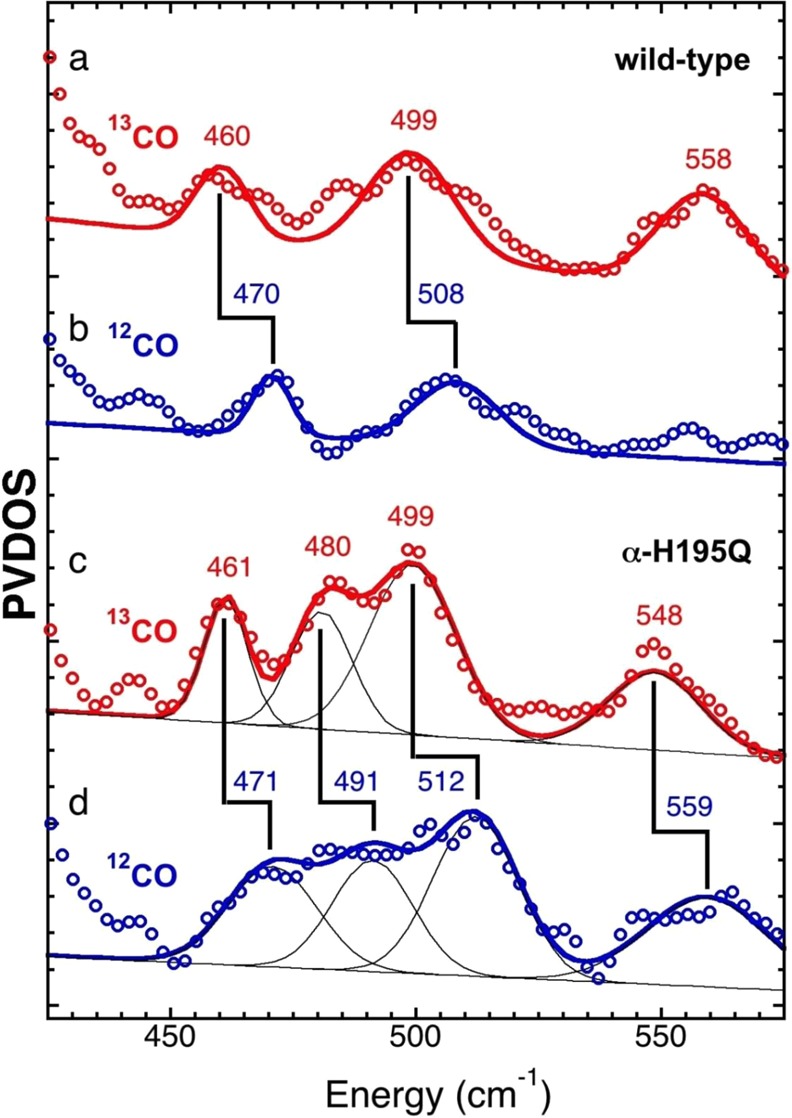
57Fe PVDOS in Fe-CO stretch/bend region under high-CO conditions. Top to bottom: (a) 13CO data (red circles) vs fit (red line) and (b) 12CO (blue circles) vs fit (blue line) for wild-type N2ase; (c) 13CO data (red circles) vs fit (red line) and (d) 12CO (blue circles) vs fit (blue line) for α-H195Q N2ase. Additional linear sloping baselines and Gaussian functions used for the α-H195Q N2ase spectra fits are shown using thin black lines. The fitted curves are not meant to capture every feature, but simply to accentuate the isotope shifts. Error bars are reported in Supporting Information, Figure S4b.
The attribution to CO-related modes is confirmed by shifts upon 12CO to 13CO substitution, as illustrated for the wild-type and α-H195Q variant in Figure 4. There are several unambiguous results that can be drawn from the comparisons in Figure 4. First, for both wild-type and the α-H195Q variant, there is a 12CO-associated band at ∼510 ± 2 cm–1, which downshifts by about 10 cm–1 with 13CO substitution. Second, in both cases there is an additional 12CO-associated band at ∼470 cm–1, which also downshifts by about 10 cm–1 with 13CO substitution. Third, the 12CO α-H195Q data exhibits intensity in the region between the above two features (around 491 cm–1), and this intensity downshifts to around 480 cm–1 for the 13CO sample. Finally, there are additional features above 540 cm–1 that deserve further investigation.
For a more quantitative assessment of these features, we manually fit these data with multiple Gaussian bands consistent with an experimental resolution of approximately 8 cm–1 and a linear sloping baseline, as shown in Figure 4 and summarized in Table 1. We note that the reproducible candidate Fe–12CO stretching bands from 471 to 512 cm–1 are at much lower frequencies than the ∼547–605 cm–1 stretching modes recently seen in [NiFe] hydrogenase (H2ase) and model compounds,25 and lower than the 528–604 cm–1 bands seen in [FeFe] H2ase.26 They instead overlap with the lower end of the 460–525 cm–1 range seen for Fe-CO stretches in heme proteins such as myoglobin (Mb)27 and cytochrome P-450.28 The approximate ∼10 cm–1 down-shifts with 13CO may be compared with the corresponding shifts of ∼3–4 cm–1 for Fe-CO stretches in MbCO27a and P-450cam-CO,28 and 8–13 cm–1 in [NiFe] H2ase.25b Finally, the higher frequency feature near 560 cm–1, clearest in the α-H195Q data, is in a region typical for Fe-CO bending in heme proteins.29 The ∼11 cm–1 downshift of this feature with 13CO is similar to the ∼15 cm–1 shifts reported for Fe-CO bends in MbCO27a or P-450cam-CO.28
Table 1. Fe-CO and CO Band Frequencies (cm–1) for High-CO N2ase from NRVS, IR, and DFT Compared to the Corresponding Vibrational Modes Reported for Other Proteins.
| sample | ν (Fe–12CO) stretch (cm–1) | δ (Fe–C–O) bend (cm–1) | ν (12C–O) stretch (cm–1) | ref. |
|---|---|---|---|---|
| wild-type 12CO | 470 | 558? | 197314a | this work |
| ∼508 | ||||
| α-H195Q 12CO | 471 | 559 | 196914a | this work |
| 491, 512 | 1911–193814a | |||
| DFT model 1 | 500 | 452 | 1970 | this work |
| DFT model 3 | 494, 548 | 442, 462 | 1896, 1925 | this work14a |
| MbCO neutral pH | 507 | 575 (559) | 1947 | (27a) |
| MbCO low pH | 488 | 551 | 1967 | (27a) |
| P-450cam-CO (no camphor) | 464 | 556 | 1963 | (28) |
| [NiFe] H2ase | 547 | 605 | 1946 | (25a) |
Empirical Simulations
In previous works we constructed an empirical force field to model the NRVS (57Fe PVDOS) for the active site FeMo-cofactor.22,30 The spectrum was obtained by subtracting the appropriate amount of a “P-cluster only” spectrum from the intact N2ase 57Fe PVDOS and rescaling the difference spectrum. Since the new resting state N2ase data for both wild-type and α-H195Q N2ase have an improved signal-to-noise ratio, we updated the previous empirical force field by simulating the new FeMo-cofactor only spectra (Figure 5). We used the same simplified FeMo-cofactor model with C3v symmetry, but with C instead of N as the interstitial atom. Overall, the refined force field parameters exhibit only moderate changes from previously published parameters (Table S1). The Fe–C stretching force constants refined to ∼0.3 mdyne Å–1, identical to the previous optimized Fe–N stretching force constants.22,30 This is nearly an order of magnitude smaller than the ∼2.8 mdyne Å–1 Fe–C stretching constant observed for carbides in low-spin Fe clusters such as [Fe4C(CO)12]2–.31 This quantifies the dramatically weaker interaction between the carbide and the 6 high-spin Fe neighbors in the [6Fe–Ci] FeMo-cofactor core.
Figure 5.
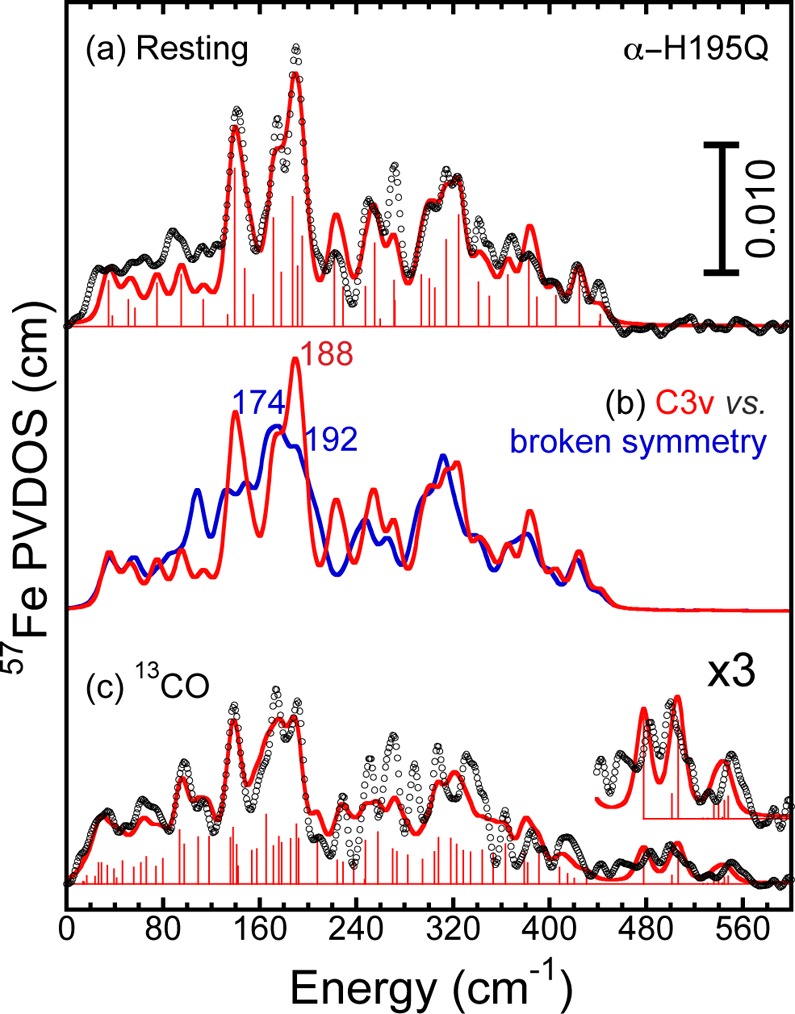
Top: 57Fe PVDOS (black line) of the FeMo-cofactor from the resting state of α-H195Q N2ase and empirical force field simulations (red line) using C3v model. Middle: simulation generated by eliminating 2 out of 6 Fe–Ci stretching force constants (blue line) overlaid with simulation of the 57Fe PVDOS from the wild-type N2ase (red line). Bottom: 57Fe PVDOS (black line) of FeMo-cofactor of α-H195Q N2ase under “high-13CO” conditions and corresponding empirical force field simulation (red line) using DFT model 3 structure.
The empirical force field helps us to interpret the NRVS changes induced by CO binding. Given the expected trans effect on the interstitial Fe–Ci bonds trans to bound CO or CHO ligands (see DFT models 1 and 3 in Figure 7), as an exercise we simply eliminated the corresponding Fe–Ci stretching force constants, while keeping the remaining force constants the same. The simulation resulting from this perturbation (Figure 5) shows a significant splitting in its strongest features, resulting in an intensity decrease at 188 cm–1 and two new peaks at 174 and 192 cm–1. The simulations thus provide a relatively simple explanation for the observed NRVS changes: a strong peak arising from a totally symmetric breathing mode is split and hence reduced by the lower symmetry concomitant with multiple ligand binding.
Figure 7.

Left: DFT-derived FeMo-cofactor structural models put forth to explain the resting state structure, model 0; the Hi-1 IR and hi-CO EPR species, model 1; and the Hi-3 IR species, model 3. The experimental FT-IR and DFT-calculated C–O stretching frequencies are given in red and blue, respectively. Right: histograms of the interatomic distances involving Fe (top) and Mo (bottom) metal sites for the DFT structures shown in the left panel. The metal–metal distances are categorized as short (s) and long (l).
For a more detailed analysis of the high-CO N2ase FeMo-cofactor NRVS, we simulate the scaled wild-type and α-H195Q difference spectra using the DFT models originally derived to explain the Hi-1 and Hi-3 IR-detected photolysis spectra (models 1 and 3 respectively, as discussed below). These DFT-based structural models (see Figure 7) are further modified such that force field parameters similar to those used in the resting-state spectrum simulations can be applied in the “high-CO” spectrum simulations. Since the effects of CO-binding are stronger and the data better for the α-H195Q NRVS, here we focus on the simulation of that spectrum. Results for the wild-type analysis are provided in Supporting Information. As shown in Figure 5, the empirical simulation using DFT model 3 structure nicely reproduces the spectral features below 240 cm–1, which involve the breathing modes most sensitive to overall cluster geometry (see Table S2 for the complete list of the force field parameters). The simulation also captures the Fe-CO modes in the region from 470 to 560 cm–1. In between these regions, there are more split bands observed in the “high-CO” FeMo-cofactor spectra, which can also be attributed to the lowered symmetry of the FeMo-cofactor caused by the binding of two terminal −CO ligands.
In summary, the empirical force field simulations for both the resting state and high-CO state FeMo-cofactor 57Fe PVDOS spectra confirm that NRVS is a sensitive probe of the FeMo-cofactor core structure. Furthermore, the interactions between the interstitial Ci and its 6 Fe neighbors, although weak, are crucial in reproducing the spectral features below 200 cm–1. The changes in low frequency breathing modes reveal that, upon −CO/–CHO binding, the FeMo-cofactor undergoes a significant structural perturbation. Fe–CO stretching and Fe–C–O bending modes are also identified in the 470 to 560 cm–1 region, providing the first mechanical proof that binding is at the Fe sites. The predicted intensities of these modes, as well as the predicted downshifts by ∼10 cm–1 upon 13CO substitution, are both consistent with the experimental data.
EXAFS Results
Whereas NRVS provides valuable information about symmetry and dynamics that can help infer the active site structure, EXAFS allows direct measurement of interatomic distances. The Mo and Fe k-space EXAFS and Fourier transforms for resting and high-CO wild-type N2ase samples are compared in Figure 6. The Mo EXAFS Fourier transform has 3 key peaks, corresponding primarily to Mo–S, Mo–Fe (short), and Mo–Fe (long) interactions at 2.36, 2.69, and 5.1 Å, respectively. For the Fe EXAFS Fourier transform data, there are key maxima corresponding to Fe–S, Fe–Fe (short), and Fe–Fe (long) interactions, at 2.3, 2.6, and 3.7 Å, respectively. The 3.7 Å feature comes from a cross-face Fe–Fe interaction in the FeMo-cofactor (Figure 6). The high-CO Mo EXAFS data has to be interpreted as arising from a mixture of species, as does the Fe EXAFS data, with the additional complication of the presence of Fe in the P-cluster. Despite these restrictions, quite a lot can be learned from the changes in the spectra on CO binding.
Figure 6.

Top: Relevant interatomic distances for FeMo-cofactor EXAFS from (A and B) the Mo and (C) Fe points of view. Lower left: Mo and Fe K-edge EXAFS Fourier transforms under as-isolated (blue line) and high-CO (red line) conditions. Lower right: k-space data (red line) and fits (blue line) under resting and high-CO conditions.
We first consider the EXAFS data for the resting enzyme, which has been examined repeatedly over the past 35 years.18a,18c,32 Using the highest resolution crystal structure as a starting point,6b we fit the data as the sum of 3 Mo–S, 3 short Mo–Fe, and 3 long Mo–Fe interactions. A modest improvement is then achieved by inclusion of 3 Mo–O/N for the homocitrate and His-442 ligands. A feature of the new analysis is an attempt to decompose the total disorder seen by EXAFS (σ2total) into separate contributions from vibrational (σ2vib) and structural (σ2static) disorder. To do this, we used the empirical force field derived from simulating the NRVS data to model the contributions of different normal modes to the vibrational disorder of Mo–Fe/S distances. We then subtracted the estimated thermal disorder from the total disorder to arrive at a best estimate of static disorder, e.g., σ2static = σ2total – σ2vib. The details of this procedure have been described previously for our analysis of the N2ase Fe protein EXAFS.20
It has been noted that the 5.1 Å Mo–Fe interaction overlaps with a Mo–Fe–Fe three-body multiple scattering pathway, as illustrated at the top of Figure 6.32 Thus, we also performed fits with inclusion of such multiple scattering pathways, as done previously by Liu and co-workers.32 The results are summarized in Table 2 and in Supporting Information (Table S3). In agreement with the previous work, we find that for the resting state, the multiple scattering Mo–Fe–Fe pathway has about 55% of the amplitude of the single scattering contribution. Remarkably, the inclusion of this contribution does not significantly affect the amplitude or distance derived from the curve-fitting procedure. This is discussed more fully in Supporting Information. As we discuss below, multiple scattering effects require a more nuanced interpretation of EXAFS changes that result from binding CO.
Table 2. Summary of the FeMo-Cofactor Metal–Metal Distances Predicted by EXAFS, X-ray Crystallography, and DFT Calculations.
| Mo–Fe-short |
Mo–Fe-long |
Fe–Fe-short |
Fe–Fe-long |
||||||||
|---|---|---|---|---|---|---|---|---|---|---|---|
| R (Å) | σs (Å)b | R (Å) | σs (Å)b | R (Å) | σtot (Å)b | R (Å) | σtot (Å)b | ||||
| resting EXAFS | 2.689 | 0.023 | 5.08 | 0.018 | 2.604 | 0.057 | 3.688 | 0.052 | |||
| crystal structure 3U7Q6b | 2.694 | 0.024 | 5.059 | 0.024 | 2.622 | 0.030 | 3.695 | 0.009 | |||
| DFT model 0a | 2.719 | 0.015 | 5.101 | 0.013 | 2.636 | 0.048 | 3.690 | 0.004 | |||
| hi-CO EXAFS | 2.706 | 0.030 | 5.10 | 0.052 | 2.602 | 0.058 | 3.691 | 0.070 | |||
| 2 × 5.10 | 4.95 | 3.76 | 3.68 | ||||||||
| DFT model 1a | 2.715 | 0.040 | 5.110 | 0.12 | 2.635 | 0.082 | 3.706 | 0.085 | |||
| 2 × 5.17 | 4.99 | 3.780 | 3.632 | ||||||||
| DFT model 3a | 2.714 | 0.061 | 5.135 | 0.11 | 2.63 | 0.10 | 3.714 | 0.12 | |||
| 2 × 5.22 | 4.98 | 3.85 | 3.65 | ||||||||
Coordinates in Supporting Information.
σ values refer to single shell fits.
Overall, the results of these analyses from the Mo point of view reveal a remarkably symmetrical cluster in the enzyme. The short Mo–Fe distances at 2.69 Å appear equal to within ±0.02 Å, as do the long Mo–Fe distances at 5.08 Å. These findings are in good agreement with the X-ray diffraction models, which have refined to progressively more symmetric structures as the resolution has improved.
For the EXAFS from the Fe point of view, we fit the data as the sum of Fe–S, short Fe–Fe, and long Fe–Fe components, constraining the number of Fe–S interactions to 3.66, the number of short Fe–Fe to 1.65, and the number of long Fe–Fe interactions to 0.8. These values are held constant for all subsequent fits. The resulting short and long Fe–Fe distances of 2.60 and 3.69 Å respectively are within 0.02 Å of the crystallographic values. Inclusion of 0.4 Fe–Ci interactions at 2.01 Å, leads to a modest improvement in the fit, as observed previously for isolated FeMoco.33 Inclusion of a recently discovered 16th Fe with partial occupancy would not have a significant difference in this analysis.34 Our model presumes that the P-cluster cross-face Fe–Fe distances are so disordered that they do not make a significant contribution to the overall signal; the 3.7 Å peak is considered a marker for the FeMo cofactor.18k Data was collected on a sample that had been turned over in the absence of CO to ensure spectral changes are due only to the presence of CO. One final note, in the Fe EXAFS there is an extraordinarily weak feature at 5.1 Å that is consistent with a Fe–Mo component.
In summary, as before,18f,18h,32 the EXAFS for the resting state enzyme agrees well with the crystal structure data, and confirms a highly symmetric structure for the core of the FeMo cofactor in the resting state. Between EXAFS and diffraction approaches, the average absolute deviation of the metal–metal distances is 0.011 Å. The estimated static disorder from EXAFS in the respective Mo–S, Mo–Feshort and Mo–Felong distances is very small, on the order of 0.02 Å, as detailed in Table 2.
We then approach fitting the Mo EXAFS data for the “high-CO” enzyme with the same structural framework and the same constraints on coordination numbers, allowing for additional disorder solely by varying σ2 in the Debye–Waller factor. As seen in the Fourier transform, there is a modest weakening of the short Mo–Fe peak, but the largest fractional change in the data is for the long Mo–Fe interaction. Fitting this with a single MoFe component shows a lengthening in the average distance of 0.02 Å and a predicted increase of 0.03 Å in total disorder (σ). Using a split-shell model for the long Mo–Fe interaction yields a significantly better fit, and reveals one short and two long Mo–Fe distances at 4.95 and 5.10 Å, respectively, just above the 0.10 Å resolution for the current range of data.
Turning to the high-CO EXAFS data from the Fe point of view, we again see a modest dampening of the short Fe–Fe feature, and the largest apparent fractional change is in the long, FeMo cofactor-only Fe–Fe component (Figure 6). This interaction fits to a single component at 3.69 Å with a 0.05 Å increase in static disorder compared to the enzyme without CO bound.
K-edge XANES data for both Mo and Fe show no significant change between resting/turnover, and CO-inhibited samples. This is to be expected since substrate does not bind directly to Mo, and any change in the Fe edge would be diluted by a factor of at least eight due to the presence of other unperturbed Fe atoms in the sample.
In summary, all of the spectra, including the 57Fe NRVS and both the Mo and Fe EXAFS, indicate that a structural change has occurred in the central Fe6S9Ci core of the FeMo-cofactor for the high-CO samples. Given the rigidity and symmetry of the cofactor without CO bound, this is a significant observation.
DFT Results
To interpret the spectral changes that result from CO binding, we seek guidance from DFT calculations for different candidate structures. The relevant details on the FeMo-cofactor oxidation level and spin coupling are given as part of Supporting Information. The structural models computed can help explain the vibrational frequencies and interatomic distances observed by NRVS and EXAFS respectively. We examined a large number of candidates, but only the most successful models are shown in Figure 7 (left), while the coordinates are provided in Supporting Information. The interatomic distance distributions involving the Fe/Mo metal sites are also given in Figure 7 (right) and in Table 2.
Since the resting state FeMo-cofactor structure is well-defined, we first compare the DFT predictions for this form of the cofactor with EXAFS and X-ray diffraction results, as a gauge for the accuracy and systematic errors that one might expect. As summarized in Table 2, in the calculated structure, which we call model 0, we find that the average Mo–Fe and Fe–Fe distances for the resting state are all calculated to better than 0.03 Å of the EXAFS and crystallographic values, with average deviations of better than 0.02 Å.
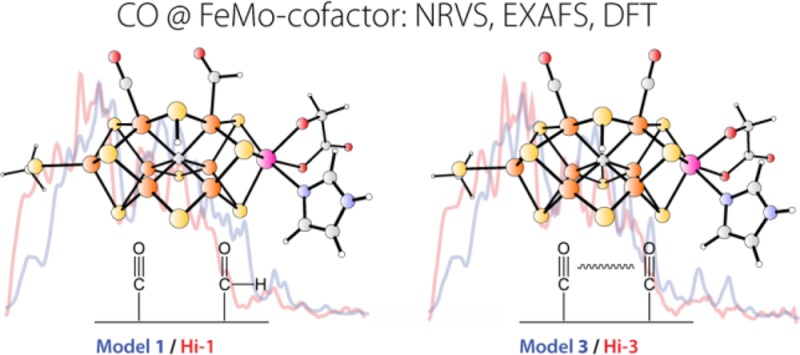
As explained in the Introduction, the Hi-1, Hi-2, and Hi-3 CO-bound FeMo-cofactor species are essentially CO-frequency signatures characterized using FT-IR.14a We refer to our DFT-calculated structural models that explain these Hi-1, Hi-2, and Hi-3 signatures respectively as model 1, model 2, and model 3. Model 2, which also helps explain results for the hi(5)-CO EPR signal, will be discussed in a separate publication. We now turn to model 1, our favored DFT model for the primary species in wild-type high-CO samples.
Model 1 is a structure that we propose to be responsible for both the hi-CO EPR signal and the Hi-1 FT-IR signature. The proposed structure involves a formyl −CHO group on Fe6 and a terminal CO ligand on Fe2. The DFT predictions yield predicted CO and —HC=O stretches at 1970 and 1727 cm–1 respectively, which reproduce the bands observed in IR-monitored photolysis at 1973 and 1680 cm–1 reasonably well (see Figure 7 and Figure S6 in Supporting Information). Model 1 predicts a slight contraction for the short Mo–Fe distance, from 2.70 to 2.68 Å, and an elongation and splitting of the more distant Mo–Fe interactions, with 1 Mo–Fe at 4.94 Å and the other 2 Mo–Fe averaging to 5.13 Å. This is also in agreement with the EXAFS analysis, which predicted a splitting of the long Mo–Fe distances. Similarly, in the Fe EXAFS Fourier transform, the reduced long Fe–Fe peak intensity is explained by model 1 with its wider range of Fe–Fe distances, from 3.58 to 3.78 Å. Although this model predicts no significant change in the average long Fe–Fe distance, there is a significant increase in disorder with σstat increasing from 0.013 to 0.070 Å. Interpretation of features in this region is complicated by overlap with Fe–S distances in the same range, so little can be said apart from the fact that increased disorder is consistent with the EXAFS results.
For the EPR-silent Hi-3 species, we earlier proposed a structural model with two terminal CO ligands on the adjacent sites Fe2 and Fe614b (see also Figure 7). The DFT model 3 for Hi-3 reproduces well the absolute and relative positions of the 1938 and 1911 cm–1 C–O frequencies observed experimentally as well as the vibrational coupling between these two oscillators (see also the KED diagrams in Figure S6 in Supporting Information). Model 3 yields an even more disordered structure than model 1, but at this time we do not have EXAFS data on an appropriate sample for testing this prediction.
Our DFT models of the resting state FeMo-cofactor and the CO-bound Hi-1/Hi-3 species can also be used to rationalize vibrational frequencies seen by NRVS. To facilitate comparison with the experiment, in Figure 8 we show NRVS data processed to subtract the P-cluster contribution. First of all, the peak at 183 cm–1 predicted by DFT for the resting state is diminished in the 57Fe PVDOS for models 1 and 3. For model 1, the overall peak is now at 174 cm–1, and extra intensity appears at 98 cm–1. Similarly, for model 3, the overall peak is at 172 cm–1 and there is extra intensity at 98 cm–1. These predictions nicely match the experimental data showing loss of intensity at 188 cm–1 and increases at 95 and 171−173 cm–1 upon CO binding.
Figure 8.

Left: Overall comparison of the N2ase NRVS spectra to the DFT 57Fe PVDOS simulation for (a) the resting state vs model 0, (b) “high-12CO” wild-type vs model 1, and (c) “high-13CO” α H195Q vs model 3. Right: N2ase resting state (black) and 12CO (blue)/13CO (red) inhibited state NRVS spectra from experiment and 57Fe PVDOS from DFT in the 400–700 cm–1 range: (b) the α-H195Q variant NRVS from the experiment; (a) and (c) the 57Fe PVDOS for the DFT models 0, 1, and 3. The stick-style spectra are given for models 1 and 3 in (a) and (c), respectively.
The above results show that, particularly for the resting state FeMo-cofactor, the spectral shape of the ∼100–300 cm–1 range of the NRVS is governed by the cumulative vibrational kinetic energy distributions (KEDs) stored in the six Fe–Ci bonds of the central cage (which we abbreviate to “[6Fe–Ci] KED”), see Figure S8. The high-intensity peaks between 160 and 190 cm–1 are strongly emphasized for the [6Fe–Ci] KED and represent the “breathing” modes. A visualization of the 183 cm–1 breathing mode from the resting state cofactor DFT model is also available as part of Supporting Information.
A related and interesting result is that, even for the resting state, there are weak modes in the 400–700 cm–1 region where one might look for Fe-CO bands (see Figure 8 right, (a) and (c)). The origin of these features is clarified by recalculating the normal modes with the 13C isotope for the interstitial Ci atom (see the [6Fe–Ci] KED analysis in Figure S7). The Ci atom isotope exchange is predicted to downshift these [6Fe–Ci] modes by up to 23 cm–1, indicating a significant component of interstitial carbide motion. These normal modes are similar to the “shake” modes seen around 800 cm–1 for interstitial carbides in low-spin metal clusters such as [Fe6C(CO)16]2–.35 For the N2ase FeMo-cofactor, the shake modes are at ∼200 cm–1 lower frequencies because of the weaker bonding to the high-spin Fe, in line with the Fe–Ci force constants analysis using the empirical simulations described above. Notably, the highest frequency shake modes calculated at 584, 595, and 652 cm–1 (respectively for models 0, 1, and 3; see Figure 8 right and Figure S7) all display the Ci motion approximately along the central axis of the FeMo-cofactor (which passes through Fe1, Ci, and Mo). A visualization of the 584 cm–1 shake mode from DFT model 0 is available in Supporting Information. As seen in Figure 8 right, the highest frequency shake modes in model 1 and model 3 do not shift on substitution of 12CO by 13CO. However, the lower frequency shake modes, which represent the Ci motion approximately normal to the cofactor symmetry axis, may mix with the Fe-CO modes. This is reflected by slight (<3 cm–1) downshift of the calculated 57Fe PVDOS peak at 587 (model 3) cm–1 on ligand isotope exchange, see Figure 8 right, (c).
The strongest Fe–12CO stretching mode (the corresponding Fe–13CO mode frequencies are given in parentheses) in the 57Fe PVDOS predicted using model 1 is a band at 500 (495) cm–1 associated with the Fe2-CO motion (Figure 8 right (a) and S6). This compares favorably with the ∼470 cm–1 feature seen in the wild-type N2ase high-CO NRVS experiment. For model 1 there is another band predicted at 399 (396) cm–1 associated with the Fe6-CHO motion (Figure S6), but this is too close to the Fe–S region to be unambiguously resolved by the experiment. In contrast, model 3 predicts an Fe2-CO stretch at 494 (489) cm–1 and Fe6-CO stretch at 548 (541) cm–1 (Figure 8 right (c) and S6). The former is closest to α-H195Q NRVS features near 491–512 cm–1, while the latter aligns well with the band at 559 (548) cm–1.
At this point, it might seem that there are more CO-related bands in the NRVS data than can be accounted for by the DFT calculations. Some of these likely result from the limited statistics of the current experiment. There might also be additional species not accounted for. The important point is that the major features are calculated at 494, 500, 518, and 548 cm–1 for DFT models 1 and 3, and these positions agree well with the experimental data.
Discussion
The current experimental results from NRVS and EXAFS spectroscopies, combined with DFT calculations, all help to characterize the structural changes associated with CO binding to the nitrogenase FeMo cofactor. The key observation is the significant distortion of the central 6Fe core from its nearly D3h symmetry in the resting state. This symmetry reduction is reflected in the loss of intensity in the NRVS 188 cm–1 band, together with reduced amplitude for the 5.1 Å Mo–Fe and 3.7 Å Fe–Fe EXAFS features. Both results are qualitatively consistent with lowered symmetry for the FeMo-cofactor upon binding a pair of CO molecules. These experimental results are supported by the distorted structures obtained from DFT calculations.
The DFT candidate structure for the hi-CO species in wild-type enzyme (model 1) involves terminal Fe2-CO and Fe6–CHO ligands on adjacent Fe atoms. This structure is consistent with the Hi-1 FT-IR species previously observed in photolysis experiments.14a It also agrees well with the current NRVS and EXAFS findings. Model 1 exhibits a slightly expanded [6Fe–Ci] cage with Fe–Ci distances ranging from 1.95 to 2.06 Å, and it provides a testable model for the primary species in the CO-inhibited wild-type enzyme. Not surprisingly, the longest Fe–Ci bonds are trans to the −CO and −CHO ligands. The DFT-computed NRVS predicts an Fe-CO stretching band at 500 cm–1, reasonably close to the observed feature at 470 cm–1. (The relatively low frequencies of the Fe-CO bands suggest that the strength of Fe-CO bonding in N2ase is more like that in myoglobin than in, say, [FeFe ] or [NiFe] H2ases.) The proposed Hi-1 model has a spread in the long Mo–Fe and Fe–Fe distances that is consistent with the diminished intensity of the 5.1 Mo–Fe and 3.7 Å Fe–Fe EXAFS features.
The other DFT candidate structure (model 3) involves terminal CO ligands on the adjacent Fe2 and Fe6 sites. This structure is consistent with the Hi-3 FT-IR species previously observed in photolysis experiments,14b and it appears to be a major component in the sample formed by turnover of the α-H195Q N2ase mutant under CO. Multiple CO coordination in model 3 is consistent with the stronger NRVS features in the Fe-CO region for α-H195Q N2ase compared to wild-type enzyme. In addition, the proposed structure for model 3 is even more distorted than that for model 1. It has Fe–Ci bonds ranging from 1.92 to 2.12 Å. Two of the long Mo–Fe distances increase to 5.22 Å, while the third shortened to 4.98 Å.
All of our data and calculations are consistent with the notion that the N2ase FeMo-cofactor has a flexible cage with multiple binding sites. Modest changes in the FeMo-cofactor interatomic distances have been reported before,18h,18j but not to the extent observed in the current case of multiple CO binding. For the 1e–-reduced species, a slight (and counterintuitive) contraction of the cage was indicated by a shortening of the long Fe–Fe distance in the EXAFS, from 3.74 to 3.72 Å.18h,18j This proposal was later supported by DFT calculations,36 one of which suggested that a contraction would occur if electron transfer was accompanied by protonation of a bridging sulfide.36a Overall contraction of the cage also found support from the Mo point of view because, with the same 1e–-reduced species, a modest 2.74 to 2.65 Å shortening of the short Mo–Fe distance was observed.18h,18j However, for the Klebsiella pneumoniae N2ase, Eady and co-workers found no evidence for such a change.37 Therefore, given the marginal statistics in the earlier reports,18h,18j the issue of structural changes upon 1-electron reduction of the FeMo cofactor should probably be revisited.
In the case of propargyl alcohol binding to the FeMo-cofactor, a splitting of the long 3.7 Å Fe–Fe distance induced by substrate binding at Fe6, into a pair of interactions at 3.70 and 3.98 Å was previously proposed.18j This is consistent with one of the DFT models, which suggested moderate 0.3-Å elongation of the Fe6–Ci distance when allyl alcohol is bound to the FeMo-cofactor in the Fe6-η2(C=C) configuration.38 However, in that case, there was no significant change in the Mo–Fe interaction at 5.1 Å.
At the moment, there seems to be little agreement on the role of the interstitial atom within the FeMo-cofactor. Hinnemann and Nørskov have argued that its presence makes the FeMo-cofactor “much less flexible”, thus lowering the binding strength of substrates or products (and making a better catalyst).39 Ribbe and co-workers also suggest that the interstitial carbide (Ci) stabilizes the structure of the FeMo cofactor by providing a certain rigidity to the metal–sulfur core through symmetrical coordination of this atom to the six core Fe atoms; they also concluded that the interstitial carbide does not exchange during substrate turnover.40
On the other hand, some theoretical studies predict a role for the interstitial carbide in cluster rearrangement. Blöchl and co-workers have proposed that reduction of the FeMo-cofactor results in loss of a bridging μ2-S by conversion to a terminal −SH.41 Across a range of different N2ase intermediates, they found that the “central ligand changes its coordination from 6-fold to 5-fold to 4-fold,” and proposed that the role of the central ligand is to form “a variable number of bonds with the Fe sites of the central cage”, thus facilitating cluster rearrangements. Huniar, Alrichs, and Coucouvanis proposed even more extreme redox-induced distortions of the cofactor with a labile interstitial atom that allowed N2 and related substrates to enter the central cage.42
Cluster rearrangement upon redox and/or ligand binding (particularly CO binding) is common in Fe–S clusters. For synthetic [2Fe-2S] clusters with bound CO, Felton and co-workers have noted the “inherent fluxionality” of the [2Fe-2S] core upon reduction.43 Similar flexibility has recently been proposed in biological clusters such as the 2FeH subsite in [FeFe] H2ase.44 In larger synthetic [4Fe-4S] clusters, extreme reduction also results in dramatic structural changes.45 In a protein environment, addition of a second electron to the [4Fe-4S] cluster of the N2ase Fe protein to create the all-ferrous species also results in a quite dramatic splitting (by ∼0.2 Å) of the Fe–Fe distances.20,46 A related redox-dependent structural shift occurs in the [4Fe-3S] proximal cluster of the O2-tolerant membrane-bound [NiFe] H2ase.47 Moreover, rearrangement of the CO dehydrogenase C-cluster occurs on CO binding.48 Finally, the [8Fe-9S] N2ase P-cluster provides another example in which a redox change by 2 electrons causes a profound conformational change.49 In summary, Fe–S clusters of all sizes are inherently fluxional upon redox activity, and this tendency is even more pronounced with CO ligation. Thus, the FeMo cofactor conformational changes that are proposed herein for the multi-CO-ligated species of N2ase are consistent with known chemistry. By analogy, similar changes might well be anticipated upon binding of N2.
Dance has frequently remarked on the “plasticity” of the FeMo-cofactor and the potential relevance of “coordinative allosterism”, through which CO-binding at two different cluster locations mutually influence one another.15a,50 In his calculations, the presence of the interstitial atom serves to modulate the chemical properties of the central cage and, in particular, those of Fe2 and Fe6. Our NRVS photolysis experiment shows that addition or loss of the second CO has a major effect on the breathing modes of the central cage, in support of the allosterism proposal.
The notion that FeMo-cofactor plasticity is relevant is supported by recent work in the Peters group. They have developed a series of isostructural Fe complexes with Si, B, and C ligands ligand trans to N2.51 They find that the catalytic competence of these systems for N2 reduction correlates with the flexibility of the axial linkage. Given the accumulating evidence for FeMo-cofactor plasticity, perhaps the interstitial carbide serves a similar role.
The proposed conformational changes almost certainly have a role in catalysis for both nitrogen fixation and Fischer–Tropsch (FT) chemistry. If addition of a second ligand at an adjacent Fe atom breaks an Fe–Ci bond at one or more other Fe atoms, these Fe atoms become effectively 3-coordinate and hence more reactive. In agreement with this suggestion, we have previously observed that addition of a second CO molecule to the Lo-1 IR species converts it to the Hi-1 IR species and shifts the CO-related IR band at 1715 cm–1 to 1680 cm–1,14a indicating a more “activated” form of the ligand, suggested to be a formyl −CHO species here, that would be primed for reduction. Moreover, these results indicate that the binding of the second CO, rather than a redox process, is a major trigger of the conformational change required for the catalytic activity, which may also be reflected in the S = 1/2 EPR signal elicited under CO during turnover.10,11 Here, binding of the second CO, which occurs even under low electron-flux conditions, produces a change in the EPR signal suggestive of FeMo-cofactor flexibility. Furthermore, if the catalytic formation of C3-products from CO reflects increased reactivity, then the studies of Yang et al.4c also provide support. They found that a decrease in CO pressure from ∼1 to ∼0.1 atm resulted in not only less total products, but a significantly lower C3-to-C2 products ratio, whereas a decrease in the electron flux under 1 atm CO did not impact the C3-to-C2 product distribution significantly.
What is the mechanism of CO conversion into short-chain hydrocarbons? What structures are important? Currently, there are no definitive answers to these questions because our knowledge concerning CO-reduction intermediates on N2ase is still at a primitive stage. We know that, for industrial FT processes, there are two competing hypotheses concerning the key reaction steps that lead to chain growth.52 In one scheme, an initial CO bond cleavage is followed by chain growth, which occurs by addition of CHx species.53 In an alternative mechanism, chain growth occurs by CO insertion into the bond between a metal atom and its bound alkyl ligand.54
For N2ase, Dance15b favors formation of a bridging CH2 intermediate followed by CO insertion occurring mainly on a single Fe atom, whereas the mechanism sketched by Seefeldt and co-workers4c implies reduction of two CO molecules on adjacent Fe atoms, followed by CxHy addition to a growing chain. There are little data to support or refute either proposal. Understanding the first steps of CO reduction with both Mo- and V–N2ase is key to understanding the overall reaction.
As noted by Dance50b and others, such conformational effects should also be relevant to the N2 chemistry of N2ase. If an FeMo-cofactor with multiple hydrides, such as the proposed Janus intermediate,16 occurs at the E4 redox level, then such a structure will have disrupted Fe–Ci bonding and be quite distorted from the resting state. In Dance’s calculations, hydride or H2 structures have Fe–Ci distances from 2.6 to 3 Å, indicating completely broken bonds. Subsequent addition of N2 and loss of H2 will clearly result in conformational changes. Of course, getting experimental verification of such changes will be quite a challenge.
Acknowledgments
We thank Saeed Kamali for assistance early on with NRVS data collection at SPring-8. The experiments at SPring-8 were performed at BL09XU with the approval of JASRI (Proposal No. 2009A0015-2013B0103), and at BL19LXU with the approval of RIKEN (Proposal No. 20120107 and 20130022). V.P. thanks Sven de Marothy for the XYZviewer program. This work was funded by NIH grant GM-65440 (S.P.C.), NSF grant CHE 1308384 (S.P.C.), the DOE Office of Biological and Environmental Research (S.P.C.), and the Deutsche Forschungsgemeinschaft (DFG) via the “Unifying Concepts in Catalysis” (UniCat) Excellence Cluster (V.P.).
Supporting Information Available
Details on the experimental procedures, empirical normal-mode calculations, DFT calculations, coordinates of the DFT-optimized molecular systems, visualizations of the normal modes from DFT as animated GIF files. This material is available free of charge via the Internet at http://pubs.acs.org.
Author Contributions
# A.D.S. and V.P. contributed equally to this work.
The authors declare no competing financial interest.
Funding Statement
National Institutes of Health, United States
Supplementary Material
References
- a Hoffman B. M.; Dean D. R.; Seefeldt L. C. Acc. Chem. Res. 2009, 42, 609–619. [DOI] [PMC free article] [PubMed] [Google Scholar]; b Seefeldt L. C.; Hoffman B. M.; Dean D. R. Annu. Rev. Biochem. 2009, 78, 701–722. [DOI] [PMC free article] [PubMed] [Google Scholar]; c Canfield D. E.; Glazer A. N.; Falkowski P. G. Science 2010, 330, 192–196. [DOI] [PubMed] [Google Scholar]
- Burgess B. K.; Lowe D. J. Chem. Rev. 1996, 96, 2983–3011. [DOI] [PubMed] [Google Scholar]
- a Masukawa H.; Inoue K.; Sakurai H.; Wolk C. P.; Hausinger R. P. Appl. Environ. Microbiol. 2010, 76, 6741–6750. [DOI] [PMC free article] [PubMed] [Google Scholar]; b Venters R. A.; Nelson M. J.; McLean P. A.; True A. E.; Levy M. A.; Hoffman B. M.; Orme-Johnson W. H. J. Am. Chem. Soc. 1986, 108, 3487–3498. [Google Scholar]
- a Lee C. C.; Hu Y.; Ribbe M. W. Science 2010, 329, 642. [DOI] [PMC free article] [PubMed] [Google Scholar]; b Lee C. C.; Hu Y. L.; Ribbe M. W. Angew. Chem. 2011, 50, 5545–5547. [DOI] [PubMed] [Google Scholar]; c Yang Z.-Y.; Dean D. R.; Seefeldt L. C. J. Biol. Chem. 2011, 286, 19417–19421. [DOI] [PMC free article] [PubMed] [Google Scholar]
- a Yang Z.-Y.; Moure V. R.; Dean D. R.; Seefeldt L. C. Proc. Nat. Acad. Sci. U. S. A. 2012, 109, 19644–19648. [DOI] [PMC free article] [PubMed] [Google Scholar]; b Seefeldt L. C.; Yang Z.-Y.; Duval S.; Dean D. R. Biochim. Biophys. Acta 2013, 1827, 1102–1111. [DOI] [PMC free article] [PubMed] [Google Scholar]
- a Einsle O.; Tezcan F. A.; Andrade S. L. A.; Schmid B.; Yoshida M.; Howard J. B.; Rees D. C. Science 2002, 297, 1696–1700. [DOI] [PubMed] [Google Scholar]; b Spatzal T.; Aksoyoglu M.; Zhang L.; Andrade S. L. A.; Schleicher E.; Weber S.; Rees D. C.; Einsle O. Science 2011, 334, 940. [DOI] [PMC free article] [PubMed] [Google Scholar]
- a Lancaster K. M.; Roemelt M.; Ettenhuber P.; Hu Y. L.; Ribbe M. W.; Neese F.; Bergmann U.; DeBeer S. Science 2011, 334, 974–977. [DOI] [PMC free article] [PubMed] [Google Scholar]; b Wiig J. A.; Hu Y.; Lee C. C.; Ribbe M. W. Science 2012, 337, 1672–1675. [DOI] [PMC free article] [PubMed] [Google Scholar]
- Sørlie M.; Christiansen J.; Lemon B. J.; Peters J. W.; Dean D. R.; Hales B. J. Biochemistry 2001, 40, 1540–1549. [DOI] [PubMed] [Google Scholar]
- a Sarma R.; Barney B. M.; Keable S.; Dean D. R.; Seefeldt L. C.; Peters J. W. J. Inorg. Biochem. 2010, 104, 385–389. [DOI] [PMC free article] [PubMed] [Google Scholar]; b Yang Z.-Y.; Seefeldt L. C.; Dean D. R.; Cramer S. P.; George S. J. Angew. Chem. 2011, 123, 286–289. [DOI] [PMC free article] [PubMed] [Google Scholar]
- Davis L. C.; Henzl M. T.; Burris R. H.; Orme-Johnson W. H. Biochemistry 1979, 18, 4860–4869. [DOI] [PubMed] [Google Scholar]
- Cameron L. M.; Hales B. J. Biochemistry 1998, 37, 9449–9456. [DOI] [PubMed] [Google Scholar]
- a Pollock R. C.; Lee H. I.; Cameron L. M.; Derose V. J.; Hales B. J.; Orme-Johnson W. H.; Hoffman B. M. J. Am. Chem. Soc. 1995, 117, 8686–8687. [Google Scholar]; b Christie P. D.; Lee H. I.; Cameron L. M.; Hales B. J.; Orme-Johnson W. H.; Hoffman B. M. J. Am. Chem. Soc. 1996, 118, 8707–8709. [Google Scholar]; c Lee H.-I.; Cameron L. M.; Hales B. J.; Hoffman B. M. J. Am. Chem. Soc. 1997, 119, 10121–10126. [Google Scholar]
- George S. J.; Ashby G. A.; Wharton C. W.; Thorneley R. N. F. J. Am. Chem. Soc. 1997, 119, 6450 –6451. [Google Scholar]
- a Yan L.; Dapper C. H.; George S. J.; Wang H.-X.; Mitra D.; Dong W.-B.; Newton W. E.; Cramer S. P. Eur. J. Inorg. Chem. 2011, 2011, 2064–2074. [DOI] [PMC free article] [PubMed] [Google Scholar]; b Yan L.; Pelmenschikov V.; Dapper C. H.; Scott A. D.; Newton W. E.; Cramer S. P. Chem.—Eur. J. 2012, 18, 16349–16357. [DOI] [PMC free article] [PubMed] [Google Scholar]
- a Dance I. Dalton Trans. 2011, 40, 6480–6489. [DOI] [PubMed] [Google Scholar]; b Dance I. Dalton Trans. 2011, 40, 5516–5527. [DOI] [PubMed] [Google Scholar]
- Hoffman B. M.; Lukoyanov D.; Dean D. R.; Seefeldt L. C. Acc. Chem. Res. 2013, 46, 587–595. [DOI] [PMC free article] [PubMed] [Google Scholar]
- a Sturhahn W. J. Phys.: Condens. Matter 2004, 16, S497–S530. [Google Scholar]; b Scheidt W. R.; Durbin S. M.; Sage J. T. J. Inorg. Biochem. 2005, 99, 60–71. [DOI] [PubMed] [Google Scholar]; c Petrenko T.; Sturhahn W.; Neese F. Hyperfine Interact. 2007, 175, 165–174. [Google Scholar]; d Leu B. M.; Zgierski M. Z.; Wyllie G. R. A.; Scheidt W. R.; Sturhahn W.; Alp E. E.; Durbin S. M.; Sage J. T. J. Am. Chem. Soc. 2004, 126, 4211–4227. [DOI] [PMC free article] [PubMed] [Google Scholar]
- a Cramer S. P.; Hodgson K. O.; Gillum W. O.; Mortenson L. E. J. Am. Chem. Soc. 1978, 100, 3398–3407. [Google Scholar]; b Cramer S. P.; Gillum W. O.; Hodgson K. O.; Mortenson L. E.; Stiefel E. I.; Chisnell J. R.; Brill W. J.; Shah V. K. J. Am. Chem. Soc. 1978, 100, 3814–3819. [Google Scholar]; c Cramer S. P.; Flank A. M.; Weininger M.; Mortenson L. E. J. Am. Chem. Soc. 1986, 108, 1049–1055. [Google Scholar]; d Eidsness M. K.; Flank A. M.; Smith B. E.; Flood A. C.; Garner C. D.; Cramer S. P. J. Am. Chem. Soc. 1986, 108, 2746–2747. [Google Scholar]; e George G. N.; Coyle C. L.; Hales B. J.; Cramer S. P. J. Am. Chem. Soc. 1988, 110, 4057–4059. [Google Scholar]; f Chen J.; Christiansen J.; Campobasso N.; Bolin J. T.; Tittsworth R. C.; Hales B. J.; Rehr J. J.; Cramer S. P. Angew. Chem. 1993, 32, 1592–1594. [Google Scholar]; g Chen J.; Christiansen J.; Tittsworth R. C.; Hales B. J.; George S. J.; Coucouvanis D.; Cramer S. P. J. Am. Chem. Soc. 1993, 115, 5509–5515. [Google Scholar]; h Christiansen J.; Tittsworth R. C.; Hales B. J.; Cramer S. P. J. Am. Chem. Soc. 1995, 117, 10017–10024. [Google Scholar]; i Krahn E.; Weiss B. J. R.; Kröckel M.; Groppe J.; Hekel G.; Cramer S. P.; Trautwein A. X.; Schneider K.; Müller A. J. Biol. Inorg. Chem. 2002, 7, 37–45. [DOI] [PubMed] [Google Scholar]; j George S. J.; Barney B. M.; Mitra D.; Igarashi R. Y.; Guo Y.; Dean D. R.; Cramer S. P.; Seefeldt L. C. J. Inorg. Biochem. 2012, 112, 85–92. [DOI] [PMC free article] [PubMed] [Google Scholar]; k Corbett M. C.; Hu Y.; Fay A. W.; Ribbe M. W.; Hedman B.; Hodgson K. O. Proc. Natl. Acad. Sci. U. S. A. 2006, 103, 1238–1243. [DOI] [PMC free article] [PubMed] [Google Scholar]; l Fay A. W.; Blank M. A.; Lee C. C.; Hu Y. L.; Hodgson K. O.; Hedman B.; Ribbe M. W. J. Am. Chem. Soc. 2010, 132, 12612–12618. [DOI] [PMC free article] [PubMed] [Google Scholar]; m Arber J. M.; Dobson B. R.; Eady R. R.; Stevens P.; Hasnain S. S.; Garner C. D.; Smith B. E. Nature 1987, 325, 372–374. [Google Scholar]; n Harvey I.; Strange R. W.; Schneider R.; Gormal C. A.; Garner C. D.; Hasnain S. S.; Richards R. L.; Smith B. E. Inorg. Chim. Acta 1998, 276, 150–158. [Google Scholar]; o Strange R. W.; Eady R. R.; Lawson D.; Hasnain S. S. J. Synchrotron Radiat. 2003, 10, 71–75. [DOI] [PubMed] [Google Scholar]
- a Ascone I.; Strange R. J. Synchrotron Radiat. 2009, 16, 413–421. [DOI] [PubMed] [Google Scholar]; b Best S. P.; Cheah M. H. Radiat. Phys. Chem. 2010, 79, 185–194. [Google Scholar]; c Shafaat H. S.; Rudiger O.; Ogata H.; Lubitz W. Biochim. Biophys. Acta 2013, 1827, 986–1002. [DOI] [PubMed] [Google Scholar]
- Mitra D.; George S. J.; Guo Y.; Kamali S.; Keable S.; Peters J. W.; Pelmenschikov V.; Case D. A.; Cramer S. P. J. Am. Chem. Soc. 2013, 135, 2530–2543. [DOI] [PMC free article] [PubMed] [Google Scholar]
- Fisher K.; Lowe D. J.; Tavares P.; Pereira A. S.; Huynh B. H.; Edmondson D.; Newton W. E. J. Inorg. Biochem. 2007, 101, 1649–1656. [DOI] [PubMed] [Google Scholar]
- a Xiao Y.; Fisher K.; Smith M. C.; Newton W.; Case D. A.; George S. J.; Wang H.; Sturhahn W.; Alp E. E.; Zhao J.; Yoda Y.; Cramer S. P. J. Am. Chem. Soc. 2006, 128, 7608–7612. [DOI] [PMC free article] [PubMed] [Google Scholar]; b Delfino I.; Cerullo G.; Cannistraro S.; Manzoni C.; Polli D.; Dapper C.; Newton W. E.; Guo Y.; Cramer S. P. Angew. Chem., Int. Ed. 2010, 49, 3912–3915. [DOI] [PMC free article] [PubMed] [Google Scholar]
- Maskos Z.; Hales B. J. J. Inorg. Biochem. 2003, 93, 11–17. [DOI] [PubMed] [Google Scholar]
- Spiro T. G.; Soldatova A. V.; Balakrishnan G. Coord. Chem. Rev. 2013, 257, 511–527. [DOI] [PMC free article] [PubMed] [Google Scholar]
- a Kamali S.; Wang H.; Mitra D.; Ogata H.; Lubitz W.; Manor B. C.; Rauchfuss T. B.; Byrne D.; Bonnefoy V.; Jenney F. E. Jr.; Adams M. W. W.; Yoda Y.; Alp E.; Zhao J.; Cramer S. P. Angew. Chem., Int. Ed. 2013, 52, 724 –728. [DOI] [PMC free article] [PubMed] [Google Scholar]; b Siebert E.; Horch M.; Rippers Y.; Fritsch J.; Frielingsdorf S.; Lenz O.; Escobar F. V.; Siebert F.; Paasche L.; Kuhlmann U.; Lendzian F.; Mroginski M. A.; Zebger I.; Hildebrandt P. Angew. Chem., Int. Ed. 2013, 52, 5162–5165. [DOI] [PubMed] [Google Scholar]
- Kuchenreuther J. M.; Guo Y.; Wang H.; Myers W. K.; George S. J.; Boyke C. A.; Yoda Y.; Alp E. E.; Zhao J.; Britt R. D.; Swartz J. R.; Cramer S. P. Biochemistry 2013, 52, 818–826. [DOI] [PMC free article] [PubMed] [Google Scholar]
- a Ramsden J.; Spiro T. G. Biochemistry 1989, 28, 3125–3128. [DOI] [PubMed] [Google Scholar]; b Sage J. T.; Morikis D.; Champion P. M. Biochemistry 1991, 30, 1227–1237. [DOI] [PubMed] [Google Scholar]
- Uno T.; Nishimura Y.; Makino R.; Iizuka T.; Ishimura Y.; Tsuboi M. J. Biol. Chem. 1985, 260, 2023–2026. [PubMed] [Google Scholar]
- Spiro T. G.; Wasbotten I. H. J. Inorg. Biochem. 2005, 99, 34–44. [DOI] [PubMed] [Google Scholar]
- Guo Y.; Brecht E.; Aznavour K.; Nix J.; Xiao Y.; Wang H.; George S.; Bau R.; Keable S.; Peters J.; Adams M. W.; J F. Jr; Sturhahn W.; Alp E.; Zhao J.; Yoda Y.; Cramer S. Hyperfine Interact. 2012, 1–14. [DOI] [PMC free article] [PubMed] [Google Scholar]
- Stanghellini P. L.; Sailor M. J.; Kuznesof P.; Whitmire K. H.; Hriljac J. A.; Kolis J. W.; Zheng Y.; Shriver D. F. Inorg. Chem. 1987, 26, 2950–2954. [Google Scholar]
- Liu H. I.; Filipponi A.; Gavini N.; Burgess B. K.; Hedman B.; DiCicco A.; Natoli C. R.; Hodgson K. O. J. Am. Chem. Soc. 1994, 116, 2418–2423. [Google Scholar]
- George S. J.; Igarashi R. Y.; Xiao Y.; Hernandez J. A.; Demuez M.; Zhao D.; Yoda Y.; Ludden P. W.; Rubio L. M.; Cramer S. P. J. Am. Chem. Soc. 2008, 130, 5673–5680. [DOI] [PMC free article] [PubMed] [Google Scholar]
- Weber K.; Krämer T.; Shafaat H. S.; Weyhermüller T.; Bill E.; van Gastel M.; Neese F.; Lubitz W. J. Am. Chem. Soc. 2012, 134, 20745–20755. [DOI] [PubMed] [Google Scholar]
- Stanghellini P. L.; Rossetti R. Comments Inorg. Chem. 1990, 9, 263–303. [Google Scholar]
- a Kästner J.Biological Nitrogen Fixation – Simulation of the Reaction Mechanism of Nitrogenase from First Principles. Ph.D. Dissertation, Technischen Universität Clausthal, Clausthal, Germany, 2004. [Google Scholar]; b Vrajmasu V. V.; Bominaar E. L.; Münck E. Inorg. Chem. 2003, 42, 5974–5988. [DOI] [PubMed] [Google Scholar]
- Eady R. R.; Smith B. E.; Abraham Z. H. L.; Dodd F. E.; Grossmann J. G.; Murphy L. M.; Strange R. W.; Hasnain S. S. J. Phys. (Paris) 1997, 7, 611–614. [Google Scholar]
- Pelmenschikov V.; Case D. A.; Noodleman L. Inorg. Chem. 2008, 47, 6162–6172. [DOI] [PMC free article] [PubMed] [Google Scholar]
- Hinnemann B.; Nørskov J. K. Top. Catal. 2006, 37, 55–69. [Google Scholar]
- Wiig J. A.; Lee C. C.; Hu Y.; Ribbe M. W. J. Am. Chem. Soc. 2013, 135, 4982–4983. [DOI] [PMC free article] [PubMed] [Google Scholar]
- a Kästner J.; Blochl P. E. ChemPhysChem 2005, 6, 1724–1726. [DOI] [PubMed] [Google Scholar]; b Kästner J.; Hemmen S.; Blöchl P. E. J. Chem. Phys. 2005, 123, 074306. [DOI] [PubMed] [Google Scholar]
- Huniar U.; Ahlrichs R.; Coucouvanis D. J. Am. Chem. Soc. 2004, 126, 2588–2601. [DOI] [PubMed] [Google Scholar]
- Felton G. A. N.; Petro B. J.; Glass R. S.; Lichtenberger D. L.; Evans D. H. J. Am. Chem. Soc. 2009, 131, 11290–11291. [DOI] [PubMed] [Google Scholar]
- Mulder D. W.; Ratzloff M. W.; Shepard E. M.; Byer A. S.; Noone S. M.; Peters J. W.; Broderick J. B.; King P. W. J. Am. Chem. Soc. 2013, 135, 6921–6929. [DOI] [PubMed] [Google Scholar]
- a Scott T. A.; Berlinguette C. P.; Holm R. H.; Zhou H. C. Proc. Natl. Acad. Sci. U. S. A. 2005, 102, 9741–9744. [DOI] [PMC free article] [PubMed] [Google Scholar]; b Deng L.; Holm R. H. J. Am. Chem. Soc. 2008, 130, 9878–9886. [DOI] [PMC free article] [PubMed] [Google Scholar]
- Strop P.; Takahara P. M.; Chiu H.-J.; Angove H. C.; Burgess B. K.; Rees D. C. Biochemistry 2001, 40, 651–656. [DOI] [PubMed] [Google Scholar]
- a Fritsch J.; Scheerer P.; Frielingsdorf S.; Kroschinsky S.; Friedrich B.; Lenz O.; Spahn C. M. T. Nature 2011, 479, 249–252. [DOI] [PubMed] [Google Scholar]; b Shomura Y.; Yoon K.-S.; Nishihara H.; Higuchi Y. Nature 2011, 479, 253–256. [DOI] [PubMed] [Google Scholar]; c Pelmenschikov V.; Kaupp M. J. Am. Chem. Soc. 2013, 135, 11809–11823. [DOI] [PubMed] [Google Scholar]
- a Gong W.; Hao B.; Wei Z.; Ferguson D. J. Jr.; Tallant T.; Krzycki J. A.; Chan M. K. Proc. Natl. Acad. Sci. U. S. A. 2008, 105, 9558–9563. [DOI] [PMC free article] [PubMed] [Google Scholar]; b Kung Y.; Doukov T. I.; Seravalli J.; Ragsdale S. W.; Drennan C. L. Biochemistry 2009, 48, 7432–7440. [DOI] [PMC free article] [PubMed] [Google Scholar]; c Jeoung J. H.; Dobbek H. J. Biol. Inorg. Chem. 2012, 17, 167–173. [DOI] [PubMed] [Google Scholar]; d Ragsdale S. W.; Yi L.; Bender G.; Gupta N.; Kung Y.; Yan L. F.; Stich T. A.; Doukov T.; Leichert L.; Jenkins P. M.; Bianchetti C. M.; George S. J.; Cramer S. P.; Britt R. D.; Jakob U.; Martens J. R.; Phillips G. N.; Drennan C. L. Biochem. Soc. Trans. 2012, 40, 501–507. [DOI] [PMC free article] [PubMed] [Google Scholar]
- Peters J. W.; Stowell M. H. B.; Soltis S. M.; Finnegan M. G.; Johnson M. K.; Rees D. C. Biochemistry 1997, 36, 1181–1187. [DOI] [PubMed] [Google Scholar]
- a Dance I. J. Am. Chem. Soc. 2005, 127, 10925–10942. [DOI] [PubMed] [Google Scholar]; b Dance I. J. Am. Chem. Soc. 2007, 129, 1076–1088. [DOI] [PubMed] [Google Scholar]; c Dance I. Dalton Trans. 2012, 41, 4859–4865. [DOI] [PubMed] [Google Scholar]
- a Moret M. E.; Peters J. C. Angew. Chem., Int. Ed. 2011, 50, 2063–2067. [DOI] [PMC free article] [PubMed] [Google Scholar]; b Creutz S. E.; Peters J. C. J. Am. Chem. Soc. 2014, 136, 1105–1115. [DOI] [PMC free article] [PubMed] [Google Scholar]
- van Santen R. A.; Ciobica I. M.; van Steen E.; Ghouri M. M. Adv. Catal. 2011, 54, 127–187. [Google Scholar]
- Biloen P.; Sachtler W. M. H. Adv. Catal. 1981, 30, 165–216. [Google Scholar]
- Pichler H.; Schulz H. Chem. Eng. Technol. 1970, 42, 1162–1174. [Google Scholar]
Associated Data
This section collects any data citations, data availability statements, or supplementary materials included in this article.