

Abstract
Recent studies on cerebrospinal fluid (CSF) homeostasis emphasize the importance of water flux through the pericapillary (Virchow–Robin) space for both CSF production and reabsorption (Oreskovic and Klarica hypothesis), and challenge the classic CSF circulation theory, which proposes that CSF is primarily produced by the choroid plexus and reabsorbed by the arachnoid villi. Active suppression of aquaporin-1 (AQP-1) expression within brain capillaries and preservation of AQP-1 within the choroid plexus together with pericapillary water regulation by AQP-4 provide a unique opportunity for testing this recent hypothesis. We investigated water flux into three representative regions of the brain, namely, the cortex, basal ganglia, and third ventricle using a newly developed water molecular MRI technique based on JJ vicinal coupling between 17O and adjacent protons and water molecule proton exchanges (JJVCPE imaging) in AQP-1 and AQP-4 knockout mice in vivo. The results clearly indicate that water influx into the CSF is regulated by AQP-4, and not by AQP-1, strongly supporting the Oreskovic and Klarica hypothesis.
Keywords: AQP-1, AQP-4, aquaporin, cerebrospinal fluid, Virchow–Robin space
Introduction
Cerebrospinal fluid (CSF) occupies the subarachnoid spaces and ventricular system of the brain. The classic model of CSF homeostasis calls for the circulation theory, where the majority of CSF is thought to be produced by the choroid plexus and circulates from the ventricles into the subarachnoid spaces. The arachnoid villi of the dural sinuses are believed to be the main drainage of CSF into the venous system. Recently, however, this classic model of CSF circulation has come under challenge. It is now proposed that CSF is produced and absorbed throughout the entire CSF system, and the pericapillary (Virchow–Robin) space plays a critical role in the filtration and reabsorption of water volume (Oreskovic and Klarica hypothesis) 1.
The aquaporin (AQP) family is a large collection of integral membrane proteins that enable the movement of water across biological membranes. Thus far, seven AQP isoforms have been identified in the mammalian central nervous system (CNS) by reverse transcription PCR. However, only three isoforms, namely AQP-1, AQP-4, and AQP-9, have been identified in mammals in vivo. AQP-4 represents the most abundant isoform, the distribution of which is uniquely restricted to the subpial and perivascular endfeet of astrocytes 2,3. In contrast to the body, expression of AQP-1 within the CNS capillaries is actively suppressed. AQP-1, however, is expressed in the choroid plexus epithelium 4,5. AQP-9 is only scarcely expressed in the CNS 3.
Active suppression of AQP-1 expression within brain capillaries is believed to be essential for proper maintenance of the blood–brain barrier, preventing excessive movement of water across capillary walls. AQP-4 on perivascular endfeet of astrocytes, structures that connect the intracellular space and pericapillary space of astrocytes, has been shown to be responsible for dynamic changes in water volume of the pericapillary space associated with neural activities 2,6. Furthermore, AQP-4-deficient mice have been shown to have an increased extracellular space 7. Therefore, water volume of the pericapillary space is likely to be regulated by AQP-4, rather than by AQP-1. If water movement within the pericapillary space were critical for CSF volume homeostasis, as stated in the Oreskovic and Klarica hypothesis, AQP-4, rather than AQP-1, would be expected to play a significant role in maintaining CSF volume. Accordingly, we tested this hypothesis using 17O-labeled water and JJ vicinal coupling proton exchange (JJVCPE) MRI in AQP-1 and AQP-4 knockout (KO) mice.
Materials and methods
AQP-KO mouse preparation
The study was carried out in accordance with the animal research guidelines of the Internal Review Board of University of Niigata. Preparation of AQP-4-deficient mice was detailed previously 8. Similarly, AQP-1-deficient mice were produced by homologous recombination using an embryonic stem (ES) cell line from the C57BL/6 strain as follows. We first isolated a genomic fragment carrying exons 0–4 of the AQP-1 gene from C57BL/6 mouse genomic DNA. The 34-bp loxP sequence with 26-bp linker sequence was inserted into the site 210 bp upstream of exon 2. A 1.8 kb DNA fragment, which carried the 34 bp loxP sequence and Pgk-1 promoter-driven neomycin phosphotransferase gene (neo) flanked by two Flp recognition target (frt) sites was then inserted into the site 190 bp downstream of exon 3. The targeting vector ptvAQP-1-flox contained exon 2–3 of the AQP-1 gene flanked by loxP sequences 7.7 kb upstream and 2.0 kb downstream genomic sequences, and 4.3 kb pMC1DTpA 9. ES cells were cultured on mitomycin C-treated neomycin-resistant fibroblasts in Dulbecco’s modified Eagle’s medium (high glucose; Invitrogen, Carlsbad, California, USA) supplemented with 17.7% ES-cell qualified fetal calf serum (Invitrogen), 88.4 μM nonessential amino acids (Invitrogen), 884 μM sodium pyruvate (Sigma, St Louis, Missouri, USA), 88.4 μM 2-mercaptoethanol (Sigma), and 884 U/ml murine leukemia inhibitory factor, ESGRO (Chemicon International, Temecula, California, USA). Linearized ptvAQP-1-flox was electroporated into ES cells, and G-418 (175 μg/ml)-resistant clones were picked up. Recombinant clones were identified by Southern blot hybridization analysis. Recombinant ES cells were injected into eight-cell stage embryos of the CD-1 mouse strain. The embryos were cultured to blastocysts and transferred to the uterus of pseudopregnant CD-1 mice. The resulting chimeric mice were mated to C57BL/6 mice, and offspring (AQP-1+/flox) were further crossed with TLCN-Cre mice to yield heterozygous (AQP-1+/−) mice. Homozygous AQP-1-KO mice were obtained by crossing heterozygous pairs. AQP-1-KO, AQP-4-KO, and wild-type (WT) mice were phenotypically ionized indistinguishable from each other (Fig. 1).
Fig. 1.
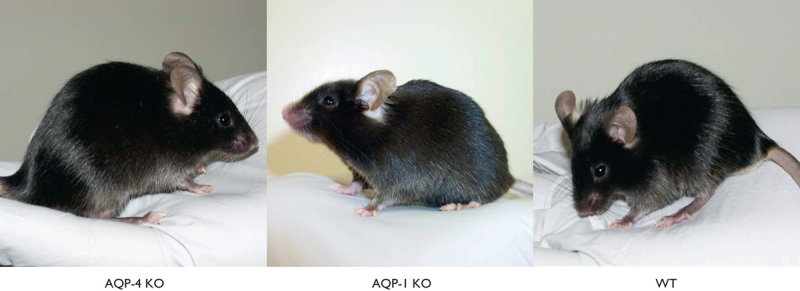
Phenotypic appearance. Wild-type (WT) and knockout (KO) mice were virtually indistinguishable phenotypically.
JJVCPE MRI
Concept
17O and an adjacent proton will exhibit JJ vicinal coupling. In water, the protons of the water molecule and proton of the dissolved molecule exchange freely amongst each other. Accordingly, appropriately designed 17O-labeled molecules can alter the apparent T2 of water molecules under nuclear magnetic resonance experiments. Using T2-weighted imaging, this effect can be developed into imaging, that is, capable of quantifying the contents of the target molecules, akin to radioactive tracer imaging such as PET. This imaging technique is referred to here as JJVCPE imaging 10.
Signal intensity change, δS, of the voxel with 17O-labeled substrate can be given by
 |
where S0 is original signal intensity, TE is the echo time, T2 is the spin–spin relaxation time, ρ is the relative concentration of 17O-labeled substrate, τ is the proton exchange rate, and J 17O-1H scalar coupling constant 11. Although it is difficult to obtain the absolute concentration of the 17O-labeled target molecule with this imaging method, it is nevertheless possible to obtain dynamic data for a target molecule in space and time.
Animal preparation
KO mice and WT mice (both sexes, 8–12 weeks old, n=6 for each KO and WT), breathing spontaneously and anesthetized with an intraperitoneal administration of urethane (1.2 g/kg), were positioned on their backs in a custom made Plexiglas stereotaxic holder. Their head was fixed in position by ear and tooth bars. Rectal temperature was maintained at 37±0.5°C using a custom designed temperature control system. Oxygen saturation (SpO2) was monitored throughout the MR study using a pulse oxymeter Mouse Ox (STARR Life Sciences Co., Oakmont, Pennsylvania, USA) with probe placement on the left thigh. Data from animals showing SpO2 of less than 93% at any point in the experiment was discarded. Normal saline (0.2 ml) containing 20% of H217O was administered as an intravenous bolus injection at the 75th phase (10 min after the first scan) using an automatic injector at 0.04 ml/s through PE10 tubing inserted into the right femoral vein.
Imaging parameters
MRI experiments were performed on a 15-cm bore 7-T horizontal magnet (Magnex Scientific, Abingdon, UK) with a Varian Unity-INOVA-300 system (Varian Inc., Palo Alto, California, USA) equipped with an actively shielded gradient. A custom made one turn surface coil, 20 mm outer diameter, was used for RF transmission. Adiabatic double spin-echo prepared rapid acquisition with refocused echoes was utilized with the following parameter settings: single slice (2 mm thick), 128×128 matrix image of 20×20 mm field of view, TR 2000 ms, Echo Train 32, TE for first echo 8.8 ms, echo spacing 5 ms, effective TE 84.8 ms (Fig. 2). Imaging slabs were set 6 mm caudal from the top of the cerebrum (Fig. 3). A total of 525 phases (scan time 70 min) were obtained at 8-s intervals.
Fig. 2.
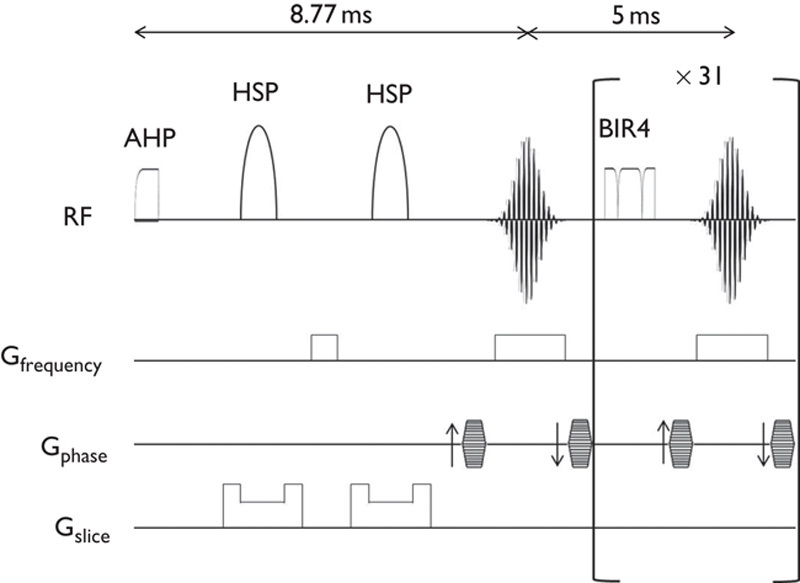
Schematic diagram of pulse sequences. Pulse sequence consists of double spin-echo with hyperbolic secant pulse (HSP) followed by 31 consecutive refocusing pulses using B1 insensitive refocusing (BIR4) pulses. AHP, adiabatic half passage pulse.
Fig. 3.
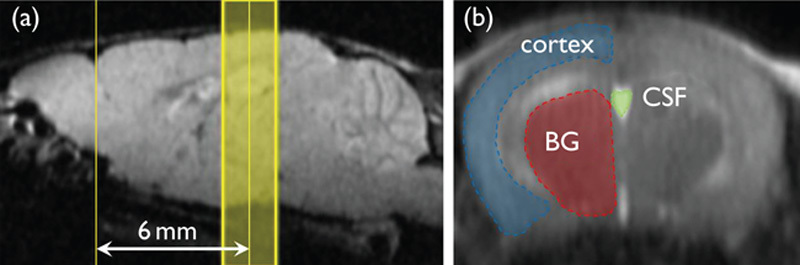
Region of interest (ROI). (a) Sagittal scout image: Imaging slab was set to 6 mm caudal from the top of the cerebrum. (b) Fast spin-echo image: ROIs were selected semi-automatically using image processing software. BG, basal ganglia; CSF, cerebrospinal fluid.
Data analysis
Images were analyzed by image processing software (MRVision Co., Winchester, Massachusetts, USA). Averaged % intensities, which reflect relative influx of H217O in three areas, namely the cortex, basal ganglia, and third ventricle, were plotted against time. Intensities at the steady state of each area, expressed as % against the averaged intensity of identical pixel before administration of H217O, were determined by fitting their time course by the function (Fig. 4)
Fig. 4.
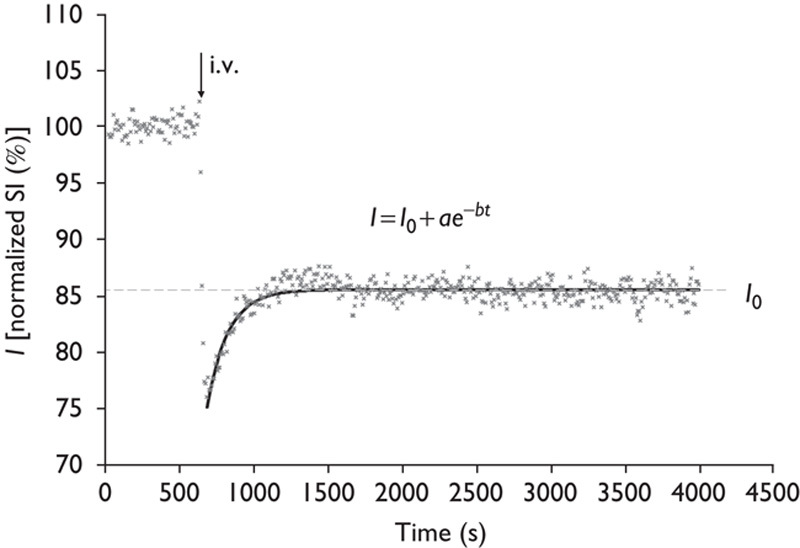
Decay curve fitting. Intensities at the steady state of each area, expressed as % against the averaged intensity of identical pixel before administration of H217O, were determined by fitting their time course by the function: I=I0+ae−bt. I0 denotes the normalized signal intensity (SI) at infinite time (t=∞) calculated from the fitted curve. i.v., intravenously.
Subsequently, numerical data were subjected to student t-test for group analysis. P less than 0.05 was regarded as statistically significant. All data are shown as mean±SD.
Results
Time course of signal intensity changes after intravenous injection of 20% of H217O for cortex (blue), basal ganglia (red), and third ventricle (green) in a representative AQP-1-KO, AQP-4-KO, and WT mouse are shown in Fig. 5. It is noted that water penetrated into the brain very rapidly and the concentration of H217O plateaued within 20 min. In WT, penetration and subsequent steady concentration of H217O is significantly higher within the third ventricle compared with brain parenchyma (cortex and basal ganglia). The behavior of water molecules in AQP-1-KO mice was virtually identical to that of WT mice. In contrast, penetration and steady concentration of H217O in the third ventricle is significantly reduced in AQP-4-KO mice. Group analysis statistically confirmed these findings (Fig. 6).
Fig. 5.
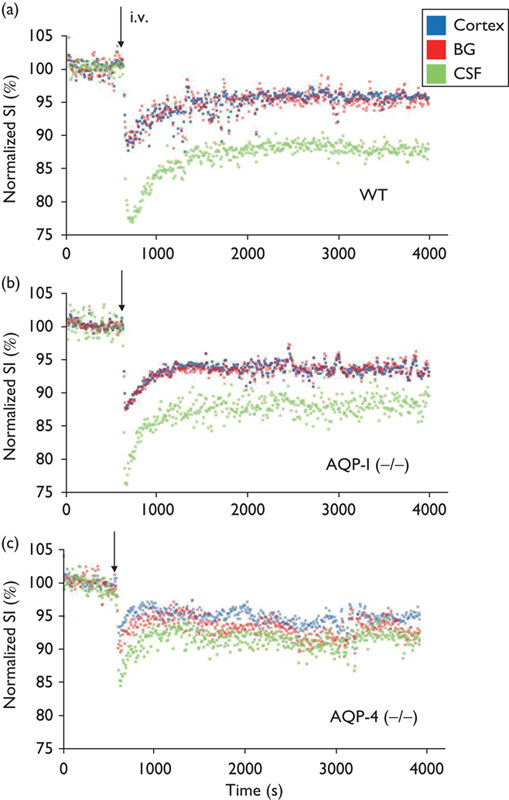
Representative time course. Representative time course of signal intensities (SIs) within pixels of each region of interest (ROI) shown in Fig. 3 following intravenous (i.v.) H217O administration in WT (a), AQP-1-KO (b), and AQP-4-KO (c) mice. AQP-1 (−/−), AQP-1-KO mouse; AQP-4 (−/−), AQP-4-KO mouse; KO, knockout; WT, wild-type. Blue, cortex; red, basal ganglia (BG); green, cerebrospinal fluid (CSF) within the third ventricle. Each dot represents the intensity of each pixel within the ROI.
Fig. 6.

I0 of three regions of interest. Values of I0 in the cortex and basal ganglia (BG) are virtually identical among the three groups. In contrast, I0 of cerebrospinal fluid (CSF) within the third ventricle is significantly higher in AQP-4-KO mice compared with AQP-1-KO and WT mice. I0 of CSF within the third ventricle in AQP-1-KO mice is virtually identical to WT mice. *P<0.01 vs. WT, §P<0.01 vs. AQP-1 (−/−). AQP-1 (−/−), AQP-1-KO; AQP-4 (−/−), AQP-4-KO mice; KO, knockout; WT, wild-type.
Discussion
The current study demonstrated that AQP-4, not AQP-1, plays a critical role in production of CSF. The findings strongly support the Oreskovic and Klarica hypothesis that water movement within the pericapillary spaces, rather than choroid plexus and arachnoid villi, is essential for CSF volume homeostasis. Previous studies have demonstrated that AQP-1 expression in the brain is virtually restricted to choroid plexus epithelium 4,5, and pericapillary water movement in the brain is regulated by AQP-4, not by AQP-1 2,3. In the current study, AQP-1-KO mice water showed movement virtually identical to WT mice, whereas AQP-4-KO mice demonstrated a significant reduction in water influx into the CSF space. It is plausible to conclude, therefore, that water movement from the general circulation into the brain has two different routes, one of which is critical for CSF homeostasis and dependent on the presence of AQP-4.
The classic view that projections of the arachnoid membrane into the cranial venous sinuses represent the primary CSF absorption sites seems incompatible with many clinical and experimental observations. There is increasing evidence suggesting that extracranial lymphatic vessels play a main role in CSF drainage from the brain. However, there are no conventional lymphatics within the brain. Nevertheless, physiological studies have long indicated that CSF circulation is the brain’s equivalent of lymphatics 12. CSF carries solutes from brain parenchyma along pericapillary spaces. Tracers injected into gray matter drain out of the brain along basement membranes in the walls of capillaries and arteries 13. Drainage of antigens from the brain by this route may play a significant role in the immune response in virus infections, experimental autoimmune encephalomyelitis and multiple sclerosis 14. This route is also believed to be critical for proper amyloid clearance 13,14. It appears that serious consideration of the role CSF dynamics with respect to lymphatic function is now essential in our investigation of various neurological disease processes.
The H217O JJVCPE technique shown in this study can be readily applied to routine clinical studies. Currently, this method and H215O PET represent the only available molecular imaging techniques capable of tracing water dynamics in the clinical setting. While 17O is a stable isotope, 15O is a positron emitting isotope with a half-life of 122 s. Therefore, H217O JJVCPE has obvious advantages to H215O PET for measuring water dynamics in the brain. One such application is measurement of amyloid clearance in preclinical and symptomatic Alzheimer’s disease 13,14. The significantly high cost of H217O, however, prevents immediate use of H217O JJVCPE imaging under clinical setting. Meanwhile, efforts in developing an H215O PET technique similar to the H217O JJVCPE imaging shown in the current study is warranted.
Conclusion
We investigate water flux into CSF in AQP-1, AQP-4 knockout mice utilizing H217O JJVCPE imaging to test the hypothesis that water movement within the pericapillary (Virchow–Robin) space is critical for CSF volume homeostasis (Oreskovic and Klarica hypothesis). The result clearly demonstrated that water influx into CSF is regulated by AQP-4, known to be responsible for water homeostasis of the pericapillary space, and not by AQP-1 found in the choroid plexus, strongly supporting the Oreskovic and Klarica hypothesis.
Acknowledgements
The work was supported by grants from the Ministry of Education, Culture, Sports, Science, and Technology (Japan) and University of Niigata.
Conflicts of interest
There are no conflicts of interest.
Footnotes
Correspondence to Tsutomu Nakada, MD, PhD, FAAN, FANA, Center for Integrated Human Brain Science, Brain Research Institute, University of Niigata, 1-757 Asahimachi, Niigata 951-8585, Japan Tel: +81 25 227 0677; fax: +81 25 227 0822; e-mail: tnakada@bri.niigata-u.ac.jp
References
- 1.Orešković D, Klarica M.The formation of cerebrospinal fluid: nearly a hundred years of interpretations and misinterpretations.Brain Res Rev 2010;64:241–262. [DOI] [PubMed] [Google Scholar]
- 2.Igarashi H, Tsujita M, Huber VJ, Kwee IL, Nakada T.Inhibition of aquaporin-4 significantly increases regional cerebral blood flow.NeuroReport 2013;24:324–328. [DOI] [PubMed] [Google Scholar]
- 3.Huber VJ, Tsujita M, Nakada T.Aquaporins in drug discovery and pharmacotherapy.Mol Aspects Med 2012;33:691–703. [DOI] [PubMed] [Google Scholar]
- 4.Dolman D, Drndarski S, Abbott NJ, Rattray M.Induction of aquaporin 1 but not aquaporin 4 messenger RNA in rat primary brain microvessel endothelial cells in culture.J Neurochem 2005;93:825–833. [DOI] [PubMed] [Google Scholar]
- 5.Nielsen S, Smith BL, Christensen EI, Agre P.Distribution of the aquaporin CHIP in secretory and resorptive epithelia and capillary endothelia.Proc Natl Acad Sci USA 1993;90:7275–7279. [DOI] [PMC free article] [PubMed] [Google Scholar]
- 6.Haj-Yasein NN, Jensen V, Østby I, Omholt SW, Voipio J, Kaila K, et al. Aquaporin-4 regulates extracellular space volume dynamics during high-frequency synaptic stimulation: a gene deletion study in mouse hippocampus.Glia 2012;60:867–874. [DOI] [PubMed] [Google Scholar]
- 7.Yao X, Hrabětová S, Nicholson C, Manley GT.Aquaporin-4 deficient mice have increased extracellular space without tortuosity change.J Neurosci 2008;28:5460–5464. [DOI] [PMC free article] [PubMed] [Google Scholar]
- 8.Kitaura H, Tsujita M, Huber VJ, Kakita A, Shibuki K, Sakimura K, et al. Activity-dependent glial swelling is impaired in aquaporin-4 knockout mice.Neurosci Res 2009;64:208–212. [DOI] [PubMed] [Google Scholar]
- 9.Kitayama K, Abe M, Kakizaki T, Honma D, Natsume R, Fukaya M, et al. Purkinje cell-specific and inducible gene recombination system generated from C57BL/6 mouse ES cells.Biochem Biophys Res Commun 2001;281:1134–1140. [DOI] [PubMed] [Google Scholar]
- 10.Nakada T.Grant-in-Aid for Scientific Research (S). Integrated Science and Innovative Science. Magnetic resonance molecular microimaging.Available at: http://www.jsps.go.jp/j-grantsinaid/12_kiban/ichiran_21/e-data/e07_nakada.pdf. [Accessed 8 September 2013].
- 11.Zhu X-H, Zhang N, Zhang Y, Zhang X, Ugurbil K, Chen W.In vivo 17O NMR approaches for brain study at high field.NMR Biomed 2005;18:83–103. [DOI] [PubMed] [Google Scholar]
- 12.Johnston M, Papaiconomou C.Cerebrospinal fluid transport: a lymphatic perspective.News Physiol Sci 2002;17:227–230. [DOI] [PubMed] [Google Scholar]
- 13.Iliff JJ, Wang M, Liao Y, Plogg BA, Peng W, Gundersen GA, et al. A paravascular pathway facilitates CSF flow through the brain parenchyma and the clearance of interstitial solutes, including amyloid β.Sci Transl Med 2012;4:147ra111. [DOI] [PMC free article] [PubMed] [Google Scholar]
- 14.Weller RO, Djuanda E, Yow HY, Carare RO.Lymphatic drainage of the brain and the pathophysiology of neurological disease.Acta Neuropathol 2009;117:1–14. [DOI] [PubMed] [Google Scholar]