

Abstract
Despite progress toward understanding the correlates of protective T cell immunity in HIV infection, the optimal approach to Ag delivery by vaccination remains uncertain. We characterized two immunodominant CD8 T cell populations generated in response to immunization of BALB/c mice with a replication-deficient adenovirus serotype 5 vector expressing the HIV-derived Gag and Pol proteins at equivalent levels. The Gag-AI9/H-2Kd epitope elicited high-avidity CD8 T cell populations with architecturally diverse clonotypic repertoires that displayed potent lytic activity in vivo. In contrast, the Pol-LI9/H-2Dd epitope elicited motif-constrained CD8 T cell repertoires that displayed lower levels of physical avidity and lytic activity despite equivalent measures of overall clonality. Although low-dose vaccination enhanced the functional profiles of both epitope-specific CD8 T cell populations, greater polyfunctionality was apparent within the Pol-LI9/H-2Dd specificity. Higher proportions of central memory-like cells were present after low-dose vaccination and at later time points. However, there were no noteworthy phenotypic differences between epitope-specific CD8 T cell populations across vaccine doses or time points. Collectively, these data indicate that the functional and phenotypic properties of vaccine-induced CD8 T cell populations are sensitive to dose manipulation, yet constrained by epitope specificity in a clonotype-dependent manner.
Introduction
The development of an effective HIV vaccine depends on a thorough understanding of the immunological determinants of protection. Despite emerging insights from studies of exposed uninfected individuals (1, 2), much of the global research effort has necessarily focused on individuals who exhibit a degree of viral suppression, such as elite controllers and long-term nonprogressors (3). It is clear from these studies that CD8 T cells play a critical role in the containment of HIV replication (4).
In the absence of strong quantitative correlates of control (5, 6), several qualitative attributes have been linked with CD8 T cell populations that mediate effective antiviral immunity in HIV-infected individuals. Favorable characteristics include broadly directed targeting of Gag-derived epitopes (7, 8), especially those restricted by HLA-B molecules (9), high-avidity interactions with cognate Ag (10, 11), and the ability to proliferate (12, 13) and deploy multiple effector functions upon Ag encounter (14). The latter include direct killing of HIV-infected cells (15, 16), which is incorporated in measurements of viral suppressive activity in vitro (17, 18). In addition, both central memory (19) and effector memory (20, 21) phenotypes have been associated with viremic control, particularly in the absence of negative regulation (22–25). More recently, the clonotypic composition of HIV-specific CD8 T cell populations has also emerged as a key correlate of immune control (26, 27). These properties are interlinked and reciprocally affected by viral load, but nonetheless serve as guides to inform further studies (28–30).
To assess the capacity of a vaccine to elicit favorable immune profiles, we examined the effect of Ag dose on HIV-specific CD8 T cell responses in mice immunized with a replication-deficient adenovirus serotype 5 vector expressing full-length Gag and Pol (Ad5.Gag.Pol) at equivalent levels. Immunodominant epitope-specific CD8 T cell populations were mapped and characterized extensively in terms of magnitude, clonality, avidity, function, and phenotype across multiple tissues over time after single-shot administration of high- or low-dose Ad5.Gag.Pol. The data highlight a complex relationship between these parameters within the vaccine-induced, epitope-specific CD8 T cell compartment.
Materials and Methods
Mice
Female H-2d BALB/c mice were purchased from The Jackson Laboratory and maintained in the Vaccine Research Center Animal Care Unit under pathogen-free conditions. All experiments were approved by the Vaccine Research Center Animal Care and Use Committee. Mice were 4–6 wk old at the time of study.
Adenoviral vector and vaccination
All vaccinations were performed with Ad5.Gag.Pol driven from the immediate early CMV enhancer/promoter (GenVec). In brief, the HIV subtype B gag and pol polyprotein gene cassette was inserted in place of the deleted E1 region of the adenovirus genome. The HIV gag gene was truncated to remove the final two segments (p1 and p6) and ligated in frame to the HIV pol gene. Consequently, both genes were expressed equally (31, 32). Vaccine vectors were supplied at 2.9 × 10¹¹ particle units (PU)/μl. Vaccinations were conducted using one-time, split-site inoculations of Ad5.Gag.Pol in a total volume of 100 μl. Low-dose vaccination comprised 108 PU total in 100 μl, and high-dose vaccination comprised 1010 PU total in 100 μl (33–37). In all cases, equal 50-μl aliquots of the vaccine were administered s.c. in each footpad.
Tissue extraction and processing
All experiments were performed using tissues isolated directly ex vivo. Spleen, lung, draining lymph node (popliteal), and peripheral blood were sampled according to standard protocols in compliance with the guidelines of the Vaccine Research Center Animal Care and Use Committee.
Peptides
All peptides were synthesized to >75% purity in 96-well format at a scale of 2.5 μg/well (New England Peptide). Lyophilized peptides were dissolved in HPLC-grade DMSO at high concentration (typically 100 mg/ml, depending on solubility). For all functional assays, the final concentration of each individual peptide was 2 μg/ml unless stated otherwise.
Peptide sensitivity assay
Splenocytes from vaccinated mice were stimulated with serially diluted peptides (Gag-AI9 or Pol-LI9) at concentrations ranging from 2 μg/ml to 2 × 10⁻¹² μg/ml. Samples were tested by both ELISPOT analysis and intracellular cytokine staining for IFN-γ production.
IFN-γ ELISPOT analysis
A matrix approach was used to map vaccine-induced T cell responses, generally comprising 23 peptide pools with 11 to 12 peptides in each pool; each individual peptide was present in two unique pools. To map the novel epitope in the immunodominant region of Pol defined by this approach, nonamer peptides overlapping by eight residues were used in walk assays. Splenocytes or lung cells were washed and resuspended in complete RPMI medium (RPMI 1640 supplemented with penicillin, streptomycin, L-glutamine and 10% FCS) containing 10 U/ml DNAse I (Roche Diagnostics). IFN-γ ELISPOT plates were prepared according to the manufacturer’s specifications (BD Biosciences). Assays were set up in duplicate with 105 cells/well in a final volume of 100 μl containing each relevant peptide at a concentration of 2 μg/ml. Plates were then incubated overnight at 37°C and processed following the manufacturer’s instructions. Spot-forming units (SFU) were counted using an automated ELISPOT reader (CTL). Negative control wells without exogenous peptide were included on each plate and averaged 1 SFU/well (range 0–10). Positive responses were assigned at >100 SFU/well. Epitope identification was based on the observation of similarly immunodominant responses across two overlapping peptide pools.
Abs
The following directly conjugated mAbs were used in various combinations for the analysis of CD8 T cell function and phenotype: 1) anti–CD8-allophycocyanin-Cy7, anti–TNF-PE–Cy7, anti–CD14-FITC, anti–CD16-FITC, and anti–CD19-FITC (BD Pharmingen); 2) anti–CD3-Pacific Blue, anti–CD4-Alexa Fluor 700, anti–IFN-γ–PE, anti–IL-2–PerCP-Cy5.5, anti–CD43-PE–Cy5, and anti–CD62L-PE–Cy5 (BioLegend); and 3) anti–KLRG1-allophycocyanin (eBioscience). For indirect staining, anti–CCR7-biotin (BD Pharmingen) was combined with streptavidin conjugated to QD655 (Invitrogen). A green fluorescent amine-reactive dye (GriVid; Invitrogen) was used as a viability marker to exclude dead cells from the analysis (38, 39). The following directly conjugated mAbs were used for the analysis of CD8 T cell activation and exhaustion: 1) anti–CD160-PE and anti–LAG3-PE (eBioscience); and 2) anti–ICOS-PE and anti–NKG2D-PE (BD Pharmingen).
Polychromatic flow cytometry
Freshly prepared cells from each tissue were resuspended at 107 cells/ml in complete RPMI medium (RPMI 1640 supplemented with penicillin, streptomycin, L-glutamine and 10% FCS); aliquots of each cell suspension were then added at 100 μl/well to a 96-well tissue-culture plate. For functional analyses, all wells were supplemented with the costimulatory mAb anti-CD28 (2 μg/ml; BD Biosciences). Pools of 15-mer peptides overlapping by 11 residues were used to identify vaccine-induced HIV-specific T cell responses across the complete Gag and Pol proteins, as contained in the vector insert. The optimal Gag-AI9 and Pol-LI9 peptides were used to characterize immunodominant responses in the CD8 T cell compartment. In all assays, anti-CD28 mAb in the absence of exogenous peptide addition was used as a negative control, and anti-CD3 mAb (1 μg/ml; BD Pharmingen) was used as a positive control. After incubation for 1 h at 37°C, brefeldin A (10 μg/ml; Sigma-Aldrich) was added to all samples, which were then incubated for a further 5 h at 37°C. Intracellular cytokine staining was performed as described previously (6). For phenotypic analyses, Ag-specific CD8 T cell populations were defined using fluorescent peptide–MHC class I (pMHC I) tetramers. Stained samples were acquired using an LSRII flow cytometer modified to enable the simultaneous detection of up to 18 fluorophores (BD Biosciences). A minimum of 105 events was collected per sample. Electronic compensation was conducted with Ab-capture beads (BD Biosciences) stained separately with individual mAbs used in the test samples.
Data analysis was performed using FlowJo software version 8.7.3 (Tree Star). The SPICE software suite (Mario Roederer, Vaccine Research Center, National Institute of Allergy and Infectious Diseases, National Institutes of Health) was used to generate graphical representations and conduct statistical analyses. Response gates were set on live CD3+CD8+ T cells after aggregate exclusion. Background values were subtracted to calculate specific cytokine production.
Polyfunctionality was quantified as described previously (40). Briefly, the polyfunctionality index (I) is defined as the weight sum of the frequencies (Fi) of cells performing i functions out of n measured functions as follows:
| (I) |
We applied a conservative weight of polyfunctionality (q = 1), and all three functional parameters were considered equally important.
Analysis of MHC restriction
Adherent L929 murine fibroblasts were transduced singly with vaccinia viruses encoding the H-2 proteins Kd, Ld, or Dd such that the resulting transductants expressed only one MHC restriction element (41, 42). Each transduced cell line was pulsed with or without the Pol-LI9 peptide for 2 h at 37°C, washed three times in complete RPMI medium (RPMI 1640 supplemented with penicillin, streptomycin, L-glutamine and 10% FCS), and then mixed with splenocytes from vaccinated mice at an E:T ratio of 20:1. Peptide-specific responses were evaluated on the basis of intracellular cytokine production.
Tetramer staining and flow cytometric sorting
Fluorescent tetrameric pMHC I complexes of AMQMLKETI/H-2Kd (Gag-AI965–73) and LVGPTPVNI/H-2Dd (Pol-LI976–84) were either provided by the National Institutes of Health Tetramer Core Facility or produced in-house as described previously (43). Cells were pelleted and resuspended in 200 μl complete RPMI medium and then stained with tetramer (1 μg/test with respect to the pMHC I monomeric component) for 20 min at 37°C. After washing, cells were surface stained with the following panel: GriVid, anti–CD3-Pacific Blue, anti–CD4-Alexa Fluor 700, anti–CD8-allophycocyanin–Cy7, anti–CD14-FITC, anti–CD16-FITC, anti–CD19-FITC, anti–CD62L-PE–Cy5, and anti–CCR7-QD655. Viable CD3+CD8+tetramer+ cells were sorted at >99% purity directly into RNAlater (Applied Biosystems) using a modified FACSAria flow cytometric sorter (BD Biosciences) and stored immediately at −80°C prior to clonotype analysis. Tetramer-binding events routinely comprised <0.02% of the CD8 T cell population in nonvaccinated mice.
Clonotype analysis
A template-switch–anchored RT-PCR was used to characterize and quantify all expressed TRB gene products within each tetramer-sorted CD8 T cell population (200–5000 cells/sample) as described previously (44, 45).
In vivo cytotoxicity assay
Measurement of in vivo cytotoxic activity was performed as described previously with minor modifications (46). In brief, target splenocytes from naive syngeneic mice were split equally into four tubes. Cells in two tubes were pulsed with either Gag-AI9 or Pol-LI9 peptide (2 μg/ml) for 2 h at 37°C; cells in the other two tubes remained unpulsed. After washing twice in complete RPMI medium, peptide-pulsed targets were labeled at 37°C using 10 μM CFSE (CFSEhi) or 25 μM CMTMR (CMTMRhi) in PBS for 12 min or 20 min, respectively. Unpulsed cells were similarly labeled using 1 μM CFSE (CFSElo) or 2.5 μM CMTMR (CMTMRlo). CFSE labeling was quenched by the addition of FCS to a final concentration of 20% (v/v). Cells were then washed with complete RPMI medium, pelleted, and resuspended in PBS at a concentration of 108 cells/ml. All four populations of target cells were subsequently mixed together in equal numbers in ice-cold PBS, such that recipient vaccinated mice received 2 × 10⁷ cells of each population in a single i.v. tail vein injection. As a control, naive mice were adoptively transferred with an identical number of target cells. Recipient mice were sacrificed 24 h after cell transfer. Splenocyte mononuclear cells were prepared and analyzed by flow cytometry. The percentage of specific lysis was determined using the following formulae: 1) ratio of recovery of peptide-pulsed splenocytes to non–peptide-pulsed splenocytes = (percentage of CFSEhi or CMTMRhi cells)/(percentage of CFSElo or CMTMRlo cells); and 2) specific lysis (%) = 100 (1 − [ratio of recovery of peptide-pulsed splenocytes to non–peptide-pulsed splenocytes]).
Statistical analysis of clonotypic repertoires
To compare epitope-specific TCRβ repertoires between tissues, doses, and time points, we used two measures of clonotypic diversity: 1) the number of unique TCRβ amino acid clonotypes (defined by their Vβ and Jβ gene usage and the CDR3β amino acid sequence); and 2) Simpson’s diversity index (47). The degree of TCRβ sequence variation was assessed on the basis of Vβ usage or the proportion of the TCRβ repertoire conforming to a specific amino acid motif (for Pol-LI9, where Vβ usage was relatively conserved). The Morisita-Horn similarity index was used to assess the similarity between TCRβ repertoires (48). The Simpson’s diversity and Morisita-Horn similarity indices account for both the variety of TCRβ clonotypes and the number of copies of each TCRβ clonotype in the epitope-specific TCRβ repertoire per sample. Both indices range in value from 0 (minimal diversity/similarity) to 1 (maximal diversity/similarity). A randomization procedure was used in the estimation of the diversity and similarity measures to correct for differences in sample size (47, 48), and was based on the acquisition of 15 unique TCRβ sequences per sample. Samples with <15 unique TCRβ sequences were excluded from the statistical analysis. A two-way ANOVA on the ranks of values (for TCRβ diversity or percentage of the TCRβ repertoire conforming to a motif) and Bonferroni posttest were used to assess differences in the epitope-specific TCRβ repertoires between paired tissue samples and between mice vaccinated at different doses. A Mann–Whitney U test was used to compare the TCRβ repertoire similarity of paired tissue samples between groups of mice vaccinated at different doses. Randomization procedures and calculations of the diversity and similarity measures were performed using Matlab (The Mathworks). Statistical analyses were performed using GraphPad Prism (GraphPad).
N-addition and germline identity analysis
The CDR3β for each sequence was defined by first identifying TRBV and TRBJ gene usage by pairwise alignment and subsequently by identifying the conserved cysteine at position 104 within the TRBV gene and the conserved phenylalanine at position 118 within the TRBJ gene that define the boundaries of the CDR3β. Additionally, the number of germline nucleotides from the TRBV and TRBJ genes that were used within the CDR3β was captured for each sequence from the pairwise alignment. Subsequently, TRBD gene usage as well as the length of the retained TRBD sequence were identified using a local implementation of an algorithm written to identify and delimit TRBD gene usage within the CDR3β (49). The number of nucleotide additions within the CDR3β was defined as the length of the CDR3β less the total number of nucleotides contributed by the TRBV, TRBJ, and TRBD genes.
Tetramer association and dissociation kinetics
For tetramer association, the kinetics has the following form:
where is the experimental readout (staining intensity), is proportional to the rate of tetramer recruitment from solution, and is the time-varying effective instantaneous relaxation rate of the system (the parameter is proportional to a number of relevant quantities, such as tetramer concentration, TCR density, and the conversion of stained TCRs to relative staining intensity in percentage). Although a full solution for can be obtained by analyzing the complete kinetic system that takes all different bound forms of the tetramer into account, this involves more parameters than the data permit to be estimated. Therefore, a phenomenological approach was taken, assuming:
where and represent the initial and final effective relaxation rates and represents an empirical rate parameter. Comparison with the dynamics of the full system (data not shown) indicates that this simplified approach adequately captures most of the initial transient behavior.
For tetramer dissociation, tetramers are considered to bind to TCRs on the membrane at one, two, or three sites. The single-site association rate is , and the single-site dissociation rate is . As a straightforward consequence of the combinatorics of ligands combining, the transition rates between the various bound states are as depicted in the diagram.
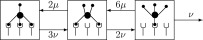
Let denote the number of tetramers bound at sites, relative to the total amount present at time . The kinetics is then described by the following differential equations:
with initial condition and (this assumes that all tetramers are triply bound at the start of the experiment). The readout of the experiment is represented as follows:
where is the signal as expressed a percentage of the starting value.
Precursor frequencies of epitope-specific CD8 T cells
Single-cell suspensions of splenocytes from four independent naive BALB/c, vaccinated BALB/c, or OT1 Rag−/− mice were incubated for 1 h at room temperature with the relevant pMHC I tetramer (Gag-AI9 or Pol-LI9), both in allophycocyanin-conjugated and PE-conjugated forms, and anti–CD8-Cy5.5–PerCP (BD Biosciences). Cells were washed once in complete RPMI medium (RPMI 1640 supplemented with penicillin, streptomycin, L-glutamine and 10% FCS) and magnetically enriched for the allophycocyanin and PE labels (Miltenyi Biotec). Enriched cells were then stained with GriVid and the following directly conjugated mAbs: 1) anti–CD4-Alexa Fluor 594 and anti–CD43-PE–Cy5 (BioLegend); and 2) anti–CD14-FITC, anti–CD16-FITC, and anti–CD19-FITC (BD Pharmingen). Samples were acquired using an LSRII flow cytometer (BD Biosciences), and data analysis was performed using FlowJo software version 8.7.3 (Tree Star).
Results
Two immunodominant epitopes induce Ag-specific CD8 T cells after vaccination with Ad5.Gag.Pol
To determine response breadth and characterize immunodominant epitopes in BALB/c mice after vaccination with Ad5.Gag.Pol, we performed IFN-γ ELISPOT assays using matrices of overlapping peptides as described previously (50–52). Consistent with other reports, the H-2Kd–restricted epitope Gag65–73 AMQMLKETI (Gag-AI9) was the immunodominant target derived from this protein in BALB/c mice (53). In contrast, Pol-derived epitopes have not been well characterized in this model. Initial analyses revealed a potential immunodominant epitope within the Pol region KAIGTVLVGPTPVNIIGRN, which elicited response magnitudes at least 3-fold greater than those observed with other peptide pools across the complete protein. Fine mapping identified the minimal epitope as Pol76–84 LVGPTPVNI (Pol-LI9) and the restriction element as H-2Dd (data not shown). All subsequent experiments focused on CD8 T cell responses directed against these two immunodominant epitopes.
Pol-LI9–specific CD8 T cells predominate at acute time points after vaccination
Next, we vaccinated BALB/c mice with either low (108 PU) or high (1010 PU) dose Ad5.Gag.Pol and determined the magnitude of CD8 T cell responses specific for Gag-AI9 and Pol-LI9 at day 10, month 1, and month 3 postvaccination in spleen, lung, lymph node, and blood. Results are shown for each tissue at each time point (Fig. 1). Overall, Pol-LI9–specific CD8 T cell responses were immunodominant at day 10 postvaccination, regardless of Ad5.Gag.Pol dose. By month 3 postvaccination, however, Gag-AI9–specific and Pol-LI9–specific CD8 T cell responses were equivalent in magnitude and more robust after high-dose Ad5.Gag.Pol administration.
FIGURE 1.

Quantification of CD8 T cell responses after vaccination. (A–F) Suspensions of single cells from spleen, lung, lymph node, and blood were assayed for epitope-specific CD8 T cell responses by surface tetramer and intracellular cytokine staining. Tetramer-binding (A, C, and E) and cytokine-producing (B, D, and F) CD8 T cell frequencies are shown. Low-dose (L) and high-dose (H) vaccine regimens are compared for each tissue and epitope as indicated. Responses to Gag-AI9 (red) and Pol-LI9 (blue) were measured at day 10 (A and B), month 1 (C and D), and month 3 (E and F). Cytokine production was determined as the background-subtracted sum of combinatorial expression frequencies of IFN-γ, TNF, and IL-2. Error bars represent SD.
TCRs specific for Pol-LI9 exhibit type 3 (public) and type 4 (near-public) bias
To examine the effects of Ag dose on CD8 T cell clonality after vaccination, we sorted Gag-AI9 and Pol-LI9 tetramer-binding CD8 T cell populations directly ex vivo by flow cytometry and analyzed TCR usage across all time points and all tissues using a template-switch anchored RT-PCR as described previously (44, 45). Overall, CD8 T cells specific for Gag-AI9 and Pol-LI9 exhibited skewed hierarchies comprising a small number of dominant clonotypes and several subdominant clonotypes (Fig. 2A). Notably, Gag-AI9–specific CD8 T cells showed no preference for TRBV/TRBJ usage and lacked any obvious sequence motif in the CDR3β loop. In contrast, Pol-LI9–specific CD8 T cells exhibited preferential usage of TRBV16 and TRBJ2-5 and displayed a CDR3β motif with the amino acid sequence CASSLXGGXQDTQYF that was shared between individual mice. Furthermore, Pol-LI9–specific CD8 T cell populations contained a significantly greater number of public clonotypes, defined on the basis of amino acid identity, compared with Gag-AI9–specific CD8 T cell populations (Fig. 2B); this observation held across time points and vaccine doses (p < 0.0001; one-way ANOVA). Collectively, these features constitute type 3 (public) and type 4 (near-public) repertoire bias (54).
FIGURE 2.

Clonotypic analysis of Ag-specific CD8 T cell populations. (A) Clonotypic analysis of a representative mouse. TRBV and TRBJ usage, CDR3 amino acid sequence, and relative frequency are shown for each clonotype specific for Gag-AI9 (left panel) and Pol-LI9 (right panel). Gray shading denotes consensus amino acids. Colors in the frequency column indicate public clonotypes across the entire cohort. (B) The frequency of public clonotypes per mouse is shown at each time point after vaccination with low-dose (L) or high-dose (H) Ad5.Gag.Pol. Each symbol represents a single tissue site from an individual mouse.
Clonotypic diversity is evident in both immunodominant epitope-specific CD8 T cell populations
Next, we quantified repertoire diversity at the CDR3β amino acid sequence level using Simpson’s diversity index (47). Gag-AI9–specific CD8 T cells exhibited diverse repertoires across all tissues, regardless of vaccine dose. After high-dose vaccination, however, repertoire diversity within this specificity decreased at month 3, which could reflect the loss of higher avidity effector CD8 T cells (Fig. 3A, 3C) (55). Despite preferential usage of TRBV16/TRBJ2-5, Pol-LI9–specific CD8 T cells also exhibited substantial CDR3β amino acid sequence diversity, irrespective of tissue location or Ag dose. However, in contrast to Gag-AI9–specific CD8 T cells, Pol-LI9–specific CD8 T cells retained their clonotypic diversity after high-dose vaccination (Fig. 3B, 3D).
FIGURE 3.

Characteristics of TCRβ repertoires specific for Gag-AI9 and Pol-LI9. The diversity of Ag-specific TCRβ repertoires was assessed using the number of different TCRβ clonotypes (A and B) and Simpson’s diversity index (C and D). (E) The percentage of each TRBV is represented per mouse for Gag-AI9–specific TCRβ clonotypes. (F) The extent to which Pol-LI9–specific TCRβ repertoires conformed to the CASSLXGGXQDTQYF amino acid motif is shown per mouse, where TCRβ sequences with a CDR3β length of 15 aa used either TRBV16 or TRBV3 and TRBJ2-5. (G and H) The degree of overlap between TCRβ repertoires sampled from spleen, lung, lymph node (LN), and blood was assessed using the Morisita-Horn similarity index. The index value on the vertical axis of each horizontal line extending between two different tissues represents the similarity between those two tissues. The Simpson’s diversity and Morisita-Horn similarity indices account for both the number of different TCRβ clonotypes and the clonal dominance hierarchy and vary in value between 0 (minimal diversity/similarity) and 1 (maximal diversity/similarity). The number of clonotypes, Simpson’s diversity index, and the Morisita-Horn similarity index were estimated for all samples having an equal sample size of 15 TCRβ sequences. Analyses are shown for samples with at least 15 TCRβ sequences and only for mice with spleen and lung samples that both yielded at least 15 TCRβ sequences.
Repertoire overlap between tissues within individual mice was assessed using the Morisita-Horn similarity index (48). Relatively few clonotypes were shared across anatomical sites within the Gag-AI9–specific CD8 T cell repertoires (Fig. 3G). As diversity decreased after high-dose vaccination, however, the Morisita-Horn index increased, indicating a greater degree of tissue overlap in each mouse. In contrast, substantial clonotypic sharing was apparent within the Pol-LI9–specific CD8 T cell repertoires across tissues (Fig. 3H).
In further analyses, no preferential TRBV usage was observed for Gag-AI9–specific CD8 T cells (Fig. 3E). For Pol-LI9–specific CD8 T cells, however, preferential usage of TRBV16/TRBJ2-5 with a CASSLXGGXQDTQYF motif was apparent regardless of vaccine dose or tissue location (Fig. 3F).
Pol-LI9–specific CD8 T cell clonotypes have fewer nucleotide additions and are closely related to germline sequence
Public clonotypes are made more readily during the V(D)J recombination process because they trend toward germline sequence (56). By comparative analysis of each clonotype, we found that Gag-AI9–specific TCRs contained significantly greater numbers of nucleotide additions at the junctional regions compared with Pol-LI9–specific TCRs at the corresponding time points (day 10: p < 0.0001; month 1: p = 0.0013; month 3: p < 0.0001) (Fig. 4A). Consistent with these findings, Pol-LI9–specific TCRs were significantly more germline-like compared with Gag-AI9–specific TCRs at all time points (day 10: p < 0.0001; month 1: p = 0.0009; month 3: p < 0.0001) (Fig. 4B).
FIGURE 4.

Nucleotide addition analysis and determination of percent identity with germline sequence. Comparison of nucleotide additions (A) and percent identity with germline sequence (B) between Ag-specific TCRβ repertoires at each time point after vaccination. Statistical analyses were performed using the Wilcoxon matched-pairs signed-rank test; p values are shown for significant comparisons between specificities at equivalent time points. Error bars represent the SD in each analysis.
As Pol-LI9–specific TCR repertoires are highly public, have fewer nucleotide additions, and are closely related to germline sequence, we sought evidence of convergent recombination. The latter is a mechanism that explains how TCR sharing between individuals is directly related to TCR production frequency determined by the relative generation efficiency of particular nucleotide and amino acid sequences during the recombination process (57, 58). For motif-bearing TRBV16/TRBJ2-5 clonotypes, multiple nucleotide sequences were found to encode each public CDR3β (Supplemental Fig. 1A). Moreover, several distinct recombination events could produce the same nucleotide sequence (Supplemental Fig. 1B). These findings suggest that such clonotypes are likely to be produced efficiently by convergent recombination.
Pol-LI9–specific CD8 T cells occur at higher precursor frequencies
In view of the early immunodominance of CD8 T cell responses to Pol-LI9 and the convergent nature of the corresponding TCR repertoires, we measured CD8 T cell precursor frequencies in mice that had not been exposed to Ag (59–61). As expected, Pol-LI9–specific precursors were present at higher frequencies than Gag-AI9–specific precursors in the total CD8 T cell pool, although this difference did not reach statistical significance using a Wilcoxon matched-pairs signed-rank test (p = 0.08) (Supplemental Fig. 2A).
Gag-AI9–specific CD8 T cell populations bind Ag more avidly
To determine whether the striking differences in clonality were associated with differential Ag avidity, we conducted pMHC I tetramer association and dissociation assays (62). In all experiments, Gag-AI9–specific CD8 T cells displayed faster on-rates and slower off-rates (Supplemental Fig. 2B). Consistent with these data, Gag-AI9–specific CD8 T cells also displayed functional outputs at lower peptide concentrations in dose-titration experiments (Supplemental Fig. 2C). Thus, Gag-AI9–specific CD8 T cells bind cognate pMHC I Ag more avidly and with greater functional sensitivity than Pol-LI9–specific CD8 T cells.
Acute epitope-specific CD8 T cell responses are more polyfunctional after low-dose vaccination
To characterize the functional quality of epitope-specific CD8 T cells after vaccination with varying Ag doses, single-cell suspensions from spleen, lung, draining lymph node, and blood were stimulated ex vivo with peptides corresponding to the two defined immunodominant epitopes and analyzed by polychromatic flow cytometry. Results are shown for each tissue derived from BALB/c mice at day 10, month 1, and month 3 after vaccination with either low (108 PU) or high (1010 PU) dose Ad5.Gag.Pol (Fig. 5, Supplemental Fig. 3). All samples were analyzed independently using permutation tests in the SPICE software suite and a polyfunctionality index (40) to quantify and compare the combinatorial expression of IFN-γ, TNF, and/or IL-2.
FIGURE 5.

Functional analysis of Ag-specific CD8 T cells after vaccination. The polyfunctionality index was calculated for Gag-AI9–specific and Pol-LI9–specific CD8 T cell responses in spleen (A), lung (B), lymph node (C), and blood (D) after vaccination with either low-dose (L) or high-dose (H) Ad5.Gag.Pol as indicated. Intracellular cytokine staining was performed for IFN-γ, TNF, and IL-2 after peptide stimulation ex vivo. Boolean gate arrays were created using the FlowJo platform to determine the frequency of each of the eight possible response patterns per cell. Nonspecific background events were subtracted from responses measured in the stimulated samples for each response pattern individually. Statistical analyses were performed using the Wilcoxon matched-pairs signed-rank test. Significant comparisons are denoted as follows: *p < 0.05, **p < 0.01.
In general, high-dose vaccination elicited functional responses of greater magnitude at all time points (Fig. 1). At day 10, however, a greater proportion of Ag-specific CD8 T cells produced multiple cytokines after low-dose vaccination. Although these dose-related differences failed to reach significance, the trend is consistent with previous reports (36, 63). At later time points, polyfunctionality indices were generally equivalent between vaccine doses. However, some notable epitope-specific differences were observed. After high-dose vaccination, for example, the proportion of polyfunctional Gag-AI9–specific CD8 T cells increased with time in some instances, likely reflecting a preferential loss of effector cells after the initial expansion. In contrast, Pol-LI9–specific CD8 T cells mobilized by low-dose vaccination retained more polyfunctional profiles over time compared with their counterparts elicited by high-dose vaccination. Thus, at least acutely, vaccination with low-dose Ag can enhance the functional profile of HIV-specific CD8 T cells.
Despite these differences in functionality between vaccine doses and time points, the most striking feature of the analysis emerged when epitope specificities were compared under identical conditions. In the majority of cases, Pol-LI9–specific CD8 T cells were more polyfunctional than Gag-AI9–specific CD8 T cells. Although some exceptions were noted at later time points linked to the epitope-specific effects described above, these data indicate that the nature of Ag engagement by the available cognate TCR repertoire is a major determinant of CD8 T cell functionality.
Gag-AI9–specific CD8 T cells exhibit more potent cytotoxic activity
Next, we measured cytotoxic activity in vivo at day 10 and month 3 after vaccination (46). At both time points, regardless of the initial vaccine dose, Gag-AI9–specific CD8 T cells exhibited greater cytotoxicity than Pol-LI9–specific CD8 T cells, despite the greater frequency of the latter (Fig. 6). This difference between specificities was most marked at day 10 and, on the assumption of equivalent lytic potential, likely reflects the highly avid mobilization of effector CD8 T cells specific for the Gag-AI9 epitope.
FIGURE 6.

In vivo cytotoxicity of Ag-specific CD8 T cells after vaccination. Specific elimination of peptide-pulsed targets was measured simultaneously for both Gag-AI9–specific and Pol-LI9–specific CD8 T cell populations in vivo at day 10 (A) and month 3 (B) after vaccination with the indicated doses of Ad5.Gag.Pol. Statistical analyses were performed using the Wilcoxon matched-pairs signed-rank test.
The phenotypic properties of vaccine-induced immunodominant epitope-specific CD8 T cell populations are largely indistinguishable
To establish the memory phenotype of CD8 T cell populations specific for Gag-AI9 and Pol-LI9, we analyzed cell-surface expression of CD43, KLRG1, and CCR7. In addition, we quantified CD160, LAG3, ICOS, and NKG2D to determine the state of exhaustion (Supplemental Fig. 4). In general, greater proportions of central memory-like cells were present after low-dose vaccination and at later time points (Fig. 7). However, there were no noteworthy phenotypic differences between Gag-AI9–specific and Pol-LI9–specific CD8 T cell populations across vaccine doses or time points.
FIGURE 7.

Phenotypic analysis of Ag-specific CD8 T cells after vaccination. SPICE analysis of Gag-AI9–specific and Pol-LI9–specific CD8 T cell memory phenotypes in spleen (A), lung (B), lymph node (C), and blood (D) at day 10 (top panel), month 1 (middle panel), and month 3 (bottom panel) after vaccination with either low-dose or high-dose Ad5.Gag.Pol as indicated. Expression of the cell-surface markers CD43, KLRG1, and CCR7 was determined by flow cytometry. Bar charts indicate the frequencies for each phenotypic permutation, color-matched to the inset keys. Phenotypes are arranged such that central memory-like cells are positioned on the left of each graphic transitioning to effector memory-like cells on the right.
Discussion
In this study, we examined several proposed CD8 T cell–associated correlates of HIV protection in a mouse vaccination model. Two immunodominant epitopes were identified within the Ad5.Gag.Pol insert. The Gag-AI9 epitope elicited CD8 T cell populations with structurally diverse TCR repertoires that were largely private in nature and displayed minimal overlap between tissues. In contrast, the Pol-LI9 epitope elicited CD8 T cell populations with highly constrained TCR repertoires that were largely public in nature and displayed substantial overlap between tissues. The Pol-LI9–specific TCRs contained fewer nucleotide additions and exhibited greater germline identity with evidence of convergent recombination. Consistent with these observations and the early immunodominance of Pol-LI9–specific CD8 T cells, we found higher precursor frequencies for this epitope in naive mice. These results are consistent with previous studies that link precursor frequency to immunodominance within the CD8 T cell compartment (64–69).
Despite profound differences in clonotypic architecture, both immunodominant epitope-specific CD8 T cell populations displayed comparable levels of repertoire diversity at early time points postvaccination. However, a significant decrease in diversity and clonotype number per repertoire was observed for Gag-AI9–specific CD8 T cell populations after high-dose vaccination. This could reflect a preferential loss of high-avidity epitope-specific clonotypes under conditions of high Ag load (55). In contrast, Pol-LI9–specific CD8 T cell populations maintained clonotypic diversity over time after high-dose vaccination, possibly reflecting lower overall Ag avidities and more uniform interclonotypic profiles. Thus, a low-dose vaccination strategy enables broader clonotypic persistence, at least for epitope-specific CD8 T cell populations with diverse available repertoires, thereby seeding a more expansive long-term memory pool (70).
In keeping with previous studies (36, 63), low-dose vaccination elicited greater frequencies of polyfunctional epitope-specific CD8 T cells compared with high-dose vaccination at acute time points. However, these effects were marginal compared with the profound functional differences between epitope specificities. In most comparisons, Pol-LI9–specific CD8 T cells displayed greater polyfunctionality than Gag-AI9–specific CD8 T cells with respect to cytokine production. This observation is consistent with previous reports showing that TCR repertoire diversity as an independent parameter does not predict the functional profile of epitope-specific CD8 T cell responses, but contrasts at first sight with the generally accepted link between Ag avidity and polyfunctionality (10, 71–75). Conversely, Gag-AI9–specific CD8 T cells exhibited far more potent cytotoxic activity than Pol-LI9–specific CD8 T cells. Although this observation is consistent with the higher overall Ag avidity and functional sensitivity of Gag-AI9–specific CD8 T cells, it is not clear why Pol-LI9–specific CD8 T cells performed so poorly in this regard. One possibility is that the Pol-LI9 peptide dissociates rapidly after target cell pulsing, but this does not explain why Pol-LI9–specific cytotoxic activity improved dramatically between day 10 and month 3 postvaccination, especially in view of the increase in central memory-like cells, which express fewer cytolytic enzymes (76–78). Nonetheless, it seems likely that higher avidity Gag-AI9–specific clonotypes within the structurally diverse repertoire differentiate acutely into lytic effector cells after Ag engagement. Such a process would explain the relatively restricted functional profile of primary Gag-AI9–specific CD8 T cell responses, as well as the observed clonotypic contraction over time, especially after high-dose vaccination.
The phenotypic characteristics of Gag-AI9–specific and Pol-LI9–specific CD8 T cell populations, both in terms of memory differentiation and activation/exhaustion status, were virtually indistinguishable across corresponding vaccine doses and time points. This remarkable degree of comparability contrasts starkly with the epitope-specific functional dichotomy noted above. In general, higher frequencies of central memory-like cells were elicited by low-dose vaccination. On the basis that these early memory cells retain the ability to produce IL-2 readily in response to Ag encounter (79–81), this finding may explain why more polyfunctional epitope-specific CD8 T cell responses were observed after low-dose vaccination.
In summary, our data suggest that the functional and phenotypic properties of vaccine-induced CD8 T cells are sensitive to dose manipulation above the immunogenicity threshold, yet differentially constrained by the nature of the targeted Ag. Epitope specificity therefore emerges as a key consideration for rational vaccine design, delimiting most notably the functional profile of mobilized CD8 T cell populations in a clonotype-dependent manner.
Supplementary Material
Acknowledgments
We thank Kristin Ladell for expert assistance with graphics.
This work was supported by the Intramural Research Program of the Vaccine Research Center, National Institute of Allergy and Infectious Diseases, National Institutes of Health. D.A.P. is a Wellcome Trust Senior Investigator. M.L. was funded by the University Pierre et Marie Curie ËMERGENCE Program, Fondation pour l’Aide a la Recherche sur la Sclerose En Plaques, and Arthritis Fondation Courtin.
The online version of this article contains supplemental material.
- Ad5.Gag.Pol
- replication-deficient adenovirus serotype 5 vector expressing full-length Gag and Pol
- pMHC I
- peptide–MHC class I
- PU
- particle unit
- SFU
- spot-forming unit.
Disclosures
The authors have no financial conflicts of interest.
References
- 1.Lederman M. M., Alter G., Daskalakis D. C., Rodriguez B., Sieg S. F., Hardy G., Cho M., Anthony D., Harding C., Weinberg A., et al. 2010. Determinants of protection among HIV‐exposed seronegative persons: an overview. J. Infect. Dis. 202(Suppl 3): S333–S338. [DOI] [PMC free article] [PubMed] [Google Scholar]
- 2.Tomescu C., Abdulhaqq S., Montaner L. J. 2011. Evidence for the innate immune response as a correlate of protection in human immunodeficiency virus (HIV)-1 highly exposed seronegative subjects (HESN). Clin. Exp. Immunol. 164: 158–169. [DOI] [PMC free article] [PubMed] [Google Scholar]
- 3.Benjelloun F., Lawrence P., Verrier B., Genin C., Paul S. 2012. Role of human immunodeficiency virus type 1 envelope structure in the induction of broadly neutralizing antibodies. J. Virol. 86: 13152–13163. [DOI] [PMC free article] [PubMed] [Google Scholar]
- 4.Demers K. R., Reuter M. A., Betts M. R. 2013. CD8(+) T-cell effector function and transcriptional regulation during HIV pathogenesis. Immunol. Rev. 254: 190–206. [DOI] [PMC free article] [PubMed] [Google Scholar]
- 5.Addo M. M., Yu X. G., Rathod A., Cohen D., Eldridge R. L., Strick D., Johnston M. N., Corcoran C., Wurcel A. G., Fitzpatrick C. A., et al. 2003. Comprehensive epitope analysis of human immunodeficiency virus type 1 (HIV-1)-specific T-cell responses directed against the entire expressed HIV-1 genome demonstrate broadly directed responses, but no correlation to viral load. J. Virol. 77: 2081–2092. [DOI] [PMC free article] [PubMed] [Google Scholar]
- 6.Betts M. R., Ambrozak D. R., Douek D. C., Bonhoeffer S., Brenchley J. M., Casazza J. P., Koup R. A., Picker L. J. 2001. Analysis of total human immunodeficiency virus (HIV)-specific CD4(+) and CD8(+) T-cell responses: relationship to viral load in untreated HIV infection. J. Virol. 75: 11983–11991. [DOI] [PMC free article] [PubMed] [Google Scholar]
- 7.Kiepiela P., Ngumbela K., Thobakgale C., Ramduth D., Honeyborne I., Moodley E., Reddy S., de Pierres C., Mncube Z., Mkhwanazi N., et al. 2007. CD8+ T-cell responses to different HIV proteins have discordant associations with viral load. Nat. Med. 13: 46–53. [DOI] [PubMed] [Google Scholar]
- 8.Rolland M., Heckerman D., Deng W., Rousseau C. M., Coovadia H., Bishop K., Goulder P. J., Walker B. D., Brander C., Mullins J. I. 2008. Broad and Gag-biased HIV-1 epitope repertoires are associated with lower viral loads. PLoS ONE 3: e1424. [DOI] [PMC free article] [PubMed] [Google Scholar]
- 9.Kiepiela P., Leslie A. J., Honeyborne I., Ramduth D., Thobakgale C., Chetty S., Rathnavalu P., Moore C., Pfafferott K. J., Hilton L., et al. 2004. Dominant influence of HLA-B in mediating the potential co-evolution of HIV and HLA. Nature 432: 769–775. [DOI] [PubMed] [Google Scholar]
- 10.Almeida J. R., Price D. A., Papagno L., Arkoub Z. A., Sauce D., Bornstein E., Asher T. E., Samri A., Schnuriger A., Theodorou I., et al. 2007. Superior control of HIV-1 replication by CD8+ T cells is reflected by their avidity, polyfunctionality, and clonal turnover. J. Exp. Med. 204: 2473–2485. [DOI] [PMC free article] [PubMed] [Google Scholar]
- 11.Berger C. T., Frahm N., Price D. A., Mothe B., Ghebremichael M., Hartman K. L., Henry L. M., Brenchley J. M., Ruff L. E., Venturi V., et al. 2011. High-functional-avidity cytotoxic T lymphocyte responses to HLA-B-restricted Gag-derived epitopes associated with relative HIV control. J. Virol. 85: 9334–9345. [DOI] [PMC free article] [PubMed] [Google Scholar]
- 12.Day C. L., Kiepiela P., Leslie A. J., van der Stok M., Nair K., Ismail N., Honeyborne I., Crawford H., Coovadia H. M., Goulder P. J., et al. 2007. Proliferative capacity of epitope-specific CD8 T-cell responses is inversely related to viral load in chronic human immunodeficiency virus type 1 infection. J. Virol. 81: 434–438. [DOI] [PMC free article] [PubMed] [Google Scholar]
- 13.Migueles S. A., Laborico A. C., Shupert W. L., Sabbaghian M. S., Rabin R., Hallahan C. W., Van Baarle D., Kostense S., Miedema F., McLaughlin M., et al. 2002. HIV-specific CD8+ T cell proliferation is coupled to perforin expression and is maintained in nonprogressors. Nat. Immunol. 3: 1061–1068. [DOI] [PubMed] [Google Scholar]
- 14.Betts M. R., Nason M. C., West S. M., De Rosa S. C., Migueles S. A., Abraham J., Lederman M. M., Benito J. M., Goepfert P. A., Connors M., et al. 2006. HIV nonprogressors preferentially maintain highly functional HIV-specific CD8+ T cells. Blood 107: 4781–4789. [DOI] [PMC free article] [PubMed] [Google Scholar]
- 15.Hersperger A. R., Pereyra F., Nason M., Demers K., Sheth P., Shin L. Y., Kovacs C. M., Rodriguez B., Sieg S. F., Teixeira-Johnson L., et al. 2010. Perforin expression directly ex vivo by HIV-specific CD8 T-cells is a correlate of HIV elite control. PLoS Pathog. 6: e1000917. [DOI] [PMC free article] [PubMed] [Google Scholar]
- 16.Migueles S. A., Osborne C. M., Royce C., Compton A. A., Joshi R. P., Weeks K. A., Rood J. E., Berkley A. M., Sacha J. B., Cogliano-Shutta N. A., et al. 2008. Lytic granule loading of CD8+ T cells is required for HIV-infected cell elimination associated with immune control. Immunity 29: 1009–1021. [DOI] [PMC free article] [PubMed] [Google Scholar]
- 17.Blackbourn D. J., Mackewicz C. E., Barker E., Hunt T. K., Herndier B., Haase A. T., Levy J. A. 1996. Suppression of HIV replication by lymphoid tissue CD8+ cells correlates with the clinical state of HIV-infected individuals. Proc. Natl. Acad. Sci. USA 93: 13125–13130. [DOI] [PMC free article] [PubMed] [Google Scholar]
- 18.Sáez-Cirión A., Lacabaratz C., Lambotte O., Versmisse P., Urrutia A., Boufassa F., Barré-Sinoussi F., Delfraissy J. F., Sinet M., Pancino G., Venet A., Agence Nationale de Recherches sur le Sida EP36 HIV Controllers Study Group 2007. HIV controllers exhibit potent CD8 T cell capacity to suppress HIV infection ex vivo and peculiar cytotoxic T lymphocyte activation phenotype. Proc. Natl. Acad. Sci. USA 104: 6776–6781. [DOI] [PMC free article] [PubMed] [Google Scholar]
- 19.Burgers W. A., Riou C., Mlotshwa M., Maenetje P., de Assis Rosa D., Brenchley J., Mlisana K., Douek D. C., Koup R., Roederer M., et al. CAPRISA 002 Acute Infection Study Team 2009. Association of HIV-specific and total CD8+ T memory phenotypes in subtype C HIV-1 infection with viral set point. J. Immunol. 182: 4751–4761. [DOI] [PMC free article] [PubMed] [Google Scholar]
- 20.Addo M. M., Draenert R., Rathod A., Verrill C. L., Davis B. T., Gandhi R. T., Robbins G. K., Basgoz N. O., Stone D. R., Cohen D. E., et al. 2007. Fully differentiated HIV-1 specific CD8+ T effector cells are more frequently detectable in controlled than in progressive HIV-1 infection. PLoS ONE 2: e321. [DOI] [PMC free article] [PubMed] [Google Scholar]
- 21.Hess C., Altfeld M., Thomas S. Y., Addo M. M., Rosenberg E. S., Allen T. M., Draenert R., Eldrige R. L., van Lunzen J., Stellbrink H. J., et al. 2004. HIV-1 specific CD8+ T cells with an effector phenotype and control of viral replication. Lancet 363: 863–866. [DOI] [PubMed] [Google Scholar]
- 22.Day C. L., Kaufmann D. E., Kiepiela P., Brown J. A., Moodley E. S., Reddy S., Mackey E. W., Miller J. D., Leslie A. J., DePierres C., et al. 2006. PD-1 expression on HIV-specific T cells is associated with T-cell exhaustion and disease progression. Nature 443: 350–354. [DOI] [PubMed] [Google Scholar]
- 23.Petrovas C., Casazza J. P., Brenchley J. M., Price D. A., Gostick E., Adams W. C., Precopio M. L., Schacker T., Roederer M., Douek D. C., Koup R. A. 2006. PD-1 is a regulator of virus-specific CD8+ T cell survival in HIV infection. J. Exp. Med. 203: 2281–2292. [DOI] [PMC free article] [PubMed] [Google Scholar]
- 24.Trautmann L., Janbazian L., Chomont N., Said E. A., Gimmig S., Bessette B., Boulassel M. R., Delwart E., Sepulveda H., Balderas R. S., et al. 2006. Upregulation of PD-1 expression on HIV-specific CD8+ T cells leads to reversible immune dysfunction. Nat. Med. 12: 1198–1202. [DOI] [PubMed] [Google Scholar]
- 25.Yamamoto T., Price D. A., Casazza J. P., Ferrari G., Nason M., Chattopadhyay P. K., Roederer M., Gostick E., Katsikis P. D., Douek D. C., et al. 2011. Surface expression patterns of negative regulatory molecules identify determinants of virus-specific CD8+ T-cell exhaustion in HIV infection. Blood 117: 4805–4815. [DOI] [PMC free article] [PubMed] [Google Scholar]
- 26.Chen H., Ndhlovu Z. M., Liu D., Porter L. C., Fang J. W., Darko S., Brockman M. A., Miura T., Brumme Z. L., Schneidewind A., et al. 2012. TCR clonotypes modulate the protective effect of HLA class I molecules in HIV-1 infection. Nat. Immunol. 13: 691–700. [DOI] [PMC free article] [PubMed] [Google Scholar]
- 27.Ladell K., Hashimoto M., Iglesias M. C., Wilmann P. G., McLaren J. E., Gras S., Chikata T., Kuse N., Fastenackels S., Gostick E., et al. 2013. A molecular basis for the control of preimmune escape variants by HIV-specific CD8+ T cells. Immunity 38: 425–436. [DOI] [PubMed] [Google Scholar]
- 28.Appay V., Douek D. C., Price D. A. 2008. CD8+ T cell efficacy in vaccination and disease. Nat. Med. 14: 623–628. [DOI] [PubMed] [Google Scholar]
- 29.Freel S. A., Saunders K. O., Tomaras G. D. 2011. CD8(+) T-cell-mediated control of HIV-1 and SIV infection. Immunol. Res. 49: 135–146. [DOI] [PMC free article] [PubMed] [Google Scholar]
- 30.Makedonas G., Betts M. R. 2011. Living in a house of cards: re-evaluating CD8+ T-cell immune correlates against HIV. Immunol. Rev. 239: 109–124. [DOI] [PMC free article] [PubMed] [Google Scholar]
- 31.Butman B. T., Lizonova A., Brough D. E., Sowers J. M., Sheets R., Gall J., Newton P., Gomez P. 2006. Comprehensive characterization of the 293-ORF6 cell line. Dev. Biol. (Basel) 123: 225–233, discussion 265–266. [PubMed] [Google Scholar]
- 32.Catanzaro A. T., Koup R. A., Roederer M., Bailer R. T., Enama M. E., Moodie Z., Gu L., Martin J. E., Novik L., Chakrabarti B. K., et al. Vaccine Research Center 006 Study Team 2006. Phase 1 safety and immunogenicity evaluation of a multiclade HIV-1 candidate vaccine delivered by a replication-defective recombinant adenovirus vector. J. Infect. Dis. 194: 1638–1649. [DOI] [PMC free article] [PubMed] [Google Scholar]
- 33.Lindsay R. W., Darrah P. A., Quinn K. M., Wille-Reece U., Mattei L. M., Iwasaki A., Kasturi S. P., Pulendran B., Gall J. G., Spies A. G., Seder R. A. 2010. CD8+ T cell responses following replication-defective adenovirus serotype 5 immunization are dependent on CD11c+ dendritic cells but show redundancy in their requirement of TLR and nucleotide-binding oligomerization domain-like receptor signaling. J. Immunol. 185: 1513–1521. [DOI] [PubMed] [Google Scholar]
- 34.Wille-Reece U., Flynn B. J., Loré K., Koup R. A., Miles A. P., Saul A., Kedl R. M., Mattapallil J. J., Weiss W. R., Roederer M., Seder R. A. 2006. Toll-like receptor agonists influence the magnitude and quality of memory T cell responses after prime-boost immunization in nonhuman primates. J. Exp. Med. 203: 1249–1258. [DOI] [PMC free article] [PubMed] [Google Scholar]
- 35.Darrah P. A., Hegde S. T., Patel D. T., Lindsay R. W., Chen L., Roederer M., Seder R. A. 2010. IL-10 production differentially influences the magnitude, quality, and protective capacity of Th1 responses depending on the vaccine platform. J. Exp. Med. 207: 1421–1433. [DOI] [PMC free article] [PubMed] [Google Scholar]
- 36.Darrah P. A., Patel D. T., De Luca P. M., Lindsay R. W., Davey D. F., Flynn B. J., Hoff S. T., Andersen P., Reed S. G., Morris S. L., et al. 2007. Multifunctional TH1 cells define a correlate of vaccine-mediated protection against Leishmania major. Nat. Med. 13: 843–850. [DOI] [PubMed] [Google Scholar]
- 37.Quinn K. M., Da Costa A., Yamamoto A., Berry D., Lindsay R. W., Darrah P. A., Wang L., Cheng C., Kong W. P., Gall J. G., et al. 2013. Comparative analysis of the magnitude, quality, phenotype, and protective capacity of simian immunodeficiency virus gag-specific CD8+ T cells following human-, simian-, and chimpanzee-derived recombinant adenoviral vector immunization. J. Immunol. 190: 2720–2735. [DOI] [PMC free article] [PubMed] [Google Scholar]
- 38.Chattopadhyay P. K., Price D. A., Harper T. F., Betts M. R., Yu J., Gostick E., Perfetto S. P., Goepfert P., Koup R. A., De Rosa S. C., et al. 2006. Quantum dot semiconductor nanocrystals for immunophenotyping by polychromatic flow cytometry. Nat. Med. 12: 972–977. [DOI] [PubMed] [Google Scholar]
- 39.Perfetto S. P., Chattopadhyay P. K., Lamoreaux L., Nguyen R., Ambrozak D., Koup R. A., Roederer M. 2006. Amine reactive dyes: an effective tool to discriminate live and dead cells in polychromatic flow cytometry. J. Immunol. Methods 313: 199–208. [DOI] [PubMed] [Google Scholar]
- 40.Larsen M., Sauce D., Arnaud L., Fastenackels S., Appay V., Gorochov G. 2012. Evaluating cellular polyfunctionality with a novel polyfunctionality index. PLoS ONE 7: e42403. [DOI] [PMC free article] [PubMed] [Google Scholar]
- 41.Hahn Y. S., Guanzon A., Rice C. M., Hahn C. S. 1999. Class I MHC molecule-mediated inhibition of Sindbis virus replication. J. Immunol. 162: 69–77. [PubMed] [Google Scholar]
- 42.Russ G., Ramachandra M., Hrycyna C. A., Gottesman M. M., Pastan I., Bennink J. R., Yewdell J. W. 1998. P-glycoprotein plays an insignificant role in the presentation of antigenic peptides to CD8+ T cells. Cancer Res. 58: 4688–4693. [PubMed] [Google Scholar]
- 43.Price D. A., Brenchley J. M., Ruff L. E., Betts M. R., Hill B. J., Roederer M., Koup R. A., Migueles S. A., Gostick E., Wooldridge L., et al. 2005. Avidity for antigen shapes clonal dominance in CD8+ T cell populations specific for persistent DNA viruses. J. Exp. Med. 202: 1349–1361. [DOI] [PMC free article] [PubMed] [Google Scholar]
- 44.Douek D. C., Betts M. R., Brenchley J. M., Hill B. J., Ambrozak D. R., Ngai K. L., Karandikar N. J., Casazza J. P., Koup R. A. 2002. A novel approach to the analysis of specificity, clonality, and frequency of HIV-specific T cell responses reveals a potential mechanism for control of viral escape. J. Immunol. 168: 3099–3104. [DOI] [PubMed] [Google Scholar]
- 45.Quigley M. F., Almeida J. R., Price D. A., Douek D. C. 2011. Unbiased molecular analysis of T cell receptor expression using template-switch anchored RT-PCR. Curr. Protoc. Immunol. Chapter 10: Unit 10.33. [DOI] [PMC free article] [PubMed] [Google Scholar]
- 46.Wong P., Pamer E. G. 2003. CD8 T cell responses to infectious pathogens. Annu. Rev. Immunol. 21: 29–70. [DOI] [PubMed] [Google Scholar]
- 47.Venturi V., Kedzierska K., Turner S. J., Doherty P. C., Davenport M. P. 2007. Methods for comparing the diversity of samples of the T cell receptor repertoire. J. Immunol. Methods 321: 182–195. [DOI] [PubMed] [Google Scholar]
- 48.Venturi V., Kedzierska K., Tanaka M. M., Turner S. J., Doherty P. C., Davenport M. P. 2008. Method for assessing the similarity between subsets of the T cell receptor repertoire. J. Immunol. Methods 329: 67–80. [DOI] [PubMed] [Google Scholar]
- 49.Yousfi Monod M., Giudicelli V., Chaume D., Lefranc M. P. 2004. IMGT/JunctionAnalysis: the first tool for the analysis of the immunoglobulin and T cell receptor complex V-J and V-D-J JUNCTIONs. Bioinformatics 20(Suppl 1): i379–i385. [DOI] [PubMed] [Google Scholar]
- 50.Hoffmeister B., Kiecker F., Tesfa L., Volk H. D., Picker L. J., Kern F. 2003. Mapping T cell epitopes by flow cytometry. Methods 29: 270–281. [DOI] [PubMed] [Google Scholar]
- 51.Maecker H. T., Dunn H. S., Suni M. A., Khatamzas E., Pitcher C. J., Bunde T., Persaud N., Trigona W., Fu T. M., Sinclair E., et al. 2001. Use of overlapping peptide mixtures as antigens for cytokine flow cytometry. J. Immunol. Methods 255: 27–40. [DOI] [PubMed] [Google Scholar]
- 52.Precopio M. L., Butterfield T. R., Casazza J. P., Little S. J., Richman D. D., Koup R. A., Roederer M. 2008. Optimizing peptide matrices for identifying T-cell antigens. Cytometry A 73: 1071–1078. [DOI] [PMC free article] [PubMed] [Google Scholar]
- 53.Doe B., Walker C. M. 1996. HIV-1 p24 Gag-specific cytotoxic T-lymphocyte responses in mice. AIDS 10: 793–794. [DOI] [PubMed] [Google Scholar]
- 54.Miles J. J., Douek D. C., Price D. A. 2011. Bias in the αβ T-cell repertoire: implications for disease pathogenesis and vaccination. Immunol. Cell Biol. 89: 375–387. [DOI] [PubMed] [Google Scholar]
- 55.Lichterfeld M., Yu X. G., Mui S. K., Williams K. L., Trocha A., Brockman M. A., Allgaier R. L., Waring M. T., Koibuchi T., Johnston M. N., et al. 2007. Selective depletion of high-avidity human immunodeficiency virus type 1 (HIV-1)-specific CD8+ T cells after early HIV-1 infection. J. Virol. 81: 4199–4214. [DOI] [PMC free article] [PubMed] [Google Scholar]
- 56.Quigley M. F., Greenaway H. Y., Venturi V., Lindsay R., Quinn K. M., Seder R. A., Douek D. C., Davenport M. P., Price D. A. 2010. Convergent recombination shapes the clonotypic landscape of the naive T-cell repertoire. Proc. Natl. Acad. Sci. USA 107: 19414–19419. [DOI] [PMC free article] [PubMed] [Google Scholar]
- 57.Venturi V., Price D. A., Douek D. C., Davenport M. P. 2008. The molecular basis for public T-cell responses? Nat. Rev. Immunol. 8: 231–238. [DOI] [PubMed] [Google Scholar]
- 58.Venturi V., Quigley M. F., Greenaway H. Y., Ng P. C., Ende Z. S., McIntosh T., Asher T. E., Almeida J. R., Levy S., Price D. A., et al. 2011. A mechanism for TCR sharing between T cell subsets and individuals revealed by pyrosequencing. J. Immunol. 186: 4285–4294. [DOI] [PubMed] [Google Scholar]
- 59.La Gruta N. L., Rothwell W. T., Cukalac T., Swan N. G., Valkenburg S. A., Kedzierska K., Thomas P. G., Doherty P. C., Turner S. J. 2010. Primary CTL response magnitude in mice is determined by the extent of naive T cell recruitment and subsequent clonal expansion. J. Clin. Invest. 120: 1885–1894. [DOI] [PMC free article] [PubMed] [Google Scholar]
- 60.Moon J. J., Chu H. H., Pepper M., McSorley S. J., Jameson S. C., Kedl R. M., Jenkins M. K. 2007. Naive CD4(+) T cell frequency varies for different epitopes and predicts repertoire diversity and response magnitude. Immunity 27: 203–213. [DOI] [PMC free article] [PubMed] [Google Scholar]
- 61.Ruckwardt T. J., Malloy A. M., Gostick E., Price D. A., Dash P., McClaren J. L., Thomas P. G., Graham B. S. 2011. Neonatal CD8 T-cell hierarchy is distinct from adults and is influenced by intrinsic T cell properties in respiratory syncytial virus infected mice. PLoS Pathog. 7: e1002377. [DOI] [PMC free article] [PubMed] [Google Scholar]
- 62.Laugel B., van den Berg H. A., Gostick E., Cole D. K., Wooldridge L., Boulter J., Milicic A., Price D. A., Sewell A. K. 2007. Different T cell receptor affinity thresholds and CD8 coreceptor dependence govern cytotoxic T lymphocyte activation and tetramer binding properties. J. Biol. Chem. 282: 23799–23810. [DOI] [PubMed] [Google Scholar]
- 63.Sun Y., Santra S., Schmitz J. E., Roederer M., Letvin N. L. 2008. Magnitude and quality of vaccine-elicited T-cell responses in the control of immunodeficiency virus replication in rhesus monkeys. J. Virol. 82: 8812–8819. [DOI] [PMC free article] [PubMed] [Google Scholar]
- 64.Choi E. Y., Christianson G. J., Yoshimura Y., Sproule T. J., Jung N., Joyce S., Roopenian D. C. 2002. Immunodominance of H60 is caused by an abnormally high precursor T cell pool directed against its unique minor histocompatibility antigen peptide. Immunity 17: 593–603. [DOI] [PubMed] [Google Scholar]
- 65.Kotturi M. F., Scott I., Wolfe T., Peters B., Sidney J., Cheroutre H., von Herrath M. G., Buchmeier M. J., Grey H., Sette A. 2008. Naive precursor frequencies and MHC binding rather than the degree of epitope diversity shape CD8+ T cell immunodominance. J. Immunol. 181: 2124–2133. [DOI] [PMC free article] [PubMed] [Google Scholar]
- 66.La Gruta N. L., Kedzierska K., Pang K., Webby R., Davenport M., Chen W., Turner S. J., Doherty P. C. 2006. A virus-specific CD8+ T cell immunodominance hierarchy determined by antigen dose and precursor frequencies. Proc. Natl. Acad. Sci. USA 103: 994–999. [DOI] [PMC free article] [PubMed] [Google Scholar]
- 67.Obar J. J., Khanna K. M., Lefrançois L. 2008. Endogenous naive CD8+ T cell precursor frequency regulates primary and memory responses to infection. Immunity 28: 859–869. [DOI] [PMC free article] [PubMed] [Google Scholar]
- 68.Schmidt J., Neumann-Haefelin C., Altay T., Gostick E., Price D. A., Lohmann V., Blum H. E., Thimme R. 2011. Immunodominance of HLA-A2-restricted hepatitis C virus-specific CD8+ T cell responses is linked to naive-precursor frequency. J. Virol. 85: 5232–5236. [DOI] [PMC free article] [PubMed] [Google Scholar]
- 69.Tan A. C., La Gruta N. L., Zeng W., Jackson D. C. 2011. Precursor frequency and competition dictate the HLA-A2-restricted CD8+ T cell responses to influenza A infection and vaccination in HLA-A2.1 transgenic mice. J. Immunol. 187: 1895–1902. [DOI] [PubMed] [Google Scholar]
- 70.Miconnet I., Marrau A., Farina A., Taffé P., Vigano S., Harari A., Pantaleo G. 2011. Large TCR diversity of virus-specific CD8 T cells provides the mechanistic basis for massive TCR renewal after antigen exposure. J. Immunol. 186: 7039–7049. [DOI] [PubMed] [Google Scholar]
- 71.La Gruta N. L., Thomas P. G., Webb A. I., Dunstone M. A., Cukalac T., Doherty P. C., Purcell A. W., Rossjohn J., Turner S. J. 2008. Epitope-specific TCRbeta repertoire diversity imparts no functional advantage on the CD8+ T cell response to cognate viral peptides. Proc. Natl. Acad. Sci. USA 105: 2034–2039. [DOI] [PMC free article] [PubMed] [Google Scholar]
- 72.Moffat J. M., Handel A., Doherty P. C., Turner S. J., Thomas P. G., La Gruta N. L. 2010. Influenza epitope-specific CD8+ T cell avidity, but not cytokine polyfunctionality, can be determined by TCRβ clonotype. J. Immunol. 185: 6850–6856. [DOI] [PubMed] [Google Scholar]
- 73.Price D. A., Asher T. E., Wilson N. A., Nason M. C., Brenchley J. M., Metzler I. S., Venturi V., Gostick E., Chattopadhyay P. K., Roederer M., et al. 2009. Public clonotype usage identifies protective Gag-specific CD8+ T cell responses in SIV infection. J. Exp. Med. 206: 923–936. [DOI] [PMC free article] [PubMed] [Google Scholar]
- 74.Almeida J. R., Sauce D., Price D. A., Papagno L., Shin S. Y., Moris A., Larsen M., Pancino G., Douek D. C., Autran B., et al. 2009. Antigen sensitivity is a major determinant of CD8+ T-cell polyfunctionality and HIV-suppressive activity. Blood 113: 6351–6360. [DOI] [PMC free article] [PubMed] [Google Scholar]
- 75.Iglesias M. C., Almeida J. R., Fastenackels S., van Bockel D. J., Hashimoto M., Venturi V., Gostick E., Urrutia A., Wooldridge L., Clement M., et al. 2011. Escape from highly effective public CD8+ T-cell clonotypes by HIV. Blood 118: 2138–2149. [DOI] [PMC free article] [PubMed] [Google Scholar]
- 76.Chattopadhyay P. K., Betts M. R., Price D. A., Gostick E., Horton H., Roederer M., De Rosa S. C. 2009. The cytolytic enzymes granyzme A, granzyme B, and perforin: expression patterns, cell distribution, and their relationship to cell maturity and bright CD57 expression. J. Leukoc. Biol. 85: 88–97. [DOI] [PMC free article] [PubMed] [Google Scholar]
- 77.Takata H., Takiguchi M. 2006. Three memory subsets of human CD8+ T cells differently expressing three cytolytic effector molecules. J. Immunol. 177: 4330–4340. [DOI] [PubMed] [Google Scholar]
- 78.Wolint P., Betts M. R., Koup R. A., Oxenius A. 2004. Immediate cytotoxicity but not degranulation distinguishes effector and memory subsets of CD8+ T cells. J. Exp. Med. 199: 925–936. [DOI] [PMC free article] [PubMed] [Google Scholar]
- 79.Peperzak V., Xiao Y., Veraar E. A., Borst J. 2010. CD27 sustains survival of CTLs in virus-infected nonlymphoid tissue in mice by inducing autocrine IL-2 production. J. Clin. Invest. 120: 168–178. [DOI] [PMC free article] [PubMed] [Google Scholar]
- 80.Precopio M. L., Betts M. R., Parrino J., Price D. A., Gostick E., Ambrozak D. R., Asher T. E., Douek D. C., Harari A., Pantaleo G., et al. 2007. Immunization with vaccinia virus induces polyfunctional and phenotypically distinctive CD8(+) T cell responses. J. Exp. Med. 204: 1405–1416. [DOI] [PMC free article] [PubMed] [Google Scholar]
- 81.Sarkar S., Kalia V., Haining W. N., Konieczny B. T., Subramaniam S., Ahmed R. 2008. Functional and genomic profiling of effector CD8 T cell subsets with distinct memory fates. J. Exp. Med. 205: 625–640. [DOI] [PMC free article] [PubMed] [Google Scholar]
Associated Data
This section collects any data citations, data availability statements, or supplementary materials included in this article.