

Abstract
Context
Factors controlling metabolic flexibility (MF), the ability of the body to switch from fat to carbohydrate oxidation in response to feeding or with insulin administration, are being actively investigated.
Objective
We sought to determine the effects of race (African American, AA versus Caucasian, C) and type 2 diabetes status (non-diabetic versus type 2 diabetic individuals) on MF to glucose in humans.
Design/Setting//Main Outcome
Respiratory quotient (RQ) and macronutrient substrate utilization was evaluated by indirect calorimetry during baseline (fasting) and hyperinsulinemic-euglycemic clamp (insulin infusion of 120 mU•m-2•min-1); ΔRQ (MF)=Clamp RQ-Fasting RQ.
Participants
The study included 168 human subjects of different races (55 AA, 113 C), gender (73 male, 95 female), ages (18-73y), BMI (19.3-47.7kg/m2), and type 2 diabetes status (89 non-diabetic, 79 type 2 diabetic subjects).
Results
MF was negatively correlated (P<0.01) with age (r= -0.41), fasting RQ (r= -0.22) fasting glucose (r= -0.55), insulin (r= -0.40) and triglyceride (r= -0.44) concentrations; whereas a positive association was observed with insulin sensitivity (r=0.69; P<0.0001). Insulin sensitivity, fasting RQ, triglyceride concentrations, type 2 diabetes status, and race accounted for 71% of the variability in MF with insulin sensitivity being the main determinant factor (model R2=0.48, P<0.0001). After controlling for the significant predictors, MF was higher in AA versus C (mean ± SE; 0.080 ± 0.004 versus 0.069 ± 0.002, P=0.008) and in non-diabetic versus type 2 diabetic subjects (P=0.003).
Conclusion
This study confirms that insulin sensitivity is the major contributor to metabolic flexibility in humans, but provides the novel findings that AA have significantly greater MF than C even after adjusting for insulin sensitivity and type 2 diabetes status.
Key Terms: Metabolic inflexibility, respiratory quotient, type 2 diabetes, African Americans
Introduction
Metabolic flexibility (MF) is characterized by increased fat oxidation in skeletal muscle during fasting conditions and the ability to switch from fat to carbohydrate oxidation in response to a meal or insulin (1). Factors that control MF are felt to reside at the mitochondrial level as prior research suggests that insulin resistance and metabolic inflexibility are potentially caused by mitochondrial impairments in obesity and type 2 diabetes (2, 3). Previous research suggested lean individuals were more MF than obese individuals (4). Specifically, lean individuals were able to successfully switch from primarily oxidizing fat during the fasting state (lower respiratory quotient, RQ) to glucose during the insulin-stimulated state (higher RQ). In addition, there are reports of reduced MF in non-diabetic individuals with a history of type 2 diabetes (5) and individuals with type 2 diabetes (6) when compared to non-diabetic individuals without a history of type 2 diabetes and non-diabetic obese individuals. The reduced MF that was observed in the individuals with type 2 diabetes was mainly explained by the glucose disposal rate (GDR) (6). Galgani and colleagues (7) suggested that the GDR, baseline fasting RQ, and steady-state plasma free-fatty acid concentrations were important contributing factors to MF. Although the effects of BMI and diabetes status on MF have been observed, the contribution of race to MF has been less explored.
African Americans have a higher prevalence of obesity (8) and type 2 diabetes (9) than Caucasians. The reasons for this disparity are not precisely known, but some possible explanations may be that African Americans have lower skeletal muscle fatty acid oxidation (10), resting metabolic rate (11), insulin sensitivity (12), and higher 24-hr RQ (13). To our knowledge, only one study (14) has reported results on race and MF. Specifically, Berk et al. (14) observed that obese African American women were not able to efficiently switch between fat oxidation during the fasting state and carbohydrate oxidation during a fed and insulin-stimulted state, suggestive of reduced MF in this African American population. This study was restricted to a small group of premenopausal, non-diabetic, obese, and healthy women. Whether these effects were considered to be applicable to the general population encompassing a wide range of phenotypes and levels of glycemia were unknown. Thus, we sought to determine the effect of race and diabetes status on MF in a larger cohort of African Americans and Caucasians consisting of both genders, a wide range for BMI and insulin sensitivity, and diabetes status (non-diabetic versus diabetic individuals).
Subjects and Methods
Subjects
The study population comprised 168 individuals (55 African Americans, 113 Caucasians) with a wide range of characteristics. The characteristics included the following: 1) gender (73 male, 95 female), 2) ages (18 to 73 year), 3) BMI (19.3 to 47.7 kg/m2), and 4) type 2 diabetes status (89 non-diabetic and 79 type 2 diabetic individuals). If the subject had a history of type 2 diabetes, he/she was required to be on dietary therapy only, i.e. drug naïve, with a fasting plasma glucose between 125 mg/dL (6.94 mmol/L) and 175 mg/dL (9.72 mmol/L). Diabetes status was confirmed by an oral glucose tolerance test (OGTT). Exclusions were: 1) medications known to affect glucose metabolism; 2) untreated thyroid or chronic liver, renal or cardiovascular disease; and 3) a history of drug and/or alcohol abuse, or psychiatric disease prohibiting adherence to study protocol. The study protocol was approved and conducted in strict compliance with Pennington Biomedical Research Center's (PBRC) Institutional Review Board for human subjects.
Study Design
After subjects gave written consent, they underwent a physical examination, resting electrocardiogram, 75 g OGTT, and routine blood and urine chemistries. After passing screening criteria, subjects had body fat and fat-free mass measured by dual-energy x-ray absorptiometry (DEXA) (Hologic QDR 4500A, Bedford, MA). All evaluations were performed after a 12-hour overnight fast. Individuals were then admitted to the PBRC inpatient unit the evening prior to their testing day. After admission, the subjects consumed a eucaloric standardized meal with a macronutrient composition of 50% carbohydrates, 35% fat, and 15% protein prepared by the metabolic kitchen. The following morning, after a 12-hour fast, each participant had insulin sensitivity and MF assessed.
Insulin sensitivity
Hyperinsulinemic-euglycemic clamps (15) were performed to assess insulin sensitivity. After a 12-hour overnight fast, an intravenous catheter was placed in an antecubital vein for infusion of insulin and glucose. A second catheter was inserted in a dorsal vein of the contralateral arm for blood withdrawal. The hand was placed between a heating pad for arterialization of venous blood sampling. During the 45 minute fasting state, blood samples were collected every 15 minutes. Then insulin was administered at a primed-continuous infusion rate of 120 mU•m-2• min-1 for 2 hours and blood samples were collected every 5 minutes during this period. Arterialized serum glucose was measured periodically and a variable infusion of dextrose (20% solution) was given to maintain serum glucose concentrations at ∼100mg/dl (5.6 mmol/l). During the steady state (last 30 minutes of clamp), the mean rate of exogenous glucose infusion was corrected for changes in glycemia and divided by fat-free mass to assess insulin sensitivity.
Metabolic Flexibility
Resting metabolic rate (RMR), RQ, and substrate oxidation of carbohydrate and fat were determined by indirect calorimetry using a Deltatrac II instrument (16). The ventilated hood technique was used. Indirect calorimetry (i.e., RMR, RQ, and substrate utilization) was assessed 45 minutes before the insulin/glucose infusion (fasting state of clamp) and after the insulin/glucose infusion (i.e., last 45 minutes of the clamp). The adaptation period under the hood was the first 15 minutes and data were collected during the last 30 minutes (i.e., the average values were used). The ratio of the respiratory gases (RQ = CO2produced / O2consumed) were analyzed and used to predict changes in carbohydrate and fat substrate utilization. Whole-body MF to glucose was calculated as the change in RQ from the fasting to insulin-stimulated states (ΔRQ = insulin-stimulated RQ – fasting RQ). The change in carbohydrate and fat oxidation were calculated similar to the ΔRQ. Fat and carbohydrate oxidation were calculated as described by Jequier et al. (16). Urinary nitrogen excretion was estimated based on an assumption that protein metabolism was 15% of RMR.
Statistical Analysis
Baseline characteristics of African Americans versus Caucasians stratified by presence and absence of diabetes were reported. Two-sample t-tests were used to compare the means of metabolic and physiologic parameters for African Americans versus Caucasians within diabetes status strata. Pearson correlation was used to assess the relationships between MF and measured variables. Then a stepwise multiple regression analysis was performed to determine the best predictors of MF. This provided a platform for evaluating the MF association with each predictor variable adjusted for all other predictors in the regression model. Differences between the groups during the fasting and insulin-stimulated states (including the change) were evaluated by repeated-measures ANOVA. Statistical significance was assumed at P ≤ 0.05. All statistical analyses were performed using SAS version 9.1.3 (SAS Institute, Cary, NC).
Results
Subject characteristics
Table 1 lists the metabolic and physiologic parameters for the entire cohort. None of the parameters for the females were significant except the non-diabetic African Americans had lower triglyceride levels than the Caucasians. The non-diabetic males that were African American had lower triglyceride, cholesterol, and LDL levels and higher insulin sensitivity when compared to the Caucasians. In addition, the male African Americans with type 2 diabetes had a higher fat-free mass than the male Caucasians with type 2 diabetes.
Table 1. A. Baseline Characteristics of the Female African Americans Versus Caucasians in the Study Sample.
| No diabetes | Type 2 Diabetes | Overall Range | |||
|---|---|---|---|---|---|
| African American =25 | Caucasians n=30 | African American n=15 | Caucasian n=25 | ||
| BMI status, kg/m2 (<25/≥ 25) | 6/19 | 10/20 | 0/15 | 3/22 | — |
| Age. years | 39 ± 2 | 44 ± 2.5 | 55 ± 2 | 58 ± 14 | 18-73 |
| Body weight, kg | 89.6 ± 4.2 | 85.6 ± 4.4 | 88.5 ± 3.2 | 83.5 ± 2.8 | 52.3-140.1 |
| BMI, kg/m2 | 32.8 ± 1.5 | 32.1 ± 1.5 | 33.0 ± 1.2 | 31.8 ± 1.0 | 20.1-46.6 |
| Body fat, % | 38.2 ± 1.7 | 40.1 ± 1.3 | 41.2 ± 0.8 | 40.2 ± 1.1 | 21.7-51.2 |
| Fat mass, kg | 36.3 ± 2.9 | 36.2 ± 2.7 | 37.0 ± 1.9 | 34.7 ± 1.8 | 12.8-71.8 |
| Fat-Free mass, kg | 54.7 ± 1.4 | 50 9 ± 1.8 | 52.2 ± 1.6 | 50.4 ± 1.2 | 36.3-75.9 |
| Fasting | |||||
| Glucose, mg/dl | 94.7 ± 1.5 | 95.7 ± 1.5 | 117 J ± 5 2 | 125.4 ± 3.4 | 76.8-165.3 |
| Insulin, μU/ml | 13.3 ± 1.3 | 11.4 ± 1.1 | 18.1 ± 2.8 | 22.5 ± 3.7 | 3.2-82.3 |
| FFA: mmol/l | 0.56 ± 0.03 | 0.56 ± 0.04 | 0.57 ± 0.03 | 0 58 ± 0.03 | 0.06-1.13 |
| Triglycerides, mg/dl | 74.9 ± 5.5 | 145.1 ± 13.2* | 140.3 ± 20.7 | 164.8 ± 13.3 | 33 0-356.0 |
| Cholesterol, mg/dl | 192.6 ± 8.1 | 209.3 ± 6.6 | 206.0 ± 10.6 | 210.2 ± 6.8 | 121.0-304.0 |
| LDL, mg/dl | 114.8 ± 7.4 | 122.9 ± 6.1 | 113.6 ± 7.2 | 120.3 ± 6.0 | 54.4-217.6 |
| HDL, mg/dl | 62 8 ± 2.6 | 57.4 ± 2.5 | 64.3 ± 4.8 | 57.0 ± 2.3 | 38.5-101.2 |
| Stead-state | |||||
| Glucose, mg/dl | 102.2 ± 1.2 | 101.7 ± 0.9 | 96.5 ± 1.3 | 98.8 ± 0.9 | 83.8-112.7 |
| Insulin, μU/ml | 235.8 ± 7.8 | 226.8 ± 8.5 | 234.2 ± 9.8 | 241.6 ± 13.4 | 151.2-423.7 |
| Insulin sensitivity, mg• kg FFM−1• min−1 | 11.7 ± 0.6 | 11.7 ± 0.7 | 6.2 ± 0.4 | 6.4 ± 0.4 | 3.0-19.5 |
| Multipliers for conversion to International System of Units: glucose 0.0556 (mmol/L); insulin 7.175 (pmol/L); triglycerides 0.0113 (mmol/L); Cholesterol, LDL, and HDL 0.0259 (mmol/L). Data are reported as unadjusted values and mean ± SEM. *African Americans versus Caucasians without diabetes, P < 0.0001 | |||||
| B. Baseline Characteristics of the Male African Americans Versus Caucasians in the Study Sample | |||||
|---|---|---|---|---|---|
|
| |||||
| No diabetes | Type 2 Diabetes | Overall Range | |||
| African American n=11 | Caucasian n=23 | African American n=4 | Caucasian n=35 | ||
| BMI status, kg/m2 (<25/ ≥ 25) | — | ||||
| Age. years | 31 ± 3 | 41 ± 3 | 58 ± 2.2 | 59 ± 1.4 | 18-69 |
| Body weight, kg | 91.6 ± 9.0 | 92.8 ± 3 8 | 100.1 ± 8.2 | 95.2 ± 2.3 | 59.0-144.6 |
| BMI, kg/m2 | 29.0 ± 3.0 | 29.3 ± 1.4 | 31.1 ± 2.5 | 31.0 ± 0.7 | 19.3-47.7 |
| Body fat, % | 20.8 ± 4.0 | 26.7 ± 1.8 | 24.0 ± 2.9 | 28.6 ± 0.8 | 7.8-46.6 |
| Fat mass, kg | 22.8 ± 6.2 | 26.4 ± 2 6 | 25.1 ± 5.1 | 27.8 ± 1.3 | 5.1-60.9 |
| Fat-Free mass, kg | 70.7 ± 3.7 | 67.7 ± 1.5 | 76.9 ± 3 4 | 67.5 13* | 53.6-96.8 |
| Fasting | |||||
| Glucose, mg/dl | 95.6 ± 2.5 | 97.4 ± 1.1 | 133.3 ± 10.2 | 124.2 ± 2.8 | 82.5-158.5 |
| Insulin, μU/ml | 8.3 ± 1.6 | 13.0 ± 1.8 | 11.9 ± 2.2 | 16.1 ± 1.2 | 2.9-37.4 |
| FFA: mmol/l | 0.53 ± 0.06 | 0.48 ± 0.04 | 0.64 ± 0.09 | 0.54 ± 0.03 | 0.21-1.07 |
| Triglycerides, mg/dl | 86.4 ± 10.6 | 152.6 ± 19.9* | 164.8 ± 33 1 | 147.5 ± 13.8 | 32.0-383.0 |
| Cholesterol, mg/dl | 165.5 ± 9.8 | 204.1 ± 8.5* | 187.5 ± 2.1 | 191.7 ± 8.1 | 99.0-356.0 |
| LDL, mg/dl | 96.6 ± 7.2 | 127.8 ± 6.9* | 110.0 ± 6.3 | 113.5 ± 7.2 | 43.0-248.8 |
| HDL, mg/dl | 51.5 ± 3.2 | 45.7 ± 1.7 | 44.5 ± 2.2 | 48.8 ± 1.8 | 30.6-73.8 |
| Stead-state | |||||
| Glucose, mg/dl | 101.2 ± 11 | 102.5 ± 0.8 | 94.9 ± 47 | 98.0 ± 0.6 | 82.5-111.0 |
| Insulin, μU/ml | 209.5 ± 125 | 227.0 ± 8.3 | 199.4 ± 34.2 | 217.7 ± 7.2 | 119.3-288.8 |
| Insulin sensitivity, mg• kg FFM−1• min−1 | 11.4 ± 0.8 | 9.1 ± 0.6* | 4.8 ± 1.4 | 5.7 ± 0.4 | 2.2-16.8 |
Multipliers for conversion to International System of Units: glucose 0.0556 (mmol/L); insulin 7.175 (pmol/L); triglycerides 0.0113 (mmol/L); Cholesterol, LDL, and HDL 0.0259 (mmol/L). Data are reported as unadjusted values and mean ± SEM. *African Americans versus Caucasians without diabetes, P < 0.03; # African Americans vs Caucasians with diabetes, P = 0.03
Relationships between metabolic flexibility and metabolic parameters
For the entire cohort, MF was inversely related to age (r = -0.41, P < 0.0001), fasting RQ (r = -0.22, P = 0.005), fasting glucose (r = -0.55, P < 0.0001), insulin (r = -0.40, P < 0.0001), and triglyceride (r = -0.44, P < 0.0001) concentrations, but positively correlated with insulin sensitivity (r = 0.69, P < 0.0001). When evaluating the correlation coefficients for each race separately, MF remained negatively and significantly correlated to age, fasting glucose, insulin, and triglyceride concentrations and positively correlated to insulin sensitivity for both racial groups. In Caucasians only, MF was negatively and significantly correlated to fasting RQ. In addition, when race was evaluated by gender, MF was positively correlated to insulin sensitivity in the female African Americans and Caucasians and male Caucasians (Figure 1A and B). However, only a trend existed for the male African Americans (Figure 1B).
Figure 1.
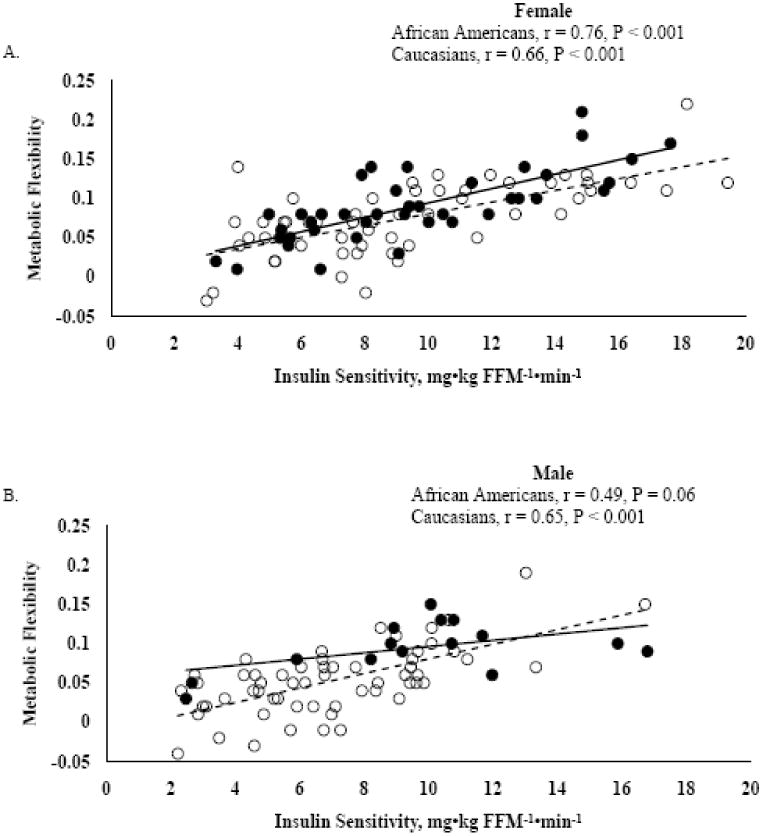
Correlation analysis between metabolic flexibility (insulin-stimulated RQ – fasting RQ) and insulin sensitivity. Figure A represents females (n = 95) and Figure B represents males (n = 73). African Americans (black circles and solid black line) and Caucasians (open circles and dashed line)
Metabolic flexibility
Predictors
Age, gender, diabetes status, fasting RQ, insulin sensitivity, fasting glucose, insulin, and triglyceride concentrations were the included variables in the stepwise multiple regression analysis. The only variables that remained significant in the model were insulin sensitivity, fasting RQ, triglyceride concentrations, diabetes status, and race (Table 2). Gender was not a significant predictor of MF. The predictors of MF explained 71% of the variability in MF with 48% being attributed by insulin sensitivity. Similar results were found after applying the same analysis to the change in non-protein RQ (results not reported).
Table 2. Predictors of Metabolic Flexibility.
| Partial R2 | Model R2 | Parameter estimate ± SE | P-value | |
|---|---|---|---|---|
| Insulin sensitivity, mg• kg FFM−1• min−1 | 0.48 | 0.48 | 0.0067 ± 0.0007 | < 0.0001 |
| Fasting RQ | 0.14 | 0.62 | -0.5114 ± 0.0585 | < 0.0001 |
| Triglycerides, mg/dl | 0.05 | 0.67 | -0.0001 ± 2.8E-05 | < 0.0001 |
| Diabetes Status | ||||
| No diabetes versus type 1 diabetes | 0.02 | 0.70 | 0.0179 ± 0.0052 | 0.0004 |
| Race | ||||
| African Americans versus Caucasians | 0.01 | 0.71 | -0.0112 ± 0.0045 | 0.0131 |
Linear statistical model (stepwise multiple regression) with 5 variables for predicting metabolic flexibility
Race
After adjustments for diabetes status, fat, and fat-free mass, the fasting RQ between the races did not differ (Figure 2A). However, after insulin-stimulation there was a difference between the racial groups. The ΔRQ (i.e. metabolic flexibility) was greater for African Americans versus Caucasians and remained significantly greater after controlling for insulin sensitivity, fasting RQ, triglyceride concentrations, and diabetes status (Adjusted values, 0.080 ± 0.004 versus 0.069 ± 0.002; Figure 2B-raw data or unadjusted values graphed).
Figure 2.
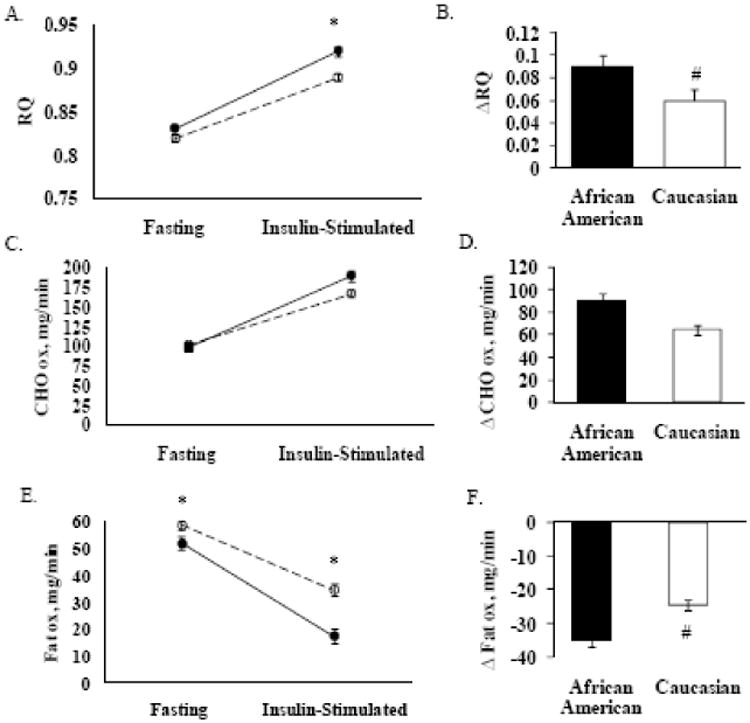
The raw data (unadjusted values) are presented in the figure for respiratory quotient (RQ), carbohydrate oxidation (CHO ox), and fat oxidation (fat ox). However, the P-value is based on the adjusted values. Figures A, C, and E demonstrate fasting and insulin-stimulated conditions in African Americans (black circle and black line, n = 55) versus Caucasians (open circle and dotted line, n = 113); *P ≤ 0.03, adjusted for diabetes status, fat and fat-free mass. Figures B, D, and F demonstrate change (Δ) in RQ, CHO ox, and fat ox in African Americans and Caucasians; #P ≤ 0.02, adjusted for insulin sensitivity, fasting variable (RQ, CHO, or fat), fasting triglyceride concentrations, and diabetes status.
Diabetes status
After adjustments for race, fat, and fat-free mass, the fasting RQ between individuals without diabetes and type 2 diabetes did not differ. However, there was a difference between the groups after insulin-stimulation (Adjusted values, no diabetes, 0.928 ± 0.005 and type 2 diabetes, 0.866 ± 0.004; P < 0.0001). Metabolic flexibility was higher in subjects without diabetes versus subjects with type 2 diabetes (Unadjusted values, 0.099 ± 0.004 versus 0.044±0.004, P < 0.0001) and remained significant after adjusting for all the metabolic predictors of metabolic flexibility (Adjusted values, 0.083 ± 0.003 versus 0.065 ± 0.004, P=0.003).
Carbohydrate and fat oxidation
The fasting and insulin-stimulated carbohydrate oxidation did not differ after adjusting for diabetes status, fat, and fat-free mass (Figure 2C). In addition, there were no racial differences in the Δ carbohydrate oxidation (Figure 2D). The fasting and insulin-stimulated fat oxidation were different between the African Americans and Caucasians (Figure 2E). The Δ fat oxidation was higher for African Americans versus Caucasians and remained significantly higher after controlling for insulin sensitivity, fasting fat oxidation, fasting triglyceride concentrations, and diabetes status (Adjusted values, -31.48 ± 1.60 versus -25.77 ± 1.06; Figure 2F- raw data or unadjusted values graphed).
Resting Metabolic Rate
After adjusting for diabetes status, gender, fat mass, fat-free mass, and age, the fasting RMR (Adjusted; 1486 ± 33 versus 1668 ± 18, P < 0.0001) was lower for African Americans versus Caucasians. After insulin-stimulation, the RMR (Adjusted; 1561 ± 33 versus 1738 ± 18, P < 0.0001) remained lower for African Americans versus Caucasians. The Δ RMR was not statistically significant between the racial groups.
Discussion
In this study, we confirmed that insulin sensitivity was the main predictor of whole-body MF to glucose as previously reported (6). In addition, metabolic factors such as fasting RQ and fasting triglyceride concentrations contributed to MF. Although the contribution was small, diabetes status and race were also significant determinant factors. Specifically, our data suggest that in response to an insulin/glucose infusion, MF was higher in African Americans and non-diabetic individuals as opposed to Caucasians and type 2 diabetic individuals.
Racial differences were also observed in another study (14). However, Berk et al. (14) concluded that African Americans had reduced MF (i.e., metabolically inflexible) when compared to Caucasians and did not suppress fatty acid oxidation in response to a dose of insulin. In addition, African Americans had a defect in substrate switching when dietary fat was increased whereas this switch was apparent in the Caucasians. Comparison of the current study data to previous data (14) was not feasible due to the definition of MF, dose of insulin to evaluate MF, fasting RQ between races, sample size, and phenotype of the population.
The current study evaluated MF as the change in RQ from the fasting to insulin-stimulated states (ΔRQ = insulin-stimulated RQ – fasting RQ) and this change was not evaluated in the reported study of Berk et al. (14). The goal of our study was to evaluate insulin sensitivity with the use of a one-step high dose insulin infusion (120 mU•m-2• min-1). With the high dose insulin infusion, suppression of free fatty acids should be maximal. However, the objective of the study conducted by Berk et al (14), as discussed above, was to assess lipolysis by infusing two lower insulin doses (2 and 8 mU•m-2• min-1). The average insulin levels for the study of Berk et al. (14) were approximately 6 μU/ml (40.8 pM) for the lower insulin dose and 17 μU/ml (125 pM) for the higher dose. Thus, there were marked differences in insulin levels evaluated between the two studies. Due to the current study's high insulin levels (average > 200 μU/ml) during the steady state, we were not able to evaluate suppression of fatty acid between the study cohorts. Unlike the previous study (14), the current study did not detect any racial differences at the fasting RQ. It has been suggested that fasting RQ can be influenced by the diet consumed before the testing procedure (17-19). In addition, Berk et al. (14) study was limited to a specific population of 18 participants (9 African Americans and 9 Caucasians) that were premenopausal and obese women whereas the current study included a larger population of men and women with different ranges of age, BMI, and insulin sensitivity.
Another important finding in the present study was that insulin sensitivity accounted for majority of the total variability in metabolic flexibility as previously reported (6). In addition, a smaller portion of the variability was contributed from diabetes status (non-diabetic versus type 2 diabetic individuals), fasting triglyceride concentrations, fasting RQ, and race. However, Galgani et al. (6) did not observe race and diabetes status as being significant predictors of MF. In the current and previous (6) studies, during a hyperinsulinemic-euglycemic clamp, MF was greater for non-diabetic versus type 2 diabetic individuals. After controlling for the main predictor of MF (i.e., insulin sensitivity), the differences between the groups remained significant for the current study and disappeared in the previous study (6). The discrepancy in these findings could possibly be due to the previous study's (6) smaller sample size (42 non-diabetic and 59 diabetic individuals) which may have limited the power to examine a change between groups and the ability of the regression model to detect other determinants of metabolic flexibility.
The strengths of the current study were the large number of individuals with a broad range of insulin sensitivity, stratification of race, and the detection of 71% of the variability in MF. Although, 71% of the total variability in MF was explained in our analytical model, we recognize that other variables not tested in the current study may be contributors to MF. Also, we evaluated one facet of whole-body MF, which was the ability of the body to switch from fat to carbohydrate oxidation after an insulin/glucose infusion (hyperinsulinemic-euglycemic clamp). Metabolic flexibility to a high carbohydrate and fat meal and/or diet was not evaluated, but they have been suggested as other measurements of MF (5, 13, 20).
In conclusion, our data support previous findings that suggest insulin sensitivity is the main contributor of MF in humans. However, the novelty of this data is that race and diabetes status are also significant contributors, although the contribution is considered small in comparison to insulin sensitivity. We demonstrated that African Americans have a higher MF after insulin-stimulation than Caucasians. These differences remained after controlling for the known physiologic factor (i.e., insulin sensitivity) modulating MF. Thus, this study provides evidence that racial differences and diabetes status should be considered when evaluating metabolic flexibility. The mechanisms and genetic factors contributing to the racial disparity in MF are not precisely known and further mechanistic and genetic research studies are warranted.
Acknowledgments
The authors would like to express their appreciation to the participants and the PBRC inpatient and outpatient unit staff who made it possible to complete this research project.
Support: This study was supported by National Institute of Health Grants RO1 DK060126 and T32 AT004094.
Footnotes
Conflict-of-interest/financial disclosure statement: The authors have no conflict-of-interest and no financial disclosure.
Publisher's Disclaimer: This is a PDF file of an unedited manuscript that has been accepted for publication. As a service to our customers we are providing this early version of the manuscript. The manuscript will undergo copyediting, typesetting, and review of the resulting proof before it is published in its final citable form. Please note that during the production process errors may be discovered which could affect the content, and all legal disclaimers that apply to the journal pertain.
References
- 1.Kelley DE, Mandarino LJ. Fuel selection in human skeletal muscle in insulin resistance: a reexamination. Diabetes. 2000;49:677–83. doi: 10.2337/diabetes.49.5.677. [DOI] [PubMed] [Google Scholar]
- 2.Mogensen M, Sahlin K, Fernstrom M, et al. Mitochondrial respiration is decreased in skeletal muscle of patients with type 2 diabetes. Diabetes. 2007;56:1592–9. doi: 10.2337/db06-0981. [DOI] [PubMed] [Google Scholar]
- 3.Ritov VB, Menshikova EV, He J, Ferrell RE, Goodpaster BH, Kelley DE. Deficiency of subsarcolemmal mitochondria in obesity and type 2 diabetes. Diabetes. 2005;54:8–14. doi: 10.2337/diabetes.54.1.8. [DOI] [PubMed] [Google Scholar]
- 4.Kelley DE, Goodpaster B, Wing RR, Simoneau JA. Skeletal muscle fatty acid metabolism in association with insulin resistance, obesity, and weight loss. Am J Physiol. 1999;277:E1130–41. doi: 10.1152/ajpendo.1999.277.6.E1130. [DOI] [PubMed] [Google Scholar]
- 5.Ukropcova B, Sereda O, de Jonge L, et al. Family history of diabetes links impaired substrate switching and reduced mitochondrial content in skeletal muscle. Diabetes. 2007;56:720–7. doi: 10.2337/db06-0521. [DOI] [PubMed] [Google Scholar]
- 6.Galgani JE, Heilbronn LK, Azuma K, et al. Metabolic flexibility in response to glucose is not impaired in people with type 2 diabetes after controlling for glucose disposal rate. Diabetes. 2008;57:841, 5. doi: 10.2337/db08-0043. [DOI] [PMC free article] [PubMed] [Google Scholar]
- 7.Galgani JE, Moro C, Ravussin E. Metabolic flexibility and insulin resistance. Am J Physiol Endocrinol Metab. 2008;295:E1009–17. doi: 10.1152/ajpendo.90558.2008. [DOI] [PMC free article] [PubMed] [Google Scholar]
- 8.Ogden CL, Carroll MD, Curtin LR, McDowell MA, Tabak CJ, Flegal KM. Prevalence of overweight and obesity in the United States, 1999-2004. JAMA. 2006;295:1549–55. doi: 10.1001/jama.295.13.1549. [DOI] [PubMed] [Google Scholar]
- 9.Cowie CC, Rust KF, Byrd-Holt DD, et al. Prevalence of diabetes and impaired fasting glucose i adults in the U.S. population: National Health And Nutrition Examination Survey 1999-2002. Diabetes Care. 2006;29:1263–8. doi: 10.2337/dc06-0062. [DOI] [PubMed] [Google Scholar]
- 10.Privette JD, Hickner RC, Macdonald KG, Pories WJ, Barakat HA. Fatty acid oxidation by skeletal muscle homogenates from morbidly obese black and white American women. Metabolism. 2003;52:735–8. doi: 10.1016/s0026-0495(03)00034-9. [DOI] [PubMed] [Google Scholar]
- 11.Carpenter WH, Fonong T, Toth MJ, et al. Total daily energy expenditure in free-living older African-Americans and Caucasians. Am J Physiol. 1998;274:E96–101. doi: 10.1152/ajpendo.1998.274.1.E96. [DOI] [PubMed] [Google Scholar]
- 12.Melby CL, Ho RC, Jeckel K, Beal L, Goran M, Donahoo WT. Comparison of risk factors for obesity in young, nonobese African-American and Caucasian women. Int J Obes Relat Metab Disord. 2000;24:1514–22. doi: 10.1038/sj.ijo.0801413. [DOI] [PubMed] [Google Scholar]
- 13.Weyer C, Snitker S, Bogardus C, Ravussin E. Energy metabolism in African Americans: potential risk factors for obesity. Am J Clin Nutr. 1999;70:13–20. doi: 10.1093/ajcn/70.1.13. [DOI] [PubMed] [Google Scholar]
- 14.Berk ES, Kovera AJ, Boozer CN, Pi-Sunyer FX, Albu JB. Metabolic inflexibility in substrate use is present in African-American but not Caucasian healthy, premenopausal, nondiabetic women. J Clin Endocrinol Metab. 2006;91:4099–106. doi: 10.1210/jc.2005-2411. [DOI] [PMC free article] [PubMed] [Google Scholar]
- 15.DeFronzo RA, Tobin JD, Andres R. Glucose clamp technique: a method for quantifying insulin secretion and resistance. Am J Physiol. 1979;237:E214–23. doi: 10.1152/ajpendo.1979.237.3.E214. [DOI] [PubMed] [Google Scholar]
- 16.Jequier E, Acheson K, Schutz Y. Assessment of energy expenditure and fuel utilization in man. Annu Rev Nutr. 1987;7:187–208. doi: 10.1146/annurev.nu.07.070187.001155. [DOI] [PubMed] [Google Scholar]
- 17.Hurni M, Burnand B, Pittet P, Jequier E. Metabolic effects of a mixed and a high-carbohydrate low-fat diet in man, measured over 24 h in a respiration chamber. Br J Nutr. 1982;47:33–43. doi: 10.1079/bjn19820006. [DOI] [PubMed] [Google Scholar]
- 18.McNeill G, Bruce AC, Ralph A, James WP. Inter-individual differences in fasting nutrient oxidation and the influence of diet composition. Int J Obes. 1988;12:455–63. [PubMed] [Google Scholar]
- 19.Schutz Y. The adjustment of energy expenditure and oxidation to energy intake: the role of carbohydrate and fat balance. Int J Obes Relat Metab Disord. 1993;17(Suppl 3):S23–7. discussion S41-2. [PubMed] [Google Scholar]
- 20.Kelley DE, Simoneau JA. Impaired free fatty acid utilization by skeletal muscle in non-insulin-dependent diabetes mellitus. J Clin Invest. 1994;94:2349–56. doi: 10.1172/JCI117600. [DOI] [PMC free article] [PubMed] [Google Scholar]