

Abstract
Background
Existing risk stratification tools have limitations and clinical experience suggests they are not used routinely. The aim of this study was to develop and validate a preoperative risk stratification tool to predict 30-day mortality after non-cardiac surgery in adults by analysis of data from the observational National Confidential Enquiry into Patient Outcome and Death (NCEPOD) Knowing the Risk study.
Methods
The data set was split into derivation and validation cohorts. Logistic regression was used to construct a model in the derivation cohort to create the Surgical Outcome Risk Tool (SORT), which was tested in the validation cohort.
Results
Prospective data for 19 097 cases in 326 hospitals were obtained from the NCEPOD study. Following exclusion of 2309, details of 16 788 patients were analysed (derivation cohort 11 219, validation cohort 5569). A model of 45 risk factors was refined on repeated regression analyses to develop a model comprising six variables: American Society of Anesthesiologists Physical Status (ASA-PS) grade, urgency of surgery (expedited, urgent, immediate), high-risk surgical specialty (gastrointestinal, thoracic, vascular), surgical severity (from minor to complex major), cancer and age 65 years or over. In the validation cohort, the SORT was well calibrated and demonstrated better discrimination than the ASA-PS and Surgical Risk Scale; areas under the receiver operating characteristic (ROC) curve were 0·91 (95 per cent c.i. 0·88 to 0·94), 0·87 (0·84 to 0·91) and 0·88 (0·84 to 0·92) respectively (P < 0·001).
Conclusion
The SORT allows rapid and simple data entry of six preoperative variables, and provides a percentage mortality risk for individuals undergoing surgery.
Introduction
Approximately 8 million surgical procedures are performed in the UK each year, and 230 million worldwide1. Accurate risk stratification facilitates meaningful informed patient consent and shared decision-making. It might also identify high-risk patients who could benefit from targeted interventions including goal-directed fluid therapy2, postoperative respiratory support3 and admission to critical care4. There is some evidence that appropriately targeted interventions5 can reduce mortality6,7, morbidity and length of hospital stay8.
Clinical judgement alone is not a reliable predictor of adverse outcome9. Thus a variety of risk assessment tools have been developed to help clinicians calculate perioperative risk10 that complement investigations for identifying high-risk patients, such as cardiopulmonary exercise testing11,12 and biomarker assays13. Exercise testing facilities are not available routinely14,15 and are inappropriate in urgent or emergency surgical patients. The potential value of biomarkers such as N-terminal pro-B-type natriuretic peptide is still emerging16–18. Risk stratification tools remain the most readily and widely available means of determining perioperative risk.
Some risk stratification tools consist entirely of preoperative variables, such as the American Society of Anesthesiologists Physical Status (ASA-PS) grade19 and the Surgical Risk Scale (SRS)20. Other tools combine preoperative data with intraoperative/postoperative variables, such as the Physiological and Operative Severity Score for the enUmeration of Mortality and morbidity (POSSUM)21, and the subsequent Portsmouth version (P-POSSUM)22. Clinical experience suggests that their incorporation into clinical practice is variable. Reluctance to use them may relate to concerns over the accuracy, complexity23 and/or accessibility of data, for example if a blood test is required. A recent systematic review23 of risk stratification tools validated in heterogeneous patient cohorts found that P-POSSUM and the SRS were the most widely validated and accurate risk stratification tools available. However, both have their limitations. Overall, clinical experience suggests that existing risk stratification tools are not widely used in the UK or elsewhere.
In 2011, the National Confidential Enquiry into Patient Outcome and Death (NCEPOD) published Knowing the Risk, a report assessing perioperative care14. Key recommendations included the introduction of a national system to identify patients at high risk of morbidity and death after surgery; and that a mortality risk assessment should be made explicit to patients before surgery, and documented on the consent form. It was also recommended that high-risk patients be identified before operation to aid planning and provision of critical care resources. An important step towards meeting these recommendations would be achieved by a risk stratification tool that consisted entirely of readily available preoperative variables which enabled easy calculation of a predicted percentage mortality. Thus, a post hoc analysis of data collected in the Knowing the Risk study was conducted, to develop and validate a risk stratification tool that met these requirements, and compare it with existing preoperative risk stratification tools.
Methods
The Knowing the Risk study was a prospective, multicentre, observational cohort study. The initial data collection was undertaken for 7 days from midnight on 1 March until midnight on 8 March 2010. National Health Service (NHS) hospitals in England, Wales and Northern Ireland, public hospitals in the Isle of Man, Guernsey and Jersey, and independent-sector hospitals in all these regions, were invited to participate. Perioperative data were collected on paper forms by anaesthetists at the time of surgery. Details of the study design and data collection methodology have been described previously14 and an extract of the form can be found in Appendix S1 (supporting information). Data were collected without obtaining patient consent or ethical approval as the study was not defined as research under the Health Research Authority (formerly National Research Ethics Service). However, Section 251 approval had been obtained from the Health Research Authority Confidentiality Advisory Group (formerly the National Information Governance Board, NIGB) to collect identifiable data without consent. For the work described here, further NIGB approval was obtained to extend the data-holding interval for England and Wales. Data Access Agreements were drawn up for each Northern Ireland Trust during the Knowing the Risk study. Approval was subsequently obtained from the Privacy Advisory Committee for Northern Ireland to extend the data-holding interval.
Inclusion/exclusion criteria
Data were analysed for patients aged 16 years or over who underwent surgery of any urgency (immediate, urgent, expedited or elective) and required a planned overnight admission. Surgery was defined as a procedure performed in an operating theatre by a surgeon. Patients undergoing day-case surgery, obstetric procedures, neurosurgery, cardiac or transplant surgery were excluded. If a patient had more than one procedure during the study interval, data for the most complex procedure were used. Patients were excluded if any of the following key variables were missing: age/date of birth, operative procedure or urgency, operation date and surgical severity, ASA-PS grade and mortality status.
Data set
In the prospectively collected Knowing the Risk data set, the surgical procedure was described using free text. In the analysis described below, data coders used this to categorize each procedure according to surgical type (for example abdominal – gastrointestinal) and severity. Where the free-text surgical procedure was missing, the operation was identified from OPCS coding obtained retrospectively using patient identifiers provided during the initial study. Severity coding into four categories (minor, intermediate, major or extra major (Xmajor)/complex) was based on the reference manual for the AXA Specialist Procedure Codes24, which is used to grade the magnitude of surgical procedures in UK independent hospitals. A comparison of the surgical severity for all orthopaedic and gastrointestinal surgical procedures (the two most common surgical specialty groups in the study sample) was made to assess similarities between the AXA and British United Provident Association (BUPA) coding schedules, as the BUPA schedule has been used in previous studies20. Clinical judgement was used for procedures falling under more than one surgical type, and where there was no listing for a procedure in the AXA schedule. Two clinical reviewers reached agreement on how to classify such procedures.
Data on deaths within 30 days were provided retrospectively by each hospital. In addition, following publication of the Knowing the Risk report, further data cleaning and collection were undertaken to complete missing data. Data linkage with the Office for National Statistics (ONS) (for England and Wales) and the Northern Ireland Statistics and Research Agency (NISRA) was used to validate dates of deaths and provide further mortality data. The final data linkage exercises took place on 8 February 2013 (ONS) and 26 March 2013 (NISRA), approximately 3 years after the initial data collection.
Statistical analysis
Univariable analyses were performed initially using χ2 testing to assess the relationship between each independent variable and 30-day mortality. Variables that were not available for more than 10 per cent of patients were omitted from the analyses. In addition, 44·7 per cent of height and 31·7 per cent of weight data were estimated, so body mass index was not entered as a variable owing to the likelihood of inaccurate estimates25.
Subsequently, the data set was divided randomly into two cohorts: a derivation cohort of approximately two-thirds of the sample, and a validation cohort consisting of the remainder, as described previously26,27. Logistic regression was used to construct a model to predict 30-day mortality in the derivation cohort. All variables that were significant on univariable analysis at P < 0·100 were entered into the initial model. Age was treated as a categorical variable, with cut-offs at 65 and 80 years, based on inspection of a locally weighted scatter plot curve. All co-morbidity variables were included as indicator variables. High-risk surgical specialty was included as a binary indicator variable, with vascular, gastrointestinal and thoracic surgery defined as the high-risk specialties26. In addition, interactions between each co-morbidity and each age category were tested, with each of three ASA-PS categories: high (ASA-PS IV or V), medium (III) or low (I or II). The interaction between cancer and the expedited surgery category was also tested. Variables were dropped from the model sequentially on repeated regression analyses, initially at P > 0·100, and then P > 0·050.
The final restricted model constructed from the derivation cohort was then tested on the validation cohort. A risk score was derived for each patient by summating the model coefficients for risk factors present. This was then converted into a percentage risk using the formula:
where R is the risk of 30-day mortality, and the constant was derived from the logistic regression model.
The accuracy of this novel risk stratification tool, the Surgical Outcome Risk Tool (SORT), was then assessed in the validation cohort by calculating the area under the receiver operating characteristic curve (AUROC) to measure discrimination and using the Hosmer–Lemeshow test to assess calibration. The AUROC has a value between 0·5 and 1·0, where 0·5 is equivalent to guessing, and 1·0 indicates perfect predictive accuracy. Previous work has described an AUROC of less than 0·7 to indicate poor performance, 0·7–0·9 to indicate moderate performance, and over 0·9 to indicate high performance23,28. The Hosmer–Lemeshow test compares observed and predicted event rates across a range of predicted risk. A non-significant test result indicates that a model is well calibrated.
Finally, χ2 testing was used to compare the accuracy of the SORT (as measured by AUROC) and two previously published risk stratification tools: ASA-PS19 and a modified version of the SRS (with the 4 classes of surgical severity described above, rather than 5 as originally defined)20. The calibration of the SRS was tested using the Hosmer–Lemeshow test.
All data were analysed using Microsoft® Excel 2010 (Microsoft, Redmond, Washington, USA) and Stata® InterCooled 12 (StataCorp LP, College Station, Texas, USA). An app and web-based calculator were developed to facilitate risk calculation at the bedside.
Results
A total of 19 097 case report forms were collected from 326 hospitals (Fig. 1). Characteristics of the 916 patients whose mortality data were unobtainable were similar to those of the final sample used in the analysis (Table 1). The mortality rate was lower among the 2047 patients who were excluded owing to missing data (Fig. 1) than in the included patients (0·6 versus 1·4 per cent; P = 0·003). After exclusions, the sample size for analysis was 16 788, of which the derivation cohort comprised 11 219 patients and the validation cohort 5569. Descriptive data for these cohorts are summarized in Tables 2 and 3. Comparison of the surgical severity of 510 different surgical procedures in the AXA and BUPA schedules encompassed 5903 orthopaedic and 2666 gastrointestinal surgical procedures. Only 18 procedures (3·5 per cent) were coded differently, and in all instances the difference in grading was between consecutive categories.
Figure 1.
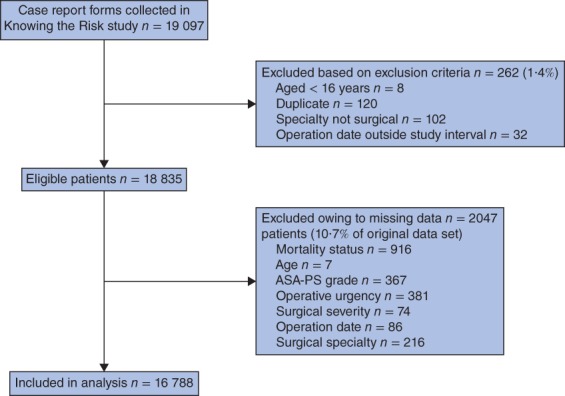
Reasons for exclusion from the study. ASA-PS, American Society of Anesthesiologists Physical Status
Table 1.
Descriptive data for patients excluded for missing mortality status in comparison with the whole data set
| Mortality data missing (n = 916) | Mortality data known (n = 16 788) | |
|---|---|---|
| Mean age (years) | 60·5 | 55·8 |
| Missing data | 59 (6·4) | – |
| Sex ratio (M : F) | 428 : 488 | 7481 : 9307 |
| ASA-PS grade | ||
| I | 253 (27·6) | 5416 (32·3) |
| II | 370 (40·4) | 7585 (45·2) |
| III | 179 (19·5) | 3339 (19·9) |
| IV | 28 (3·1) | 417 (2·5) |
| V | 1 (0·1) | 31 (0·2) |
| Missing data | 85 (9·3) | – |
| Urgency of surgery | ||
| Elective | 569 (62·1) | 10 987 (65·4) |
| Expedited | 95 (10·4) | 2136 (12·7) |
| Urgent | 176 (19·2) | 3424 (20·4) |
| Immediate | 8 (0·9) | 241 (1·4) |
| Missing data | 68 (7·4) | – |
| Severity | ||
| Minor | 72 (7·9) | 1423 (8·5) |
| Intermediate | 188 (20·5) | 4134 (24·6) |
| Major | 281 (30·7) | 5488 (32·7) |
| Xmajor/complex | 299 (32·6) | 5743 (34·2) |
| Missing data | 76 (8·3) | – |
| Co-morbidities | ||
| None documented | 551 (60·2) | 9472 (56·4) |
| Arrhythmia | 85 (9·3) | 1177 (7·0) |
| Cancer | 84 (9·2) | 1649 (9·8) |
| Cirrhosis | 10 (1·1) | 123 (0·7) |
| Congestive cardiac failure | 26 (2·8) | 276 (1·6) |
| Smoker | 71 (7·8) | 1689 (10·1) |
| Diabetes (insulin-dependent) | 15 (1·6) | 445 (2·7) |
| Diabetes (non-insulin-dependent) | 58 (6·3) | 1128 (6·7) |
| Ischaemic heart disease | 99 (10·8) | 1635 (9·7) |
| Respiratory disease | 109 (11·9) | 2082 (12·4) |
| TIA/stroke | 34 (3·7) | 677 (4·0) |
Values in parentheses are percentages. ASA-PS, American Society of Anesthesiologists Physical Status; Xmajor, extra major; TIA, transient ischaemic attack.
Table 2.
Descriptive data for the study, including 30-day mortality
| Derivation cohort | Validation cohort | Whole data set | ||||
|---|---|---|---|---|---|---|
| No. of patients | Mortality (%) | No. of patients | Mortality (%) | No. of patients | Mortality (%) | |
| All patients | 11 219 (100) | 1·3 | 5569 (100) | 1·6 | 16 788 (100) | 1·4 |
| Age (years) | ||||||
| < 65 | 6989 (62·3) | 0·4 | 3506 (63·0) | 0·7 | 10 495 (62·5) | 0·5 |
| ≥ 65 and < 80 | 3073 (27·4) | 1·6 | 1495 (26·8) | 1·5 | 4568 (27·2) | 1·6 |
| ≥ 80 | 1157 (10·3) | 6·1 | 568 (10·2) | 7·0 | 1725 (10·3) | 6·4 |
| ASA-PS grade | ||||||
| I | 3616 (32·2) | 0·1 | 1800 (32·3) | 0·0 | 5416 (32·3) | 0·0 |
| II | 5108 (45·5) | 0·5 | 2477 (44·5) | 0·5 | 7585 (45·2) | 0·5 |
| III | 2190 (19·5) | 3·1 | 1149 (20·6) | 3·5 | 3339 (19·9) | 3·2 |
| IV | 286 (2·5) | 14·7 | 131 (2·4) | 20·6 | 417 (2·5) | 16·5 |
| V | 19 (0·2) | 63 | 12 (0·2) | 58 | 31 (0·2) | 61 |
| Urgency of surgery | ||||||
| Elective | 7374 (65·7) | 0·3 | 3613 (64·9) | 0·4 | 10 987 (65·4) | 0·3 |
| Expedited | 1415 (12·6) | 2·1 | 721 (12·9) | 1·4 | 2136 (12·7) | 1·9 |
| Urgent | 2282 (20·3) | 3·2 | 1142 (20·5) | 4·6 | 3424 (20·4) | 3·7 |
| Immediate | 148 (1·3) | 15·5 | 93 (1·7) | 11 | 241 (1·4) | 13·7 |
| Severity | ||||||
| Minor | 935 (8·3) | 0·7 | 488 (8·8) | 1·0 | 1423 (8·5) | 0·8 |
| Intermediate | 2743 (24·4) | 0·8 | 1391 (25·0) | 0·7 | 4134 (24·6) | 0·8 |
| Major | 3680 (32·8) | 1·1 | 1808 (32·5) | 1·4 | 5488 (32·7) | 1·2 |
| Xmajor/complex | 3861 (34·4) | 2·0 | 1882 (33·8) | 2·4 | 5743 (34·2) | 2·1 |
| Co-morbidities | ||||||
| None documented | 6363 (56·7) | 0·3 | 3109 (55·8) | 0·4 | 9472 (56·4) | 0·3 |
| Arrhythmia | 795 (7·1) | 5·7 | 382 (6·9) | 6·3 | 1177 (7·0) | 5·9 |
| Cancer | 1111 (9·9) | 3·5 | 538 (9·7) | 4·6 | 1649 (9·8) | 3·9 |
| Cirrhosis | 84 (0·7) | 5 | 39 (0·7) | 10 | 123 (0·7) | 6·5 |
| Congestive cardiac failure | 177 (1·6) | 11·3 | 99 (1·8) | 9 | 276 (1·6) | 10·5 |
| Smoker | 1106 (9·9) | 0·9 | 583 (10·5) | 1·7 | 1689 (10·1) | 1·2 |
| Diabetes (insulin-dependent) | 303 (2·7) | 3·3 | 142 (2·5) | 2·1 | 445 (2·7) | 2·9 |
| Diabetes (non-insulin-dependent) | 718 (6·4) | 2·8 | 410 (7·4) | 2·7 | 1128 (6·7) | 2·7 |
| Ischaemic heart disease | 1079 (9·6) | 3·0 | 556 (10·0) | 5·0 | 1635 (9·7) | 3·7 |
| Respiratory disease | 1362 (12·1) | 3·5 | 720 (12·9) | 4·3 | 2082 (12·4) | 3·7 |
| TIA/stroke | 468 (4·2) | 5·3 | 209 (3·8) | 4·8 | 677 (4·0) | 5·2 |
Values in parentheses are percentages. ASA-PS, American Society of Anesthesiologists Physical Status; Xmajor, extra major; TIA, transient ischaemic attack.
Table 3.
Specialty case mix in the derivation and validation cohorts
| No. of patients | |||
|---|---|---|---|
| Derivation | Validation | Total | |
| Abdominal (bariatric) | 46 | 28 | 74 |
| Abdominal (endocrine) | 4 | 0 | 4 |
| Abdominal (gastrointestinal) | 1802 | 864 | 2666 |
| Abdominal (hepatobiliary) | 440 | 222 | 662 |
| Body surface (breast) | 561 | 274 | 835 |
| Body surface (other) | 389 | 200 | 589 |
| Endocrine | 142 | 72 | 214 |
| Gynaecology | 1164 | 594 | 1758 |
| Head and neck | 848 | 409 | 1257 |
| Ophthalmology | 126 | 73 | 199 |
| Orthopaedics | 3945 | 1958 | 5903 |
| Thoracic | 120 | 71 | 191 |
| Urology | 1135 | 569 | 1704 |
| Vascular | 497 | 235 | 732 |
| Total | 11 219 | 5569 | 16 788 |
Model development and derivation
Creatinine and haemoglobin results were excluded from analyses because of the large proportion of missing data (27·2 and 28·3 per cent respectively). Neither sex nor smoking history was associated significantly with 30-day mortality on univariable analysis, and so these were excluded from the multivariable analysis. Forty-five variables were included in the initial model (Table S1, supporting information). Stepwise sequential analyses based on significance testing led to a final model of six variables that were independent predictors of 30-day mortality (Table 4).
Table 4.
Restricted model of six variables following the analyses
| Coefficient | Standard error | 95% c.i. | z | P | |
|---|---|---|---|---|---|
| ASA-PS grade | |||||
| III | 1·411 | 0·248 | 0·925, 1·900 | 5·69 | < 0·001 |
| IV | 2·388 | 0·290 | 1·821, 2·956 | 8·25 | < 0·001 |
| V | 4·081 | 0·596 | 2·911, 5·251 | 6·84 | < 0·001 |
| Urgency of surgery | |||||
| Expedited | 1·236 | 0·296 | 0·657, 1·812 | 4·18 | < 0·001 |
| Urgent | 1·657 | 0·259 | 1·149, 2·164 | 6·40 | < 0·001 |
| Immediate | 2·452 | 0·410 | 1·649, 3·256 | 5·98 | < 0·001 |
| Specialty | |||||
| High-risk specialty (gastrointestinal, thoracic or vascular) | 0·712 | 0·188 | 0·344, 1·081 | 3·79 | < 0·001 |
| Severity of surgery | |||||
| Xmajor/complex | 0·381 | 0·185 | 0·019, 0·744 | 2·06 | 0·039 |
| Cancer | 0·667 | 0·211 | 0·253, 1·081 | 3·16 | 0·002 |
| Age (years) | |||||
| 65–79 | 0·777 | 0·258 | 0·272, 1·281 | 3·02 | 0·003 |
| ≥ 80 | 1·591 | 0·260 | 1·082, 2·010 | 6·12 | < 0·001 |
ASA-PS, American Society of Anesthesiologists Physical Status; Xmajor, extra major.
The model coefficients were then used to develop a formula for a risk score as follows, where each variable is assigned a value of 1 if present and 0 if absent:
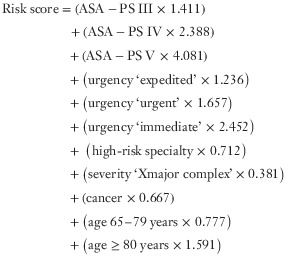 |
This score was then converted into a percentage risk of 30-day mortality using the formula described in the methods, with a constant of −7·366.
When these calculations were used to produce a percentage predicted mortality for each patient in the validation cohort, the AUROC for 30-day mortality was 0·91, indicating high discrimination. The P value for the Hosmer–Lemeshow χ2 test was 0·204, indicating that the new model was well calibrated in the validation cohort. Observed and predicted mortality rates for the SORT are shown in Fig. 2 and Table 5.
Figure 2.
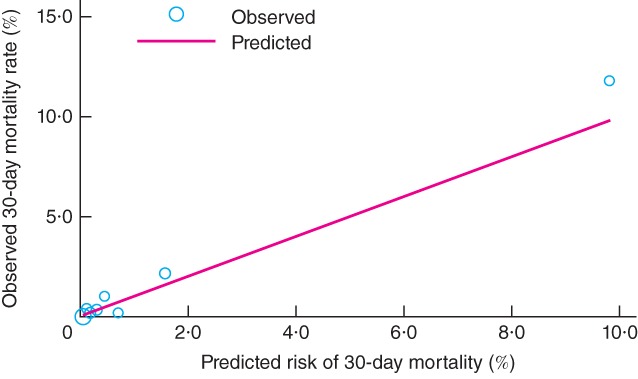
Observed versus predicted 30-day mortality at varying levels of risk in the validation cohort of 5569 patients undergoing non-cardiac surgery. Circle size corresponds to the proportion of patients at each level of risk
Table 5.
Observed versus predicted mortality in validation cohort in nine quantiles, with Hosmer–Lemeshow statistic
| Quantile | No. of patients | Mean SORT estimated probability of death (%) | Observed deaths at 30 days | Predicted deaths at 30 days | Hosmer–Lemeshow statistic |
|---|---|---|---|---|---|
| 1 | 1220 | 0·063 | 0 (0) | 0·8 (0·1) | 0·77 |
| 2 | 496 | 0·093 | 0 (0) | 0·5 (0·1) | 0·46 |
| 3 | 523 | 0·134 | 2 (0·4) | 0·7 (0·1) | 2·41 |
| 4 | 572 | 0·206 | 1 (0·2) | 1·2 (0·2) | 0·03 |
| 5 | 617 | 0·309 | 2 (0·3) | 1·9 (0·3) | 0·00 |
| 6 | 510 | 0·463 | 5 (1·0) | 2·4 (0·5) | 2·96 |
| 7 | 527 | 0·723 | 1 (0·2) | 3·8 (0·7) | 2·09 |
| 8 | 561 | 1·595 | 12 (2·1) | 8·9 (1·6) | 1·07 |
| 9 | 543 | 9·818 | 64 (11·8) | 53·3 (9·8) | 2·37 |
| Total | 5569 | 1·319 | 87 (1·6) | 73·4 (1·3) | 12·16 |
Values in parentheses are percentages. Nine quantiles were used (rather than 10) because of ties within groups. SORT, Surgical Outcome Risk Tool. χ2 = 12·16, P = 0·204.
The discrimination of the SORT was also tested in seven surgical specialty subgroups for which there were at least 100 patients and at least one death in the validation cohort, to enable AUROC curves to be calculated (Table 6). Discrimination in these subgroups varied between moderate (AUROC 0·82 for hepatobiliary surgery) and excellent (AUROC 0·96 for head and neck surgery).
Table 6.
Area under the receiver operating characteristic (ROC) curves for surgical subspecialty groups
| No. of patients in validation cohort | AUROC of SORT | |
|---|---|---|
| Orthopaedics | 1958 | 0·93 |
| Gastrointestinal | 864 | 0·88 |
| Urology | 569 | 0·95 |
| Head and neck | 409 | 0·96 |
| Vascular | 235 | 0·84 |
| Hepatobiliary | 222 | 0·82 |
| Body surface (other) | 200 | 0·87 |
AUROC, area under the receiver operating characteristic curve; SORT, Surgical Outcome Risk Tool.
Comparison with previously validated risk stratification tools
Both the ASA-PS and the SRS demonstrated moderately good discrimination when tested in the validation cohort: AUROC 0·87 (95 per cent c.i. 0·84 to 0·91) and 0·88 (0·84 to 0·92) respectively. However, the SORT was significantly more accurate, with an AUROC of 0·91 (0·88 to 0·94) (P < 0·001) (Fig. 3). Furthermore, the SRS was poorly calibrated (P < 0·001, Hosmer–Lemeshow χ2 test). Examination of observed : predicted ratios at different levels of risk demonstrated that the SRS overestimated risk in all but the highest-risk patients.
Figure 3.
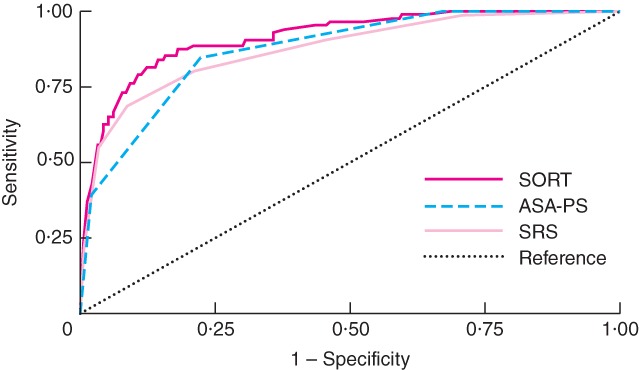
Receiver operating characteristic (ROC) curves for the Surgical Outcome Risk Tool (SORT), American Society of Anesthesiologists Physical Status (ASA-PS) grade and Surgical Risk Scale (SRS) for the validation cohort of 5569 patients undergoing non-cardiac surgery. The areas under the ROC curves were 0·91 (95 per cent c.i. 0·88 to 0·94), 0·87 (0·84 to 0·91) and 0·88 (0·84 to 0·92) respectively
Discussion
A novel risk stratification tool comprising six preoperative variables was developed and validated internally to predict 30-day mortality in adults undergoing non-cardiac non-neurological inpatient surgery. Internal validation demonstrated the SORT to be more accurate than the ASA-PS and the SRS. There remain barriers to the routine use of risk stratification, including extensive data collection and data entry, the use of intraoperative and postoperative variables, and the inability to calculate an individual percentage mortality risk. By addressing these issues in this model, and developing an app and web-based calculator, the SORT has the potential to become used more widely. Although developed as a risk prediction tool before surgery, the SORT may also be valid as a risk adjustment tool in post hoc analyses of clinical performance, and thus aid epidemiological research and comparative audit.
All the variables in the SORT are known predictors of adverse outcome after surgery21,26,29–33. Surgical severity is a significant contributor to postoperative mortality risk. The AXA-PPP system is an objective and widely used measure of operative severity, which employs the same classification method (Clinical Coding and Schedule Development group), and is very similar to the BUPA schedule used in the SRS20. Although both have their limitations, an objective method of defining surgical severity is likely to reduce inter-rater variability and should therefore improve the accuracy of the SORT in clinical practice.
Some variables previously associated with risk of surgical mortality, such as raised body mass index, low haemoglobin and raised creatinine level34–37, were omitted from the analyses owing to poor data collection rates during the initial study. For the SORT to be used routinely, the speed and simplicity of collecting variables were important features to retain. Therefore, a choice was made not to use imputation to derive missing data. The SORT demonstrated high performance (AUROC over 0·9) in internal validation, so the inclusion of other variables is likely to have had only a minimal impact on performance, at the risk of making the tool less easy to use. Including a larger number of variables, such as described previously38, would greatly increase the time taken to collect data, and thereby decrease the usability of the tool. The inclusion of haematological and biochemical variables would have prevented the SORT being used when blood results were not available. With respect to body mass index, there is evidence that other measurements such as waist–hip ratio, waist-to-height ratio and waist circumference are better predictors of risk39,40.
One co-morbidity that did not reach significance in the final model, despite being highly predictive of mortality on univariable analysis, was congestive cardiac failure. This may seem surprising given the known association between cardiac failure and outcome in surgical patients. Adjustment for ASA-PS grade, which is a reflection of functional capacity, is likely to explain this finding.
Systematic review23 has previously identified P-POSSUM and SRS as the most accurate methods of perioperative risk stratification in heterogeneous cohorts23. Even though P-POSSUM has been validated multiply, it is still not used widely. The SORT has a number of advantages. First, it is a parsimonious model, consisting of only six preoperative variables, compared with 18 preoperative, intraoperative and postoperative variables for P-POSSUM. Second, POSSUM was originally designed as a post hoc audit tool. When risk assessment is arguably the most important (in the preoperative assessment clinic or emergency department), many variables required to compute the preoperative part of P-POSSUM (for example blood results) may not be available. Furthermore, P-POSSUM contains subjective variables, such as interpretation of a chest radiograph, and potential interobserver variability may affect its accuracy.
Conversely, the population-based ASA-PS is a widely used measure of perioperative risk, and has face validity as a measure of functional capacity. Although it was demonstrated to be a moderately accurate predictor of outcome in the present analysis, at least four previous studies found that it lacked accuracy when tested in heterogeneous cohorts23. The lack of discrimination between patients in ASA-PS grade III is a particular limitation. A cut-off of 10 per cent predicted short-term mortality risk has been recommended when considering strategies to improve perioperative care and outcome, including planned critical care admission41. The population mortality of patients with ASA-PS grade III in this study was 3·2 per cent, and that of the ASA-PS grade IV population was 16·5 per cent; these findings are broadly consistent with other studies30. Thus there is a need to be able to discriminate between patients in the ASA-PS grade III population, which can be achieved only by using a tool with more variables.
The SRS was also designed as a risk adjustment tool for comparative audit. Although it has been identified as a promising alternative to more complex risk stratification tools23, previous validation studies are limited to two analyses from the same collaborators20,33, and a subsequent external validation that included only urgent or emergency surgery in a single hospital42. The analysis undertaken in the present study demonstrated that the SRS overestimated risk in all but the highest-risk patients.
Encouraging the widespread and routine use of risk prediction tools is a challenge. Ease of use and face validity are two important factors that may influence this, and which have been addressed for the SORT. With easily available preoperative data, and an app or web-based calculator, it is hoped that adoption of the SORT may exceed that of other models.
The present study has strengths and some weaknesses. It is the largest study validating risk stratification tools prospectively in a heterogeneous cohort of patients undergoing non-cardiac surgery in the UK23. Despite the large sample size, some selection bias may have occurred as the data capture did not encompass all patients undergoing surgery in the study week. Furthermore, it was not possible to determine whether 4·9 per cent of patients who met the inclusion criteria were dead or alive, despite linkage with national databases. In all instances, this was because key demographic information required for data linkage (such as NHS number) was missing. Despite these limitations, the sample analysed was representative, and had face validity, as the prevalence of co-morbid risk factors and 30-day mortality statistics were broadly similar to those reported previously32,43. The results are generalizable owing to the broad representation of size and types of hospital, the inclusion of surgery of all urgencies, and a wide range of specialties for inpatient surgery in England, Wales and Northern Ireland. The generalizability of the model in international cohorts remains unknown.
The SORT could be used in conjunction with clinical judgement to aid decision-making and facilitate informed consent. External validation of the SORT is necessary to test its validity further, as is the periodic recalibration and re-evaluation of the model to maintain validity as healthcare delivery changes44,45. Studies evaluating the impact of risk stratification on improving patient outcomes through individual care planning should be a research priority as there is an opportunity to improve outcomes substantially14,43,46,47.
Acknowledgments
The categorization of the surgical severity and specialty data was undertaken by staff at University College London/University College London Hospitals Surgical Outcomes Research Centre (SOuRCe): C. Dougall, D. Wyndham, E. Bettini, C. M. Oliver and P. Das in conjunction with J.C.S. This final manuscript was reviewed by all authors as well as M. Mason, G. P. Findlay, A. P. L. Goodwin, M. C. Juniper and M. J. Gough of NCEPOD. M. Mason supported K.L.P. with this initiative and provided the necessary resources. Mortality data were obtained from participating hospitals, the ONS and NISRA. The Knowing the Risk study published in 2011 was designed by G. P. Findlay and A. P. L. Goodwin in conjunction with a nominated Expert Group. NCEPOD local reporters in participating hospitals and healthcare professionals who completed study forms assisted with the data collection from which the data set for this paper was derived. Full details can be found in the report, which is available at http://www.ncepod.org.uk.
This work was supported by the Healthcare Quality Improvement Partnership (HQIP) on behalf of NHS England, NHS Wales, the Northern Ireland Department of Health, Social Services and Public Safety, the States of Jersey, Guernsey and the Isle of Man. The data were collected under the Clinical Outcome Review Programme into Medical and Surgical Care, which was commissioned by HQIP. The contribution of SOuRCe was funded by the National Institute for Health Research University College London Hospitals Biomedical Research Centre, where S.R.M. is a member of the Faculty.
Disclosure: The authors declare no conflict of interest.
Supporting information
Additional supporting information may be found in the online version of this article
Clinical form completed prospectively for Knowing the Risk study (pdf)
Unrestricted model of 45 variables (Word document)
References
- 1.Weiser TG, Regenbogen SE, Thompson KD, Haynes AB, Lipsitz SR, Berry WR, et al. An estimation of the global volume of surgery: a modelling strategy based on available data. Lancet. 2008;372:139–144. doi: 10.1016/S0140-6736(08)60878-8. [DOI] [PubMed] [Google Scholar]
- 2.National Institute for Health and Care Excellence (NICE) CardioQ-ODM Oesophageal Doppler Monitor. 2014. Medical Technologies Guidance MTG3: http://www.nice.org.uk/mtg3 [accessed 1 March ]
- 3.Squadrone V, Coha M, Cerutti E, Schellino MM, Biolino P, Occella P, et al. Piedmont Intensive Care Units Network (PICUN). Continuous positive airway pressure for treatment of postoperative hypoxemia: a randomized controlled trial. JAMA. 2005;293:589–595. doi: 10.1001/jama.293.5.589. [DOI] [PubMed] [Google Scholar]
- 4.Simpson JC, Moonesinghe SR. Introduction to the postanaesthetic care unit. Perioper Med (Lond) 2013;2:5. doi: 10.1186/2047-0525-2-5. [DOI] [PMC free article] [PubMed] [Google Scholar]
- 5.Challand C, Struthers R, Sneyd JR, Erasmus PD, Mellor N, Hosie KB, et al. Randomized controlled trial of intraoperative goal-directed fluid therapy in aerobically fit and unfit patients having major colorectal surgery. Br J Anaesth. 2012;108:53–62. doi: 10.1093/bja/aer273. [DOI] [PubMed] [Google Scholar]
- 6.Gurgel ST, do Nascimento P., Jr. Maintaining tissue perfusion in high-risk surgical patients: a systematic review of randomized clinical trials. Anesth Analg. 2011;112:1384–1391. doi: 10.1213/ANE.0b013e3182055384. [DOI] [PubMed] [Google Scholar]
- 7.Hamilton MA, Cecconi M, Rhodes A. A systematic review and meta-analysis on the use of preemptive hemodynamic intervention to improve postoperative outcomes in moderate and high-risk surgical patients. Anesth Analg. 2011;112:1392–1402. doi: 10.1213/ANE.0b013e3181eeaae5. [DOI] [PubMed] [Google Scholar]
- 8.Donati A, Loggi S, Preiser JC, Orsetti G, Münch C, Gabbanelli V, et al. Goal-directed intraoperative therapy reduces morbidity and length of hospital stay in high-risk surgical patients. Chest. 2007;132:1817–1824. doi: 10.1378/chest.07-0621. [DOI] [PubMed] [Google Scholar]
- 9.Liao L, Mark DB. Clinical prediction models: are we building better mousetraps? J Am Coll Cardiol. 2003;42:851–853. doi: 10.1016/s0735-1097(03)00836-2. [DOI] [PubMed] [Google Scholar]
- 10.Adams ST, Leveson SH. Clinical prediction rules. BMJ. 2012;344:d8312. doi: 10.1136/bmj.d8312. [DOI] [PubMed] [Google Scholar]
- 11.Goodyear S, Yow H, Saedon M, Shakespeare J, Hill CE, Watson D, et al. Risk stratification by pre-operative cardiopulmonary exercise testing improves outcomes following elective abdominal aortic aneurysm surgery: a cohort study. Perioper Med (Lond) 2013;2:10. doi: 10.1186/2047-0525-2-10. [DOI] [PMC free article] [PubMed] [Google Scholar]
- 12.Hennis PJ, Meale PM, Grocott MP. Cardiopulmonary exercise testing for the evaluation of perioperative risk in non-cardiopulmonary surgery. Postgrad Med J. 2010;87:550–557. doi: 10.1136/pgmj.2010.107185. [DOI] [PubMed] [Google Scholar]
- 13.Edwards M, Whittle J, Ackland GL. Biomarkers to guide perioperative management. Postgrad Med J. 2011;87:542–549. doi: 10.1136/pgmj.2010.107177. [DOI] [PubMed] [Google Scholar]
- 14.Findlay GP, Goodwin APL, Protopapa KL, Smith NCE, Mason M. Knowing the Risk: a Review of the Peri-Operative Care of Surgical Patients. London: National Confidential Enquiry into Patient Outcome and Death; 2011. [Google Scholar]
- 15.Huddart S, Young EL, Smith RL, Holt PJ, Prabhu PK. Preoperative cardiopulmonary exercise testing in England – a national survey. Perioper Med (Lond) 2013;2:4. doi: 10.1186/2047-0525-2-4. [DOI] [PMC free article] [PubMed] [Google Scholar]
- 16.Farzi S, Stojakovic T, Marko TH, Sankin C, Rehak P, Gumpert R, et al. Role of N-terminal pro B-type natriuretic peptide in identifying patients at high risk for adverse outcome after emergent non-cardiac surgery. Br J Anaesth. 2013;110:554–560. doi: 10.1093/bja/aes454. [DOI] [PubMed] [Google Scholar]
- 17.James S, Jhanji S, Smith A, O'Brien G, Fitzgibbon M, Pearse RM. Comparison of the prognostic accuracy of scoring systems, cardiopulmonary exercise testing, and plasma biomarkers: a single-centre observational pilot study. Br J Anaesth. 2013;112:491–497. doi: 10.1093/bja/aet346. [DOI] [PubMed] [Google Scholar]
- 18.Hlatky MA, Greenland P, Arnett DK, Ballantyne CM, Criqui MH, Elkind MS, et al. American Heart Association Expert Panel on Subclinical Atherosclerotic Diseases and Emerging Risk Factors and the Stroke Council. Criteria for evaluation of novel markers of cardiovascular risk: a scientific statement from the American Heart Association. Circulation. 2009;119:2408–2416. doi: 10.1161/CIRCULATIONAHA.109.192278. [DOI] [PMC free article] [PubMed] [Google Scholar]
- 19.Saklad M. Grading of patients for surgical procedures. Anesthesiology. 1941;24:281–284. [Google Scholar]
- 20.Sutton R, Bann S, Brooks M, Sarin S. The Surgical Risk Scale as an improved tool for risk-adjusted analysis in comparative surgical audit. Br J Surg. 2002;89:763–768. doi: 10.1046/j.1365-2168.2002.02080.x. [DOI] [PubMed] [Google Scholar]
- 21.Copeland GP, Jones D, Walters M. POSSUM: a scoring system for surgical audit. Br J Surg. 1991;78:355–360. doi: 10.1002/bjs.1800780327. [DOI] [PubMed] [Google Scholar]
- 22.Whiteley MS, Prytherch DR, Higgins B, Weaver PC, Prout WG. An evaluation of the POSSUM surgical scoring system. Br J Surg. 1996;83:812–815. doi: 10.1002/bjs.1800830628. [DOI] [PubMed] [Google Scholar]
- 23.Moonesinghe SR, Mythen MG, Das P, Rowan KM, Grocott MPW. Risk stratification tools for predicting morbidity and mortality in adult patients undergoing major surgery: qualitative systematic review. Anesthesiology. 2013;119:959–981. doi: 10.1097/ALN.0b013e3182a4e94d. [DOI] [PubMed] [Google Scholar]
- 24.AXA PPP Healthcare. Specialist Procedure Codes. 2014. https://online.axappphealthcare.co.uk/SpecialistForms/SpecialistCode.mvc [accessed 1 March ]
- 25.Hendershot KM, Robinson L, Roland J, Vaziri K, Rizzo AG, Fakhry SM. Estimated height, weight, and body mass index: implications for research and patient safety. J Am Coll Surg. 2006;203:887–893. doi: 10.1016/j.jamcollsurg.2006.08.018. [DOI] [PubMed] [Google Scholar]
- 26.Lee TH, Marcantonio ER, Mangione CM, Thomas EJ, Polanczyk CA, Cook EF, et al. Derivation and prospective validation of a simple index for prediction of cardiac risk of major noncardiac surgery. Circulation. 1999;100:1043–1049. doi: 10.1161/01.cir.100.10.1043. [DOI] [PubMed] [Google Scholar]
- 27.Altman DG, Vergouwe Y, Royston P, Moons KG. Prognosis and prognostic research: validating a prognostic model. BMJ. 2009;338:b605. doi: 10.1136/bmj.b605. [DOI] [PubMed] [Google Scholar]
- 28.Swets JA. Measuring the accuracy of diagnostic systems. Science. 1988;240:1285–1293. doi: 10.1126/science.3287615. [DOI] [PubMed] [Google Scholar]
- 29.Gajdos C, Kile D, Hawn MT, Finlayson E, Henderson WG, Robinson TN. Advancing age and 30-day adverse outcomes after nonemergent general surgeries. J Am Geriatr Soc. 2013;61:1608–1614. doi: 10.1111/jgs.12401. [DOI] [PMC free article] [PubMed] [Google Scholar]
- 30.Wolters U, Wolf T, Stützer H, Schröder T. ASA classification and perioperative variables as predictors of postoperative outcome. Br J Anaesth. 1996;77:217–222. doi: 10.1093/bja/77.2.217. [DOI] [PubMed] [Google Scholar]
- 31.Morris EJ, Taylor EF, Thomas JD, Quirke P, Finan PJ, Coleman MP, et al. Thirty-day postoperative mortality after colorectal cancer surgery in England. Gut. 2011;60:806–813. doi: 10.1136/gut.2010.232181. [DOI] [PubMed] [Google Scholar]
- 32.Pearse RM, Harrison DA, James P, Watson D, Hinds C, Rhodes A, et al. Identification and characterisation of the high-risk surgical population in the United Kingdom. Crit Care. 2006;10:R81. doi: 10.1186/cc4928. [DOI] [PMC free article] [PubMed] [Google Scholar]
- 33.Brooks MJ, Sutton R, Sarin S. Comparison of Surgical Risk Score, POSSUM and p-POSSUM in higher-risk surgical patients. Br J Surg. 2005;92:1288–1292. doi: 10.1002/bjs.5058. [DOI] [PubMed] [Google Scholar]
- 34.Prospective Studies Collaboration. Whitlock G, Lewington S, Sherliker P, Clarke R, Emberson J, Halsey J, et al. Body-mass index and cause-specific mortality in 900 000 adults: collaborative analyses of 57 prospective studies. Lancet. 2009;373:1083–1096. doi: 10.1016/S0140-6736(09)60318-4. [DOI] [PMC free article] [PubMed] [Google Scholar]
- 35.Turrentine FE, Hanks JB, Schirmer BD, Stukenborg GJ. The relationship between body mass index and 30-day mortality risk, by principal surgical procedure. Arch Surg. 2012;147:236–242. doi: 10.1001/archsurg.2011.310. [DOI] [PubMed] [Google Scholar]
- 36.Go AS, Yang J, Ackerson LM, Lepper K, Robbins S, Massie BM, et al. Hemoglobin level, chronic kidney disease, and the risks of death and hospitalization in adults with chronic heart failure: the Anemia in Chronic Heart Failure: Outcomes and Resource Utilization (ANCHOR) Study. Circulation. 2006;113:2713–2723. doi: 10.1161/CIRCULATIONAHA.105.577577. [DOI] [PubMed] [Google Scholar]
- 37.Wang JG, Staessen JA, Fagard RH, Birkenhäger WH, Gong L, Liu L. Prognostic significance of serum creatinine and uric acid in older Chinese patients with isolated systolic hypertension. Hypertension. 2001;37:1069–1074. doi: 10.1161/01.hyp.37.4.1069. [DOI] [PubMed] [Google Scholar]
- 38.Davenport DL, Bowe EA, Henderson WG, Khuri SF, Mentzer RM., Jr National Surgical Quality Improvement Program (NSQIP) risk factors can be used to validate American Society of Anesthesiologists Physical Status Classification (ASA PS) levels. Ann Surg. 2006;243:636–641. doi: 10.1097/01.sla.0000216508.95556.cc. [DOI] [PMC free article] [PubMed] [Google Scholar]
- 39.Ashwell M, Gunn P, Gibson S. Waist-to-height ratio is a better screening tool than waist circumference and BMI for adult cardiometabolic risk factors: systematic review and meta-analysis. Obes Rev. 2012;13:275–286. doi: 10.1111/j.1467-789X.2011.00952.x. [DOI] [PubMed] [Google Scholar]
- 40.Kartheuser AH, Leonard DF, Penninckx F, Paterson HM, Brandt D, Remue C, et al. Waist Circumference Study Group. Waist circumference and waist/hip ratio are better predictive risk factors for mortality and morbidity after colorectal surgery than body mass index and body surface area. Ann Surg. 2013;258:722–730. doi: 10.1097/SLA.0b013e3182a6605a. [DOI] [PubMed] [Google Scholar]
- 41.Anderson ID, Eddleston J, Grocott MPW, Lees NP, Lobo D, Loftus I, et al. The Higher Risk General Surgical Patient: Towards Improved Care for a Forgotten Group. London: Royal College of Surgeons of England and Department of Health; 2011. [Google Scholar]
- 42.Neary WD, Prytherch D, Foy C, Heather BP, Earnshaw JJ. Comparison of different methods of risk stratification in urgent and emergency surgery. Br J Surg. 2007;94:1300–1305. doi: 10.1002/bjs.5809. [DOI] [PubMed] [Google Scholar]
- 43.Pearse RM, Moreno RP, Bauer P, Pelosi P, Metnitz P, Spies C, et al. European Surgical Outcomes Study (EuSOS) group for the Trials groups of the European Society of Intensive Care Medicine and the European Society of Anaesthesiology. Mortality after surgery in Europe: a 7 day cohort study. Lancet. 2012;380:1059–1065. doi: 10.1016/S0140-6736(12)61148-9. [DOI] [PMC free article] [PubMed] [Google Scholar]
- 44.Bridgewater B, Keogh B, Kinsman R, Walton P. Sixth National Adult Cardiac Surgical Database Report: Demonstrating Quality. London: Society for Cardiothoracic Surgery in Great Britain and Ireland; 2008. [Google Scholar]
- 45.Bridgewater B, Kinsman R, Walton PKH, Gummert J, Kappetein AP. The 4th European Association for Cardio-Thoracic Surgery adult cardiac surgery database report. Interact Cardiovasc Thorac Surg. 2010;12:4–5. doi: 10.1510/icvts.2010.251744. [DOI] [PubMed] [Google Scholar]
- 46.Grocott MPW. Improving outcomes after surgery. BMJ. 2009;339:b5173. doi: 10.1136/bmj.b5173. [DOI] [PubMed] [Google Scholar]
- 47.Vester-Andersen M, Lundstrøm LH, Møller MH, Waldau T, Rosenberg J. Møller AM; Danish Anaesthesia Database. Mortality and postoperative care pathways after emergency gastrointestinal surgery in 2904 patients: a population-based cohort study. Br J Anaesth. 2014;112:860–870. doi: 10.1093/bja/aet487. [DOI] [PubMed] [Google Scholar]
Associated Data
This section collects any data citations, data availability statements, or supplementary materials included in this article.
Supplementary Materials
Clinical form completed prospectively for Knowing the Risk study (pdf)
Unrestricted model of 45 variables (Word document)