

Abstract
Voltage-driven transport of double-stranded DNA through nanoscale pores holds much potential for applications in quantitative molecular biology and biotechnology, yet the microscopic details of translocation have proven to be challenging to decipher. Earlier experiments showed strong dependence of transport kinetics on pore size: fast regular transport in large pores (> 5 nm diameter), and slower yet heterogeneous transport time distributions in sub-5 nm pores, which imply a large positional uncertainty of the DNA in the pore as a function of the translocation time. In this work, we show that this anomalous transport is a result of DNA self-interaction, a phenomenon that is strictly pore-diameter dependent. We identify a regime in which DNA transport is regular, producing narrow and well-behaved dwell-time distributions that fit a simple drift-diffusion theory. Furthermore, a systematic study of the dependence of dwell time on DNA length reveals a single power-law scaling of 1.37 in the range of 35–20,000 bp. We highlight the resolution of our nanopore device by discriminating via single pulses 100 and 500 bp fragments in a mixture with >98% accuracy. When coupled to an appropriate sequence labeling method, our observation of smooth DNA translocation can pave the way for high-resolution DNA mapping and sizing applications in genomics.
Introduction
Cellular DNA is generally found in the nucleus in the form of a long double-stranded DNA (dsDNA) helix. During transcription and other DNA metabolic processes, specialized proteins can slide along the DNA contour in search of a specific sequence, chemical modifications, or chemical damage. Recently, nanopores in synthetic materials and engineered protein channels have emerged as single-molecule tools for similarly identifying sequence and other structural features along DNA contours (1–5). In this method, DNA molecules are electrophoretically pulled into an electrolyte-filled nanopore by applying a small voltage bias (< 0.5 V) across it. DNA entry and passage through the pore are detected by monitoring the ion current signal across the pore. Temporal fluctuations in the signal can report on the presence of epigenetic modifications (6–10), alteration in sequence (11–15), length variation (16,17), secondary structure (17,18), and conformation (19–21) of the DNA molecule. Prospects for nanopores as DNA sequence scanners, high-resolution DNA sequence mappers, and epigenetic modification detectors have fueled research that aims to understand the details of DNA translocation and its limitations. In comparison to existing technologies, scanning DNA fragments at high-throughput is potentially more attractive than optical DNA stretching methods (22–24) because 1) electronic measurement devices can be more easily miniaturized; 2) electronic measurements can be made at MHz bandwidths, allowing faster processes to be probed, i.e., higher throughput; and 3) the resolution of nanopore measurements is ideally dictated by its geometry (2–5 nm), whereas optical methods are constrained by undesirable photophysical features of dye molecules and optical diffraction limits (∼100s of nm).
Despite ample promise, two major shortcomings of nanopores with respect to dsDNA analysis have been 1) Mean transport speeds are 10–100 times faster than required for statistical averaging of ion current data from short DNA regions inside the pore (5), and 2) DNA position versus time in the pore is not well known or otherwise regulated (3,25,26). Although regulation has been achieved for single-stranded DNA using enzymes as molecular stepper motors (9,10,27–31), regulated motion of dsDNA has yet to be demonstrated. Voltage-driven dsDNA translocation through 5–15 nm diameter pores in thin (20–50 nm) solid-state materials proceeds with mean velocities of 10–100 ns/bp, and often in large pores multiple DNA strands enter simultaneously (17,19,32,33), which complicates single-file readout of information that is encoded in the linear sequence. Proteins such as RecA from Escherichia coli form filaments around the DNA that slows DNA transport and prevents its folding (26,34,35), although this approach inherently masks chemical information contained within the DNA, such as the presence of DNA chemical modifications (7,36) or small bound drug/reporter molecules (37–40). Explorations of the effects of parameters such as the electrolyte viscosity (41,42), salt type (43,44), membrane material (45,46), applied pressure (47,48), and chemical composition inside (49–52) and outside (53) the pore have yielded only moderate DNA retardation factors.
In contrast, the use of smaller diameter pores (< 5 nm) results in mean DNA velocities that are reduced easily by ∼2 orders of magnitude (5,54–56) while simultaneously preventing folded DNA transport. However, the statistics of DNA transport times through sub-5 nm pores point to a highly complex process: a pure single-length DNA fragment can produce multiple event populations that are characterized by broad distributions of dwell times and blockade amplitudes (19,55–58). Based on their dependence on various parameters, these distinct subpopulations have been associated with various processes such as nontransport DNA collisions with the pore and translocation governed by strong interactions. Despite this, the broad and overlapping nature of these subpopulations is a grand impediment of DNA mapping applications as it implies a greatly smeared DNA positional trajectory during translocation.
In this work we present a systematic study that pinpoints and overcomes the source for irregular DNA transport through small pores. Our findings have led us to conclude that the anomalous transport dynamics is related to electric field-driven DNA self-interaction between extra-pore and intrapore segments. Furthermore, these interactions are efficiently extinguished by restricting the pore diameter, leading to reproducible transport time distributions with unprecedentedly low scatter. Molecular dynamics (MD) simulations of DNA diffusion within the pore constraint and quantitative fits of our statistical data to a one-dimensional (1D) Fokker-Planck model support a greatly reduced DNA axial diffusion in sub-3 nm diameter pores. This explains the favorably slow DNA velocities and the low scatter in DNA velocities for a given experiment. Mean transport times are related to DNA length in the range of 35–20,000 bp through a single superlinear power law, which in combination with prior studies appears to be weakly related to pore diameter. Finally, we demonstrate DNA fragment length discrimination in a mixture from a single pulse with >98% accuracy.
Materials and Methods
Nanopore experiments
For all details about nanopore fabrication and information about our experimental setup, please refer to section SM-1 in the Supporting Material. Unless otherwise indicated, all experiments were performed at room temperature (25°C) and using 0.40 M KCl electrolyte tris-buffered to pH 7.9.
Data acquisition and analysis
Experimental data were collected using the Chimera Instruments VC100 (New York, NY) at a sampling rate of 4.19 MHz, and further digitally low-pass filtered at 200 kHz before analysis to reduce the capacitance noise. The high-bandwidth increases our time resolution and ensures that events as fast as 2.5 μs are detected. All DNA samples used in these studies were obtained from Thermo Scientific (Waltham, MA). Analysis of all nanopore data was performed using MATLAB-based OpenNanopore software (59) developed by the Radenovic group at Ecole Polytechnique Fédérale de Lausanne (EPFL), which uses a cumulative sums algorithm to detect individual events in the raw current signals. Standard errors shown for D and v were estimated using a bootstrapping procedure that is described thoroughly in the Supporting Material SM-1.
MD simulations of diffusion in pore-confined DNA
MD simulations were performed using the NAMD (60) software package. Periodic boundary conditions were applied, and particle mesh Ewald electrostatics (61) governed the long-range interactions. Multiple time stepping (62) was used so that local interactions were calculated every time step, and the full electrostatic calculation was performed every 3 time steps. A 2 fs time step was used with RATTLE (63) and SETTLE (64) algorithms applied to covalent bonds involving hydrogens in DNA and water, respectively. The van der Waals forces were smoothly cutoff starting at 7 Å and were completely cutoff at 8 Å. The CHARMM36 (65) force field was used for nucleic acids, water, and ions, with NBFIX corrections for ions (66), and a custom force field for Si3N4 (67). The NPT simulations used a Nose-Hoover Langevin piston pressure control (68), and the temperature was controlled by a Langevin thermostat acting on the membrane atoms with a damping constant of 1.0 ps−1. During NPT simulations, the DNA and Si3N4 were harmonically restrained with a spring constant of 695 pN/Å. In all NVT production simulations, the surface atoms of the membrane were harmonically restrained with a spring constant of 695 pN/Å, and the interior atoms of the membrane were harmonically restrained with a spring constant of 69.5 pN/Å.
Atomic-scale models of silicon nitride nanopores were built following a previously described protocol (20). The pores were made by removing atoms from a crystalline silicon nitride membrane. A 36 bp fragment of dsDNA was introduced into the pore, with its axis collinear with the pore axis. Each DNA/nanopore system was solvated; potassium and chloride ions were added to produce electrically neutral systems of target KCl concentration (1 or 0.40 M). Each system (∼120,000 atoms) underwent 1000 steps of energy minimization, followed by 1 ns equilibration in the constant area, pressure (1 bar) and temperature (295 K) ensemble maintained using a Langevin piston. All production simulations were carried out in a constant volume/temperature ensemble. For information on the script detailing the pulling of DNA molecules see the Supporting Material SM-1.
Finite element simulations
All simulations presented were computed using COMSOL Multiphysics 4.3b (Burlington, MA) with custom geometries (see the Supporting Material SM-7 for more information).
Results and Discussion
Fig. 1 a illustrates a molecular model of ∼150 bp dsDNA fragment being voltage-driven through an ultrathin pore with a diameter of d ∼3 nm. The length of dsDNA shown is one persistence length, intentionally chosen to illustrate the stiff nature of the polymer with respect to the pore dimensions. DNA introduction into the cis (top) chamber and application of positive bias to the trans (bottom) chamber results in capture and electrophoresis of individual DNA molecules across the pore. Transport of a DNA molecule produces a transient downward spike in the electrical signal, a result of the temporary restriction in ion flux through the pore. In Fig. 1 b we show two continuous traces obtained when 60 nM of 500 bp DNA was added to the cis chamber and driven using a 200 mV voltage through a 2.9 nm pore and a 6 nm pore. The all-point histograms on the right reveal for each pore two predominant current levels, the higher corresponding to open pore (IO) levels and the lower corresponding to DNA-occupied levels. Postacquisition analysis of the traces (OpenNanopore, EPFL (59)) identifies the events as rectangular pulses, a sample of which are shown for both pores in Fig. 1 c. Scatter plots of dwell time td versus fractional current blockade ΔI/IO are displayed in Fig. 1 d, showing a broad population centered at td ∼25 μs and ΔI/IO ∼0.12 for the 6 nm pore (ntotal = 1798), and td ∼890 μs and ΔI/IO ∼0.56 for the 2.9 nm pore (ntotal = 2593). We note that we can only observe dwell times and current blockades larger than our detection limits (dashed red lines in the plot). Furthermore, only when reducing the bandwidth of our signal do we observe DNA collisions with the pore (see Fig. S1), the vast majority of which produce short-lived, low amplitude pulses. The low scatter in DNA transport times in the smaller of the two pores, which in the course of our experiments has been reproduced for different DNA fragments using over 50 pores, has motivated our study to pinpoint the reasons for smooth DNA transport through pores in the d = 2.8–3.0 nm regime (see Fig. S2 and Fig. S3 for information on stability and pore-to-pore reproducibility).
Figure 1.
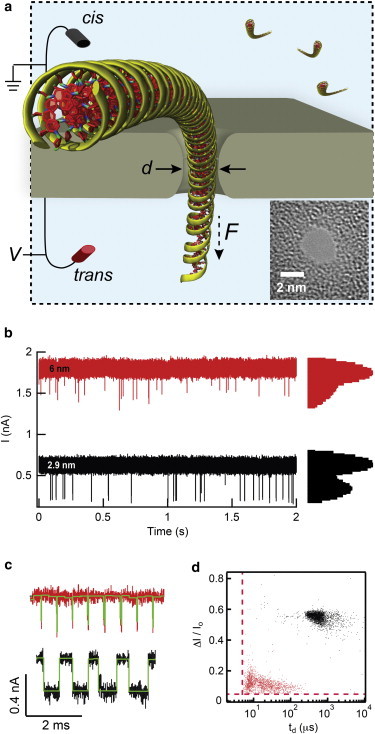
Single-molecule DNA electrophoresis. (a) Schematic of ∼150 bp DNA fragment threading a d ∼3 nm pore (electrodes not to scale), and transmission electron microscopy image of a typical SiNx nanopore used in experiments. (b) Continuous current versus time traces of 2.9 and 6 nm diameter pores when a 60 nM 500 bp dsDNA sample is added to the cis chamber (V = 200 mV, data low-pass filtered to 200 kHz). Log-scale all-point current histogram shown on the right illustrates two nanopore states, open pore and DNA-threaded pore. (c) Expanded view of sample events for 2.9 and 6 nm pores after analysis (rectangular analysis fits shown in green). (d) Scatter plots of ΔI/IO vs. td for 500 bp DNA translocation events through a 2.9 nm (black) and 6 nm (red) pore. Red dotted lines indicate the minimum detectable dwell time and fractional current blockade levels, td = 5 μs and ΔI/IO = 0.06, respectively. To see this figure in color, go online.
Voltage fine-tunes DNA transport kinetics through small pores
DNA is a uniformly charged polymer, and therefore its transport kinetics is expected to depend on applied bias. We have chosen to conduct our systematic study using 500 bp dsDNA because it is in the rod-to-coil regime, i.e., its 3+ persistence lengths are sufficiently long to frequently adopt 360° loop configurations at equilibrium (j-factor of ∼10 nM) (69). In Fig. 2 a we present dwell time distributions for 500 bp DNA transport through a 3.0 nm diameter pore in the 200–350 mV voltage range. The dwell time distributions are asymmetric in shape, and are characterized by sharply increasing peaks at early times followed by broader decays at longer times. The distribution shapes were fit to first-passage time distributions obtained from the 1D Fokker-Planck equation (70,71):
| (1) |
where b is the trajectory length of the molecule, D is the diffusion coefficient, and v is the drift velocity. The model of Eq. 1 describes the 1D motion of a particle that starts at the origin (x = 0) of a semiinfinite capillary with an absorbing boundary located at x = b. Given that the complete contour length LC of DNA is longer than the pore length beff, we set the absorbing boundary to be at b = beff + LC (42,71,72). Phenomenological estimates of beff for each pore were based on IO and ΔI values measured during DNA translocation (73,74) (see the Supporting Material SM-4), whereas LC values were calculated from LC = 0.34N nm, where N is the number of basepairs. Best fits to Eq. 1 for each distribution are shown in Fig. 2 a (shaded curves). The percentages of events that fit the model in Eq. 1 lie in the range 84–94% (see the Supporting Material SM-5), where the remaining events outside of the fit are mostly scattered at longer dwell times.
Figure 2.
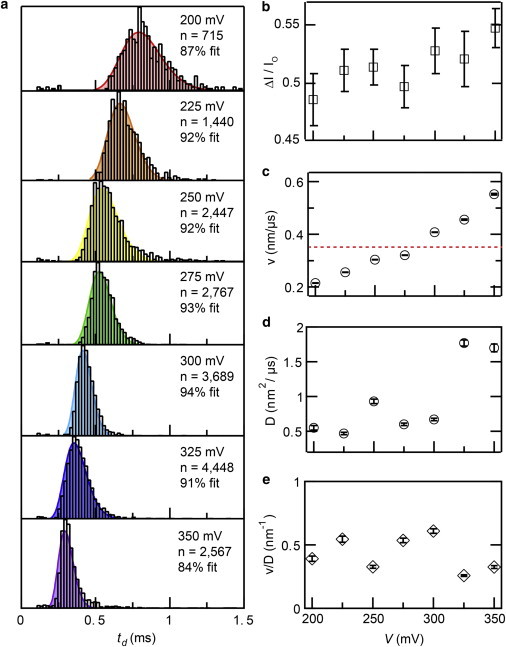
Voltage-tuned DNA transport. (a) Dwell time histograms for 500 bp dsDNA transport through a 3.0 nm diameter pore in the 200–350 mV voltage range. Shaded curves represent the optimal fits to the 1D drift-diffusion model of Eq. 1. (b) Fractional current blockade (ΔI/Io) values as a function of voltage, which remains constant within error throughout the experiment (with the exception of V = 350 mV). (c) Values for drift velocity v as a function of voltage, obtained from the fits. In addition to observing very low values for drift velocity, we see that v increases steadily with voltage. A dashed red line is drawn for a value of v corresponding to 1 bp/μs. (d) Values for diffusion coefficient D from the fits remain relatively constant for V ≤ 300 mV, and then increase about threefold for greater V. (e) The quantity of v/D remains remarkably constant throughout the entire voltage range (0.43 ± 0.13 nm−1). To see this figure in color, go online.
In Fig. 2 b we plot the fractional current blockade (ΔI/Io) as a function of voltage. We observe a moderate increase in ΔI/Io with increasing voltage (6% change from 200 to 350 mV), an effect that was observed in a recent study by the Hall group (58). Drift velocities (v) obtained from the fits are shown in Fig. 2 c. Displayed standard errors for v (and later for D) were calculated by resampling our data for 10,000 iterations using a standard bootstrapping procedure (see Materials and Methods). As previously observed using larger pores (41,75) and for free-solution DNA electrophoresis (76), we find that v increases with voltage. However, v does not depend linearly on voltage and cannot be extrapolated to the origin, suggesting a voltage-dependent electrophoretic mobility (μ), i.e., μ = f(V). Mean values of μ obtained in our voltage experiments are on the order of ∼10−7 cm2 V−1 s−1, three orders of magnitude smaller than bulk μ values for DNA in free-solution electrophoresis (∼10−4 cm2 V−1 s−1) (77). The obtained values of v yield mean velocities that correspond to one DNA basepair moving through the pore per μs (dashed red line). We highlight that these are mean values because a constant DNA velocity through a nanopore is unlikely, and further was not proven by this experiment.
The diffusion coefficients (D) of the DNA extracted using Eq. 1 appear to slightly depend on voltage, increasing from 0.5 to 1.8 nm2/μs (see Fig. 2 d). A similar trend was recently observed for translocation of stiff fd virus filaments (78). Moreover, as for a rod-like stiff fd filament (LC < p, where p is a persistence length), values for D were comparable to the axial component of their bulk translational diffusion coefficients. In the case of a semiflexible DNA chain, we argue that a relevant length scale for correlated axial DNA motion is one-half of a persistence length, as opposed to the full DNA contour length. Using reference bulk Do values for 75 bp (45 nm2 μs−1) (79–84), we find that the axial component of D for our experiment is 1.5 Do, or 68 nm2/μs (see the Supporting Material SM-6 for details). Fig. 2 d appears to contradict our previous hypothesis, because for all voltages tested we find that D is at least 40 times smaller. In the next section, we will show that the restricted pore geometry is responsible for the greatly reduced D values for DNA, as we recently found for protein electrophoresis in the regime dprotein ∼ dpore (85). Finally, in Fig. 2 e we show the dependence of the ratio v/D on voltage for this study. Apart from scatter that is mainly a result of the dispersity in measured D values, we find that the ratio v/D is independent of voltage (0.43 ± 0.13 nm−1). This suggests that an intricate relationship between v and D governs our observed superlinear dependence of v on voltage, one that is a result of tight molecular confinement and/or interactions within the pore volume.
Impact of pore diameter on DNA translocation
In Fig. 3, a–e, we present five representative dwell time distributions for 500 bp DNA transport through 2.6–6 nm diameter pores. Additionally, inset to each distribution we show contour plots of fractional current blockades versus log dwell times, all to the same scale for comparison. First, the inset contour plots reveal a striking 500-fold shift to longer dwell times upon reducing the pore diameter from 6.0 to 2.6 nm (∼10 μs to ∼5 ms, respectively). In addition to the longer observed dwell times with decreased pore diameters, their relative scatter (i.e., 〈td〉/σtd) decrease. Furthermore, upon fitting our data to Eq. 1, as shown by the purple shaded curves, we find for the 3.4–6.0 nm pores a secondary population of long-lived dwell times, indicated by red asterisks in the figures. These doubly populated dwell time distributions have been previously observed in larger pores of various materials (55,86–88), and suggest a different translocation mechanism than the main population. Finally, in Fig. 3 f we plot the fraction of events that fit the model in Eq. 1 for different pore diameters, as obtained by integrating the experimental distributions and the fits. To arrive at these values we converted the dwell time histograms and fits into cumulative distribution functions, and then estimated the percent of excess (i.e., nonfitting) events that lie above the aligned experimental and theoretical cumulative distribution functions. By dividing the area in agreement with this dwell time by the total area of the histogram curve, the percentage of events that agree with our model is determined (see the Supporting Material SI-4 for further discussion). The guideline drawn in Fig. 3 f (dashed red line) shows a plateau of events that fit Eq. 1 for d = 2.8–3.0 nm (shaded in green), whereas a regular emergence of a second process is observed for larger pores. In the optimum regime we can therefore say that the predominant transport mechanism is a smooth 1D first-passage process. Interestingly, for d = 2.6–2.7 nm (n = 7) we find that a significantly lower fraction of events fit the model than for d = 2.8–2.9 nm (n = 4), presumably due to overwhelming DNA/pore interactions.
Figure 3.
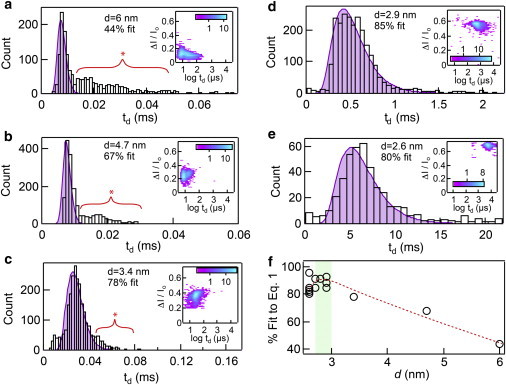
The influence of pore diameter on DNA transport time. (a–e) Dwell time distributions with drift-diffusion fits included (shaded purple curves) for 500 bp DNA translocation through five different pores of diameter d ranging from 2.6 to 6 nm. Our model fits the data by the designated percentages with the shown 2.9 nm pore matching the best, an 85% fit. Pores with d > 3.4 nm have distributions with noticeably long tails that lie outside our model curves, as denoted by the red brackets, indicating translocation events with erratic transport through the pore. Insets: Heat maps of fractional current blockade versus the log of the dwell time for each pore diameter. The color scale bars displayed are in log scale. (f) By plotting the fit percentages for 14 different pores as a function of d, we see that the optimal pore size for regular DNA transport lies between d = 2.8–3.0 nm (green shaded region). Red dotted line is a guideline for viewing the trend in d. To see this figure in color, go online.
Next, in Fig. 4 a we present a compiled set of v and D values for 500 bp DNA transport as a function of pore diameter (n = 14, effective thickness beff = 7–10 nm). The trends for both parameters have a striking resemblance: as pore diameter increases from 2.6 to 3.0 nm we observe a drastic increase in both v and D, whereas for d > 3 nm both parameters approach asymptotic limits (vmax ∼20 nm/μs; Dmax ∼80 nm2/μs). Under our experimental conditions, we could not detect 500 bp DNA through d > 6 nm pores. To explain the convergence of v and D values for larger pores we turn to the simplistic model of the DNA drift-diffusion problem. By fitting our dwell time distributions to Eq. 1 we seek a solution of first-passage times for rod-like DNA segments to traverse a full DNA contour length through the pore (illustrated in the inset to Fig. 4 a). As argued earlier in the manuscript, for a rod-like DNA length of ∼0.5p (or 75 bp) we expect an axial diffusion coefficient of ∼68 nm2/μs. As shown by an asterisk in Fig. 4 a, this value is in fair agreement with our observed values of D for d > 3 nm (40–100 nm2/μs).
Figure 4.
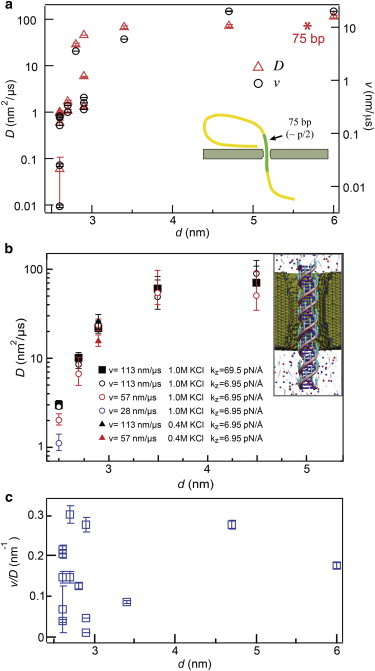
Dependence of v and D with respect to pore diameter d. (a) Using our 1D drift-diffusion model, D and v are extracted by fitting our dwell time distributions to Eq. 1. Both parameters increase with d, but asymptotically approach a bulk value once the pore diameter is large enough (> 4 nm). The red asterisk represents the axial diffusion coefficient for the free electrophoresis of a 75 bp DNA molecule (∼68 nm2/μs) (see the Supporting Material SM-6 for details). (b) MD simulations of DNA diffusion coefficient. The diffusion coefficient was estimated as kBTv/F, where F was the force required to move DNA with an average velocity v. Each data point represents an average of five independent simulations (except for d = 4.5 nm, which is the average of 10 simulations). Estimates of the diffusion coefficient did not depend on the choice of the pulling velocity, stiffness of the pulling restraints, or the ion concentration with the exception of the 2.5 nm diameter nanopore. Inset: Molecular graphics representation of a typical simulation system. A 36 bp fragment of DNA (purple and pink) is pulled through a nanopore in a silicon nitride membrane (green cut-away molecular surface), submerged in solution (gray semitransparent surface) of potassium and chloride ions (blue and red spheres, respectively). Teal arrows illustrate external forces applied to displace DNA with a prescribed translocation velocity v. (c) A plot of our experimental values of v/D as a function of d shows that this ratio remains independent of diameter (0.15 ± 0.10 nm−1) for the range d = 2.6 – 6 nm. To see this figure in color, go online.
In the d < 3 nm regime, we find a trend that implies strongly damped DNA diffusion due to confinement. Effects of pore confinement on D are well known (25,89,90), and have been recently observed for protein transport in confining pores (85). We independently assessed the impact of confinement on the diffusion coefficient of dsDNA by employing all-atom MD simulations. Specifically, we constructed five atomic-scale models of the experimental system, each containing a nanopore in a 7-nm-thick silicon nitride membrane, a 36 bp fragment of dsDNA, and an electrolyte solution (see Fig. 4 b). Each nanopore had an hourglass shape and the nanopore diameters were 2.5, 2.7, 2.9, 3.5, or 4.5 nm. We simulated mechanical pulling of dsDNA through the nanopore (91) while measuring the average force F required to maintain the prescribed translocation velocity v (see Materials and Methods for details). The measured force-velocity dependence was used to estimate the diffusion coefficient via the Einstein relation: D = kBTv/F. The results of these simulations clearly have a striking, nearly quantitative resemblance to our experimental observations: Simulated D values for pores with d > 3.5 nm were quantitatively close to our asymptotic values, whereas in the confined DNA regime systematic decreases in D were observed. Notably, for d = 2.5 nm, the diffusion coefficient obtained through the Einstein relation was found to depend on the pulling velocity due to a noticeable friction between the pore wall and the DNA. This is coincidental with our experimental observations, which showed more scatter in D and v values for pores with d = 2.6–2.7 nm.
Although the experimental and simulation-based dependence of D on pore size agrees qualitatively (and perhaps semiquantitatively), a comparison of experimental v values in the unconfined regime to values based on free-solution electrophoresis measurements yields a very poor agreement: Stellwagen measured for ∼75 bp DNA a mobility of μ = 3.2 × 10⁻⁴ cm2 V−1 s−1 (84), which, given the electric field in our pores (E ∼1.8 × 10⁵ V/cm, corresponding to 200 mV applied across a 8 nm long nanopore), should yield a drift velocity of ∼580 nm/μs. This is a factor of ∼26 higher than our largest value of v (d = 6.0 nm, v = 22.5 ± 0.5 nm/μs). We argue that this discrepancy is an outcome of three major differences from bulk measurements: First, only a fraction (about one-third) of the ∼75 bp rod-like DNA segment (i.e., a half-persistence length of DNA, or 25 nm) is actually driven by the electric field because our pores are ∼8 nm thick. Second, in free electrophoresis the electric fields are typically uniform on the scale of a molecule, whereas the large field gradient within a pore cannot act to drive all monomers in the pore equally, further reducing the effective driving force. Finally, dsDNA effective charge is reduced in nanopores to ∼0.5 e−/bp due to electroosmotic effects (one-fourth of formal charge), as determined via single-molecule force measurements (92,93). These combined factors argue for greatly reduced μ values in nanopores, although a quantitative assessment of the reduction requires models that are beyond the scope of this work.
In the more confined regime of d < 3 nm we find a sharp and systematic decrease in v values by up to two orders of magnitude, a trend that remarkably resembles that of D. In Fig. 4 c we compute for the series of 14 pores the ratio v/D. Strikingly, as we found to be voltage-independent in Fig. 2, the parameter v/D remains fairly diameter independent (0.15 ± 0.10 nm−1), despite pore-to-pore variance of up to 70%. Given the increased pore/pore variance in v/D for sub-3 nm diameter pores, we attribute it to small differences in geometry among the different pores. Therefore, the v/D ratio qualifies as a useful metric when contemplating pore-to-pore variations in experiments.
Mechanism for smooth DNA transport in small pores
We have shown that DNA dwell time distributions of a 500-bp DNA fragment through pores in the regime d < 3 nm appear as single populations, whereas in the regime d = 3.4–6.0 nm two populations are observed (Fig. 3). To explain this observed behavior we point to the electric field landscape in the pore vicinity during translocation. In Fig. 5 we present finite element numerical simulations of the electric potential (V) profiles around a d = 4.0 nm (Fig. 5, a–c), and d = 2.6 nm pore (Fig. 5, d–f) (93–98). Correspondingly, below the open pores we show V profiles for DNA-occupied pores (see the Supporting Material SM-7 for simulation details). We refer the reader to two key observations: 1) the external field above the pore mouth is more pronounced for the larger pore, and 2) DNA threading results in a reduction of this external field in both cases, although this diminution is greater for the small pore. The previous two observations are trivial from experiments, because larger ion currents are observed for larger pores, and larger fractional blockades are seen for smaller pores, respectively. However, this also demands that the impact of the external electric field on the extra-pore DNA segments during its transport is not equal for different pore diameters. For the 2.5 nm pore much of the external field upon DNA threading is self-extinguished, whereas for the 4.0 nm pore DNA causes only a mild reduction. To orient the reader we show using dashed semicircles the 1 mV equipotential lines for all simulations in the figure. For the 4.0 nm pore, the 1 mV contour line is found at a reduced distance from the pore by 14% upon DNA threading, whereas for the 2.6 nm pore the reduction is 50%. As a DNA molecule travels through a larger pore, an extra-pore DNA region of the currently translocating molecule is more likely to be voltage-driven toward the mouth of the larger pore, causing self-interference that stochastically slows/stops the DNA, as observed by the smeared dwell time distribution at longer timescales than predicted by the drift-diffusion model (see Fig. 5 c). In contrast, this self-interference is inhibited in the regime d = 2.8–3.0 nm, yielding smooth transport (see Fig. 5 f). We note that the illustrations in Fig. 5, c and f, are not to scale, and the pseudo-loop that the DNA forms requires several persistence lengths. As we have shown here, a 500 bp DNA length is sufficient to yield complicated translocation dynamics unless the pore size is restricted to a sub-3 nm diameter.
Figure 5.
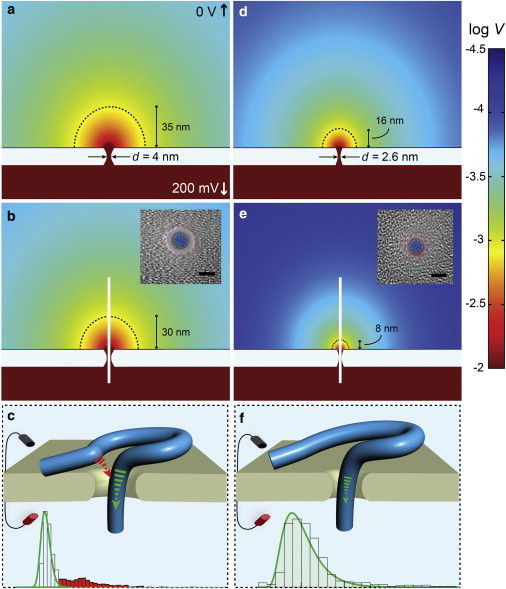
Contour plots of log V from finite element simulations for nanopores of two diameters show the contrast in the residual capture field when DNA threads through the pore (simulation conditions: 200 mV, 0.4 M KCl, 21°C). When the nanopore is open (a and d) there is a wider capture radius for the 4.0 nm pore than for the 2.6 nm pore. Once DNA is threading through the nanopore (b and e) there is a reduction in the electric field, but still enough residual remaining to affect the DNA coil outside the nanopore. Because the DNA occupies a larger percentage of the pore’s volume when the diameter is 2.6 nm, it’s residual field is reduced more significantly (∼50%) than in the case of a 4.0 nm diameter (∼14%). The dotted black line in each panel indicates where the electric potential is 1 mV. Insets: Transmission electron microscopy images of SiNx nanopores with dsDNA overlaid to show the occupied area during translocation (scale bar is 2 nm). (c and f) These panels illustrate the effect of coil interference in the case of each diameter. Sample dwell time distributions taken from Fig. 3, b and e, are displayed below to show the added longer dwell times (red-shaded region) that are the result of DNA self-interaction during translocation. To see this figure in color, go online.
Smooth transport of long DNA
In Fig. 6 a we show representative sets of concatenated events for the different DNA lengths (see Fig. S6 for more traces). Clearly, the events uniformly increase in duration for longer DNA molecules, yet the current blockades remain constant (see Fig. S7) in contrast with a prior report in which DNA length dependence on the conductance blockade fraction was observed for DNA lengths above 2 kbp (55). In Fig. 6 b we present log dwell time distributions for transport of 11 DNA lengths in the range 35–20,000 bp through nanopores with d = 2.8–3.0 nm. The distributions are represented as color maps, where increasing color intensity represents more populated bins (n > 280 for each length shown, see Table S1). Remarkably, we observe a uniform increase in the peak dwell time position with increasing DNA lengths, with the exception of DNA lengths in the range 6–20 kbp, for which there is a significant scattered trail of events with shorter dwell times. After having confirmed using gel electrophoresis that our long DNA fragments are not contaminated with shorter DNA fragments (see Fig. S5), we believe that transport of DNA fragments longer than 6 kbp often involves other processes that are a result of the coil size (e.g., DNA shearing, DNA escape, etc.). However, because this only occurs for a minor fraction of the events, the analytical power of small pores is not entirely limited to DNA lengths below 6 kbp. After having extracted peak dwell times from curve fitting the data for each DNA length, we plot the characteristic dwell time td vs. N in the regime 35 < N < 20,000 bp (see Fig. 6 c). The uncertainty in dwell time displayed for each data point is the standard error of the mean (see Table S1). Fitting the results to a power law (i.e., td ∼ Nα) we obtain an exponent of α = 1.37 with a Pearson’s chi-squared of R2 = 0.98. Power laws such as this have been previously obtained using Monte Carlo simulations (99,100) as well as Langevin and MD simulations (101–104) for dsDNA transport through synthetic pores, although quite a broad range of power laws has been suggested (105). However, the similarity among different reports is striking: experimental studies using d ∼10 nm pores obtained similar values of α = 1.27 (16) and α = 1.34 (17) to our results, and similarly, for d = 4 nm, α = 1.4 was found for short DNA fragments (55). In contrast with the latter cited power law, in our experiments we have found a single power-law relationship for the entire DNA length range tested. This power law further suggests a single transport process that does not suffer from stalling mechanisms due to DNA coil self-interference. Reducing the pore diameter to the 2.8–3.0 nm regime helps to eliminate adverse and anomalous motions of DNA transport. However, a standing question that remains is: why is a scaling of α = 1.3–1.4 for dsDNA transport so persistent for such a wide range of nanopore diameters and experimental conditions? Although there are two distinct power-law regimes that are expected, namely, a scale-free mean velocity (i.e., α = 1) in the limit of strongly interacting pores (106) and a parabolic dependence (α = 2–2.5) in the diffusive regime (bias-free escape) (107,108), power laws that are pore diameter-independent imply that for voltage-driven dsDNA translocations hydrodynamic interactions play a pronounced role.
Figure 6.
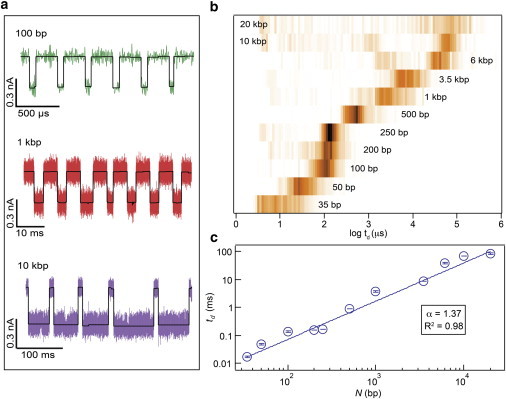
Scaling of transport time td as a function of DNA length N. (a) Sample concatenated traces of consecutive events for 100 bp, 1 kbp, and 10 kbp with included analysis fits (black solid lines). (b) The normalized dwell time histograms for N = 35 bp–20 kbp in 2.9 ± 0.1 nm SiN nanopores (200 mV, pH 7.9, 25°C). Notably, each DNA length <6 kbp has only one event population in contrast to past results with small nanopores. (c) A logarithmic plot of 〈td〉 vs. N for DNA translocation through pores with d = 2.9 ± 0.1 nm. By fitting our data using a power-law function (td ∼ Nα) for 35 bp < N < 20,000 bp we extract a power exponent α = 1.37. To see this figure in color, go online.
Single-pulse discrimination of DNA lengths
As a demonstration of the high resolution of our nanopores regarding DNA contour length, we used a pore of d = 2.6 nm and beff = 6 nm to differentiate between two short DNA lengths: 100 and 500 bp. Upon the addition of a mixture of 100 and 500 bp (1:1 ratio, 30 nM of each length) to the cis chamber, it was apparent in real time that two dwell time populations existed as highlighted by asterisks in Fig. 7 a. When binning the transport time data, as shown in Fig. 7 b, we clearly observe two distinct populations for 100 and 500 bp with an overlap of <3%. The calculated mean dwell times of 190 and 970 μs correspond well to the values displayed in Fig. 6 c for pores with d = 2.8–3.0 nm, which is due to the use of a thinner pore (6 nm in this case, as compared to 8 nm previously). As an additional confirmation of identifying the correct DNA lengths, we ran the same DNA samples individually in pores of identical dimensions to see if we would obtain similar values for dwell time 〈td〉. As illustrated in the inset of Fig. 7 b, we found that 100 and 500 bp samples yielded highly distinguishable populations with 〈td〉 of 210 and 880 μs, respectively. When we set a threshold dwell time of 450 μs (pink dotted line), we find that 98.4% of 100 bp events fall below this limit, whereas 97.6% of 500 bp events lie above this cutoff, demonstrating a ∼98% accuracy in differentiating these DNA lengths. When evaluating the relative capture rate in this mixture we find that the capture rate for 500 bp is 68% greater than for 100 bp. This too is in agreement with past results stating that in the presence of an energy barrier for capture due to a small pore, the larger DNA is more likely to be captured (95).
Figure 7.
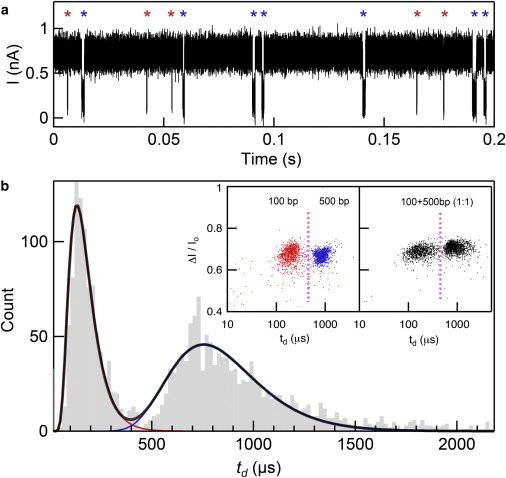
Single-pulse discrimination between two DNA fragments. (a) A continuous current trace for a 60 nM equimolar mixture of 100 and 500 bp in a small, thin nanopore (i.e., d = 2.6 nm, beff = 6 nm) shows a clear distinction between the two different lengths as denoted by the red and blue asterisks (100 and 500 bp). (b) Dwell time distributions of translocation data from panel a show distinct peaks for 100 and 500 bp. Inset: Scatter plots of the fractional current blockade versus dwell time for the translocation of 100 bp (red) and 500 bp (blue) separately and together in an equimolar mixture (black) in pores of comparable size (d = 2.6 nm). Using pores of this size, we are able to distinguish between 100 and 500 bp events with an accuracy of 98.4% and 97.6%, respectively, when dividing the populations at 450 μs (pink dotted line). In the 60 nM mixture, we determine there are 955 and 1347 translocation events for 100 and 500 bp, respectively. To see this figure in color, go online.
Conclusion
We have identified here an optimum pore geometry that leads to smooth transport of double-stranded DNA. The DNA trajectory statistics can be well modeled by first-passage time distributions derived from a 1D drift-diffusion model. The model we have used describes the biased escape of a particle from a trajectory under subjection to a uniform field. Clearly, this 1D model is not sufficiently elaborate for describing a complex process such as semiflexible polymer translocation through thin pores (i.e., nonuniform fields), and other models that capture various phenomena such as polymer-pore interactions and coil effect should be developed and/or implemented to better explain our data. However, we have found that this simple two-parameter model adequately explains our results by providing for each experiment a characteristic axial diffusion coefficient and velocity. Quantitative fits of our data to this model using a bootstrapping algorithm shed light on the DNA translocation process through small pores, and we found that transport through nanopores with d ∼3 nm is smooth, i.e., governed by a drift-diffusion process. Experiments using larger pores in the range 3.4–6.0 nm reveal an additional population with longer dwell times than predicted by the model, which we attribute to DNA coil self-interference that is driven by the external field in larger pores.
We caution the reader that our use of smooth to describe the translocation process does not imply that DNA velocity is constant. For both a single molecule and an ensemble of molecules, translocation velocities are not generally uniform but subject to various types of random forces that overall prescribe normally distributed velocity profiles. We show that the electrophoretic mobility of DNA is smaller than DNA mobility in bulk solution and is a function of applied voltage and pore diameter. Turning to the diameter dependence, experiments and simulations reveal that axial DNA diffusion in small pores is greatly reduced due to confinement, and that this reduced diffusion proportionally reduces the mean velocities to values that are below 0.34 nm/μs (i.e., v/D is constant). The dependence of translocation time on DNA length reveal a power-law scaling with an exponent of 1.37, in good agreement with other experimental results using a range of pore diameters. However, for DNA lengths longer than 6 kbp we have found noticeable (though not major) fractions of observed events with shorter dwell times than the major population, which point to coil-induced complications in the transport process. Fine-tuning our pores for smooth DNA transport enabled us to discriminate between 100 and 500 bp in a mixture from individual pulses with >98% accuracy. This regulation of double-helical DNA transport through nanopores provides a steady control that could prove useful in detecting other structures such as noncanonical DNA motifs, DNA-protein interactions, and epigenetic modifications.
Acknowledgments
The authors thank Michael D. Edge for assistance with bootstrapping, and Andrey Ivankin, Derek Stein, and Murugappan Muthukumar for helpful discussions.
This work was supported by grants from the National Institutes of Health (R21-HG006873 and R01-HG006321, M.W.; R01-HG007406; NSF DMR-0955959 A.A. and J.W.). The authors gladly acknowledge supercomputer time provided through XSEDE Allocation Grant MCA05S028 and the Blue Waters petascale supercomputer system (UIUC).
Supporting Material
Supporting Citations
References (109–115) appear in the Supporting Material.
References
- 1.Kasianowicz J.J., Brandin E., Deamer D.W. Characterization of individual polynucleotide molecules using a membrane channel. Proc. Natl. Acad. Sci. USA. 1996;93:13770–13773. doi: 10.1073/pnas.93.24.13770. [DOI] [PMC free article] [PubMed] [Google Scholar]
- 2.Dekker C. Solid-state nanopores. Nat. Nanotechnol. 2007;2:209–215. doi: 10.1038/nnano.2007.27. [DOI] [PubMed] [Google Scholar]
- 3.Branton D., Deamer D.W., Schloss J.A. The potential and challenges of nanopore sequencing. Nat. Biotechnol. 2008;26:1146–1153. doi: 10.1038/nbt.1495. [DOI] [PMC free article] [PubMed] [Google Scholar]
- 4.Kasianowicz J.J., Robertson J.W.F., Stanford V.M. Nanoscopic porous sensors. Annu. Rev. Anal. Chem. (Palo Alto Calif.) 2008;1:737–766. doi: 10.1146/annurev.anchem.1.031207.112818. [DOI] [PubMed] [Google Scholar]
- 5.Venkatesan B.M., Bashir R. Nanopore sensors for nucleic acid analysis. Nat. Nanotechnol. 2011;6:615–624. doi: 10.1038/nnano.2011.129. [DOI] [PubMed] [Google Scholar]
- 6.Wallace E.V.B., Stoddart D., Bayley H. Identification of epigenetic DNA modifications with a protein nanopore. Chem. Commun. (Camb.) 2010;46:8195–8197. doi: 10.1039/c0cc02864a. [DOI] [PMC free article] [PubMed] [Google Scholar]
- 7.Wanunu M., Cohen-Karni D., Drndic M. Discrimination of methylcytosine from hydroxymethylcytosine in DNA molecules. J. Am. Chem. Soc. 2011;133:486–492. doi: 10.1021/ja107836t. [DOI] [PMC free article] [PubMed] [Google Scholar]
- 8.Shim J., Humphreys G.I., Bashir R. Detection and quantification of methylation in DNA using solid-state nanopores. Sci. Rep. 2013;3:1389. doi: 10.1038/srep01389. [DOI] [PMC free article] [PubMed] [Google Scholar]
- 9.Schreiber J., Wescoe Z.L., Akeson M. Error rates for nanopore discrimination among cytosine, methylcytosine, and hydroxymethylcytosine along individual DNA strands. Proc. Natl. Acad. Sci. USA. 2013;110:18910–18915. doi: 10.1073/pnas.1310615110. [DOI] [PMC free article] [PubMed] [Google Scholar]
- 10.Laszlo A.H., Derrington I.M., Gundlach J.H. Detection and mapping of 5-methylcytosine and 5-hydroxymethylcytosine with nanopore MspA. Proc. Natl. Acad. Sci. USA. 2013;110:18904–18909. doi: 10.1073/pnas.1310240110. [DOI] [PMC free article] [PubMed] [Google Scholar]
- 11.Akeson M., Branton D., Deamer D.W. Microsecond time-scale discrimination among polycytidylic acid, polyadenylic acid, and polyuridylic acid as homopolymers or as segments within single RNA molecules. Biophys. J. 1999;77:3227–3233. doi: 10.1016/S0006-3495(99)77153-5. [DOI] [PMC free article] [PubMed] [Google Scholar]
- 12.Meller A., Nivon L., Branton D. Rapid nanopore discrimination between single polynucleotide molecules. Proc. Natl. Acad. Sci. USA. 2000;97:1079–1084. doi: 10.1073/pnas.97.3.1079. [DOI] [PMC free article] [PubMed] [Google Scholar]
- 13.Meller A., Branton D. Single molecule measurements of DNA transport through a nanopore. Electrophoresis. 2002;23:2583–2591. doi: 10.1002/1522-2683(200208)23:16<2583::AID-ELPS2583>3.0.CO;2-H. [DOI] [PubMed] [Google Scholar]
- 14.Clarke J., Wu H.C., Bayley H. Continuous base identification for single-molecule nanopore DNA sequencing. Nat. Nanotechnol. 2009;4:265–270. doi: 10.1038/nnano.2009.12. [DOI] [PubMed] [Google Scholar]
- 15.Venta K., Shemer G., Drndić M. Differentiation of short, single-stranded DNA homopolymers in solid-state nanopores. ACS Nano. 2013;7:4629–4636. doi: 10.1021/nn4014388. [DOI] [PMC free article] [PubMed] [Google Scholar]
- 16.Storm A.J., Storm C., Dekker C. Fast DNA translocation through a solid-state nanopore. Nano Lett. 2005;5:1193–1197. doi: 10.1021/nl048030d. [DOI] [PubMed] [Google Scholar]
- 17.Fologea D., Brandin E., Li J. DNA conformation and base number simultaneously determined in a nanopore. Electrophoresis. 2007;28:3186–3192. doi: 10.1002/elps.200700047. [DOI] [PMC free article] [PubMed] [Google Scholar]
- 18.Shim J.W., Tan Q., Gu L.-Q. Single-molecule detection of folding and unfolding of the G-quadruplex aptamer in a nanopore nanocavity. Nucleic Acids Res. 2009;37:972–982. doi: 10.1093/nar/gkn968. [DOI] [PMC free article] [PubMed] [Google Scholar]
- 19.Li J., Gershow M., Golovchenko J.A. DNA molecules and configurations in a solid-state nanopore microscope. Nat. Mater. 2003;2:611–615. doi: 10.1038/nmat965. [DOI] [PubMed] [Google Scholar]
- 20.Aksimentiev A., Heng J.B., Schulten K. Microscopic Kinetics of DNA Translocation through synthetic nanopores. Biophys. J. 2004;87:2086–2097. doi: 10.1529/biophysj.104.042960. [DOI] [PMC free article] [PubMed] [Google Scholar]
- 21.Mathé J., Aksimentiev A., Meller A. Orientation discrimination of single-stranded DNA inside the alpha-hemolysin membrane channel. Proc. Natl. Acad. Sci. USA. 2005;102:12377–12382. doi: 10.1073/pnas.0502947102. [DOI] [PMC free article] [PubMed] [Google Scholar]
- 22.Michalet X., Kapanidis A.N., Weiss S. The power and prospects of fluorescence microscopies and spectroscopies. Annu. Rev. Biophys. Biomol. Struct. 2003;32:161–182. doi: 10.1146/annurev.biophys.32.110601.142525. [DOI] [PubMed] [Google Scholar]
- 23.Levy-Sakin M., Ebenstein Y. Beyond sequencing: optical mapping of DNA in the age of nanotechnology and nanoscopy. Curr. Opin. Biotechnol. 2013;24:690–698. doi: 10.1016/j.copbio.2013.01.009. [DOI] [PubMed] [Google Scholar]
- 24.Zirkin S., Fishman S., Ebenstein Y. Lighting up individual DNA damage sites by in vitro repair synthesis. J. Am. Chem. Soc. 2014;136:7771–7776. doi: 10.1021/ja503677n. [DOI] [PubMed] [Google Scholar]
- 25.Lu B., Albertorio F., Golovchenko J.A. Origins and consequences of velocity fluctuations during DNA passage through a nanopore. Biophys. J. 2011;101:70–79. doi: 10.1016/j.bpj.2011.05.034. [DOI] [PMC free article] [PubMed] [Google Scholar]
- 26.Thompson J.F., Oliver J.S. Mapping and sequencing DNA using nanopores and nanodetectors. Electrophoresis. 2012;33:3429–3436. doi: 10.1002/elps.201200136. [DOI] [PubMed] [Google Scholar]
- 27.Olasagasti F., Lieberman K.R., Akeson M. Replication of individual DNA molecules under electronic control using a protein nanopore. Nat. Nanotechnol. 2010;5:798–806. doi: 10.1038/nnano.2010.177. [DOI] [PMC free article] [PubMed] [Google Scholar]
- 28.Lieberman K.R., Cherf G.M., Akeson M. Processive replication of single DNA molecules in a nanopore catalyzed by phi29 DNA polymerase. J. Am. Chem. Soc. 2010;132:17961–17972. doi: 10.1021/ja1087612. [DOI] [PMC free article] [PubMed] [Google Scholar]
- 29.Cherf G.M., Lieberman K.R., Akeson M. Automated forward and reverse ratcheting of DNA in a nanopore at 5-Å precision. Nat. Biotechnol. 2012;30:344–348. doi: 10.1038/nbt.2147. [DOI] [PMC free article] [PubMed] [Google Scholar]
- 30.Manrao E.A., Derrington I.M., Gundlach J.H. Reading DNA at single-nucleotide resolution with a mutant MspA nanopore and phi29 DNA polymerase. Nat. Biotechnol. 2012;30:349–353. doi: 10.1038/nbt.2171. [DOI] [PMC free article] [PubMed] [Google Scholar]
- 31.Laszlo A.H., Derrington I.M., Gundlach J.H. Decoding long nanopore sequencing reads of natural DNA. Nat. Biotechnol. 2014;32:829–833. doi: 10.1038/nbt.2950. [DOI] [PMC free article] [PubMed] [Google Scholar]
- 32.Storm A.J., Chen J.H., Dekker C. Translocation of double-strand DNA through a silicon oxide nanopore. Phys. Rev. E Stat. Nonlin. Soft Matter Phys. 2005;71:051903. doi: 10.1103/PhysRevE.71.051903. [DOI] [PubMed] [Google Scholar]
- 33.Mihovilovic M., Hagerty N., Stein D. Statistics of DNA capture by a solid-state nanopore. Phys. Rev. Lett. 2013;110:028102. doi: 10.1103/PhysRevLett.110.028102. [DOI] [PubMed] [Google Scholar]
- 34.Smeets R.M.M., Kowalczyk S.W., Dekker C. Translocation of RecA-coated double-stranded DNA through solid-state nanopores. Nano Lett. 2009;9:3089–3096. doi: 10.1021/nl803189k. [DOI] [PubMed] [Google Scholar]
- 35.Venkatesan B.M., Estrada D., Bashir R. Stacked graphene-Al2O3 nanopore sensors for sensitive detection of DNA and DNA-protein complexes. ACS Nano. 2012;6:441–450. doi: 10.1021/nn203769e. [DOI] [PMC free article] [PubMed] [Google Scholar]
- 36.Jin Q., Fleming A.M., White H.S. Structural destabilization of DNA duplexes containing single-base lesions investigated by nanopore measurements. Biochemistry. 2013;52:7870–7877. doi: 10.1021/bi4009825. [DOI] [PMC free article] [PubMed] [Google Scholar]
- 37.Wanunu M., Sutin J., Meller A. DNA profiling using solid-state nanopores: detection of DNA-binding molecules. Nano Lett. 2009;9:3498–3502. doi: 10.1021/nl901691v. [DOI] [PMC free article] [PubMed] [Google Scholar]
- 38.Singer A., Wanunu M., Meller A. Nanopore based sequence specific detection of duplex DNA for genomic profiling. Nano Lett. 2010;10:738–742. doi: 10.1021/nl100058y. [DOI] [PMC free article] [PubMed] [Google Scholar]
- 39.Kowalczyk S.W., Hall A.R., Dekker C. Detection of local protein structures along DNA using solid-state nanopores. Nano Lett. 2010;10:324–328. doi: 10.1021/nl903631m. [DOI] [PubMed] [Google Scholar]
- 40.Carlsen A.T., Zahid O.K., Hall A.R. Selective detection and quantification of modified DNA with solid-state nanopores. Nano Lett. 2014;14:5488–5492. doi: 10.1021/nl501340d. [DOI] [PubMed] [Google Scholar]
- 41.Fologea D., Uplinger J., Li J. Slowing DNA translocation in a solid-state nanopore. Nano Lett. 2005;5:1734–1737. doi: 10.1021/nl051063o. [DOI] [PMC free article] [PubMed] [Google Scholar]
- 42.Li J., Talaga D.S. The distribution of DNA translocation times in solid-state nanopores. J. Phys. Condens. Matter. 2010;22:454129. doi: 10.1088/0953-8984/22/45/454129. [DOI] [PMC free article] [PubMed] [Google Scholar]
- 43.Kowalczyk S.W., Wells D.B., Dekker C. Slowing down DNA translocation through a nanopore in lithium chloride. Nano Lett. 2012;12:1038–1044. doi: 10.1021/nl204273h. [DOI] [PMC free article] [PubMed] [Google Scholar]
- 44.Uplinger J., Thomas B., Li J. K(+), Na(+), and Mg(2+) on DNA translocation in silicon nitride nanopores. Electrophoresis. 2012;33:3448–3457. doi: 10.1002/elps.201200165. [DOI] [PMC free article] [PubMed] [Google Scholar]
- 45.Venkatesan B.M., Dorvel B., Bashir R. Highly sensitive, mechanically stable nanopore sensors for DNA analysis. Adv. Mater. 2009;21:2771–2776. doi: 10.1002/adma.200803786. [DOI] [PMC free article] [PubMed] [Google Scholar]
- 46.Larkin J., Henley R., Wanunu M. Slow DNA transport through nanopores in hafnium oxide membranes. ACS Nano. 2013;7:10121–10128. doi: 10.1021/nn404326f. [DOI] [PMC free article] [PubMed] [Google Scholar]
- 47.Lu B., Hoogerheide D.P., Golovchenko J.A. Pressure-controlled motion of single polymers through solid-state nanopores. Nano Lett. 2013;13:3048–3052. doi: 10.1021/nl402052v. [DOI] [PMC free article] [PubMed] [Google Scholar]
- 48.Zhang H., Zhao Q., Yu D. Slowing down DNA translocation through solid-state nanopores by pressure. Small. 2013;9:4112–4117. doi: 10.1002/smll.201301263. [DOI] [PubMed] [Google Scholar]
- 49.Kim Y.R., Min J., Ko C. Nanopore sensor for fast label-free detection of short double-stranded DNAs. Biosens. Bioelectron. 2007;22:2926–2931. doi: 10.1016/j.bios.2006.12.003. [DOI] [PubMed] [Google Scholar]
- 50.Wanunu M., Meller A. Chemically modified solid-state nanopores. Nano Lett. 2007;7:1580–1585. doi: 10.1021/nl070462b. [DOI] [PubMed] [Google Scholar]
- 51.Anderson B.N., Muthukumar M., Meller A. pH tuning of DNA translocation time through organically functionalized nanopores. ACS Nano. 2013;7:1408–1414. doi: 10.1021/nn3051677. [DOI] [PMC free article] [PubMed] [Google Scholar]
- 52.Wang D., Harrer S., Afzali-Ardakani A. Regulating the transport of DNA through biofriendly nanochannels in a thin solid membrane. Sci. Rep. 2014;4:3985. doi: 10.1038/srep03985. [DOI] [PMC free article] [PubMed] [Google Scholar]
- 53.Squires A.H., Hersey J.S., Meller A. A nanopore-nanofiber mesh biosensor to control DNA translocation. J. Am. Chem. Soc. 2013;135:16304–16307. doi: 10.1021/ja408685x. [DOI] [PMC free article] [PubMed] [Google Scholar]
- 54.Heng J.B., Ho C., Timp G. Sizing DNA using a nanometer-diameter pore. Biophys. J. 2004;87:2905–2911. doi: 10.1529/biophysj.104.041814. [DOI] [PMC free article] [PubMed] [Google Scholar]
- 55.Wanunu M., Sutin J., Meller A. DNA translocation governed by interactions with solid-state nanopores. Biophys. J. 2008;95:4716–4725. doi: 10.1529/biophysj.108.140475. [DOI] [PMC free article] [PubMed] [Google Scholar]
- 56.Briggs K., Kwok H., Tabard-Cossa V. Automated fabrication of 2-nm solid-state nanopores for nucleic acid analysis. Small. 2014;10:2077–2086. doi: 10.1002/smll.201303602. [DOI] [PubMed] [Google Scholar]
- 57.van den Hout M., Krudde V., Dekker N.H. Distinguishable populations report on the interactions of single DNA molecules with solid-state nanopores. Biophys. J. 2010;99:3840–3848. doi: 10.1016/j.bpj.2010.10.012. [DOI] [PMC free article] [PubMed] [Google Scholar]
- 58.Carlsen A.T., Zahid O.K., Hall A.R. Interpreting the conductance blockades of DNA translocations through solid-state nanopores. ACS Nano. 2014;8:4754–4760. doi: 10.1021/nn501694n. [DOI] [PubMed] [Google Scholar]
- 59.Raillon C., Granjon P., Radenovic A. Fast and automatic processing of multi-level events in nanopore translocation experiments. Nanoscale. 2012;4:4916–4924. doi: 10.1039/c2nr30951c. [DOI] [PubMed] [Google Scholar]
- 60.Phillips J.C., Braun R., Schulten K. Scalable molecular dynamics with NAMD. J. Comput. Chem. 2005;26:1781–1802. doi: 10.1002/jcc.20289. [DOI] [PMC free article] [PubMed] [Google Scholar]
- 61.Darden T., York D., Pedersen L. Particle mesh Ewald: An N.log (N) method for Ewald sums in large systems. J. Chem. Phys. 1993;98:10089–10092. [Google Scholar]
- 62.Batcho P.F., Case D.A., Schlick T. Optimized particle-mesh Ewald/multiple-time step integration for molecular dynamics simulations. J. Chem. Phys. 2001;115:4003–4018. [Google Scholar]
- 63.Andersen H.C. RATTLE: A “Velocity” version of the SHAKE algorithm for molecular dynamics calculations. J. Comput. Phys. 1983;52:24–34. [Google Scholar]
- 64.Miyamoto S., Kollman P.A. SETTLE: an analytical version of the SHAKE and RATTLE algorithm for rigid water models. J. Comput. Chem. 1992;13:952–962. [Google Scholar]
- 65.MacKerell A.D., Bashford D., Karplus M. All-atom empirical potential for molecular modeling and dynamics studies of proteins. J. Phys. Chem. B. 1998;102:3586–3616. doi: 10.1021/jp973084f. [DOI] [PubMed] [Google Scholar]
- 66.Yoo J., Aksimentiev A. Improved parameterization of Li+, Na+, K+, and Mg2+ ions for all-atom molecular dynamics simulations of nucleic acid systems. J. Phys. Chem. Lett. 2012;3:45–50. [Google Scholar]
- 67.Heng J.B., Aksimentiev A., Timp G. The electromechanics of DNA in a synthetic nanopore. Biophys. J. 2006;90:1098–1106. doi: 10.1529/biophysj.105.070672. [DOI] [PMC free article] [PubMed] [Google Scholar]
- 68.Martyna G.J., Tobias D.J., Klein M.L. Constant pressure molecular dynamics algorithms. J. Chem. Phys. 1994;101:4177–4189. [Google Scholar]
- 69.Shore D., Langowski J., Baldwin R.L. DNA flexibility studied by covalent closure of short fragments into circles. Proc. Natl. Acad. Sci. USA. 1981;78:4833–4837. doi: 10.1073/pnas.78.8.4833. [DOI] [PMC free article] [PubMed] [Google Scholar]
- 70.Muthukumar M. CRC Press; Boca Raton, FL: 2011. Polymer Translocation. [Google Scholar]
- 71.Ling D.Y., Ling X.S. On the distribution of DNA translocation times in solid-state nanopores: an analysis using Schrödinger’s first-passage-time theory. J. Phys. Condens. Matter. 2013;25:375102. doi: 10.1088/0953-8984/25/37/375102. [DOI] [PMC free article] [PubMed] [Google Scholar]
- 72.Zhou Z., Hu Y., Lu X. DNA translocation through hydrophilic nanopore in hexagonal boron nitride. Sci. Rep. 2013;3:3287. doi: 10.1038/srep03287. [DOI] [PMC free article] [PubMed] [Google Scholar]
- 73.Wanunu M., Dadosh T., Drndić M. Rapid electronic detection of probe-specific microRNAs using thin nanopore sensors. Nat. Nanotechnol. 2010;5:807–814. doi: 10.1038/nnano.2010.202. [DOI] [PubMed] [Google Scholar]
- 74.Kowalczyk S.W., Grosberg A.Y., Dekker C. Modeling the conductance and DNA blockade of solid-state nanopores. Nanotechnology. 2011;22:315101. doi: 10.1088/0957-4484/22/31/315101. [DOI] [PubMed] [Google Scholar]
- 75.Chen P., Gu J., Branton D. Probing single DNA molecule transport using fabricated nanopores. Nano Lett. 2004;4:2293–2298. doi: 10.1021/nl048654j. [DOI] [PMC free article] [PubMed] [Google Scholar]
- 76.Nkodo A.E., Garnier J.M., Slater G.W. Diffusion coefficient of DNA molecules during free solution electrophoresis. Electrophoresis. 2001;22:2424–2432. doi: 10.1002/1522-2683(200107)22:12<2424::AID-ELPS2424>3.0.CO;2-1. [DOI] [PubMed] [Google Scholar]
- 77.Stellwagen E., Stellwagen N.C. Determining the electrophoretic mobility and translational diffusion coefficients of DNA molecules in free solution. Electrophoresis. 2002;23:2794–2803. doi: 10.1002/1522-2683(200208)23:16<2794::AID-ELPS2794>3.0.CO;2-Y. [DOI] [PubMed] [Google Scholar]
- 78.McMullen A., de Haan H.W., Stein D. Stiff filamentous virus translocations through solid-state nanopores. Nat. Commun. 2014;5:4171. doi: 10.1038/ncomms5171. [DOI] [PubMed] [Google Scholar]
- 79.Wang L., Yu H. Chain conformation of linear polyelectrolyte in salt solutions: sodium poly (styrenesulfonate) in potassium chloride and sodium chloride. Macromolecules. 1988;21:3498–3501. [Google Scholar]
- 80.Nicolai T., Mandel M. Dynamic light scattering by aqueous solutions of low-molar-mass DNA fragments in the presence of sodium chloride. Macromolecules. 1989;22:2348–2356. [Google Scholar]
- 81.Goinga H.T., Pecora R. Dynamics of low molecular weight DNA fragments in dilute and semidilute solutions. Macromolecules. 1991;24:6128–6138. [Google Scholar]
- 82.Maier B., Rädler J.O. Conformation and self-diffusion of single DNA molecules confined to two dimensions. Phys. Rev. Lett. 1999;82:1911. [Google Scholar]
- 83.Stellwagen N.C., Magnusdottir S., Righetti P.G. Measuring the translational diffusion coefficients of small DNA molecules by capillary electrophoresis. Biopolymers. 2001;58:390–397. doi: 10.1002/1097-0282(20010405)58:4<390::AID-BIP1015>3.0.CO;2-K. [DOI] [PubMed] [Google Scholar]
- 84.Stellwagen E., Lu Y., Stellwagen N.C. Unified description of electrophoresis and diffusion for DNA and other polyions. Biochemistry. 2003;42:11745–11750. doi: 10.1021/bi035203p. [DOI] [PubMed] [Google Scholar]
- 85.Larkin J., Henley R.Y., Wanunu M. High-bandwidth protein analysis using solid-state nanopores. Biophys. J. 2014;106:696–704. doi: 10.1016/j.bpj.2013.12.025. [DOI] [PMC free article] [PubMed] [Google Scholar]
- 86.Soni G.V., Singer A., Meller A. Synchronous optical and electrical detection of biomolecules traversing through solid-state nanopores. Rev. Sci. Instrum. 2010;81:014301. doi: 10.1063/1.3277116. [DOI] [PMC free article] [PubMed] [Google Scholar]
- 87.Merchant C.A., Healy K., Drndić M. DNA translocation through graphene nanopores. Nano Lett. 2010;10:2915–2921. doi: 10.1021/nl101046t. [DOI] [PubMed] [Google Scholar]
- 88.Venkatesan B.M., Shah A.B., Bashir R. DNA sensing using nano-crystalline surface enhanced Al(2)O(3) nanopore sensors. Adv. Funct. Mater. 2010;20:1266–1275. doi: 10.1002/adfm.200902128. [DOI] [PMC free article] [PubMed] [Google Scholar]
- 89.Renkin E.M. Filtration, diffusion, and molecular sieving through porous cellulose membranes. J. Gen. Physiol. 1954;38:225–243. [PMC free article] [PubMed] [Google Scholar]
- 90.Hoogerheide D.P., Albertorio F., Golovchenko J.A. Escape of DNA from a weakly biased thin nanopore: experimental evidence for a universal diffusive behavior. Phys. Rev. Lett. 2013;111:248301. doi: 10.1103/PhysRevLett.111.248301. [DOI] [PMC free article] [PubMed] [Google Scholar]
- 91.Aksimentiev A. Deciphering ionic current signatures of DNA transport through a nanopore. Nanoscale. 2010;2:468–483. doi: 10.1039/b9nr00275h. [DOI] [PMC free article] [PubMed] [Google Scholar]
- 92.Keyser U.F., Koeleman B.N., Dekker C. Direct force measurements on DNA in a solid-state nanopore. Nat. Phys. 2006;2:473–477. [Google Scholar]
- 93.van Dorp S., Keyser U.F., Lemay S.G. Origin of the electrophoretic force on DNA in solid-state nanopores. Nat. Phys. 2009;5:347–351. [Google Scholar]
- 94.Liu H., Qian S., Bau H.H. The effect of translocating cylindrical particles on the ionic current through a nanopore. Biophys. J. 2007;92:1164–1177. doi: 10.1529/biophysj.106.089268. [DOI] [PMC free article] [PubMed] [Google Scholar]
- 95.Wanunu M., Morrison W., Meller A. Electrostatic focusing of unlabelled DNA into nanoscale pores using a salt gradient. Nat. Nanotechnol. 2010;5:160–165. doi: 10.1038/nnano.2009.379. [DOI] [PMC free article] [PubMed] [Google Scholar]
- 96.He Y., Tsutsui M., Kawai T. Gate manipulation of DNA capture into nanopores. ACS Nano. 2011;5:8391–8397. doi: 10.1021/nn203186c. [DOI] [PubMed] [Google Scholar]
- 97.Lu B., Hoogerheide D.P., Yu D. Effective driving force applied on DNA inside a solid-state nanopore. Phys. Rev. E Stat. Nonlin. Soft Matter Phys. 2012;86:011921. doi: 10.1103/PhysRevE.86.011921. [DOI] [PubMed] [Google Scholar]
- 98.He Y., Tsutsui M., Kawai T. Mechanism of how salt-gradient-induced charges affect the translocation of DNA molecules through a nanopore. Biophys. J. 2013;105:776–782. doi: 10.1016/j.bpj.2013.05.065. [DOI] [PMC free article] [PubMed] [Google Scholar]
- 99.Dubbeldam J.L.A., Milchev A., Vilgis T.A. Driven polymer translocation through a nanopore: a manifestation of anomalous diffusion. Europhys. Lett. 2007;79:18002. [Google Scholar]
- 100.Vocks H., Panja D., Ball R.C. Pore-blockade times for field-driven polymer translocation. J. Phys. Condens. Matter. 2008;20:095224. [Google Scholar]
- 101.Luo K., Ollila S.T.T., Bhattacharya A. Dynamical scaling exponents for polymer translocation through a nanopore. Phys. Rev. E Stat. Nonlin. Soft Matter Phys. 2008;78:050901. doi: 10.1103/PhysRevE.78.050901. [DOI] [PubMed] [Google Scholar]
- 102.Fyta M., Melchionna S., Kaxiras E. Hydrodynamic correlations in the translocation of a biopolymer through a nanopore: theory and multiscale simulations. Phys. Rev. E Stat. Nonlin. Soft Matter Phys. 2008;78:036704. doi: 10.1103/PhysRevE.78.036704. [DOI] [PubMed] [Google Scholar]
- 103.Izmitli A., Schwartz D.C., de Pablo J.J. The effect of hydrodynamic interactions on the dynamics of DNA translocation through pores. J. Chem. Phys. 2008;128:085102. doi: 10.1063/1.2831777. [DOI] [PubMed] [Google Scholar]
- 104.Bhattacharya A., Morrison W.H., Binder K. Scaling exponents of forced polymer translocation through a nanopore. Eur. Phys. J. E Soft Matter. 2009;29:423–429. doi: 10.1140/epje/i2009-10495-5. [DOI] [PubMed] [Google Scholar]
- 105.Panja D., Barkema G.T., Kolomeisky A.B. Through the eye of the needle: recent advances in understanding biopolymer translocation. J. Phys. Condens. Matter. 2013;25:413101. doi: 10.1088/0953-8984/25/41/413101. [DOI] [PubMed] [Google Scholar]
- 106.Lubensky D.K., Nelson D.R. Driven polymer translocation through a narrow pore. Biophys. J. 1999;77:1824–1838. doi: 10.1016/S0006-3495(99)77027-X. [DOI] [PMC free article] [PubMed] [Google Scholar]
- 107.Muthukumar M. Polymer translocation through a hole. J. Chem. Phys. 1999;111:10371–10374. [Google Scholar]
- 108.Chuang J., Kantor Y., Kardar M. Anomalous dynamics of translocation. Phys. Rev. E Stat. Nonlin. Soft Matter Phys. 2002;65:011802. doi: 10.1103/PhysRevE.65.011802. [DOI] [PubMed] [Google Scholar]
- 109.Kim M.J., Wanunu M., Meller A. Rapid fabrication of uniformly sized nanopores and nanopore arrays for parallel DNA analysis. Adv. Mater. 2006;18:3149–3155. [Google Scholar]
- 110.Kim M.J., McNally B., Meller A. Characteristics of solid-state nanometre pores fabricated using a transmission electron microscope. Nanotechnology. 2007;18:205302. [Google Scholar]
- 111.Smeets R.M.M., Keyser U.F., Dekker C. Noise in solid-state nanopores. Proc. Natl. Acad. Sci. USA. 2008;105:417–421. doi: 10.1073/pnas.0705349105. [DOI] [PMC free article] [PubMed] [Google Scholar]
- 112.Tabard-Cossa V., Trivedi D., Marziali A. Noise analysis and reduction in solid-state nanopores. Nanotechnology. 2007;18:305505. [Google Scholar]
- 113.Hall J.E. Access resistance of a small circular pore. J. Gen. Physiol. 1975;66:531–532. doi: 10.1085/jgp.66.4.531. [DOI] [PMC free article] [PubMed] [Google Scholar]
- 114.Vodyanoy I., Bezrukov S.M. Sizing of an ion pore by access resistance measurements. Biophys. J. 1992;62:10–11. doi: 10.1016/S0006-3495(92)81762-9. [DOI] [PMC free article] [PubMed] [Google Scholar]
- 115.Li G., Tang J.X. Diffusion of actin filaments within a thin layer between two walls. Phys. Rev. E Stat. Nonlin. Soft Matter Phys. 2004;69:061921. doi: 10.1103/PhysRevE.69.061921. [DOI] [PubMed] [Google Scholar]
Associated Data
This section collects any data citations, data availability statements, or supplementary materials included in this article.