

Abstract
• Background and Aims Cassava (Manihot esculenta) is an important food crop in the tropics that has a high growth rate in optimal conditions, but also performs well in drought-prone climates. The objectives of this work were to determine the effects of water deficit and rewatering on the rate of expansion of leaves at different developmental stages and to evaluate the extent to which decreases in cell proliferation, expansion, and delay in development are responsible for reduced growth.
• Methods Glasshouse-grown cassava plants were subjected to 8 d of water deficit followed by rewatering. Leaves at 15 developmental stages from nearly full size to meristematic were sampled, and epidermal cell size and number were measured on leaves at four developmental stages.
• Key Results Leaf expansion and development were nearly halted during stress but resumed vigorously after rewatering. In advanced-stage leaves (Group 1) in which development was solely by cell expansion, expansion resumed after rewatering, but not sufficiently for cell size to equal that of controls at maturity. In Group 2 (cell proliferation), relative expansion rate and cell proliferation were delayed until rewatering, but then recovered partially, so that loss of leaf area was due to decreased cell numbers per leaf. In Group 3 (early meristematic development) final leaf area was not affected by stress, but development was delayed by 4–6 d. On a plant basis, the proportion of loss of leaf area over 26 d attributed to leaves at each developmental stage was 29, 50 and 21 % in Group 1, 2 and 3, respectively.
• Conclusions Although cell growth processes were sensitive to mild water deficit, they recovered to a large extent, and much of the reduction in leaf area was caused by developmental delay and a reduction in cell division in the youngest, meristematic leaves.
Key words: Cassava, Manihot esculenta, water deficit, drought, leaf, expansion growth, cell proliferation, cell division, cell production, cell size
INTRODUCTION
Cassava (Manihot esculenta) is an important food source in the human diet of the tropics, particularly in regions where rainfall distribution is not uniform, with periodic water deficits during the growing season and prolonged drought during the dry season. In response to mild drought, cassava reduces transpiration substantially by closing its stomata, as do other species that act to retain water during drought episodes (El Sharkawy et al., 1984; Tardieu and Simonneau, 1998; Alves and Setter, 2000). In contrast, the extent of other drought responses, such as osmotic adjustment and accumulation of dehydrin proteins, is small (Ike and Thurtell, 1981; Alves and Setter, 2004). This is similar to the behaviour of many highly productive species, such as cowpea (Vigna unguiculata) and maize (Zea mays), when they are grown in environments with short-term episodic droughts (Itani et al., 1992; Serraj and Sinclair, 2002). Leaf area expansion also decreases upon imposition of water deficit, such that expansion and development of the transpirational surface is drastically decreased. It is thought that such arrested growth, with limited investment in osmolyte production, assists plants in attaining high productivity in environments with cycles of intermittent drought, followed by rewatering (Serraj and Sinclair, 2002; Alves and Setter, 2004). By minimizing investment of resources in osmolyte accumulation and leaf growth during a drought episode, more resources are available for recovery of growth and metabolic activities after renewed rainfall, when the bulk of growth occurs.
While much is known about stress effects that are concurrent with water deficit, much less is known about effects during recovery after rewatering. It is generally observed that growth resumes after a mild, short-term stress, but growing cells may not expand fully to the size of controls, and water stress may reduce the number of cells produced per leaf (Lecoeur et al., 1995; Schuppler et al., 1998; Granier and Tardieu, 1999; Tardieu et al., 2000). In the case of decreased cell production, the apparent after-effect on leaf growth may be because leaf meristems produce fewer cells under stress, so that fewer are available for expansion in the post-treatment phase (Granier et al., 2000). In addition, the rate of new leaf initiation by apical meristems can limit future growth (Marc and Palmer, 1976). Hence, to obtain a complete picture of the effects on leaf growth of a short-term water deficit, it is necessary to evaluate cell expansion, cell proliferation and leaf initiation, both under stress and during recovery. However, in many studies of short-term water deficit, only some of these parameters are evaluated because observations in the post-treatment phase are not continued for long enough. In the current study, the objectives were to evaluate the effects of water deficit and rewatering on growth rate in leaves at various developmental stages, and to determine the extent to which decreases in cell expansion, proliferation, and delay in development are responsible for inhibition of cassava leaf growth.
MATERIALS AND METHODS
Plant material and growth conditions
The cassava (Manihot esculenta Crantz) cultivar BGM 252 (or ‘Manteiga’), which is widely grown in the lowland subhumid tropics of north-east Brazil, was used in these studies. For propagation, stem segments, each containing two nodes and an intervening internode, were cut from a single 11-month-old plant, and planted vertically in 3-L pots with peat moss : vermiculite : perlite (1 : 1 : 1, v/v/v) supplemented with 5 g of Peter's 15-16-17 mineral fertilizer (Scotts Company, Maryville, OH, USA), 2 g of pulverized limestone, 6 g of FeSO4, 0.3 g of trace elements (Peter's FTE 555) and 1 g of wetting agent (AquaGro G; Aquatrols, Pennsauken, NJ, USA). The plants were grown in a glasshouse from October to January at mean day/night temperatures of 25/17 °C, and max/min temperatures of 28/14 °C. Ambient solar illumination, which averaged 9.6 mol of photons (400–700 nm) m−2 d−1 was supplemented with 12.5 mol photons m−2 d−1 from 1000 W metal halide lamps (Duraglo, GE Inc., Hendersonville, NC, USA). Pots were irrigated every 2 h during the day with nutrient solution containing 1.08 g of Peter's 15-16-17 per litre; sufficient solution was added to exceed transpiration and leach excess salts.
Water deficit treatments and statistical design
At 73 d after planting (DAP) (day 0), 12 plants were selected for uniformity of size and vigour. These plants had a mean of 24 ± 1 unfolded leaves, with 12 leaves on the main stem and six on each bifurcation branch of the main stem. Control and water stress treatments were assigned to these plants in a completely random design. Before planting, each pot was filled with the same amount of substrate so that the weight of each pot was 500 g. Pots were fully wetted with irrigation solution and allowed to drain freely to determine weight at ‘field capacity’ (FC). The mean initial weight of the pots with soil at FC (PSFC) was 1388 g. On day 0, the weight of pot + soil at FC + plant (PSFCC0) was determined and plant weight at day 0 (C0) was estimated by: C0 = PSFCC0 − PSFC. The water content at time t relative to field capacity (%FCt) was calculated using the equation: %FCt = [(PSCt − C0)/PSFC] × 100. The water-stress pots were allowed to lose soil water until they were at <30 % of FC, and then maintained at this target water content for 8 d. At 12:30 PM (Eastern Standard Time) each day, ‘pot + soil + plant’ (PSCt) were weighed and water was added to the 30 % FC set point (water deficit) or 100 % FC (well-watered control), according to the equation above. PSCt weights of control and water deficit treatments were used to calculate total plant transpiration rate.
Leaf area expansion
On the 8th day after imposition of water stress, six randomly selected plants (three from control and three from stressed treatments) were sampled and harvested. The six remaining plants were rewatered and sampled daily until day 52. Estimates of pooled s.e.m. for leaf area were calculated by averaging the variances for each data-point mean divided by the square root of the number of replicates in each mean (six). On each plant, leaves were identified on day 0 according to their nodal position with respect to the youngest fully expanded leaf, L0, and numbered acropetally, L1, L2, etc. At day 0, leaves L1 to L4 were unfolded and in the phase of rapid expansion; leaves L5 to L11 were still folded but not ensheathed by stipules; and leaves L12 to L15 were <0.1 % of their final mature leaf area and were ensheathed by stipules. On a whole plant basis, L1 corresponded to the 15th leaf above the soil surface. At day 0, leaf L5 was tagged and, at 2-d intervals, the central lobe length of leaf blades of L1 to L7 were measured to 0.1 mm with a ruler. Leaf area (A) was estimated using the equation: A = 0.9441 × L1.8985, where L is central lobe length (cm), as previously determined for this cultivar (Alves and Setter, 2000). As each plant had a bifurcation (two branches), two measurements were obtained per leaf stage for each plant. Leaf area and leaf area expansion rate were calculated from the increment of leaf area at each 2-d interval and expressed in cm2 d−1. Relative expansion rate (RER) of each leaf was determined by linear regression of leaf area at sampling times i − 1, i, and i + 1 as: RERi = [d(lnA)/dt]i.
Analysis of cell size and number
When each leaf had reached full expansion, 20 small leaf discs (diameter 0.5 cm) were cut from the middle region (avoiding the major veins) of the three largest leaf lobes and fixed in ethanol : glacial acetic acid (3 : 1, v/v) in a 1.5-mL conical tube. Discs were sequentially rehydrated during 20 min in 75, 50, 25 and 0 % ethanol (v/v) and blotted on filter paper. The abaxial leaf surface was placed on sticky tape, and the adaxial surface was covered with a clear polyacrylic nail polish and allowed to dry. Disc epidermal imprints from the adaxial leaf surface were peeled off under a dissecting microscope, and placed on slides with cover glasses. Three imprints from three different plants (replicates) in control and stressed treatments and of a haemacytometer calibration grid were observed at ×200 magnification under light microscopy (Olympus BH-2) with an attached photographic camera (Olympus C-35AD-4). Three views of three different fields of each disc imprint were photographed, as illustrated in Fig. 1. For each stage of leaf development, 18 images were obtained, nine from control (3 replicates × 3 photos) and nine from stressed plants. The photographs were scanned (Sony CCD-TR93 camera) and digitized (Snappy 3.0, Play Inc., Rancho Cordova, CA, USA). The number of cells in a 0.075 mm2 area was counted and the mean paradermal area of individual cells was calculated from digitized images using the UTHSCSA Image Tool program version 1.28 (University of Texas Health Science Center at San Antonio, TX, USA; FTP address: http://ddsdx.uthscsa.edu/dig/).
Fig. 1.
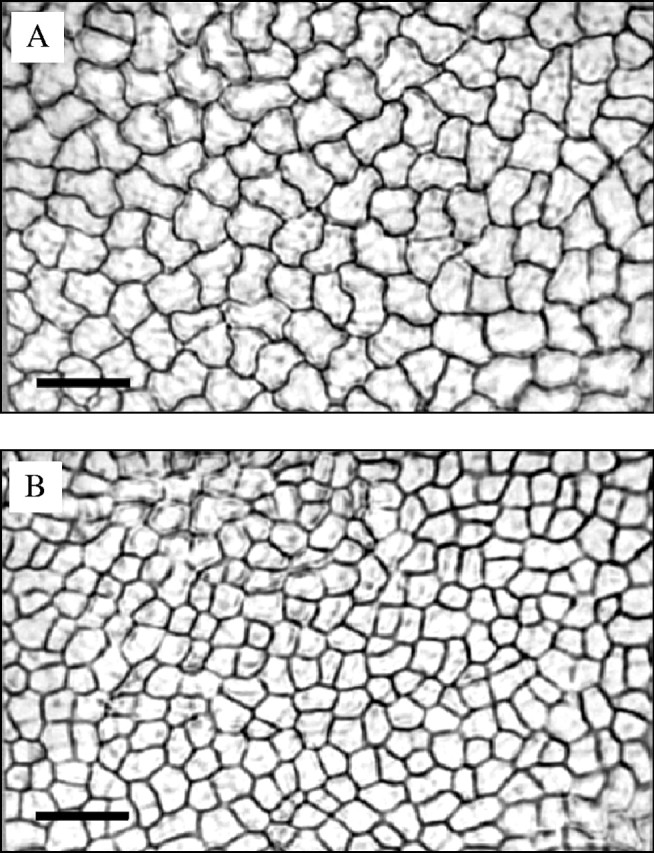
Adaxial epidermal cells of fully expanded cassava leaves in well-watered (A) and water-stressed (B) plants. At the start of water stress the leaves were folded, at 4.5 % of final area (corresponding to leaf L5). Scale bars = 50 µm.
RESULTS
Water deficit and plant transpiration
After withholding irrigation, soil water content decreased to the target (30 % of FC) between day 2 and day 3, when transpiration rate was about 15 % of well-watered controls (Fig. 2). This target water status was maintained from day 3 to day 8 with small daily irrigations to maintain soil water content for the stressed plants at between 25 and 30 % of FC, while in controls it was 70–100 % of FC. After full re-watering on day 8, the transpiration rate of the stressed plants rose to 56 % of controls (98 % on a leaf area basis, data not shown) within 2 d, and then gradually to 90 % of controls by day 25.
Fig. 2.
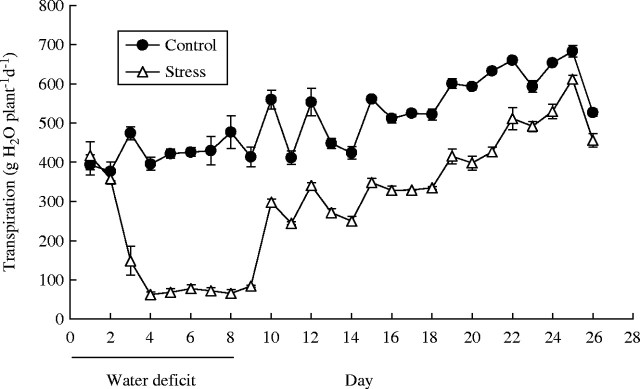
The response of plant transpiration rate to an 8-d period of water deficit followed by rewatering. Each point is the mean of three replicate plants ± s.e.m.
Growth of individual leaves
Leaves L1 to L15 of well-watered plants unfolded and expanded in a uniform, sequential pattern (Fig. 3). Water stress disrupted this pattern such that expansion was nearly halted during stress. Although it resumed after rewatering, the development of stressed plants was delayed, and individual leaf areas at full expansion were less than controls. The disruption was also apparent in terms of relative expansion rate (RER), especially during the stress period (Fig. 4). The impacts of stress on the patterns of growth depended on the developmental stage at which stress was imposed. Leaves L1 to L5 (Group 1) had unfolded and entered the phase of rapid expansion (>5 cm2 d−1) when soil water content approached the stress set point on day 2–3; in these leaves, stress slowed or halted expansion, and although it resumed after rewatering, final areas were 17–44 % less than controls (Fig. 3). In leaves L6 to L11 (Group 2), which had not yet begun the final phase of rapid expansion when the plants first experienced stress (day 3), the resumed expansion after rewatering approximated to a sigmoid pattern (Fig. 3), and RER recovered to values approaching controls (Fig. 4). Nevertheless, leaf expansion was substantially delayed, and final areas were 14–34 % less than controls. The full expansion of leaves L12 to L15 (Group 3), which were at an early stage when water deficit was imposed, was delayed by 4–6 d, but final leaf area did not differ from controls.
Fig. 3.
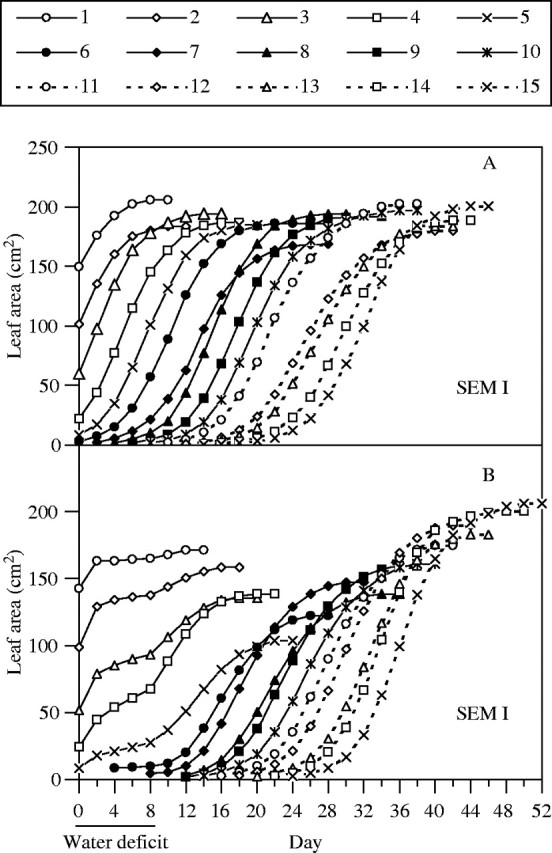
Time courses of expansion of leaves of control (A) and water-stressed (B) plants during an 8-d period of water deficit, and after rewatering. Leaves numbered 1–15 (from base to apex of plants) are shown. Pooled estimate of s.e.m. is shown, n = 6.
Fig. 4.
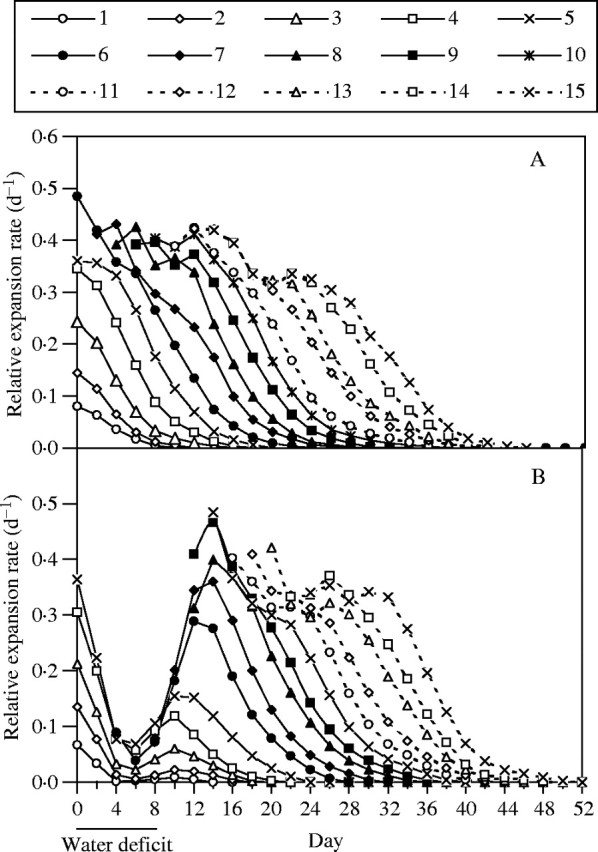
Time courses of relative expansion rate (RER) of leaves of control (A) and water-stressed (B) plants during an 8-d water deficit and after rewatering. Leaves numbered 1–15 (from base to apex of plants) are shown.
Cell proliferation and expansion
To determine how stress affected the components of expansion of each of these groups of leaves, epidermal cell numbers and cell areas in representative leaves of each developmental stage (Fig. 5) were measured. In L3 and L5 (Group 1), the decreases in final leaf area were due to decreased individual cell areas, while cell numbers were unaffected. In L6 and L8 (Group 2), leaf area reduction was due to corresponding decreases in cell numbers per leaf, while cell areas were unaffected. In L15 (Group 3), final leaf area was not affected by stress, and stress did not affect cell numbers or cell size. The behaviour of L5 and L6 indicated that leaves in Group 1 lost leaf area due to reduced cell expansion and smaller cell areas, whereas leaves in Group 2 lost leaf area due to reductions in cell proliferation and fewer cells per leaf.
Fig. 5.
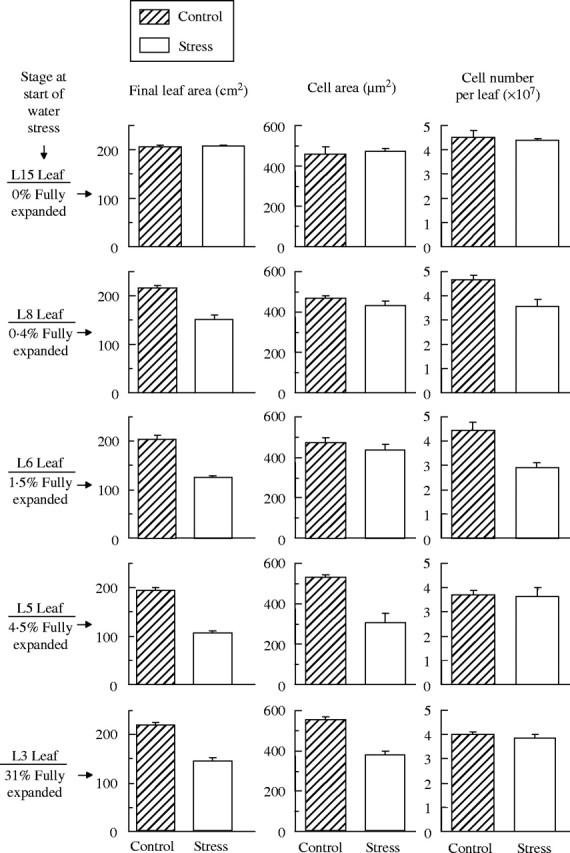
Final leaf area, final epidermal cell area, and number of epidermal cells per leaf (adaxial surface) in indicated leaves of well-watered controls and in plants stressed for 8 d. Leaves are in the following groups: L3 and L5 (Group 1), L6 and L8 (Group 2), L15 (Group 3). Values for final leaf area are means of six leaves. Cell area and cell number are means of three replicate plants. Bars indicate s.e.m.
Dissection of the apical region under a microscope revealed that leaves L11 to L15 had already initiated development before the imposition of stress, indicating that cell division and cell expansion were able to recover fully if stress occurred at the earliest phases of leaf development. Nevertheless, the pattern of leaf expansion indicated that stress delayed expansion of these leaves (Figs 3 and 4). Counts of unfolded leaves during the time course of their development showed that stress delayed leaf emergence by 4–5 d (Fig. 6).
Fig. 6.

Time courses of leaf unfolding in control and water-stressed plants during an 8-d period of water deficit, and after rewatering. Data shown are cumulative numbers of leaves that had unfolded and attained 10 % of their mature leaf size at each date; counts are for monitored leaves L1 to L15 (from base to apex of plants).
Expansion in plant leaf area
To examine the combined effects of water deficit on all three groups of affected leaves, rates of increase in plant leaf area were calculated from the sums of individual leaf data (Fig. 7). Whereas the rate of plant leaf area expansion in the controls was relatively constant throughout the period from day 0 to day 26, and averaged 148 cm2 d−1, water deficit abruptly reduced the rate such that, at day 8, it was only 11 % of the control value. Upon rewatering, the rate increased gradually and returned to the control value by day 26. Integration of the losses in leaf area indicated that the 8-d water deficit reduced expansion by 46 % over the period from day 0 to day 26 (Fig. 8). Using the data for each of the affected groups of leaves, the contributions of each to this decrease were estimated. Such estimates incorporate effects on both the final size of leaves and on the extent of delay in growth. These data showed that, due to the large number of leaves in Group 2 (those engaged in cell proliferation during stress), in which cell production was substantially reduced and expansion delayed, 50 % of the reduction in plant leaf area was due to these leaves. Decreases in cell size (Group 1) and delayed development in the youngest leaves (Group 3) accounted for the remainder. The impact of stress on leaves that were engaged in the final phase of cell expansion during the stress (when cell division was nearly complete) was primarily due to decreased cell size at maturity. In the youngest category of affected leaves, although their mature leaf areas were not affected, the delay in their development represented a substantial loss (21 %) to whole-plant leaf growth rates when calculated for the entire 26-d period.
Fig. 7.

Time courses of the rate of whole-plant leaf expansion in control and water-stressed plants during an 8-d period of water deficit, and after rewatering. Means of three replicate plants ± s.e.m.
Fig. 8.
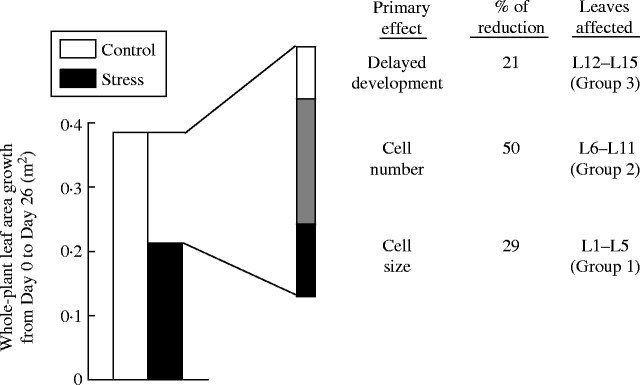
Integrated leaf area expansion rate in plants of control and water stress treatments for the period from day 0 to day 26, and the proportions of growth rate reduction that occurred in the indicated leaves.
DISCUSSION
Leaf expansion is among the most sensitive of the processes that are affected by water deficit. Studies have indicated that this sensitivity is expressed in terms of smaller cells and reductions in the numbers of cells produced by leaf meristems (Kirkham et al., 1972; Randall and Sinclair, 1988; Lecoeur et al., 1995; Schuppler et al., 1998; Granier and Tardieu, 1999; Tardieu et al., 2000). The current study indicates that, in cassava, inhibition of both cell expansion and the production of cells contributed to losses in leaf area, depending on the developmental stage at which a leaf was stressed (Fig. 5). In leaves that were no longer engaged in cell division, diminished cell expansion affected leaf area by reducing mature cell size whereas, in younger leaves, inhibition of cell division resulted in fewer cells per leaf.
In the current analysis, leaves were grouped into three categories according to their developmental stage at the time of stress imposition (Fig. 8). These groups correspond approximately to the three stages of dicot leaf development defined by Tardieu et al. (1999). Leaves in Group 1 were engaged in the final phase of expansion, when cell division was near completion, RER was declining, and cell size was increasing most rapidly. Leaves in Group 2 were in their final phase of rapid cell proliferation when cell division was most rapid on an arithmetic basis (Δcell number/time). In this phase, the relative rate of cell division declines as some cells exit from the cell cycle and advance to the phase of post-mitotic expansion (Granier and Tardieu, 1998, 1999). Leaves in Group 3 were at the earliest phase of leaf development. They were very small (length <1 mm on day 8) and had low rates of cell division and expansion on an absolute basis, but high rates when expressed on a relative (exponential model) basis (Fig. 4; Tardieu et al., 1999).
In the current study, water deficit was imposed for 8 d, followed by rewatering. Such brief episodes of water deficit are common in natural environments, and a valuable contribution of the current study was to assess leaf area expansion during the recovery phase as well as the water deficit phase. Although expansion and cell division were drastically reduced during water deficit, they recovered strongly in all three groups of leaves upon rewatering (Figs 3 and 4). In each case, after rewatering, leaves resumed the developmental process in which they had been engaged before stress was imposed. However, while all of the leaves in Group 3 resumed cell division and growth such that cell size and cell number per leaf recovered fully to control levels, leaves in Group 2 did not recover fully and, at the conclusion of cell division, cell number per leaf was significantly reduced (Fig. 5). Similarly, leaves in Group 1, which were in their final phase of post-mitotic expansion, resumed rapid expansion after rewatering but ceased expansion before reaching the size of controls.
The observation that leaf expansion resumed rapidly after rewatering is consistent with studies which have shown that cell expansion can be turgor-limited during brief episodes of water deficit (Passioura and Fry, 1992; Munns et al., 2000). Recovery of turgor leads to a brief period of rapid growth because cell wall loosening continues under water deficit, although at a lower rate, and creates potential for rapid cell wall yielding and expansion upon recovery of turgor (Cosgrove, 1987). Alternatively, water deficit can lead to a reduction in the rate of cell wall loosening such that turgor is at least partially regained (Neumann, 1995). Rapid growth following full turgor recovery or upon experimental elevation of cell turgor is dissipated after a short time as growth becomes limited by the rate of wall loosening, accumulation of osmolytes, or other expansion-growth processes (Passioura and Fry, 1992; Munns et al., 2000).
Another potential contributor to growth inhibition is abscisic acid (ABA). In previous studies, cassava leaves were found to accumulate substantial quantities of ABA in response to water deficit, and the highest ABA accumulation was in young leaves engaged in cell division and expansion (Alves and Setter, 2000). ABA rapidly decreases to control levels upon rewatering (Alves and Setter, 2000, 2004).
The failure of Group 1 leaves under stress to produce full-sized leaves after rewatering is consistent with the concept that the duration of leaf development is limited to the thermal time during which cell wall loosening and expansion can occur, and that cell wall loosening is countered by cell wall cross-linking and hardening. Passioura and Fry (1992) suggested that the rate of elongation growth is proportional to the relative rates of these counteracting processes and that cessation of expansion occurs when hardening exceeds loosening. The current data suggest that water deficit slowed such developmental advance (Figs 3 and 4), but this may have been insufficient to preserve the full potential for expansion, leading to smaller leaves.
The mechanisms by which leaf growth and morphogenesis are regulated are the subject of debate (Jacobs, 1997; Fleming, 2002; Beemster et al., 2003). Evidence has been found for independent regulatory systems, and systems dependent upon cell division. Nevertheless, between each round of the cell cycle, cells usually expand uniformly so that cell size in meristems remains approximately constant (Jacobs, 1997; Beemster et al., 2003). Hence, it is possible that the impact of water deficit on cell proliferation could be due, in part, to inhibition of the cell expansion process. Although the rate of expansion of dividing cells is small on an absolute scale, it is similar to the highest rate achieved by the whole leaf, on a relative scale (Granier and Tardieu, 1998, 1999). Moreover, rather than affecting the rate of individual-cell expansion or frequency of cell cycles, treatments commonly influence leaf area expansion by changing the rate of cell production per leaf (MacAdam et al., 1989; Fiorani et al., 2000). Leaf cell production, in turn, is a function of the number of cells per leaf that are maintained active in cell division, integrated over time, and the cell proliferation rate of these cells. Hence, one of the factors that could reduce cell production is stress-induced developmental advance that would cause exit from the proliferative state before the normal number of cells had been produced. However, in the current study, the observation that leaves in Group 2 (L6 to L11) resumed maximal RER after rewatering, is consistent with resumption of cell division, even as controls were in their declining phase of RER (Fig. 4). An alternative possibility is that, after rewatering and resumed growth, RER declines, with a time course coincident with controls, as previously found in sunflower subjected to a mild short-term water deficit (Granier and Tardieu, 1999). This was not the case in the current study. Instead, the decline in RER of rewatered leaves was delayed by about 4–6 d compared with controls (Fig. 4). This indicates that, although cell division was developmentally arrested during stress, leaves remained competent to resume and sustain cell division after rewatering, and the cell division phase in each leaf was not shortened by an amount equal to the period of stress. Nevertheless, cell division was shortened somewhat, and this resulted in fewer cells per leaf (Fig. 5) and smaller leaves (Figs 3 and 5).
In several plant systems, environmental and genetic effects on leaf size are exerted by modulating the number of cells actively engaged in the cell cycle and the time over which such a pool of cells is maintained in an actively dividing state before it is depleted by developmental advance to subsequent phases (MacAdam et al., 1989; Fiorani et al., 2000; Tardieu et al., 2000; Taylor et al., 2003). The regulatory systems at work in this case might operate at scales beyond those of individual cells to coordinate morphogenesis and growth within the organ as a whole (Beemster et al., 2003). In the current study, both Group 2 and 3 leaves were engaged in cell division during stress, but only in Group 2 leaves did stress reduce the number of cells in mature leaves. Because Group 2 leaves were in their final phase of cell proliferation, it is plausible that they responded to stress by truncating the time spent in this developmental phase and advancing to the next phase. In contrast, Group 3 leaves in the earlier stage were not yet near this developmental transition and, after rewatering, they resumed cell division to the extent that cell number per leaf was the same as controls. This is in contrast to the earliest leaves investigated in several other studies where water deficit reduced leaf size (Randall and Sinclair, 1988; Lecoeur et al., 1995; Granier and Tardieu, 1999). Recent studies have distinguished an additional, earlier phase of exponential growth in sunflower, in which growing conditions have less effect on leaf growth rate and duration (Dosio et al., 2003). The timing of this phase, soon after leaf initiation, corresponds approximately to the stress period of Group 3 leaves in the current study. Thus, it is possible that regulation of leaf growth at this early phase has different effects on leaf growth processes than at later phases of exponential growth.
A significant contributor to loss of plant leaf area in response to brief episodes of water deficit was the delay in development. Such a delay in Group 3 leaves represented about 21 % of the decrease in whole-plant leaf area over the monitored 26-d period. Studies have indicated that leaf unfolding rate is responsive to stress, and this can have a large impact on leaf area production (Marc and Palmer, 1976; Vendeland et al., 1982; Belaygue et al., 1996). Effects on leaf unfolding rate in some systems involve stress-imposed delay in leaf initiation at the shoot apical meristem (Marc and Palmer, 1976). In the current study, leaves of Group 3, whose development was delayed by water deficit, had already been initiated before imposition of the stress treatment. Nevertheless, after the stress-imposed delay, leaves L12 to L15 of Group 3, as well as subsequent leaves, resumed growth and development following a time course matching that of controls, indicating that, in addition to the delay in development of initiated leaves, initiation of new leaves was similarly delayed. Thus, the 21 % reduction in leaf area production attributed to delayed leaf development was due to a general delay in both the initiation of new leaves and in the development of existing leaves.
In summary, although cassava leaf expansion was nearly halted during stress, it resumed rapidly after rewatering such that RER recovered to values that approached those of controls. This pattern of response is consistent with the postulated strategy of limiting resource use during stress, with the result that more resources are available for recovery of growth and metabolic activities after renewed rainfall. It is also consistent with other characteristics of the response of cassava to brief episodes of drought, such as rapid accumulation of ABA, and stomatal closure such that water status is maintained during stress, and limited investment in osmolyte accumulation (El Sharkawy et al., 1984; Alves and Setter, 2000, 2004). The cessation of growth during stress involved both cell division and cell expansion. These processes were able to recover fully when stress occurred at the earliest phases of leaf development, but, in leaves in the final phase of either cell division or cell expansion, these processes did not resume long enough to generate leaves of full size. Integration of the losses in leaf growth per plant for the stress and recovery period indicated that, whereas 29 % of the loss in leaf growth was due to limited cell expansion and smaller cell size, the remainder was due to losses in area of leaves in which stress coincided with their cell division phase of development. In these leaves the number of cells produced per leaf was reduced (Group 2) and development was delayed (Group 2 and 3). This suggests that the developmental and regulatory systems underlying cell division may play a large role in stress response.
Supplementary Material
LITERATURE CITED
- Alves AAC, Setter TL. 2000. Response of cassava to water deficit: leaf area growth and abscisic acid. Crop Science 40: 131–137. [Google Scholar]
- Alves AAC, Setter TL. 2004. Abscisic acid accumulation and osmotic adjustment in cassava under water deficit. Environmental and Experimental Botany 51: 259–271. [Google Scholar]
- Beemster GTS, Fiorani F, Inzé D. 2003. Cell cycle: the key to plant growth control? Trends in Plant Science 8: 154–158. [DOI] [PubMed] [Google Scholar]
- Belaygue C, Wery J, Cowan AA, Tardieu F. 1996. Contribution of leaf expansion, rate of leaf appearance, and stolon branching in growth of plant leaf area under water deficit in white clover. Crop Science 36: 1240–1246. [Google Scholar]
- Cosgrove DJ. 1987. Wall relaxation in growing stems comparison of four species and assessment of measurement techniques. Planta 171: 266–278. [PubMed] [Google Scholar]
- Dosio GAA, Rey H, Lecoeur J, Izquierdo NG, Aguirrezabal LAN, Tardieu F, Turc O. 2003. A whole-plant analysis of the dynamics of expansion of individual leaves of two sunflower hybrids. Journal of Experimental Botany 54: 2541–2552. [DOI] [PubMed] [Google Scholar]
- El Sharkawy MA, Cock JH, Held KAA. 1984. Water use efficiency of cassava (Manihot esculenta) 2. Differing sensitivity of stomata to air humidity in cassava and other warm climate species. Crop Science 24: 503–507. [Google Scholar]
- Fiorani F, Beemster GTS, Bultynck L, Lambers H. 2000. Can meristematic activity determine variation in leaf size and elongation rate among four Poa species? A kinematic study. Plant Physiology 124: 845–855. [DOI] [PMC free article] [PubMed] [Google Scholar]
- Fleming AJ. 2002. The mechanism of leaf morphogenesis. Planta 216: 17–22. [DOI] [PubMed] [Google Scholar]
- Granier C, Tardieu F. 1998. Spatial and temporal analyses of expansion and cell cycle in sunflower leaves. Plant Physiology 116: 991–1001. [DOI] [PMC free article] [PubMed] [Google Scholar]
- Granier C, Tardieu F. 1999. Water deficit and spatial pattern of leaf development. Variability in responses can be simulated using a simple model of leaf development. Plant Physiology 119: 609–620. [DOI] [PMC free article] [PubMed] [Google Scholar]
- Granier C, Turc O, Tardieu F. 2000. Co-ordination of cell division and tissue expansion in sunflower, tobacco, and pea leaves: dependence or independence of both processes? Journal of Plant Growth Regulation 19: 45–54. [DOI] [PubMed] [Google Scholar]
- Ike IF, Thurtell GW. 1981. Osmotic adjustment in indoor grown cassava (Manihot esculenta) in response to water stress. Physiologia Plantarum 52: 257–262. [Google Scholar]
- Itani J, Utsunomiya N, Shigenaga S. 1992. Drought tolerance of cowpea. 2. Comparative study on water relations and photosynthesis among cowpea, soybean, common bean and greengram plants under water stress conditions. Japanese Journal of Tropical Agriculture 36: 269–274. [Google Scholar]
- Jacobs T. 1997. Why do plant cells divide? Plant Cell 9: 1021–1029. [DOI] [PMC free article] [PubMed] [Google Scholar]
- Kirkham M, Gardner W, Gerloff G. 1972. Regulation of cell division and cell enlargement by turgor pressure. Plant Physiology 49: 961–962. [DOI] [PMC free article] [PubMed] [Google Scholar]
- Lecoeur J, Wery J, Turc O, Tardieu F. 1995. Expansion of pea leaves subjected to short water deficit: cell number and cell size are sensitive to stress at different periods of leaf development. Journal of Experimental Botany 46: 1093–1101. [Google Scholar]
- MacAdam JW, Volenec JJ, Nelson CJ. 1989. Effects of nitrogen on mesophyll cell division and epidermal cell elongation in tall fescue leaf blades. Plant Physiology 89: 549–556. [DOI] [PMC free article] [PubMed] [Google Scholar]
- Marc J, Palmer JH. 1976. Relationships between water potential and leaf and inflorescence initiation in Helianthus annuus Physiologia Plantarum 36: 101–104. [Google Scholar]
- Munns R, Passioura JB, Guo J, Chazen O, Cramer GR. 2000. Water relations and leaf expansion: importance of time scale. Journal of Experimental Botany 51: 1495–1504. [DOI] [PubMed] [Google Scholar]
- Neumann P. 1995. The role of cell wall adjustment in plant resistance to water deficit. Crop Science 35: 1258–1266. [Google Scholar]
- Passioura JB, Fry SC. 1992. Turgor and cell expansion: beyond the Lockhart equation. Australian Journal of Plant Physiology 19: 565–576. [Google Scholar]
- Randall HC, Sinclair TR. 1988. Sensitivity of soybean leaf development to water deficits. Plant Cell & Environment 11: 835–839. [Google Scholar]
- Schuppler U, He P-H, John PCL, Munns R. 1998. Effect of water stress on cell division and cell-division-cycle 2-like cell-cycle kinase activity in wheat leaves. Plant Physiology 117: 667–678. [DOI] [PMC free article] [PubMed] [Google Scholar]
- Serraj R, Sinclair TR. 2002. Osmolyte accumulation: can it really help increase crop yield under drought conditions? Plant Cell & Environment 25: 333–341. [DOI] [PubMed] [Google Scholar]
- Tardieu F, Simonneau T. 1998. Variability among species of stomatal control under fluctuating soil water status and evaporative demand: modelling isohydric and anisohydric behaviours. Journal of Experimental Botany 49: 419–432. [Google Scholar]
- Tardieu F, Granier C, Muller B. 1999. Modelling leaf expansion in a fluctuating environment: are changes in specific leaf area a consequence of changes in expansion rate? New Phytologist 143: 33–43. [Google Scholar]
- Tardieu F, Reymond M, Hamard P, Granier C, Muller B. 2000. Spatial distributions of expansion rate, cell division rate and cell size in maize leaves: a synthesis of the effects of soil water status, evaporative demand and temperature. Journal of Experimental Botany 51: 1505–1514. [DOI] [PubMed] [Google Scholar]
- Taylor G, Tricker PJ, Zhang FZ, Alston VJ, Miglietta F, Kuzminsky E. 2003. Spatial and temporal effects of free-air CO2 enrichment (POPFACE) on leaf growth, cell expansion, and cell production in a closed canopy of poplar. Plant Physiology 131: 177–185. [DOI] [PMC free article] [PubMed] [Google Scholar]
- Vendeland JS, Sinclair TR, Spaeth SC, Cortes PM. 1982. Assumptions of plastochron index evaluation with soybean Glycine max cultivar Wilkin under field drought conditions. Annals of Botany 50: 673–680. [Google Scholar]
Associated Data
This section collects any data citations, data availability statements, or supplementary materials included in this article.