

Abstract
Effects of ozone and/or drought on Norway spruce needles were studied using light microscopy and electron microscopy. Saplings were exposed to ozone in open‐top chambers during 1992–1995 and also to drought in the late summers of 1993–1995. Samples from current and previous year needles were collected five times during 1995. Ozone increased the numbers of peroxisomes and mitochondria, which suggests that defence mechanisms against oxidative stress were active. The results from peroxisomes suggest that the oxidative stress was more pronounced in the upper side of the needles, and those from mitochondria that defence was more active in the younger needle generation. Possibly due to the good nitrogen status and the active defence, no ozone‐specific chloroplast alterations were seen. At the end of the season, older needles from ozone treatments had smaller central vacuoles compared with other needles. Cytoplasmic vacuoles around the nucleus were increased by ozone in the beginning of the experiment, and did not increase towards the end of the season as in the controls. These results from vacuoles may indicate that ozone affected the osmotic properties of the cells. Decreased number and underdevelopment of sclerenchyma cells and proliferation of tonoplast were related to nutrient imbalance, which was enhanced by drought. Larger vascular cylinders and more effective starch accumulation before and after the drought periods compensated for the reduced water status. Numbers of peroxisomes and mitochondria were increased in the drought‐exposed needles before the onset of drought treatments of the study year, i.e. these changes were memory effects. Interactions between ozone and drought were few.
Key words: Picea abies, Norway spruce, needles, ozone, drought, light microscopy, transmission electron microscopy, peroxisome, mitochondrion, chloroplast, starch, vacuole
INTRODUCTION
Ozone and drought are well‐known stress factors that influence tree vitality in Europe and North America (e.g. Bussotti and Ferretti, 1998; McLaughlin and Percy, 1999). Compared with central and southern Europe, ambient ozone concentrations in Fennoscandia are fairly low (Hjellbrekke and Solberg, 2002). However, the climate conditions in Fennoscandia are favourable for ozone uptake into foliage (Emberson et al., 2000), and ambient or slightly elevated ozone concentrations there have been shown to induce several adverse effects on young trees in experimental fumigations. For example, reduced growth, decreased photosynthesis, altered winter hardening processes, reduced chlorophyll concentrations, visible injuries on leaves, changed leaf anatomy and microscopic injuries in needles and leaves have all been reported (Sutinen et al., 1990; Wallin et al., 1990; Pääkkönen et al., 1995; Anttonen and Kärenlampi, 1996; Wallin et al., 2002). Ozone‐specific microscopic symptoms have also been found in field‐grown mature conifers in southern Finland (Sutinen, 1990; Sutinen et al., 1998). In southern Fennoscandia, drought has been reported to have negative effects on forest growth and health (Bergh et al. 1999; Mäkinen et al., 2001; Alavi, 2002).
Interactions of drought and long‐term ozone exposure with realistic concentrations on young conifers have been studied on several needle parameters such as gas exchange (Beyers et al., 1992), photosynthesis (Wallin and Skärby, 1992), nutrient concentrations (Wallin et al., 2002), antioxidants (Alonso et al., 2001), chlorophyll concentrations (Wallin et al., 2002), water relations (Karlsson et al., 1995) and visible injuries (Temple et al., 1992). Combined effects of drought and ozone on needles depend on several factors. The responses may differ between conifer species. For example, drought appears to protect ponderosa pine (Pinus ponderosa) from ozone injury (Beyers et al., 1992; Temple et al., 1992, 1993), while ozone impairs the ability of Aleppo pine (Pinus halepensis) to withstand drought (Gerant et al., 1996; Inclán et al., 1998; Alonso et al., 2001). Depending on the parameters studied, the responses of Norway spruce are variable: drought has been observed to protect trees from negative effects of ozone (Karlsson et al., 1995), it has been shown to enhance the negative effects of ozone (Le Thiec et al., 1994; Dixon et al., 1998), or drought and ozone have been demonstrated to have independent effects (Wallin and Skärby 1992; Le Thiec et al., 1994; Dixon et al., 1998; Wallin et al., 2002). Early or late drought stress affects the interaction responses between ozone and drought, as pointed out by Wallin and Skärby (1992) and Alonso et al. (2001). Interaction between ozone and drought can also depend on the severity of the drought stress, being more obvious in moderate drought stress (Karlsson et al., 1995; Inclán et al., 1998). In addition, combined effects of drought and ozone can depend on the clones used (Le Thiec et al., 1994; Dixon et al., 1998) and the age of plant parts (Alonso et al., 2001).
Microscopy is a widely used method to study the stress responses in foliage, as early stages of response can be seen long before any visible injuries occur (Holopainen et al., 1992). The method can be used to localize the site of action of a particular stress, and it can also give hints about the modes of action of that stress (Holopainen et al., 1992). Moreover, it can also be used to diagnose the causal agents of injuries, as the effects of several stress factors on needle structure can be specifically distinguished from each other (Holopainen et al., 1992; Sutinen and Koivisto, 1995). By morphometry (Toth, 1982), changes in cell and tissue structures can be expressed quantitatively, e.g. as frequencies of occurrence, or dimensions of organelles. This allows accurate comparisons not only between treatments but also between different areas in a tissue. Combined effects of drought and ozone on cell structures have been studied in birch leaves (Betula pendula Roth.) (Pääkkönen et al., 1998), but not in conifer needles. Because of different plant strategies (Selldén et al., 1997), the ozone and drought responses of spruce and birch cannot be expected to be directly comparable.
The aim of this study was to investigate cell structural responses of Norway spruce needles to long‐term ozone and drought exposures and to obtain information about the modes of action of these stress factors. The parameters studied were those documented earlier in ozone or drought exposures (e.g. Holopainen et al., 1992; Sutinen and Koivisto, 1995; Holopainen et al., 1996; Fink, 1999), but new or less‐studied parameters, such as measures of mitochondria or vacuoles, were also included. As the ozone impact is first noted on the upper side of the foliage (Sutinen et al., 1990; VanderHeyden et al., 2001), special attention was given to the location of the examined cells in the mesophyll tissue. The aim was also to study whether the stress responses differ between the two youngest needle generations.
MATERIALS AND METHODS
Study site, plant material and growth conditions
The study is a part of a larger project, the Göteborg Ozone–Spruce Project, described in detail by Wallin et al. (2002). The spruce saplings were exposed to ozone during four growing seasons (1992–1995) and to drought during the late summers of 1993–1995 at the Östad field station (57°54′N, 12°24′E), 50 km north‐east of Göteborg, Sweden. One clone of Norway spruce saplings, Picea abies L. Karst (C77‐0068 Minsk) from Hilleshög AB, Falkenberg, Sweden, was propagated from cuttings in autumn 1989 and planted in July 1991 in individual pots (0·120 m3, filled with sand, 0–6 mm particle size) that were sunk into the ground. At the start of the experiment each plot had 24 saplings, eight of which per year were harvested in 1993, 1994 and 1995 for determination of biomass and to reduce mutual shading in the plots for the remaining saplings. Water and nutrient supply were controlled by a computer‐based irrigation system. Water was added daily during the frost‐free season in order to keep the soil water status close to the field capacity, except for the drought treatment (see below). A liquid fertilizer with all essential macro‐ and micronutrients was applied daily from mid‐May to late July, aiming at a nitrogen concentration in the needles of 18–20 mg g–1 (d. wt). Insecticides (Baygon E and Croneton E) were used to control mites and aphids when necessary.
Treatments
The saplings were exposed in open‐top chambers. Each chamber was 2·1 m high and 3·1 m in diameter. The 0·3 m high frustum reduced the open diameter to 2·15 m. A roof was placed 0·45 m above the frustum. The saplings were exposed to charcoal‐filtered air (CF) and non‐filtered air plus extra ozone (aiming at 1·5 × ambient ozone concentration, NF+) 24 h per day from April to November (in 1995, 13 April to 14 Nov.). The treatments were replicated six times. The allocation of CF and NF+ to chambers was randomized in the field. Filters and ozone generation are described in detail by Wallin et al. (2002). Half of the Norway spruce saplings within each chamber were exposed to periods with reduced water supply, lasting 7–8 weeks in the late summers of 1993–1995. The other half were kept well watered all the time. During the reduced water‐supply periods, the irrigation system was turned off and the saplings were watered manually on a few occasions. Data on tree and soil water status are reported by Karlsson et al. (2002). The 24‐h seasonal (1 April to 30 Sept.) mean ozone concentrations and the AOT40 (Accumulated Ozone doses over a Threshold of 40 nl l–1) values are presented in Table 1.
Table 1.
Means (nl l–1) and accumulated ozone doses over a threshold of 40 nl l–1 (AOT40, µl l–1) per growing season (1 April to 30 Sept.) based on 24 h measurements of ozone concentrations in open‐top chambers (ozone fumigations started 1 July 1992)
| Treatment | 1992 | 1993 | 1994 | 1995 |
| Means (nl l–1) | ||||
| CF | 18 | 6 | 8 | 7 |
| NF+ | 33 | 35 | 40 | 37 |
| AOT40 (µl l–1) | ||||
| CF | 6·5 | 0·4 | 1·1 | 0·1 |
| NF+ | 16·5 | 23·0 | 40·1 | 27·3 |
CF, charcoal filtered air; NF+, non‐filtered air with extra ozone.
The experiment included the following treatments: CF/W (charcoal‐filtered air, well‐watered saplings), CF/D (charcoal‐filtered air, drought‐stressed saplings), NF+/W (non‐filtered air with extra ozone, well‐watered saplings), NF+/D (non‐filtered air with extra ozone, drought‐stressed saplings).
Microscopy
The samples for microscopy were collected five times in conjunction with the drought period (4 Aug. to 19 Sept.) of the last study year, 1995 (Table 2). Sampling times were: 28 July, before the drought periods, all trees well watered; 16 Aug., at the end of the second drought period, moderate drought stress for D saplings; 18 Aug., 1 d after re‐watering, all saplings watered; 18 Sept., at the end of the fourth drought period, severe drought stress for D saplings; 4 Oct., at the end of the experiment, all saplings well watered. Five current (C) year and five previous year (C+1) needles were collected from the upper side, in the middle of the branches of the 1993 whorl (third whorl from the top), from the same single sapling per treatment and replicate each time. C needles collected on 18 Sept. were the same as in an earlier study of the diurnal changes in the microscopic structures of the needles (Kivimäenpää et al., 2001), where the sample preparation is described. Cross‐sectional segments, 0·5–1·0 mm, were cut from a position one‐third of the length of the needle from its tip. Two needle segments out of five taken per sapling and per needle generation from the first (28 July) and last (4 Oct.) sampling times were prepared for light microscopy (LM), and from all sampling times for transmission electron microscopy (TEM), as described in Kivimäenpää et al. (2001). The condition of cells in the vascular cylinder of the cross‐sections was studied under the light microscope (Zeiss Axioplan, Jena, West Germany). The diameter of the vascular cylinder (Fig. 1) was measured with a micrometer ocular and its area was calculated assuming the cross‐section was a perfect circle. The number of sclerenchyma cells was counted and related to the area of the vascular cylinder. The proportion of sclerenchyma cells with thin cell walls was also measured. The length of the largest starch grains was measured from three cells of the endodermis per cross‐section with a micrometer ocular. The upper side (sky‐facing side, abaxial in this case) of the mesophyll tissue from one needle section and the lower side (ground‐facing side, adaxial) from the other section (Fig. 1) were photographed using the light microscope. Thus two LM slides were obtained from each sapling for both needle generations for both sampling occasions. The area of intercellular space (%), vacuolar area of the cells (%) and the proportions of cells with small cytoplasmic vacuoles (%) in the mesophyll tissue on slides were determined by point‐counting on the monitor of the slide projector, as described in Kivimäenpää et al. (2001). Magnification of the pictures during analysis was ×690. A typical LM‐slide analysed is shown in Fig. 2A.
Table 2.
Sampling dates and times with weather data for the Östad ozone and drought experiment in 1995
| Pre‐dawn water potential (MPa) | |||||||||
| Date | Sampling time (h) | Experimental stage | Air temp. (°C) | VPD (MPa) | PAR (µmol m–2 s–1) | CF/W | CF/D | NF+/W | NF+/D |
| 28 July | 0445–0550 | Start (all watered) | 10–15 | 0·1–0·2 | 90–230 | –0·16* | –0·18† | –0·15* | –0·18† |
| 16 Aug. | 0825–1120 | End of second drought cycle | 15–24 | 0·1–1·4 | 140–860 | –0·20 | –0·98 | –0·20 | –0·89 |
| 18 Aug. | 0745–1020 | Re‐watered after drought cycle | 23–26 | 1·1–1·3 | 570–710 | –0·20‡ | –0·21 | –0·20‡ | –0·21 |
| 18 Sept. | 0730–0900 | End of fourth drought cycle | 6–13 | 0·1–0·2 | 200–430 | –0·25 | –1·59 | –0·28 | –1·77 |
| 4 Oct. | 0715–1000 | End (all watered) | 11–13 | 0·1 | 10–60 | n.a. | –0·19 | n.a. | –0·18 |
Measured * on 25 July, † 26 July, ‡ 22 Aug.
n.a., not analysed; CF, charcoal filtered air; NF+, non‐filtered air + extra ozone; W, well watered; D, drought stressed.

Fig. 1. Schematic illustrations of cross‐sections of the mesophyll tissue of two spruce needles. The central circle is the vascular cylinder. Larger squares on the abaxial side of one needle and adaxial side of another needle show the areas of mesophyll tissue photographed with the light microscope. Smaller squares show the areas of mesophyll tissue in the thin sections, and black ovals show the area from which photographs were taken using a transmission electron microscope.
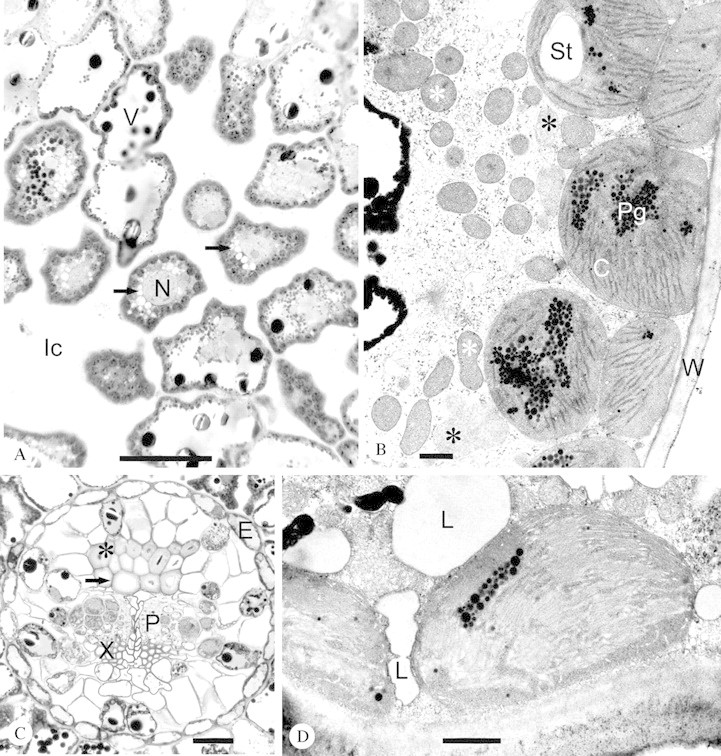
Fig. 2. A, Typical cross‐sectional area of the mesophyll tissue of a Norway spruce needle analysed by light microscopy. Arrows indicate cells with cytoplasmic vacuoles encircling the nucleus (N). Black granules inside the vacuole (V) are phenolic compounds (tannins). Ic, intercellular space. Current year needle collected from CF/D on 4 Oct. Bar = 50 µm. B, Typical cytoplasmic area analysed by transmission electron microscopy. White asterisks indicate mitochondria and black asterisks peroxisomes. C, Chloroplast; St, starch grain; Pg, plastoglobuli; W, cell wall. The black material at the left edge of the micrograph is vacuolar tannin lining the tonoplast. Current year needle collected from NF+/D on 4 Oct. Bar = 1 µm. C, Underdeveloped (thin cell walls, arrow) and well‐developed (thick cell walls, *) sclerenchyma cells in healthy looking vascular cylinder. E, endodermis; P, phloem; X, xylem. Current year needle collected from NF+/D on 28 July. Bar = 50 µm. D, Current year needle from NF+/D showing increased cytoplasmic lipid aggregates (L), which were increased by ozone in the current year needles. The low amount of plastoglobuli was typical to current year needles. Bar = 1 µm.
The thin sections for TEM were taken from the abaxial side of one needle and from the adaxial side of the other needle (Fig. 1). Two mesophyll cells per section, one next to the epidermis and the other next to the endodermis (Fig. 1), were photographed using a transmission electron microscope (JEOL JEM‐1200 EX, Tokyo, Japan) with ×5000 magnification. In total, four TEM micrographs were taken from each sapling on each sampling occasion. The photographed cell in each cell layer was selected at random, but the location inside the cell was chosen to include chloroplasts (cf. Kivimäenpää et al., 2001). In addition, parts of the cell wall and the tonoplast could be seen in every picture. Mitochondria and peroxisomes, unlike chloroplasts, were not used as target organelles during photographing. Thus, their appearance in the micrographs can be regarded as random, and their number and size representative for those cellular areas near the chloroplasts. Sectioning of three‐dimensional irregular organelles, like mitochondria, may result in several cross‐sections of different size and shape. However, our previous study had shown that the shape of the mitochondrion was not correlated with the number and size (Kivimäenpää et al., 2001). Therefore, we assumed that the possible changes in numbers and sizes are real. The area of cytoplasm varied between the photographs (cf. Kivimäenpää et al., 2001). Therefore, the numbers of mitochondria and peroxisomes were related to the same cytoplasmic area (100 µm2). The different orientation of the chloroplasts within a cell may affect the size and shape of them in the thin sections. To minimize this effect the dimensions of chloroplasts were measured from all (approx. four) whole chloroplasts in the photograph.
The guidelines for morphometric analysis given by Toth (1982) and Steer (1991) were followed during analysis of TEM pictures, as well as that of the LM slides. Point‐counting was used to determine the following parameters: the mean areas (µm2) of cross‐sections of chloroplasts, starch grains, mitochondria and peroxisomes, numbers (per 100 µm2 of the cytoplasm) of mitochondria and peroxisomes, and cytoplasm occupied by lipid aggregates (%). A typical cytoplasmic area analysed by TEM is shown in Fig. 2B. From the two first sampling occasions (28 July, 16 Aug.), the length (longest distance) and width (longest distance, perpendicular to length) of the chloroplasts was measured and their ratio calculated in order to estimate the rounding of the chloroplasts. The longitudinal sectioning of the grana stacks in most of the rounded chloroplasts revealed that the transverse orientation of the chloroplasts in the sections was not the only reason for the rounded appearance. It must be emphasized that the organelle dimensions and other morphometric measures cannot be regarded as absolute values, because chemical fixation may cause the cell organelles to shrink (Hayat, 1989). Despite this, results obtained within the same study should be comparable, assuming that the same fixation procedure is used.
The occurrence of the following qualitative changes were noted in one cell from micrographs from each sampling time: chloroplasts with bent thylakoids, swollen chloroplast thylakoids (adjacent thylakoids separated from each other), thylakoids separated from stroma, increased thylakoids, electron density of chloroplast stroma, non‐osmiophilic staining (light colour) of plastoglobuli, proliferation of the tonoplast, plasmolysis and disintegration of the cytoplasm. The negative staining of the chloroplast membranes, which is, for unknown reasons, often detected in conifer needles in the summer (Wellburn and Wellburn, 1994), was also studied. If these qualitative features existed in one or more of the four investigated cells the sample was scored 1, otherwise 0. The amount of plastoglobuli was classified as percentages of chloroplast area (excluding starch) as follows: 1, low, under 10 %; 2, slightly increased, 10–30 %; 3, increased, over 30 %. Plasmolysis, disintegration of the cytoplasm and swelling of thylakoids were noted in all treatments, even in CF/W. These changes were most probably due to the early sampling time as described by Kivimäenpää et al. (2001) and are therefore not considered further here.
The stroma of the chloroplasts from the needles collected at the last sampling time was subjected to a more careful study. One randomly selected chloroplast on each TEM negative was digitally photographed with a Kodak DCS‐460 digital camera. The occurrence and appearance of stroma granulation was studied using Adobe Photoshop 4·0 with ×60 000 magnification. The original negatives and micrographs presented in Sutinen et al. (1990) and Holopainen et al. (1996) were used to identify the ozone‐induced granules.
Statistical analyses
Statistical analyses were performed using SPSS v.10.0. Due to infestation of saplings by mites one CF chamber was omitted from the analysis. Thus, n = 5 for CF and n = 6 for NF+.
Binary logistic regression analyses with hierarchical models, where all the main effects included in the significant higher‐level interactions were present in the model, were used to test the amount of plastoglobuli and the qualitative parameters. First, all the main effects (needle age, ozone, drought, sampling time) and their interactions (from two‐way to four‐way) were included in the model. Then, the non‐significant (cut‐off level 0·06) effects were dropped, one by one, from the model starting from the highest‐level interactions with highest probability values. In case an interaction was significant, the lower‐level interactions or main effects included in the interaction were always left to the model. Nagelkerke R2 shows the percentage of variation among cases explained by the model. For this analysis the amount of plastoglobuli was re‐classified into two groups: 0, normal (all the four cells had a value of 1 or maximally one of four had a value of 2 or 3) or 1, increased (the other cases).
Means for quantitative parameters from each sampling time were calculated for each sapling, separately for upper and lower sides of the needles for both needle ages. Arcsin of square root transformation was performed for cytoplasm occupied by lipid aggregates, square root transformation for the proportion of sclerenchyma cells with thin cell walls and logarithmic transformation for the area of vascular cylinder. Untransformed results are shown. Main effects (needle age, ozone, drought, sampling time, needle side) and all interactions (from two‐way to five‐way) were tested by General Linear Models (GLM) repeated‐measures procedure with needle age, needle side and sampling time as within‐subject factors (i.e. repeated factors, collected from the same sapling on all occasions) and with ozone and drought as between‐subject factors. Sapling was included as a random variable; the method then allowed an incomplete series of measurements to be included in it. Changes in the number of sclerenchyma cells and the area of vascular cylinder are not expected to occur after the cessation of shoot growth, which here took place approx. 1 week before the first sampling time. Therefore these two variables from two sampling times were aggregated.
Mean area of the starch grains, after square‐root transformation, fulfilled the requirements for variance analysis only at the first sampling time. Therefore results from later sampling times were not tested statistically. However, the results for starch showed clear differences and the results could be interpreted without statistical testing.
If not specifically mentioned, the main effects or interactions are not significant.
RESULTS
Vascular cylinder
The vascular cylinder was studied on 28 July, before the onset of treatment D, and on 4 Oct., at the end of the experiment. At both occasions the cells of the vascular cylinder were intact, except that some of the sclerenchyma cells had abnormally thin cell walls with a large lumen (Fig. 2C). On the first sampling occasion, the proportion of thin‐walled sclerenchyma cells was 13 % in the D needles, but only 5 % in the W needles (P < 0·0005 for drought). On the last sampling, the average values in D and W were 25 % and 9 %, respectively (P = 0·001). The effect of sampling time was significant (P = 0·001). Also, the number of sclerenchyma cells per area of vascular cylinder was lower in D saplings than in W (P = 0·002). The number of these cells was higher in the C+1 needles than in the C‐needles (P = 0·001). The area of the vascular cylinder was 9 % larger in the D saplings than in the W saplings (P = 0·025) and 20 % larger in the C+1 than in the C needles (P < 0·0005). No significant changes were found in the number of rows of phloem cells (Fig. 2C), which varied between three and ten rows. Ozone had no significant effects on the structure of the vascular cylinder.
Length of starch grains was measured from the endodermis (Fig. 2C) lining the vascular cylinder on the first and last sampling occasions. As an average of all treatments, starch grains were larger at the first sampling time compared with the last sampling time (P < 0·0005, Fig. 3). They were larger in the C needles than in the C+1 needles (P < 0·0005, Fig. 3), but in the C+1 needles the decrease in size between sampling times was not as marked as in the C needles (P = 0·001 for needle age × time). NF+ had larger starch grains compared with CF on 28 July, but on 4 Oct. the grains were smallest in NF+ (Fig. 3). This interaction between time and ozone was significant (P = 0·004). D had the largest starch grains on 4 Oct. (P = 0·076 for time × drought). Although the responses in NF+/D, especially in the C needles, differed from CF/D and NF+/W (Fig. 3) the interaction between ozone and drought was not significant.

Fig. 3. Average length of starch grains in the endodermis (with s.e.) measured in the current (C) and second (C+1) year needles of Norway spruce saplings from four treatments: charcoal‐filtered air, well‐watered (white), charcoal‐filtered air, drought‐stressed (black), non‐filtered air with added ozone, well‐watered (vertical lines), non‐filtered air with added ozone, drought‐stressed (horizontal lines). The samples were analysed before the periods of reduced water supply (28 July) and at the end of the experiment, after re‐watering (4 Oct.). For statistics, see text.
Mesophyll tissue
Intercellular space.
The proportion of intercellular space (Fig. 2A) was significantly (P = 0·022) smaller in the lower side of the needle (on average 22 %) than in the upper side (on average 28 %). It was not significantly affected by needle age or any of the treatments.
Cytoplasm.
Lipid aggregates (Fig. 2D) occupied 0–22 % of the cytoplasm. The average amount increased steadily from 1·2 % on the first sampling occasion to 3·8 % on the last occasion (P < 0·0005 for sampling time). The lipid aggregates were usually more frequent in the C+1 needles (2·9 %) than in the C needles (1·7 %, P < 0·0005 for needle age). Ozone increased the amount of lipid aggregates in the C needles (1·5 % for CF, 1·9 % for NF+), but decreased it in the C+1 needles (3·3 % for CF, 2·6 % for NF+, P = 0·034 for needle age × ozone).
Tonoplast and vacuoles.
Proliferation of the tonoplast (Fig. 4A) was detected in 76 % of the cases. This feature was more frequent in the C+1 needles (83 %) compared with the C needles (69 %), and in D (84 %) compared with W (68 %). Drought and needle age explained 9·2 % of variation among cases with proliferated tonoplast (Table 3).
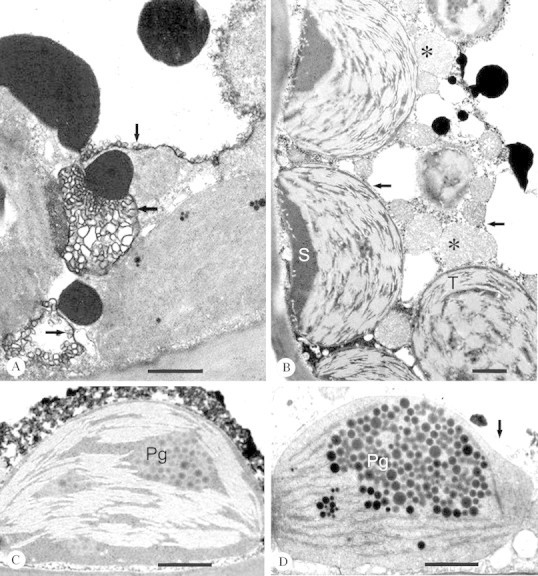
Fig. 4. A, Proliferation of the tonoplast (arrows) was typical in drought treatments (cf. B and D). Current year needle collected from CF/D on 4 Oct. Bar = 1 µm. B, Negatively stained, bent thylakoids (T) fill nearly all the chloroplast area in a mesophyll cell. Stroma (S) is electron‐dense. Mitochondria (white asterisks) and peroxisomes (black asterisks) can also be seen. Arrows point to tonoplast of the cytoplasmic vacuoles (or invaginations of the central vacuole). Current year needle collected from CF/W on 18 Aug. Bar = 1 µm. C, Non‐osmiophilic plastoglobuli (Pg) were seen in all treatments, although they were on average more common in the older needles. Previous year needle from NF+/D on 16 Aug. Bar = 1 µm. D, The amount of plastoglobuli (Pg) was higher in the previous than current year needle generation (cf. Fig. 2D). The tonoplast is indicated by an arrow. Previous year needle collected from CF/W on 4 Oct. Bar = 1 µm.
Table 3.
Results of binary logistic regression analysis of hierarchical model, with significances (P‐values) and Nagelkerke R2, of the model for tonoplast proliferation, non‐osmiophilic plastoglobuli and increased plastoglobuli
| Factors | Significance |
| Tonoplast proliferation | |
| Needle age | 0·014 |
| Drought | 0·006 |
| Nagelkerke R2 0·092 | |
| Non‐osmiophilic plastoglobuli | |
| Ozone × needle age | 0·017 |
| Ozone | 0·021 |
| Needle age | 0·010 |
| Drought × time | 0·020 |
| Drought | 0·021 |
| Time | 0·005 |
| Nagelkerke R2 0·090 | |
| Increased plastoglobuli | |
| Needle age × time | 0·051 |
| Time | 0·044 |
| Needle age | 0·006 |
| Nagelkerke R2 0·418 |
The proportion of the central vacuole to the cell area (Table 4), studied at the LM‐level, varied between 43 and 81 %. The vacuoles were generally larger in the C+1 needles than in the C needles, but the difference between needle generations was most pronounced in the needles from the D saplings (Table 4). The central vacuoles were usually larger at the end of the sampling period than at the beginning, except in C+1 needles from NF+ (Table 4). Independent of needle age and sampling time, the treatments affected the vacuole size differently in the upper and lower side of the needle. In the upper side, the vacuoles were largest in the needles from control treatments (CF/W) and in those exposed to two stresses (NF+/D) but smallest in those exposed to single stresses (CF/D and NF+/W). In the lower side of the needle, these treatment effects were the opposite (Table 4).
Table 4.
Mean values (s.d.) of light microscopy analyses for vacuolar area of cells (%) and proportion of cells with nucleus‐encircling cytoplasmic vacuoles (%)
| Sampling occasion | ||||||
| 28 July | 4 Oct. | |||||
| Treatment | Needle side | C | C+1 | C | C+1 | Main effects and interactions |
| Vacuolar area (%) | ||||||
| CF/W | Upper | 56 (12) | 79 (7) | 69 (15) | 81 (11) | Needle age × needle side × drought: 0·030 |
| Lower | 66 (10) | 54 (4) | 69 (16) | 62 (19) | Sampling time × needle age × ozone: 0·021 | |
| CF/D | Upper | 61 (22) | 67 (28) | 52 (17) | 77 (10) | Needle side × ozone × drought: 0·002 |
| Lower | 56 (6) | 71 (12) | 63 (15) | 80 (4) | Needle age × drought: 0·001 | |
| NF+/W | Upper | 59 (10) | 59 (9) | 62 (13) | 61 (4) | Needle age: 0·001 |
| Lower | 66 (11) | 65 (10) | 73 (11) | 62 (18) | ||
| NF+/D | Upper | 62 (13) | 76 (17) | 66 (10) | 73 (18) | |
| Lower | 43 (20) | 69 (13) | 58 (15) | 67 (15) | ||
| Cytoplasmic vacuoles (%) | ||||||
| CF/W | Upper | 7 (6) | 1 (2) | 13 (6) | 5 (3) | Needle age × ozone × water: 0·052 |
| Lower | 2 (4) | 0 (0) | 5 (11) | 9 (11) | Sampling time × ozone: 0·052 | |
| CF/D | Upper | 2 (4) | 2 (3) | 11 (10) | 9 (11) | Sampling time: 0·003 |
| Lower | 1 (3) | 0 (0) | 5 (11) | 8 (7) | ||
| NF/W | Upper | 8 (9) | 5 (6) | 4 (3) | 10 (10) | |
| Lower | 2 (6) | 2 (3) | 6 (11) | 9 (10) | ||
| NF/D | Upper | 15 (13) | 4 (4) | 11 (14) | 1 (2) | |
| Lower | 5 (4) | 1 (2) | 8 (6) | 6 (15) | ||
Significant main effects and interactions are indicated together with probability values.
Analyses were done before the onset of drought periods (28 July) and at the end of the experiment, after re‐watering (4 Oct.).
CF, charcoal filtered air; NF+, non‐filtered air + extra ozone; W, well watered; D, drought stressed; C, current year needle; C+1, previous year needle.
n = 5 for CF, 6 for NF+.
In addition to the central vacuole, cytoplasmic vacuoles of the same size as chloroplasts could be seen both by TEM and LM. These vacuoles were most often detected around the nucleus (Fig. 2A). The proportion of cells with these smaller vacuoles in all treatments was higher at the end of the experiment than at the beginning (Table 4). However, compared with CF, the difference between sampling times was not as marked in NF+, which had a higher proportion of cytoplasmic vacuoles at the beginning of the experiment (Table 4). In C needles NF+ alone did not affect the proportion of cells with nucleus‐encircling vacuoles at the first sampling occasion: in CF/D the proportion was decreased, whilst it was increased in NF+/D (Table 4). In contrast, the C+1 needles had the smallest proportion of cells with cytoplasmic vacuoles in NF+/D.
Chloroplasts.
The shape of the chloroplasts was analysed on 28 July, before the onset of the drought periods, and on 16 Aug., during the moderate drought. The ratio of chloroplast length : width varied between 1·3 and 1·6 (ratio 1 = round chloroplast). The chloroplasts from the W saplings were significantly (P = 0·002) rounder than those from the D saplings at both sampling times (data not shown). Also, the chloroplasts from the C+1 needles were significantly (P < 0·0005) rounder than those from the C needles (data not shown).
Starch grains (Fig. 2B) of the mesophyll cells were largest on the first sampling occasion (Table 5). The grains were significantly larger in the C needles compared with the C+1 needles and in the lower side compared to the upper side of the needles (Table 5). These differences were also seen at later sampling times, although they were not statistically tested. Drought always decreased starch (Table 5). One day after re‐watering (18 Aug.), the D saplings had not accumulated starch to the same level as W saplings. On 4 Oct. the needles from CF/D had a higher amount of starch than the other treatments, as was found in the endodermis. Sampling time had a significant effect on chloroplast area (Table 6). Pairwise comparisons between sampling occasions showed that chloroplasts were larger on the first sampling occasion than those measured later (P < 0·05 for Tukey’s HSD tests). The chloroplasts from the C needles were approx. 2 µm2 larger than those from the C+1 needles. The chloroplasts were larger in the lower side than in the upper side, but this difference between the needle sides was more pronounced in the C needles than in the C+1 needles (Table 6). The chloroplast area appeared to follow the changes in the mean area of the starch grains (Tables 5 and 6). Indeed, at the first three sampling times, when the largest starch grains were measured, the area of chloroplasts correlated significantly (P < 0·05) with the area of the starch (Pearson r = 0·5–0·7). Despite these changes in chloroplast area, probably mediated by starch, there was a significant ozone × drought interaction (Table 6). The chloroplasts from CF/D and from NF+/W were larger than the chloroplasts from CF/W, whereas the chloroplasts from NF+/D were smaller compared with the other treatments. This pattern was independent of sampling time, needle side or needle age. The difference between the treatments was small, within 1 µm2.
Table 5.
Mean values (s.d.) of the transmission electron microscopy analyses for area of the cross‐sections of starch grains (µm2) in the mesophyll cells
| 28 July | 16 Aug. | 18 Aug. | 18 Sept. | 4 Oct. | ||||||||
| Treatment | Needle side | C | C+1 | C | C+1 | C | C+1 | C | C+1 | C | C+1 | Main effects and interactions* |
| CF/W | Upper | 1·9 (2·6) | 0·6 (1·1) | 0·6 (0·7) | 0·2 (0·3) | 0·2 (0·2) | <0·1 (<0·1) | <0·1 (<0·1) | <0·1 (<0·1) | <0·1 (<0·1) | <0·1 (<0·1) | Needle age: <0·0005 |
| Lower | 1·7 (1·3) | 3·3 (5·4) | 2·7 (4·2) | <0·1 (<0·1) | 0·7 (0·8) | 0·0 (0·0) | <0·1 (<0·1) | <0·1 (<0·1) | 0·1 (0·2) | 0·0 (0·0) | Needle side: <0·0005 | |
| CF/D | Upper | 2·2 (1·3) | <0·1 (<0·1) | 0·0 (0·0) | 0·0 (0·0) | <0·1 (<0·1) | 0·0 (0·0) | 0·0 (0·0) | 0·0 (0·0) | 0·4 (0·5) | <0·1 (<0·1) | |
| Lower | 3·6 (2·6) | 1·6 (2·2) | <0·1 (<0·1) | 0·0 (0·0) | <0·1 (<0·1) | 0·0 (0·0) | 0·0 (0·0) | 0·0 (0·0) | 0·7 (0·8) | 0·2 (0·5) | ||
| NF/W | Upper | 2·3 (1·6) | 0·1 (0·2) | 0·2 (0·2) | <0·1 (<0·1) | 0·4 (0·6) | <0·1 (<0·1) | 0·0 (0·0) | <0·1 (<0·1) | 0·2 (0·2) | 0·0 (0·0) | |
| Lower | 5·3 (2·9) | 1·3 (1·3) | 1·9 (2·4) | 0·6 (0·9) | 2·3 (5·2) | 0·1 (0·2) | <0·1 (<0·1) | 0·0 (0·0) | 0·1 (0·2) | <0·1 (<0·1) | ||
| NF/D | Upper | 2·0 (3·1) | 0·1 (0·2) | <0·1 (<0·1) | 0·1 (0·2) | 0·0 (0·0) | 0·1 (0·3) | <0·1 (<0·1) | 0·0 (0·0) | 0·2 (0·3) | <0·1 (<0·1) | |
| Lower | 4·2 (3·0) | 1·0 (0·9) | 0·2 (0·3) | 0·3 (0·6) | 0·0 (0·0) | 0·3 (0·7) | <0·1 (<0·1) | 0·0 (0·0) | <0·1 (<0·1) | <0·1 (<0·1) | ||
Significant main effects and interactions are indicated together with probability values.
Data are from five sampling occasions, dates from periods of reduced water supplies are shown in bold.
Abbreviations as in Table 4.
* Only from 28 July.
Table 6.
Mean values (s.d.) of the transmission microscopy analyses for the area of the cross‐sections of the chloroplasts (µm2) in the mesophyll cells from five sampling occasions
| 28 July | 16 Aug. | 18 Aug. | 18 Sept. | 4 Oct. | ||||||||
| Treatment | Needle side | C | C+1 | C | C+1 | C | C+1 | C | C+1 | C | C+1 | Main effects and interactions |
| CF/W | Upper | 11·8 (3·3) | 9·4 (3·8) | 10·8 (1·9) | 10·0 (1·1) | 10·2 (1·6) | 8·2 (1·3) | 8·9 (1·8) | 8·8 (2·3) | 10·2 (2·0) | 8·9 (1·7) | Time: <0·0005 |
| Lower | 11·9 (3·0) | 13·8 (7·3) | 12·4 (2·3) | 9·0 (1·2) | 12·1 (4·3) | 9·1 (2·8) | 12·8 (4·1) | 8·2 (1·3) | 13·5 (1·1) | 9·6 (2·6) | Needle side:<0·0005 | |
| CF/D | Upper | 12·2 (3·9) | 8·9 (0·9) | 9·6 (2·2) | 9·3 (1·0) | 9·2 (1·5) | 9·1 (0·9) | 11·4 (3·3) | 8·4 (0·8) | 11·2 (1·9) | 10·0 (1·6) | Needle age: <0·0005 |
| Lower | 14·1 (4·0) | 11·4 (2·0) | 11·1 (2·4) | 8·3 (1·7) | 12·9 (3·2) | 10·7 (1·9) | 11·5 (2·0) | 10·3 (1·9) | 13·7 (4·0) | 10·9 (1·4) | Needle side × age: 0·001 | |
| NF/W | Upper | 12·7 (3·5) | 9·9 (1·4) | 8·9 (1·4) | 9·5 (1·7) | 9·9 (2·1) | 10·4 (1·5) | 10·5 (3·1) | 8·1 (1·3) | 10·5 (1·2) | 10·2 (1·6) | Ozone × drought: 0·023 |
| Lower | 17·6 (4·4) | 12·2 (3·3) | 12·9 (3·2) | 9·6 (2·4) | 14·2 (6·4) | 10·2 (2·8) | 13·7 (2·5) | 10·1 (2·1) | 11·8 (2·6) | 9·5 (1·5) | ||
| NF/D | Upper | 10·7 (4·2) | 9·0 (1·6) | 8·2 (0·8) | 10·7 (2·0) | 9·4 (3·1) | 11·0 (1·9) | 10·3 (3·0) | 9·9 (3·7) | 11·6 (2·6) | 9·4 (1·4) | |
| Lower | 14·8 (4·7) | 10·2 (2·5) | 10·8 (4·3) | 9·1 (2·7) | 11·5 (2·2) | 9·9 (1·3) | 9·5 (3·1) | 9·6 (1·7) | 10·8 (2·4) | 7·5 (1·4) | ||
Significant main effects and interactions are indicated together with probability values.
Dates from periods with reduced water supply are shown in bold.
Abbreviations as in Table 4.
The bending of the thylakoid structures (Fig. 4B) was more common at the second sampling time than at the first one (P = 0·009). The bent thylakoids were also more frequent in the C+1 needles (18 % of chloroplasts) than in the C needles (8 %) (P = 0·002). Negatively stained thylakoids (Fig. 4B and C) were seen in all the studied needles at the second, third and fourth sampling times. Their occurrence was not significantly explained by any of the parameters (data not shown). The thickness of grana stacks varied from thin (three to seven lamellae per grana stack) to extremely thick (from eight up to around 30 lamellae) covering most of the area of chloroplasts (Fig. 4B). The chloroplasts with large grana stacks were seen in 50 % of cases but none of the parameters significantly explained the occurrence.
Granules of different sizes were noted in the chloroplast stroma in all treatments. The largest granules were approx. 20 nm in diameter. They did not form any aggregates as seen in the original negatives and photographs from Sutinen et al. (1990). The stroma of the chloroplasts was, in general, dense (Fig. 4B).
Most of the plastoglobuli were osmiophilic, i.e. stained black (Fig. 2B). However, in 47 % of the needles at least one of the four studied cells had non‐osmiophilic plastoglobuli (Fig. 4C). Many factors affected this symptom (Table 3). Non‐osmiophilic plastoglobuli were more frequent at the first and last sampling times compared with other times. On average, needle age increased the non‐osmiophilic plastoglobuli (C = 43 %, C+1 = 50 %). Ozone increased their occurrence in the C needles, but decreased it in the C+1 needles, and drought increased the occurrence at the first sampling time and decreased it at the last sampling time. A model encompassing needle generation, sampling time and their interaction explained 42 % of cases for amount of plastoglobuli distribution into classes ‘normal’ or ‘increased’ (see Materials and Methods) (Table 3). In the C+1 needles approx. 50 % of the saplings had an increased amount of plastoglobuli (Fig. 4D) at all sampling times. In the C needles an increased amount of plastoglobuli was not seen until the two last sampling times and then only in 10 % of the saplings.
Mitochondria.
With few exceptions mitochondria (Figs 2B and 4B) were more numerous in the upper side than in the lower side of the needles (Table 7). Ozone increased the number of mitochondria per 100 µm2 cytoplasm in the C needles (average values: NF+ = 14·7, CF = 13) but not in the C+1 needles (NF+ = 13, CF = 13). This interaction between needle age and ozone was significant (Table 7). The number of mitochondria changed with time (Table 7), and Tukey’s HSD tests showed that the number of mitochondria was significantly (P < 0·05) higher on 4 Oct., at the end of the experiment, than at other sampling times. Drought affected the number of mitochondria in C and C+1 needles differently with time (Table 7). In the C needles from D the number of mitochondria increased during the moderate drought stress (16 Aug.), decreased during the severe stress (18 Sept.), and increased again at the end of the season. In contrast, the C+1‐needles from D had a higher number of mitochondria compared with other treatments at the beginning of the experiment. During the moderate drought the number started to decrease but, as in C needles, the number increased again at the end of the season.
Table 7.
Mean values (s.d.) of transmission microscopy analyses for the number of the cross‐sections of the mitochondria per 100 µm2 of cytoplasm in the mesophyll cells from five sampling occasions
| 28 July | 16 Aug. | 18 Aug. | 18 Sept. | 4 Oct. | ||||||||
| Treatment | Needle side | C | C+1 | C | C+1 | C | C+1 | C | C+1 | C | C+1 | Main effects and interactions |
| CF/W | Upper | 15·2 (6·2) | 18·2 (2·8) | 13·2 (1·8) | 13·4 (4·8) | 17·6 (3·3) | 15·3 (5·0) | 13·2 (4·1) | 12·2 (3·6) | 16·9 (3·6) | 17·5 (4·2) | Needle age × ozone: 0·039 |
| Lower | 9·3 (2·8) | 9·3 (4·4) | 11·3 (3·3) | 11·7 (4·1) | 12·3 (4·0) | 17·7 (11·0) | 12·3 (3·4) | 9·9 (5·5) | 15·9 (4·5) | 12·4 (5·3) | Needle side: <0·0005 | |
| CF/D | Upper | 14·4 (4·3) | 13·8 (3·8) | 15·3 (4·5) | 13·4 (3·7) | 15·1 (5·0) | 12·8 (1·1) | 9·0 (3·0) | 15·7 (3·9) | 14·1 (3·5) | 18·1 (5·4) | Time × needle age × drought: 0·032 |
| Lower | 9·5 (2·4) | 11·8 (3·4) | 13·2 (4·1) | 12·4 (4·9) | 10·2 (1·1) | 10·2 (3·0) | 10·4 (5·3) | 9·0 (5·9) | 17·6 (4·7) | 16·0 (4·3) | Time × needle age × needle side: 0·032 | |
| NF/W | Upper | 17·8 (2·2) | 13·9 (1·8) | 15·1 (1·2) | 13·2 (3·9) | 15·8 (4·3) | 11·4 (3·0) | 18·7 (7·3) | 12·6 (5·8) | 17·7 (3·3) | 12·2 (3·9) | Time: <0·0005 |
| Lower | 11·6 (4·9) | 11·4 (2·5) | 10·5 (3·2) | 12·3 (4·4) | 10·7 (4·3) | 12·6 (6·7) | 9·8 (4·9) | 9·1 (5·1) | 17·7 (9·6) | 13·0 (2·6) | ||
| NF/D | Upper | 16·2 (4·9) | 17·8 (7·9) | 17·0 (4·1) | 15·7 (2·5) | 18·2 (2·3) | 9·5 (5·9) | 10·6 (4·4) | 18·0 (7·2) | 18·8 (6·1) | 17·5 (8·6) | |
| Lower | 13·3 (5·8) | 15·4 (3·6) | 12·7 (6·3) | 10·4 (4·6) | 13·5 (4·2) | 13·4 (3·9) | 13·7 (4·3) | 11·1 (3·3) | 16·2 (3·4) | 11·7 (4·5) | ||
Significant main effects and interactions are indicated together with probability values.
Dates from periods of reduced water supply are shown in bold.
Abbreviations as in Table 4.
The mean area of the cross‐sections of mitochondria (data not shown) was on average 0·47 µm2. The mitochondria from CF were significantly (P = 0·015) larger (0·49 µm2) than those from NF+ (0·46 µm2). Drought had no significant effects on area of mitochondria. Several significant interactions between sampling time, needle age and/or needle side were obtained (data not shown). These were due to very small mitochondria (approx. 0·3 µm2) on 18 Sept. and large ones in the upper side of the C needles on 4 Oct.
Peroxisomes.
The number of cross‐sections of the peroxisomes (Figs 2B and 4B) was on average 2·7 organelles per 100 µm2 cytoplasm. Usually, there were more peroxisomes in the upper side than in the lower side of the needle (P = 0·025). This difference was pronounced in NF+, which had on average 2·9 peroxisomes in the upper side and 2·4 in the lower side, whereas in CF there were 2·8 peroxisomes in both sides (P = 0·049 for needle side × ozone). The interaction needle side × needle age was also significant (P < 0·0005): in the C needles, the number of peroxisomes per 100 µm2 cytoplasm was higher in the upper side of the needle (3·2) than in the lower side (2·2), whereas, in the C+1 needles the difference between sides was smaller and opposite to that of the C needles (2·6 and 2·8 organelles in upper and lower sides, respectively). Regardless of needle age or side, the number of peroxisomes changed between the treatments during the sampling period (Fig. 5, P = 0·002 for time × drought, P = 0·070 for time × ozone, P = 0·038 for time × ozone × drought). There was quite a lot of fluctuation in peroxisome number during the sampling period (Fig. 5). Nevertheless, at the beginning of the experiment D saplings had more peroxisomes than W saplings (Fig. 5). The same was also seen on the third and last sampling occasions, when all saplings were well‐watered (Fig. 5).

Fig. 5. Mean number of peroxisomes in 100 µm2 cytoplasm (with s.e., upwards for triangles and downwards for squares) in the mesophyll cells of needles of Norway spruce saplings exposed to charcoal‐filtered air (squares) or ozone (non‐filtered air × 1·5 ambient ozone concentration; triangles) and kept well‐watered (closed symbols) or drought‐stressed (open symbols) during a 10‐week study period in 1995. Samples from 16 Aug. and 18 Sept. were from periods of reduced water supply. For clarity, the aggregated values from current and second year needles from cells from upper and lower sides of the needles are presented. Significant interactions of drought × time (P = 0·002) and of drought × ozone × time (P = 0·038) were not modified by needle age or needle side.
The mean cross‐sectional area of peroxisomes (data not shown) was 0·88 µm2. Both ozone and drought decreased the size of the peroxisome cross‐sections. The effect of ozone was seen in the upper side of the C needles, and that of drought in both sides of the C needles and in the upper side of the C+1 needles. These effects resulted in significant interactions: needle side × ozone × drought (P = 0·030), needle age × ozone × drought (P = 0·036) and needle side × needle age × ozone × drought (P = 0·028), and main effect of drought (P = 0·013). On average, peroxisomes were larger in younger than in older needles (P < 0·0005). The area of the peroxisomes differed between sampling times (P = 0·001). The largest peroxisomes were measured at the second sampling time, 16 Aug. The interactions between sampling time and the other factors were not significant.
DISCUSSION
Ozone
Chloroplasts are often reported to be the first organelles affected by ozone. Typical impact of ozone on conifer chloroplasts is characterized by a syndrome which includes a decreased size of the chloroplasts accompanied by an electron‐dense stroma rich in ribosome‐like granules (Sutinen et al., 1990). These ozone‐related symptoms in the chloroplast structure were not observed here, despite having previously been described in needles of the same age (C and C+1) from young conifers exposed to ozone in closed (Holopainen et al., 1996) and open‐top chambers (Sutinen et al., 1990) or open‐field conditions (Anttonen and Kärenlampi, 1996) with similar or lower ozone concentrations and doses as in this study.
Similar osmiophilic (dark) and non‐osmiophilic (light or translucent) plastoglobuli in the chloroplasts as those found in this study have previously been described in conifer needles (e.g. Wulff et al., 1996). The changes in the osmiophilic properties relate to the altered lipid composition of plastoglobuli (Hayes et al., 1963; Dahlin and Ryberg, 1986). The amount of non‐osmiophilic plastoglobuli in the chloroplasts was increased in the C needles, but decreased in the C+1 needles from NF+, suggesting that ozone induced alterations in the lipid metabolism of the spruce needles. An increase was also seen in the cytoplasmic lipid aggregates of the C needles from NF+, an observation in accordance with that by Anttonen and Kärenlampi (1996) in ozone‐exposed needles of Scots pine (Pinus sylvestris). Although an increase in the amount of plastoglobuli is a well‐known stress response of conifers, including ozone stress (Sutinen and Koivisto, 1995), it was not seen here. In this study, the number of plastoglobuli and the amount of cytoplasmic lipids aggregates showed typical increases during needle ageing (cf. Wulff et al., 1996, for example).
The lack of drastic changes in the chloroplast structure in the present study ties in well with the chlorophyll concentrations measured from sub‐replicate trees from the same chambers. Ozone significantly increased the chlorophyll concentration in the C+1 needles with the same trend in the C needles, whereas a decrease was measured in the C+2 and C+3 needles (Wallin et al., 2002). Furthermore, low concentrations of ozone have been shown to stimulate photosynthesis of the youngest needle generation of conifers (e.g. Wallin et al., 1990). The ozone‐induced increase in the length of starch grains in the endodermis from NF+/W on 28 Aug. and decrease on 4 Oct. may be indicative of such transient stimulation. It may also indicate ozone‐induced problems in the mechanism of apoplastic phloem loading, as in Aleppo pine (Wellburn and Wellburn, 1994).
One reason for the mild ozone impact on the chloroplasts may be the high nitrogen concentration of the C needles, 25–29 mg g–1 in 1994 and 19–21 mg g–1 in 1995 (Wallin et al., 2002). Typical values of N in spruce needles from forests of southern Sweden were 13–14 mg g–1 in 1985–1994 (Thelin et al., 1998). Good nitrogen availability has been shown to reduce the typical chloroplast symptoms in Scots pine exposed to ozone (Utriainen and Holopainen, 2001). The high nitrogen concentration of the needles here was reflected in an increased amount of thylakoid membranes as shown, for example, by Jokela et al. (1995), and probably also in the electron density of the stroma, caused by high amounts of proteins such as ribulose bisphosphate carboxylase (Buchanan et al., 2000).
It seems that in our material the saplings were in the phase of active defence against oxidative stress, which at the cellular level in the needles was seen as an increased number of peroxisomes and mitochondria. Proliferation of peroxisomes is stated to be indicative of a common mechanism for dealing with oxidative stress (Lopez‐Huertas et al., 2000). In Norway spruce needles, ozone‐induced proliferation of peroxisomes, accompanied by an increase in the particulate catalase, has also been reported (Morré et al., 1990). In this study, ozone increased the number of peroxisomes in the upper (i.e. the light‐exposed) side of the needles relative to that in the lower side of the needles. This relates to the fact that the upper side of the needles is more exposed to oxidative ozone stress than the lower side, which in turn is probably associated with the observation that cellular injuries (Sutinen et al., 1990; Fink, 1999) as well as visible injuries (VanderHeyden et al., 2001) are seen first, or only, in the upper side of the foliage.
Mitochondria divide and fuse continually and can thus rapidly respond to the demands of the environment (van der Bliek, 2000), and high variation in the number of mitochondria between the sampling days differing, for example, in temperature, was seen here. Nevertheless, the number was consistently higher in C needles from NF+ compared with all other treatments. Ozone has been shown to increase the respiration of needles of Norway spruce (C, not C+1, needles; Wallin et al., 1990) and Scots pine (C needles; Kellomäki and Wang, 1998) and respiration‐related biochemical responses in Aleppo pine (C needles; Gerant et al., 1996). We suggest that the increased number of mitochondria here is a reflection of an ozone‐induced increase in maintenance respiration in the youngest needles (Kellomäki and Wang, 1998). We also found that ozone decreased the size of mitochondria, which may be due to high ADP concentration or to osmotic properties of the cells (summarized by Bereiter‐Hahn and Vöth, 1983).
Vacuoles are multifunctional compartments which are involved in cellular responses to environmental stress (Marty, 1999). Ozone has been shown previously to increase the vacuolar volume of aspen (Populus tremuloides), which was regarded as a sign of functional and structural acclimation to stress (Oksanen et al., 2001). In the study reported here, at the end of the season the central vacuoles of C+1 needles from NF+ were smaller compared with those of CF treatment and C needles. The cytoplasmic vacuoles around the nucleus were more frequent in NF+ compared with the controls at the beginning of the experiment, but did not increase towards the end of the season as in the controls. Vacuoles are involved in the change of the osmotic properties of the cells (Marty, 1999) which, for example, take place during winter hardening processes (Öquist et al., 2001). Moreover, the number of small vacuoles has been reported to increase during the induction of winter tolerance in Bromus inermis (Tanino et al., 1991). Changes in solute transport and osmoregulation mechanisms were suggested to be the reason for ozone‐induced alterations in the timing of hardening in loblolly pine (Pinus taeda L.) seedlings (Edwards et al., 1990). Therefore, we suggest that vacuolar changes in our study at least partly reflect the osmotic properties of the cells and may indicate that ozone has interfered with the winter hardening processes.
Drought
The number of sclerenchyma cells was lower and the proportion of underdeveloped sclerenchyma cells was higher in the vascular tissue of the C and C+1 needles from D saplings compared with W saplings. Furthermore, the proliferation of the tonoplast and the number of peroxisomes in the mesophyll tissue were increased in D at the first sampling time, even in the C needles that had not yet been exposed to D during the study year. Thus, these changes must have been due to previous years’ drought treatments.
The decreased number and underdevelopment of sclerenchyma cells in Scots pine needles has been associated to increased N fertilization and to deficiency of B, K and P (summarized by Jokela et al., 1995). Proliferation of the tonoplast has been related to K deficiency in Scots pine by Holopainen and Nygren (1989), but not by Jokela et al. (1998). Needle nutrient analysis showed that the drought treatment increased the concentrations of N and P and decreased that of B in C needles (measured in December 1995; Wallin et al., 2002), and increased the concentrations of N, K, Ca and Mg and decreased that of P, B and Cu in C+1 needles (measured in December 1994, when these needles were C needles; Wallin et al., 2002). No actual nutrient deficiency was seen (Wallin et al., 2002), but ratios K : N, P : N and B : N (calculated from Wallin et al., 2002), especially in C+1 needles, were under or at the risk‐level of deficiency (Nihlgård, 1990; Linder, 1995), in some cases even in well‐watered controls. Therefore, we suggest that the developmental disorders of the sclerenchyma cells and the proliferation of the tonoplast are reflecting the nutrition status of both needle generations and that the nutrition status was more unbalanced due to drought.
On the first sampling occasion, before the onset of drought, the C+1 needles of the D saplings had more mitochondria as well as peroxisomes compared with the W saplings, and the C needles had more peroxisomes. This was most likely caused by the drought stress treatments during the previous years. Drought‐induced memory effects in Norway spruce have also been observed as increased activity of superoxide dismutase, peroxidase and catalase in the needles in the winter following drought treatments during the previous summer (Schwanz et al., 1996). While the ozone‐induced increase in the number of peroxisomes and mitochondria was rather consistent throughout the sampling period in the W saplings, more fluctuations were seen in D, depending on watering status, severity of the stress and needle age. In addition, drought decreased the size of the peroxisomes. However, peroxisomes in drought‐stressed needles can undergo diurnal changes in size, and increase in size over that of the well‐watered spruce saplings after the morning hours (Kivimäenpää et al., 2001). Our results emphasize the importance of peroxisomes and mitochondria in drought stress responses, but also the importance of the sampling time.
A decrease in the amount of starch and rounded chloroplasts with bent thylakoids are typical ultrastructural changes induced by drought stress (Sutinen and Koivisto, 1995; Pääkkönen et al., 1998; Fink, 1999). Round chloroplasts and bent thylakoids were here seen even in the W saplings and were more pronounced in the older needles. Also, starch grains were smaller in the older needles. Lower stomatal conductance and photosynthesis of the C+1 compared with C needles (E. L. Medin, pers. comm.) may explain some of the differences between needle generations. Measurements of water potential showed that the W saplings did not experience drought at any time during the study (Karlsson et al., 2002). Therefore, there must be another explanation to the drought‐like ultrastructural changes in W saplings. It is possible that these changes reflect the first stage of cold acclimation, which in trees from regions with cold winters can be initiated as soon as the shoot growth has ceased (Bigras et al., 2001). The decrease in the accumulation of starch towards the autumn as seen here is a typical seasonal change in conifer needles (Linder, 1995). The chloroplast length/width ratios (1·3–1·6) were similar to those from winter‐hardened conifer needles [measured from figures in Soikkeli (1980), Wulff et al. (1996) and Jönsson et al. (2001)], whereas during active growth the ratio of chloroplast length to width seems to be approx. 2 in intact conifer needles [measured from figures of Sutinen et al. (1990), Holopainen et al. (1996) and Utriainen and Holopainen (2001)].
A decrease in the accumulation of starch is a well‐known response of tree foliage to drought. Here, the starch grains of D saplings were very small or not detected during the drought periods. One day after re‐watering following the drought cycle was not sufficient for D saplings to accumulate starch as much as the W saplings. Due to the season and early sampling time (Kivimäenpää et al., 2001) the differences between the W and D saplings were small. Kivimäenpää et al. (2001) found that in the morning starch grains were small in all treatments, after which the starch in the W saplings increased in size compared with the D saplings. At the first and last sampling times, the starch grains were largest in CF/D, which may be indicative of a compensation mechanism. This was not seen in the NF+/D. The increase in the area of vascular cylinder that was seen in both CF/D and NF+/D may be another type of compensation mechanism. This may be regarded as an acclimation to the increased drought stress (Apple et al., 2002).
The drought‐induced enlargement of the central vacuole was more pronounced in C+1 than in C needles. The same difference in the size of the vacuoles between W and D in the C needles was reported earlier by Kivimäenpää et al. (2001) and was suggested to indicate differences in ion and water fluxes between vacuole and cytoplasm.
Interaction of ozone and drought
Interactions between drought and ozone on cell structures were few, which was also the case for growth, chlorophyll concentration and nutrient status of spruce saplings from the same experiment (Karlsson et al., 2002; Wallin et al., 2002). Drought alone increased the amount of starch at the end of the experiment, but this effect was not seen when ozone and drought were combined. This interaction at the end of the season resembles that found for gas exchange of Aleppo pine, where ozone treatment delayed the recovery from drought‐stress (Inclán et al., 1998). The ozone‐induced increase in the nucleus‐encircling vacuoles in the C needles was most pronounced when ozone and drought stress were combined, and suggests that drought increased the effect of ozone on the osmotic properties of cells (see above). Ozone and drought alone both increased the size of chloroplasts, but the combination of these stresses did not. A similar pattern of interaction was seen in the size of central vacuole, i.e. the needles of CF/W and NF+/D had smaller vacuoles than CF/D and NF+/W (upper side of the needles), although the effect of treatments was opposite in the lower side (i.e. CF/W and NF+/D had larger vacuoles and CF/D and NF+/W smaller). These interactions were seen even at the beginning of experiment in both needle generations, suggesting acclimation to the drought and ozone stresses alone, but not to the more stressful conditions of drought and ozone in combination.
Needle side
The needle side facing the sky (upper side) and that facing the branch (lower side) differed from each other in many respects. In the upper side the intercellular space was wider, chloroplasts and starch grains were smaller, and the number of mitochondria and peroxisomes of C needles were higher.
The larger intercellular area in the upper side compared with that in the lower side might indicate more effective diffusion of gases there. This can be one reason why ozone impact on the chloroplasts of spruce needles (Sutinen et al., 1990), when present, are detected first in the mesophyll cells on the upper side of the needle. The role of the intercellular space in ozone responses has also been discussed, e.g. by Evans et al. (1996). In spruces, the needle side facing the sky and the cells under it are also more exposed to light. The light and wide intercellular space may provide more stressful environmental conditions and different metabolic requirements in the upper side of the needle compared with the lower side of it. For example, as seen in the C needles of this study, the carbon dioxide fixed may be used for defence reactions and is therefore not accumulated as starch to the same extent as in the lower side of the needle. Consequently, the higher number of mitochondria and peroxisomes in the upper side may be a sign of higher photorespiration, repair and detoxification processes.
Methodological implications
This study highlights several factors that should be taken into consideration when microscopy is used in both experimental and field studies. In late summer, chloroplast alterations induced by moderate drought (round shape, decreased starch content, bent thylakoids) may be difficult to distinguish from changes related to winter hardening. Large starch grains affect the size of the chloroplast (as also seen by Holopainen et al., 1996) which may hamper the study of chloroplast size. This study also showed that numbers and sizes of organelles can vary between cells in the upper and lower side of the spruce needles, and that the stress responses can differ between the needle sides. Thus, confusing results or high variation may be obtained if the location of the examined cells in the needle cross‐section is not considered.
ACKNOWLEDGEMENTS
We thank Patrik Alströmer and the staff at Östads säteri for help with practical issues at the field site, Marja‐Leena Jalkanen, Helmi Heimonen, Raimo Pesonen for assistance in laboratory and Dr Toini Holopainen for comments on manuscript. The research was financially supported by the Swedish Environmental Protection Agency (NV), the Swedish Council of Forestry and Agricultural Research (SJFR), the Foundation for the Swedish Environmental Research Institute (IVL), the Östad foundation, Nils & Dorthi Troëdsson Research Foundation, NorFa, Graduate School in Environmental Physiology, Molecular Biology and Ecotechnology, Finnish Graduate School in Environmental Science and Technology, the Finnish Konkordia Foundation and the Finnish Cultural Foundation.
Supplementary Material
Received: 14 March 2003; Returned for revision: 1 May 2003; Accepted: 1 September 2003 Published electronically: 23 October 2003
References
- AlaviG.2002. The impact of soil moisture on stem growth of spruce forest during a 22‐year period. Forest Ecology and Management 166: 17–33. [Google Scholar]
- AlonsoR, Elvira S, Castillo FJ, Gimeno BS.2001. Interactive effects of ozone and drought stress on pigments and activities of antioxidative enzymes in Pinus halepensis Plant, Cell and Environment 24: 905–916. [Google Scholar]
- AnttonenS, Kärenlampi L.1996. Slightly elevated ozone exposure causes cell structural changes in needles and roots of Scots pine. Trees – Structure and Function 10: 207–217. [Google Scholar]
- AppleM, Tiekotter K, Snow M, Young J, Soeldner A, Phillips D, Tingey D, Bond BJ.2002. Needle anatomy changes with increasing tree age in Douglas‐fir. Tree Physiology 22: 129–136. [DOI] [PubMed] [Google Scholar]
- Bereiter‐HahnJ, Vöth M.1983. Metabolic control of shape and structure of mitochondria in situ. Biology of the Cell 47: 309–322. [Google Scholar]
- BerghJ, Linder S, Lundmark T, Elfving B.1999. The effect of water and nutrient availability on the productivity of Norway spruce in northern and southern Sweden. Forest Ecology and Management 119: 51–62. [Google Scholar]
- BeyersJ, Riechers G, Temple PJ.1992. Effects of long‐term ozone exposure and drought on the photosynthetic capacity of ponderosa pine (Pinus ponderosa Laws.). New Phytologist 122: 81–90. [DOI] [PubMed] [Google Scholar]
- BigrasFJ, Ryyppö A, Lindström A, Stattin E.2001. Cold acclimation and deacclimation of shoots and roots of conifer seedlings. In: Bigras FJ, Colombo SJ, eds. Conifer cold hardiness Dordrecht: Kluwer Academic Publishers, 57–88. [Google Scholar]
- BuchananBB, Gruissem W, Jones RL.2000.Biochemistry & molecular biology of plants. Rockville: American Society of Plant Physiologists. [Google Scholar]
- BussottiF, Ferretti M.1998. Air pollution, forest condition and forest decline in Southern Europe: an overview. Environmental Pollution 101: 49–65. [DOI] [PubMed] [Google Scholar]
- DahlinC, Ryberg H.1986. Accumulation of phytoene in plastoglobuli of SAN‐9789 (Nonfluorazon)‐treated dark‐grown wheat. Physiologia Plantarum 68: 39–45. [Google Scholar]
- DixonM, Le Thiec D, Garrec JP.1998. Reactions of Norway spruce and beech trees to 2 years of ozone exposure and episodic drought. Environmental and Experimental Botany 40: 77–91. [Google Scholar]
- EdwardsGS, Pier PA, Kelly JM.1990. Influence of ozone and soil magnesium status on the cold hardiness of Loblolly pine (Pinus taeda L.) seedlings. New Phytologist 115: 157–164. [Google Scholar]
- EmbersonLD, Ashmore MR, Cambridge HM, Simpson D, Tuovinen J‐P.2000. Modelling stomatal ozone flux across Europe. Environmental Pollution 109: 403–413. [DOI] [PubMed] [Google Scholar]
- EvansLS, Albury K, Jennings N.1996. Relationship between anatomical characteristics and ozone sensitivity of leaves of several herbaceous dicotyledonous plant species at Great Smoky Mountains National Park. Environmental and Experimental Botany 36: 413–420. [Google Scholar]
- FinkS.1999.Pathological and regenerative plant anatomy. Berlin: Borntraeger. [Google Scholar]
- GerantD, Podor M, Grieu P, Afif D, Cornu S, Morabito D, Banvoy J, Robin C, Dizengremel P.1996. Carbon metabolism enzyme activities and carbon partitioning in Pinus halepensis Mill. exposed to mild drought and ozone. Journal of Plant Physiology 148: 142–147. [Google Scholar]
- HayatMA.1989.Principles and techniques of electron microscopy. Biological applications. 3rd edn. Houndsmills: Macmillan Press. [Google Scholar]
- HayesT, Lindgren FT, Gofman JW.1963. A quantitative determination of the osmium tetroxide‐lipoprotein interaction. Journal of Cell Biology 19: 251–255. [DOI] [PMC free article] [PubMed] [Google Scholar]
- HjellbrekkeAG, Solberg S.2002.Ozone measurements2000.EMEP CCC‐Report 5/2002. Kjeller: Norwegian Institute for Air Research. [Google Scholar]
- HolopainenT, Nygren P.1989. Effects on potassium deficiency and simulated acid rain, alone and in combination, on the ultrastructure of Scots pine needles. Canadian Journal of Forest Research 19: 1402–1411. [Google Scholar]
- HolopainenT, Anttonen S, Palomäki V, Kainulainen P, Holopainen JK.1996. Needle ultrastructure and starch content in Scots pine and Norway spruce after ozone fumigation. Canadian Journal of Botany 74: 67–76. [Google Scholar]
- HolopainenT, Anttonen S, Wulff A, Palomäki V, Kärenlampi L.1992. Comparative evaluation of the effects of gaseous pollutants, acidic deposition and mineral deficiencies: structural changes in the cells of forest plants. Agriculture, Ecosystems and Environment 42: 365–398. [Google Scholar]
- InclánR, Alonso R, Pujadas M, Terés J, Gimeno BS 1998. Ozone and drought stress: interactive effects on gas exchange in Aleppo pine (Pinus halepensis Mill.). Chemosphere 36: 685–690. [Google Scholar]
- JokelaA, Bäck J, Huttunen S, Jalkanen R.1995. Excess nitrogen fertilization and structure of Scots‐pine needles. European Journal of Forest Pathology 25: 109–124. [Google Scholar]
- JokelaA, Sarjala T, Huttunen S.1998. The structure and hardening status of Scots pine needles at different potassium availability levels. Trees – Structure and Function 12: 490–498 [Google Scholar]
- JönssonAM, Kivimäenpää M, Stjernquist I, Sutinen S.2001. Frost hardiness in bark and needles of Norway spruce in southern Sweden. Trees – Structure and Function 15: 171–176. [Google Scholar]
- KarlssonPE, Medin EL, Selldén G, Wallin G, Ottosson S, Pleijel H, Skärby L.2002. Impact of ozone and reduced water supply on the biomass accumulation of Norway spruce saplings. Environmental Pollution 119: 237–244. [DOI] [PubMed] [Google Scholar]
- KarlssonPE, Medin EL, Wickström H, Selldén G, Wallin G, Ottosson S, Skärby L.1995. Ozone and drought stress – interactive effects on the growth and physiology of Norway spruce (Picea abies (L.) Karst.). Water, Air and Soil Pollution 85: 1325–1330. [Google Scholar]
- KellomäkiS, Wang K‐Y.1998. Growth, respiration and nitrogen content in needles of Scots pine exposed to elevated ozone and carbon dioxide in the field. Environmental Pollution 101: 263–274. [DOI] [PubMed] [Google Scholar]
- KivimäenpääM, Sutinen S, Medin EL, Karlsson PE, Selldén G.2001. Diurnal changes in microscopic structures of mesophyll cells of Norway spruce, Picea abies (L.) Karst. and the effects of ozone and drought. Annals of Botany 88: 119–130. [Google Scholar]
- Le ThiecD, Dixon M, Garrec JP.1994. The effects of slightly elevated ozone concentrations and mild drought stress on the physiology and growth of Norway spruce, Picea abies (L.) Karst. and beech, Fagus sylvatica L. in open‐top chambers. New Phytologist 128: 671–678. [Google Scholar]
- LinderS.1995. Foliar analysis for detecting and correcting nutrient imbalances in Norway spruce. Ecological Bulletins 44: 178–190. [Google Scholar]
- Lopez‐HuertasE, Charlton WL, Johnson B, Graham IA, Baker A.2000. Stress induces peroxisome biogenesis genes. EMBO Journal 19: 6770–6777. [DOI] [PMC free article] [PubMed] [Google Scholar]
- McLaughlinS, Percy K.1999. Forest health in North America: some perspectives on actual and potential roles of climate and air pollution. Water, Air, and Soil Pollution 116: 151–197. [Google Scholar]
- MäkinenH, Nöjd P, Mielikäinen K.2001. Climatic signal in annual growth variation in damaged and healthy stands of Norway spruce [Picea abies (L.) Karst.] in southern Finland. Trees – Structure and Function 15: 77–185. [Google Scholar]
- MartyF.1999. Plant vacuoles. The Plant Cell 11: 587–600. [DOI] [PMC free article] [PubMed] [Google Scholar]
- MorréDJ, Selldén G, Ojanperä K, Sandelius AS, Egger A, Morré DM, Chalco CM, Chalco RA.1990. Peroxisome proliferation in Norway spruce induced by ozone. Protoplasma 155: 58–65. [Google Scholar]
- NihlgårdB 1990. Svenska skogsträd vitalitet och näringstillstånd. Stressymptom och orsakssamband. In: Liljelund L‐E, Lundmark J‐E, Nihlgård B, Nohrstedt H‐Ö, Rosén K, eds. Skogsvitalisering. Kunskape och forskningsbehov Naturvårdsverkets rapport 3813. Solna: Statens naturvårdsverk, 47–70. [Google Scholar]
- OksanenE, Sober J, Karnosky DF.2001. Impacts of elevated CO2 and/or O3 on leaf ultrastructure of aspen (Populus tremuloides) and birch (Betula papyrifera) in the Aspen FACE experiment. Environmental Pollution 115: 437–446. [DOI] [PubMed] [Google Scholar]
- ÖquistG, Gardeström P, Huner NPA.2001. Metabolic changes during cold hardening and subsequent freezing and thawing. In: Bigras FJ, Colombo SJ, eds. Conifer cold hardiness Dordrecht: Kluwer Academic Publishers, 137–163. [Google Scholar]
- PääkkönenE, Holopainen T, Kärenlampi L.1995. Ageing‐related anatomical and ultrastructural changes in leaves of birch (Betula pendula Roth.) clones as affected by low ozone exposure. Annals of Botany 75: 285–294. [Google Scholar]
- PääkkönenE, Vahala J, Pohjola M, Holopainen T, Kärenlampi L.1998. Physiological, stomatal and ultrastructural ozone responses in birch (Betula pendula Roth.) are modified by water stress. Plant, Cell and Environment 21: 671–684. [Google Scholar]
- SchwanzP, Häberle K‐H, Polle A.1996. Interactive effects of elevated CO2, ozone and drought stress on the activities of antioxidative enzymes in needles of Norway spruce trees (Picea abies, [L.] Karsten) grown with luxurious N‐supply. Journal of Plant Physiology 148: 351–355. [Google Scholar]
- SelldénG, Sutinen S, Skärby L.1997. Controlled ozone exposures and field observations in Fennoscandia. In: Sandermann H, Wellburn AR, Heath RL, eds. Forest decline and ozone. A comparison of controlled chamber and field experiments. Ecological Studies 127. Berlin, Heidelberg: Springer‐Verlag, 249–276. [Google Scholar]
- SoikkeliS.1980. Ultrastructure of the mesophyll in Scots pine and Norway spruce: seasonal variation and molarity of fixative buffer. Protoplasma 103: 241–252. [Google Scholar]
- SteerMS.1991. Quantitative morphological analysis. In: Hall JL, Hawes C, eds. Electron microscopy of plant cell s London, San Diego: Academic Press, 85–104. [Google Scholar]
- SutinenS.1990. Structural changes in needle tissue of spruce trees from a damaged stand in Southern Finland. Scandinavian Journal of Forest Research 5: 403–412. [Google Scholar]
- SutinenS, Koivisto L.1995. Microscopic structure of conifer needles as a diagnostic tool in the field. In: Munawar M, Hänninen O, Roy S, Munawar L, Kärenlampi L, Brown D, eds. Bioindicators of environmental health Amsterdam: SPB Academic Publishing, 73–81. [Google Scholar]
- SutinenS, Lumme I, Mäenpää M, Arkhipov V.1998. Light microscopic structure of needles of Scots pine (Pinus sylvestris L.) in relation to air pollution and needle element concentrations in S.E. Finland and the Karelian Isthmus, N.W. Russia. Trees – Structure and Function 12: 281–288. [Google Scholar]
- SutinenS, Skärby L, Wallin G, Selldén G.1990. Long‐term exposure of Norway spruce, Picea abies (L.) Karst. to ozone in open‐top chambers. II. Effects on the ultrastructure of needles. New Phytologist 115: 345–355. [DOI] [PubMed] [Google Scholar]
- TaninoKK, Chen THH, Fuchigami LH, Weiser CJ.1991. Abscisic acid‐induced cellular alterations during the induction of freezing tolerance in bromegrass cells. Journal of Plant Physiology 137: 619–624. [DOI] [PMC free article] [PubMed] [Google Scholar]
- TemplePJ, Riechers GH, Miller PR.1992. Foliar injury responses of ponderosa pine seedlings to ozone, wet and dry acidic deposition, and drought. Environmental and Experimental Botany 32: 101–113. [Google Scholar]
- TemplePJ, Riechers GH, Miller PR, Lennox RW.1993. Growth responses of ponderosa pine to long‐term exposure to ozone, wet and dry acidic deposition, and drought. Canadian Journal of Forest Research 23: 59–66. [Google Scholar]
- ThelinG, Rosengren‐Brinck U, Nihlgård B, Barkman A.1998. Trends in needle and soil chemistry of Norway spruce and Scots pine stands in South Sweden 1985–1994. Environmental Pollution 99: 149–158. [DOI] [PubMed] [Google Scholar]
- TothR.1982. An introduction to morphometric cytology and its applications to botanical research. American Journal of Botany 69: 1694–1706. [Google Scholar]
- UtriainenJ, Holopainen T.2001. Nitrogen availability modifies the ozone responses of Scots pine seedlings in an open‐field system. Tree Physiology 21: 1205–1213. [DOI] [PubMed] [Google Scholar]
- van der BliekAM.2000. A mitochondrial division apparatus takes place. Journal of Cell Biology 151: F1–F4. [DOI] [PMC free article] [PubMed] [Google Scholar]
- VanderHeydenD, Skelly J, Innes J, Hug C, Zhang J, Landolt W, Bleuler P.2001. Ozone exposure thresholds and foliar injury on forest plants in Switzerland. Environmental Pollution 111: 321–331. [DOI] [PubMed] [Google Scholar]
- WallinG, Skärby L.1992. The influence of ozone on the stomatal and non‐stomatal limitation of photosynthesis in Norway spruce, Picea abies (L.) Karst, exposed to soil moisture deficit. Trees – Structure and Function 6: 128–136. [Google Scholar]
- WallinG, Karlsson PE, Selldén G, Ottosson S, Medin E‐L, Pleijel H, Skärby L.2002. Impact of four years exposure to different levels of ozone, phosphorus and drought on chlorophyll, mineral nutrients, and stem volume of Norway spruce, Picea abies Physiologia Plantarum 114: 192–206. [DOI] [PubMed] [Google Scholar]
- WallinG, Skärby L, Selldén G.1990. Long‐term exposure of Norway spruce, Picea abies (L.) Karst. to ozone in open‐top chambers. I. Effects on the capacity of net photosynthesis, dark respiration and leaf conductance of shoots of different ages. New Phytologist 115: 335–344. [DOI] [PubMed] [Google Scholar]
- WellburnFAM, Wellburn AR.1994. Atmospheric ozone affects carbohydrate allocation and winter hardiness of Pinus halepensis (Mill.) Journal of Experimental Botany 45: 607–614. [Google Scholar]
- WulffA, Ahonen J, Kärenlampi L.1996. Cell ultrastructural evidence of accelerated ageing of Norway spruce needles in industrial areas. New Phytologist 133: 553–561. [Google Scholar]
Associated Data
This section collects any data citations, data availability statements, or supplementary materials included in this article.