

Abstract
Genetically encoded fluorescent ribonucleic acids (RNAs) have diverse applications, including imaging RNA trafficking and as a component of RNA-based sensors that exhibit fluorescence upon binding small molecules in live cells. These RNAs include the Spinach and Spinach2 aptamers, which bind and activate the fluorescence of fluorophores similar to that found in green fluorescent protein. Although additional highly fluorescent RNA–fluorophore complexes would extend the utility of this technology, the identification of novel RNA–fluorophore complexes is difficult. Current approaches select aptamers on the basis of their ability to bind fluorophores, even though fluorophore binding alone is not sufficient to activate fluorescence. Additionally, aptamers require extensive mutagenesis to efficiently fold and exhibit fluorescence in living cells. Here we describe a platform for rapid generation of highly fluorescent RNA–fluorophore complexes that are optimized for function in cells. This procedure involves selection of aptamers on the basis of their binding to fluorophores, coupled with fluorescence-activated cell sorting (FACS) of millions of aptamers expressed in Escherichia coli. Promising aptamers are then further optimized using a FACS-based directed evolution approach. Using this approach, we identified several novel aptamers, including a 49-nt aptamer, Broccoli. Broccoli binds and activates the fluorescence of (Z)-4-(3,5-difluoro-4-hydroxybenzylidene)-1,2-dimethyl-1H-imidazol-5(4H)-one. Broccoli shows robust folding and green fluorescence in cells, and increased fluorescence relative to Spinach2. This reflects, in part, improved folding in the presence of low cytosolic magnesium concentrations. Thus, this novel fluorescence-based selection approach simplifies the generation of aptamers that are optimized for expression and performance in living cells.
Introduction
Imaging RNA in living cells is important for understanding the function and regulation of diverse classes of cellular RNAs encoded by the genome. A common strategy for imaging RNAs is to express “fusion RNAs” that comprise the RNA of interest along with an additional RNA tag that confers fluorescence to the RNA of interest.1 One major approach is to use RNA tags that recruit green fluorescent fusion proteins.2 A related approach involves the use of two tags that template the formation of green fluorescent protein (GFP) by recruiting each half of split GFP.3 These, and other related approaches, require the coexpression of proteins, and may lead to fluorescence background due to fluorescence of unbound GFP.1
An alternate strategy is to use RNA sequences that exhibit fluorescence upon binding small molecules. Several RNA aptamers that bind and switch on the fluorescence of various small-molecule fluorophores have been described.4−7 The initial fluorophores were problematic because their fluorescence is nonspecifically activated by cellular components, making it difficult to know if fluorescence signals derive from RNA–fluorophore complexes.8
A recent approach to overcome this problem uses RNA aptamers that bind and induce the fluorescence of fluorophores resembling the one that is found in GFP.8 The GFP fluorophore, 4-hydroxybenzylidene-imidazolinone (HBI), is nonfluorescent in solution, but is highly fluorescent within the folded protein.9,10 Using SELEX (Systematic Evolution of Ligands by Exponential Enrichment), we generated RNA aptamers that mimic GFP by specifically binding GFP-like fluorophores and switching on their fluorescence.8 The brightest of these RNAs is Spinach, which binds (Z)-4-(3,5-difluoro-4-hydroxybenzylidene)-1,2-dimethyl-1H-imidazol-5(4H)-one (DFHBI), a structural mimic of HBI. Because DFHBI exhibits low background fluorescence when incubated with cells, fluorescence signals are readily attributable to Spinach–DFHBI complexes. Tagging RNAs with Spinach has provided insights into the dynamics of RNA localization in cells.8,11
Spinach has been used in diverse ways to link signaling and conformational events to fluorescence readouts. In addition to imaging RNA in cells, Spinach has been fashioned into small-molecule sensors,12−14 and has been used to monitor transcription in vitro and in vivo in real time.15,16 Because of the usefulness of Spinach, a major goal is to identify new RNA aptamers with increased fluorescence and which provide alternative sequences that can be used to design novel RNA-based imaging tools.
A major challenge with aptamers is that they typically function poorly in cells. This can be due to susceptibility to RNA degradation or due to poor intracellular folding. Impaired folding can be due to many causes, including the presence of competing folding pathways, as well as thermal instability, or dependence on ion concentrations that are not normally found in cells.11,17 Additionally, sequences adjacent to an aptamer can interfere with aptamer folding.11,18 The importance of folding is further supported by our systematic mutagenesis of Spinach which resulted in Spinach2, which exhibits improved cellular performance due to enhanced folding.11 Thus, a major drawback of SELEX is that the selected RNAs often need extensive mutagenesis in order for the aptamer to fold and function in the cellular environment.
An additional problem is that SELEX is inefficient in generating RNA aptamers that switch on the fluorescence of GFP-like and other fluorophores. In our original screen, we found numerous RNAs that bind DFHBI with submicromolar affinity, but <1% activated the fluorescence of DFHBI.8 Extensive screening was required to identify Spinach from among the RNAs in the DFHBI-binding aptamer pool. Thus, only a limited number of RNAs can bind DFHBI in a way that induces its fluorescence. These data suggest that selecting RNAs simply on the basis of their ability to bind fluorophores is inefficient.
Here we describe a SELEX protocol that simplifies the generation of RNA–fluorophore complexes and produces aptamers that are highly compatible with cellular expression. This protocol initially relies on standard SELEX using bead-bound fluorophores for aptamer selection, but then switches to screening based on fluorescence by expression of RNAs in Escherichia coli (E. coli) followed by fluorescence-activated cell sorting (FACS). This allows aptamers to be selected on the basis of their ability to induce the fluorescence of fluorophores, as well as their ability to function in a cellular milieu. Aptamers of interest are subsequently optimized using a “directed evolution” approach using random libraries that are designed to resemble the parent aptamer. These libraries are again screened for brightness in E. coli using FACS.
We used this approach to develop Broccoli, a 49-nt-long aptamer that is substantially shorter than Spinach and Spinach2 and exhibits bright green fluorescence upon binding DFHBI or the improved version of this fluorophore, (Z)-4-(3,5-difluoro-4-hydroxybenzylidene)-2-methyl-1-(2,2,2-trifluoroethyl)-1H-imidazol-5(4H)-one) (DFHBI-1T).19In vitro Broccoli exhibits a similar high folding efficiency as Spinach2, but exhibits markedly lower dependence on magnesium for folding and increased thermostability. We show that the reduced magnesium dependence contributes to a nearly 100% increase in brightness in E. coli and allows robust imaging of tagged RNA in mammalian cells without the need for additional magnesium in media. Additionally, unlike Spinach2, Broccoli does not require the use of a tRNA scaffold to promote its folding in vivo. Thus, selection of aptamers in living cells results in variants that exhibit properties allowing them to function well in cells without the need for extensive in vitro mutagenesis.
Results
Rapid Identification of Novel RNA–Fluorophore Complexes Using FACS
A challenge with developing RNA–fluorophore complexes is that they are selected on the basis of their ability to bind fluorophores, not on the basis of their ability to activate their fluorescence. As we noted above, in our previous SELEX we identified only few fluorescent aptamers from the large pool of DFHBI binders.8 This likely reflects a requirement for a specific binding mode, rather than high affinity, in order to induce fluorescence.
An additional problem with selecting aptamers on the basis of binding is that an aptamer that is highly efficient at activating fluorescence may be lost during selection. This can occur because the aptamer might have a lower binding affinity than another aptamer, which may be inefficient at activating fluorescence. Studies that have characterized aptamer populations during SELEX have shown that certain aptamers begin to predominate during later rounds, largely based on their affinity for the ligand, as well as their ability to be reverse transcribed and PCR amplified.20 Other aptamers with equal or lower affinity are lost during earlier rounds of selection.21 Since many of these RNAs may be highly effective at activating fluorescence, desirable aptamers can be lost during the multiple rounds of SELEX.
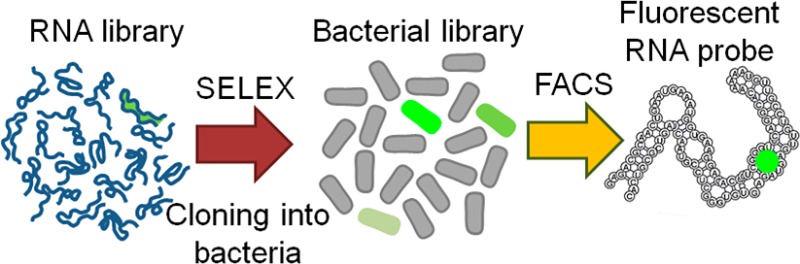
In order to overcome these problems, we developed a selection approach which is based both on binding and fluorescence activation (Figure 1a). In this approach, we perform 4–6 rounds of SELEX using a random library containing ∼1014 library members. After each round, the RNA pool is tested for RNA-induced fluorescence. As we described previously, this is typically seen after the fourth or sixth round of SELEX.8 Previous studies of combinatorial SELEX libraries have shown that the library pools typically retain considerable diversity at these early rounds of SELEX.20 At this point, the RNA pool is reverse transcribed and cloned into bacterial expression plasmid (Figure S1, Supporting Information (SI)) to prepare an aptamer expression library. In this library, the aptamer is cloned so that it is transcribed fused to the tRNALys3, an aptamer-folding scaffold23 that we previously used with Spinach and Spinach2.8,11
Figure 1.
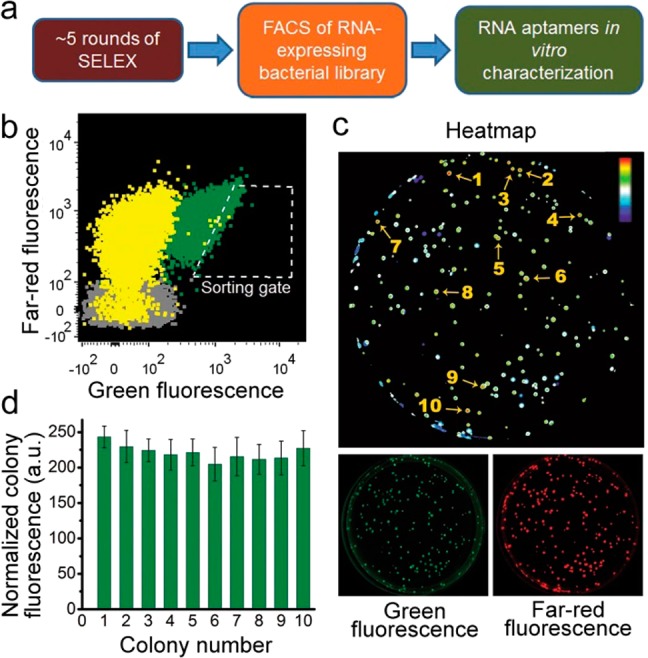
Combined SELEX-FACS approach for rapid selection of RNA–fluorophore complexes from random libraries. (a) Schematic representation of the combined SELEX-FACS approach. SELEX is performed using a random library containing ∼1014 RNAs. SELEX is performed until the first round when the RNA pool begins to exhibit fluorescence upon incubation with the fluorophore. The RNAs are reverse-transcribed and cloned into a bacterial expression plasmid. The library is transformed into E. coli and the transformants are screened by FACS in the presence of DFHBI. This screening approach selects RNAs based exclusively on their in vivo fluorescence. (b) FACS dot plot showing the fluorescence distribution of E. coli transformed with a library containing the RNA pool from round six of SELEX. In this experiment, E. coli expressing the SELEX round 6 RNA library (yellow population) was preincubated with 40 μM DFHBI and then sorted using the indicated gate. The position of each dot reflects RNA fluorescence (x-axis) and the overall expression level of the plasmid indicated by the far-red fluorescence of eqFP670 (y-axis). E. coli expressing either Spinach (green) or no aptamer (gray) were used as controls. As can be seen, a fraction of the library-expressing bacteria exhibit fluorescence comparable to that seen in Spinach-expressing E. coli. (c) Screening of aptamer-expressing E. coli on DFHBI-agar plates. FACS isolated cells were plated on LB-agar plates. The next day resulted colonies were induced with IPTG and the dishes were treated with DFHBI to a final concentration of 1 mM and 40 μM, respectively. The plates were imaged using a BioRad ChemiDoc MP imager 4 h later. Fluorescence of the RNA–DFHBI complexes in the colonies was detected using ex = 470 ± 30 nm, em = 532 ± 28 nm. The expression of eqFP670 was detected using ex = 630 ± 30 nm, em = 697 ± 55 nm. The resulting images were processed in Fiji22 to normalize green fluorescence to the far-red fluorescence to control for variations in colony size and expression level. A heat map representation of the normalized image facilitates identification of the most promising mutants (numbered). (d) Identification of colonies with highest normalized fluorescence. Shown are the colonies from panel c that exhibited the highest fluorescence after normalization for eqFP670 expression. The signal from cells transformed with the empty vector was used to define the background and was subtracted in order to define aptamer-specific fluorescence. Clone 29-1 was chosen for further optimization on the basis of its marginally higher brightness in bacteria. Error bars indicate standard deviations (n = 3).
After transformation of the library into E. coli and transcription induction, bacteria are then sorted by FACS in the presence of the fluorophore in order to identify the aptamers that exhibit the highest fluorescence. The plasmid also contains a separate promoter for expressing a far-red fluorescent protein eqFP670,24 which allows the aptamer fluorescence to be normalized to cell volume. Sorted bacteria are grown on agar dishes and imaged in the presence of the fluorophore. Plasmid DNA from the brightest colonies is isolated, sequenced and transcribed into RNA for further characterization (Figure 1a).
Overall, the protocol described above offers a rapid and efficient way to isolate fluorescent aptamers from the large initial random library.
Selection of Fluorescent RNA–DFHBI Complexes in E. coli
We applied this protocol using a library containing 52 random nucleotides (nt’s).8 Fluorescence was detected after the sixth round of SELEX (Figure S2 (SI)), and the RNA pool was then screened in E. coli by FACS, as described above. Sorting was performed at 37 °C to ensure that aptamers that are thermostable at this temperature are selected. E. coli expressing Spinach was used as a positive control. As evidenced from the FACS dot plot (Figure 1b), the vast majority of transformants had minimal green fluorescence, similar to the empty vector-transformed E. coli. However, a small number of transformants exhibited similar or higher fluorescence than the mean fluorescence of the Spinach-expressing population (Figure 1b). Analysis of the sorted bacterial colonies on agar plates showed that more than 80% of them exhibited fluorescence higher than the background level (Figure 1c).
Sequencing analysis revealed numerous aptamers that conferred fluorescence to E. coli, with most aptamers falling into a few distinct families. The brightest clones (Figure 1d) belonged to one family, each being different by only few mutations. Alignment and mFold predicted secondary structures of three of them, 29-1, 29-2, and 29-3, are presented in Figure S3 (SI). Other aptamers, including 30-1 and 31-1, were dimmer in vivo and did not exhibit obvious sequence or predicted structural similarity to the 29-n family. Thus, this screening approach can identify distinct aptamers capable of switching on DFHBI fluorescence after only a few rounds of selection.
Initial Characterization of 29-1 and Comparison with Spinach
We next sought to further characterize 29-1 since it exhibited the highest colony fluorescence (Figure 1d). Sequence analysis of this clone indicated that it is a 99-nt-long RNA. As with Spinach, 30-1, and 31-1, all the 29-n family members contain the constant regions that are present in the parent library. However, a fixed stem-loop that was inserted in the middle of the library (Figure S3) was lost in the 29-n clones, but remained in Spinach, 30-1, and 31-1. Interesting, portions of the 29-n random domain have regions of similarity to Spinach, while other regions do not (Figure S3). Thus, 29-1 appears to have convergently evolved certain Spinach-like sequences. Such convergent evolution has been previously demonstrated for adenosine RNA aptamers.25 Numerous independent SELEX screenings for adenosine-containing molecules resulted in a recurrent motif suggesting that it may be an optimal sequence for adenosine binding.25
To measure the fluorescence of aptamer–fluorophore complexes, we use an approach that overcomes potential confounding effects of incomplete RNA folding. The fluorescence of RNA–fluorophore complexes can be measured in either of two ways: using “excess RNA” or “excess fluorophore”.23 In an “excess RNA” experiment we add enough RNA to ensure that all the fluorophore (e.g., 1 μM) is bound to the RNA even if a sizable portion of the RNA is unfolded. As a result, we can be confident that we have 1 μM RNA–fluorophore complex, and we can therefore calculate the “molar brightness”, i.e., the fluorescence of a specific concentration of RNA–fluorophore complex independent of RNA folding. In the case of an “excess fluorophore” experiment, we reverse the experimental conditions by using 1 μM RNA and excess fluorophore. In this case, the amount of RNA–fluorophore complex is highly dependent on the amount of RNA that is folded. Indeed, by comparing the fluorescence measured using excess RNA and excess fluorophore, we can estimate the percent of RNA that is folded (see Methods (SI) and ref (11) for more details).
We characterized the fluorescence of 29-1 bound to DFHBI and DHBI-1T. DFHBI-1T is a recently developed DFHBI-derived fluorophore with higher extinction coefficient, lower background fluorescence in cells, and a red-shifted excitation and emission spectra that matches commonly used filter cubes.19 29-1 induced the fluorescence of both DFHBI (ex = 450 nm, em = 501 nm) and DFHBI-1T (ex = 472 nm, em = 507 nm) (Figure S4a (SI)). The overall molar fluorescence was similar to that seen with Spinach2 (Figure S4b)). Because of the increased fluorescence seen with DFHBI-1T, this fluorophore was used for all subsequent experiments.
Taken together, these data show that 29-1 exhibits high fluorescence both in vivo and in vitro. Because of its high fluorescence, we chose to use 29-1 to test and optimize our directed evolution approach (described below), which is designed to convert “aptamer hits” into aptamers with optimized cellular performance.
Identification of a Core Sequence in 29-1 That Is Sufficient for Inducing DFHBI-1T Fluorescence
We first asked if there is a minimal sequence element that mediates the ability of 29-1 to induce DFHBI-1T fluorescence. The structure of 29-1 predicted by mFold26 is a long hairpin structure interrupted by several loops and bulges (Figure 2a). The first truncation mutant (29-1-T1) lacking the first eight predicted base pairs and the first large loop retained fluorescence. Further reduction of the stem generated 29-1-T2, which also retained the ability to induce DFHBI-1T fluorescence. Subsequent removal of additional base pairs (29-1-T3) abolished the ability of the aptamer to induce DFHBI-1T fluorescence. An additional aptamer missing the terminal hairpin (29-1-T4) was also incapable of inducing DFHBI-1T fluorescence, indicating that this terminal structure was required for fluorescence. Thus, truncation analysis identified 29-1-T2, a 56-nt-long aptamer that retains the ability to induce DFHBI-1T fluorescence (Figure 2 and Figure S5a,b (SI)).
Figure 2.

Truncation analysis of 29-1 identifies core domain responsible for fluorescence activation. The mFold-predicted secondary structure of 29-1 is presented. The borders of three truncations (T1, T2, T3, and T4) are indicated. Only T1 and T2 were able to induce fluorescence of DFHBI-1T (indicated with a green circle compared to a black, i.e., nonfluorescent circle) as measured under excess RNA conditions.
We next compared the folding of 29-1-T2 and 29-1. Using the folding assay described above, we found that 29-1-T2 was 45% folded, while 29-1 was 81% folded. Therefore 29-1-T2 folding is impaired, although its molar brightness remained the same (Figure S5a,c).
Because 29-1-T2 has impaired folding in vitro, we asked if 29-1-T2 has impaired fluorescence in cells. To test this, we compared the fluorescence of colonies expressing 29-1 and 29-1-T2 grown on LB-DFHBI-1T agar plates. In these experiments, we found that colonies expressing 29-1-T2 were significantly less bright than colonies expressing 29-1, despite the fact that this truncation mutant was expressed within a tRNA scaffold (Figure S5d). These data confirm that 29-1-T2 is a poor folder, which leads to low fluorescence in cells.
Directed Evolution of 29-1-T2 Generates Broccoli, an RNA–Fluorophore Complex Optimized for Cellular Performance
Although 29-1-T2 has reduced overall fluorescence in cells, its small size is potentially advantageous. Smaller aptamers may be less likely to impair the function of the RNA to which it is attached.
Therefore, we sought to use a directed evolution to improve the cellular performance of 29-1-T2. We developed a strategy for directed evolution of aptamers that exhibit fluorescence in E. coli (Figure 3a). For these experiments, we created a library of 29-1-T2 mutants using a “doping” strategy similar to the mutagenesis approach originally described by Bartel et al.27 Briefly, a DNA library is synthesized so that each encoded aptamer resembles the parent aptamer, however every nucleotide has a certain and controlled probability of being converted into one of the other three nucleotides (see Methods and Figure S6 (SI)). This probability is mathematically predicted initially so that the DNA library has all possible combinations of mutations that differ from the parent aptamer by 1, 2, 3, 4, 5, 6, 7, or 8 mutations (Figure S6). This provides a highly efficient way of testing every possible mutant that has a similar overall sequence to the parent aptamer.
Figure 3.

Additional round of directed evolution rescues diminished fluorescence of 29-1-T2. (a) Schematic representation of the fluorescent RNA aptamers directed evolution approach. (b) FACS dot plot of 29-1-T2 doped library in bacteria. Bacterial cells expressing this library or positive and negative control were preincubated with 40 μM DFHBI-1T and then FACS sorted. Negative bacterial population is dark gray (behind yellow), doped library expressing bacteria is yellow, and 29-1-expressing cells, used as a positive control, are dark green. Again, bacterial cells having the brightest fluorescent signal were isolated on the basis of the gate presented. This time dot plot is presented as green fluorescence vs side scatter, the latter was also used to exclude those negative cells which are bright owing to their increased size. (c) Bar graph of the normalized brightness of bacterial colonies of the winning clones in comparison with the original 29-1 and 29-1-T2. To assess sorted mutants’ performance in vivo, we expressed them in bacterial cells and measured fluorescent signal of bacterial colonies growing on agar dish supplemented with 40 μM DFHBI-1T. The signal from the empty-vector transformed cells was used as a background and subtracted. These data demonstrate successful restoration of the truncated aptamers’ brightness as evidenced by very similar signal of 29-1-3 compared to 29-1. Error bars indicated standard deviations (n = 3). (d) Alignment of the sequences of the brightest mutants from the doped 29-1-T2 library screening. The proposed mutation-tolerant (variable) and mutation-intolerant (conserved) regions are highlighted. Parent is the sequence that was subjected to doping. Green indicates conservative bases (or equivalent substitutions) participating in base pairing. Blue indicates conservative bases in bulges. Yellow indicates highly variable terminal stem-loop with the stabilized tetraloops in bold. Non-colored bases are mutations which prevent otherwise conservative base pairing or which are substitutions in conservative bulges.
The first step is to transcribe the library to RNA and subject it to three rounds of SELEX to remove any mutant aptamers that do not bind the fluorophore. The RNA pool is then cloned into a bacterial expression library, transformed into E. coli, and screened by FACS as described above.
After the first round of directed evolution of the 56-nt-long 29-1-3 aptamer, several clones were identified with markedly improved colony brightness (Figure 3b,c). Many of these clones exhibited brightness that approached the level of 29-1 (Figure 3c). The majority of the sequence was the same in all the clones, except for an 11-nt domain which constitutes the terminal stem-loop (see structure in Figure 2). Analysis of this region revealed that most of the improved variants acquired mutations stabilizing this terminal stem-loop either by enhanced base-pairing or by introduction of the stable tetraloop GAAA.28 This suggests that specific terminal stem-loop sequences improve aptamer folding in vivo.
Comparison of the sequences also identified distinct domains that appeared to be highly tolerant of mutations, and therefore seem unlikely to have a role in binding the fluorophore (Figure 3d). To test this, we focused on 29-1-3, which showed in vivo brightness compared to 29-1 (Figure 3c and Figure S7a (SI)). To test the prediction that the terminal stem-loop was tolerant of mutations, we introduced mutations in this region (Figure S7a). These were highly tolerated, and support the idea that this region forms a stem-loop (Figure S7a,b). To further confirm this, we converted the predicted terminal 4-nt loop to UUCG, a tetraloop that confers stability to hairpin structures.28 Additionally, an adjacent U predicted to form a bulge in the stem was removed to form an uninterrupted stem and the stem itself was shortened. These mutations had minimal impact on fluorescence. Similarly, removal of the 4-bp long stem at the base of the aptamer did not impair its fluorescence, presumably because the tRNA scaffold used for aptamer expression conferred the structural stability needed for aptamer function (Figure S7a,b). Thus, directed evolution produces distinct aptamers that can be used to predict domains that can be modified or mutated without impairing fluorescence of the aptamer–fluorophore complex.
We next asked if the regions that were conserved among the different directed evolution clones were intolerant of mutation. Indeed, mutations elsewhere in the sequence typically exhibited markedly reduced fluorescence, including mutation of a series of G residues (Figure S7a,b). In the vast majority of cases, these mutations were not tolerated. Thus, these residues likely have an essential role in the aptamer binding to the fluorophore. Overall, analysis of the clones from directed evolution can predict functionally important domains in the aptamers.
We decided to combine the mutations that shorten the aptamer while preserving its fluorescence. This generated 29-1-3-1. This aptamer exhibited similar overall colony fluorescence as 29-1 (Figure S7c). Comparison of in vitro folding of 29-1-3-1 indicates that it exhibits 80% folding relative to 29-1 (Figure S7b).
We next subjected 29-1-3-1 to an additional round of directed evolution and compared the in vivo brightness of the top sorted clones (Figure S8 (SI)). Among them, none showed significantly increased colony fluorescence compared to 29-1-3-1. We therefore stopped the evolution and designated 29-1-3-1 Broccoli (Figure 4 and Figure S9a (SI)).
Figure 4.
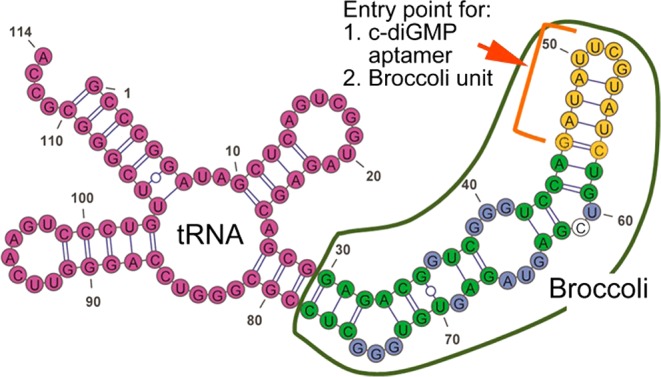
mFold prediction of the secondary structure of Broccoli (circled with green) fused to tRNA (red). For comparison purposes the color coding of nucleotides is the same as in Figure 3d. Green indicates conservative bases (or equivalent substitutions) participating in base pairing. Blue indicates conservative bases in bulges. Yellow in this structure indicates reengineered terminal stem-loop. The non-colored base is a mutation in a conservative bulge. Either a small-molecule aptamer or another Broccoli unit (without tRNA) can be inserted in place of the indicated stem-loop.
Development of Dimeric Broccoli by Modification of the Terminal Stem-Loop of Broccoli
Analysis of the predicted secondary structure of tBroccoli (Broccoli with the tRNA scaffold, Figure 4), the directed evolution experiment, and the mutagenesis experiments suggest that the terminal stem-loop, marked in yellow, serves a structural role. To further test this, we asked if a small-molecule-binding aptamer can be inserted into this site. We and others previously inserted small-molecule- and protein-binding aptamers into structural domains in Spinach, which resulted in Spinach aptamers with sensor functionality.12−14
To test this idea, we inserted the cyclic diGMP-binding aptamer14 into the stem region of tBroccoli (Figures 4a and S9b). The resulting construct exhibited significantly increased fluorescence upon addition of 500 nM c-diGMP (Figure S10 (SI)).
Next, we asked if we could insert a second Broccoli aptamer into the Broccoli terminal stem (Figures 4, 5a, and S9c). This dimeric Broccoli (dBroccoli) exhibits almost twice the fluorescence as the monomeric Broccoli, as demonstrated by comparing 1 pmol of in vitro transcribed tBroccoli and tdBroccoli (dBroccoli in tRNA scaffold) in polyacrylamide gel electrophoresis (PAGE) gel (Figure 5b). In these experiments, the gel is first stained with DFHBI-1T to detect the size and fluorescence of RNA–DFHBI-1T complexes, and next with SYBR Gold to detect all RNA and quantify the RNA amount.
Figure 5.
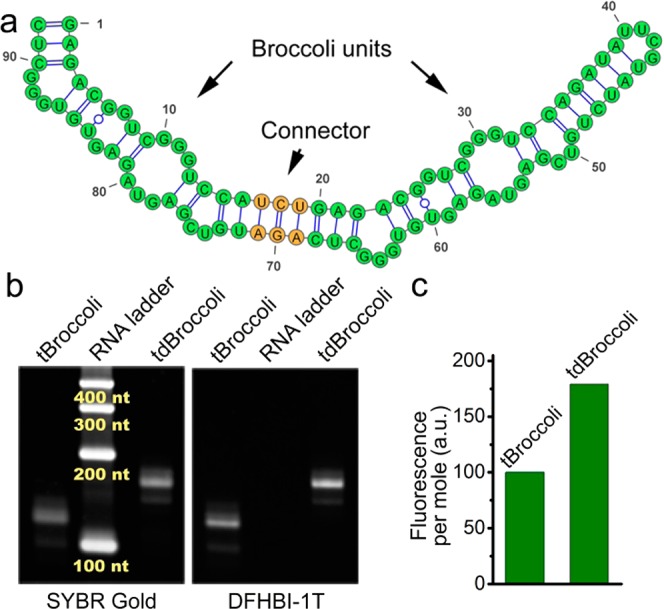
Designing dimeric Broccoli. (a) mFold prediction of the secondary structure of dimeric Broccoli (dBroccoli). For simplicity no tRNA scaffold is drawn. Green color indicates the individual Broccoli units, yellow denotes the connector stem. (b) Dimeric Broccoli (tdBroccoli) is almost twice as bright as Broccoli (tBroccoli). To compare the in vitro performance of tBroccoli and tdBroccoli we ran them on a urea-PAGE gel, washed the gel in water to remove urea, and then allowed the aptamers to fold in the gel. The gel was stained with DFHBI-1T to visualize the aptamers. Afterward, the gel was stained with SYBR Gold to quantify the RNA. (d) Quantification of the DFHBI-1T-stained band fluorescence shown in panel b demonstrates that tdBroccoli is ∼1.8 fold brighter than tBroccoli. Band fluorescence was normalized to the RNA amount and the molecular weight to account for the different sizes of tBroccoli and tdBrococoli.
These experiments indicate that tdBroccoli provides nearly twice the fluorescence as tBroccoli (Figure 5c) and that dBroccoli can potentially serve as an enhanced tag for in vivo imaging.
Characterization of the Spectral Properties and Folding of Broccoli–DFHBI-1T
We next compared the fluorescence properties of tBroccoli-DFHBI-1T and tSpinach2-DFHBI-1T. The overall spectral properties and fluorophore-binding characteristics were very similar (Figure 6a–c and summarized in Table 1).
Figure 6.

In vitro comparison of Broccoli and Spinach2. (a) Excitation and emission spectra of tBroccoli. Spectra were measured using 20 μM RNA and 2 μM DFHBI-1T. (b) Absorbance spectra of DFHBI-1T alone and in complex with tBroccoli show a red-shift similar to that previously observed for Spinach-DFHBI;8 here, 50 μM RNA was preincubated with 5 μM fluorophore, and the spectrum was compared to that of the fluorophore alone. (c) Dissociation constant of tBroccoli. To calculate the dissociation constant we performed a titration of 50 nM RNA with increasing concentration of DFHBI-1T and then fitted the resulting data points using the Hill equation as described previously.8,19 Error bars indicate standard deviations (n = 3). (d) Folding of tBroccoli and Broccoli in the context of different flanking sequences. tSpinach and tSpinach2 data were taken from ref (11). (e) Magnesium dependence of tBroccoli and tSpinach2. To measure magnesium dependence, 1 μM RNA was mixed with 10 μM DFHBI-1T and the fluorescence signal of the complex was measured at different concentrations of MgCl2. The signal at 1 mM MgCl2 for both aptamers was set to 100. Error bars indicated standard deviations (n = 3). (f) tBroccoli demonstrates higher thermostability compared to tSpinach2. To measure temperature dependence of tBroccoli and tSpinach2 fluorescence we followed fluorescent signal decay of 1 μM RNA and 10 μM fluorophore upon gradually increasing temperature.
Table 1. Photophysical and Biochemical Properties of Broccoli–DFHBI-1T Compared to Spinach2–DFHBI-1Ta.
| max abs (nm) | max ex (nm) | max em (nm) | extinction coefficient (M–1 cm–1) | quantum yield | brightness | KD (nM) | Tm (°C) | |
|---|---|---|---|---|---|---|---|---|
| DFHBI-1T | 423 | 426 | 495 | 35 400 | 0.00098 | 0.12 | ||
| Broccoli–DFHBI-1T | 469 | 472 | 507 | 29 600 | 0.94 | 96 | 360 | 48 |
| Spinach2–DFHBI-1T | 470 | 482 | 505 | 31 000 | 0.94 | 100 | 560 | 37 |
Spinach2–DFHBI-1T and DFHBI-1T properties are taken from ref (19).
We and others previously showed that increased in vitro folding, especially folding in the presence of flanking sequences, correlates with improved performance in vivo.11,18 Therefore, we measured the percentage of folded tBroccoli alone and in the context of various flanking sequences (Figure 6d). tBroccoli demonstrated folding efficiency of ∼60%, which is similar to tSpinach2.27 Importantly, tBroccoli folding was unaffected by fusing it to the 3′ end of the 5S RNA, or by placing it between 50-nt-long flanking sequences derived from the human β-actin 3′ untranslated region.
We next tested if Broccoli without the tRNA scaffold can fold and tolerate flanking sequences. Indeed, adding human β-actin flanking sequences to Broccoli does not prevent Broccoli from folding (Figure 6d). This suggests that Broccoli can be used without tRNA in vivo.
Broccoli Exhibits Higher Thermostability and Lower Dependence on Magnesium for Fluorescence than Spinach2
We next compared the magnesium dependence of Broccoli- and Spinach2-induced fluorescence. The total intracellular magnesium concentration has been measured in diverse cell types to be between 17 and 20 mM.29 However, the majority of cellular magnesium is bound to phospholipids, nucleotides, proteins, and nucleic acids.29 As a result, the amount of free magnesium was estimated to be in the range of 0.25–1 mM.30 Thus, it is desirable to have aptamers that are not dependent on high concentrations of magnesium for fluorescence. In our experiments, magnesium levels were reduced during later stages of SELEX (see Methods), and FACS was performed in media lacking magnesium to bias selection toward aptamers with low magnesium dependence for folding. Thus, our combined SELEX-FACS selection protocol is predicted to produce aptamers with lower dependence on magnesium for fluorescence.
Indeed, in magnesium-free buffers, Broccoli–DFHBI-1T exhibits 61% of its maximal fluorescence. In contrast, Spinach2 exhibits only 11% of its maximal fluorescence in magnesium-free conditions. A magnesium titration shows that Broccoli is markedly less dependent on magnesium and exhibits maximal fluorescence at ∼300 μM, while Spinach2 exhibits 50% maximal fluorescence at ∼300 μM, with maximal fluorescence at ∼1 mM (Figure 6e). Thus, Broccoli exhibits markedly reduced magnesium dependence compared to Spinach2, which could result in enhanced performance in vivo.
We next measured the thermal stability of Broccoli. We have previously shown that improved aptamer thermostability correlates with better performance for imaging at 37 °C.11 Spinach2 contains a series of mutations that increase its thermal stability and contribute to its overall improve of performance in cells.11 Consistent with our previous studies, Spinach2-DFHBI-1T exhibited a Tm of ∼37 °C. However, thermal denaturation of Broccoli-DFHBI-1T showed a noticeably increased Tm of ∼48 °C (Figure 6e and Table 1). Taken together, these data suggest that Broccoli exhibits several improved characteristics that may be useful for cellular imaging.
Enhanced Fluorescence of Broccoli-Tagged RNA in Bacteria
We next monitored Broccoli fluorescence in living cells. We first imaged Broccoli in E. coli. Broccoli, dBroccoli, and Spinach2 were expressed in E. coli as tRNA fusions. tSpinach2-expressing cells exhibited significantly increased fluorescence above the level seen in control transformed cells (Figure 7a,b). Importantly, tBroccoli-expressing cells were approximately twice as fluorescent as tSpinach2-expressing cells. Cells expressing dimeric Broccoli were more than twice as fluorescent as cells expressing Broccoli.
Figure 7.
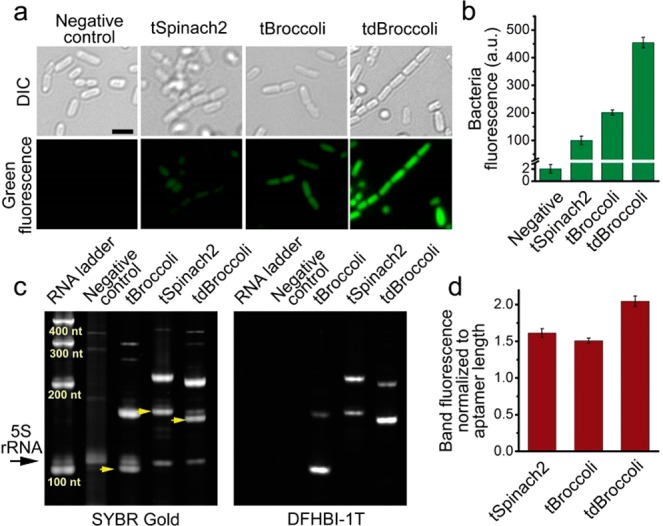
tBroccoli and tdBroccoli show substantially improved performance in bacteria compared to tSpinach2. (a) Microphotographs of bacteria expressing tSpinach2, tBroccoli, and tdBroccoli. Respective aptamers were expressed in E. coli and then bacterial cells were attached to poly d-lysine coated glass-bottom dishes, preincubated with 200 μM DFHBI-1T and imaged under the fluorescent microscope. In these experiments, imaging was performed for 100 ms and the brightness of the images was adjusted on the basis of the high fluorescence signal of tdBroccoli, which results in lower signals for the other aptamers. Cells were imaged in PBS, which lacks magnesium. Here and in other panels, “Negative control” is the empty vector-transformed cells. Scale bar, 2 μm. (b) Quantification of fluorescence signal from bacterial cells in panel a, as measured in suspension on a plate reader. Error bars indicate standard deviations (n = 3). (c) tBroccoli, tSpinach2, and tdBroccoli are expressed at similar levels in bacterial cells. Total RNA from the cells from panels a and b was fractionated on urea-PAGE and stained with DFHBI-1T and SYBR Gold. tBroccoli, tSpinach2 and tdBroccoli RNA bands are indicated with yellow arrows. Higher molecular weight bands are unprocessed transcripts. 5S indicated with the black arrow was used as a loading normalization control. (d) Quantification of the intensity of the SYBR Gold-stained bands from the panel c. Sum of both processed and unprocessed RNA band intensity was normalized to aptamer length. Gel image processing was performed in Image Lab 5.0 software (BioRad). Error bars indicate standard deviations (n = 3).
We next normalized the fluorescence intensity to aptamer expression in cells. To quantify RNA expression, we harvested cellular RNA and fractionated it using a 6% polyacrylamide denaturing gel. To visualize RNA in lanes gels were stained with SYBR Gold.31 The identity of the tBroccoli and tSpinach2 bands could be inferred because they are uniquely seen in transformed cells and not control cells (Figure 7c). Bacterial tRNA has been reported to undergo extensive processing upon transcription.32 Thus, lower molecular weight and higher molecular weight bands observed for each tRNA-fused aptamer are likely fully processed and unprocessed species, respectively. To confirm that these bands were indeed tBroccoli and tSpinach2, we stained the gels with DFHBI-1T. Gel staining with DFHBI-1T resulted in selective staining of Broccoli and Spinach2, with minimal background fluorescence of DFHBI-1T (Figure 7c, yellow arrows). Staining with SYBR Gold is more accurate than DFHBI-1T for quantifying the absolute amounts of different aptamers since the folding efficiency can be different between different aptamers.
Quantification of SYBR Gold-stained total bands intensity for both processed and unprocessed tRNA-aptamers showed that overall RNA expression was highly similar in tSpinach, tBroccoli, and tdBroccoli-expressing cells (Figure 7d). Thus, the increase in fluorescence seen in tBroccoli-expressing cells is unlikely to derive from increased Broccoli expression.
Since our in vitro studies showed a large difference in magnesium sensitivity, we asked if this could account for the reduced brightness of tSpinach2 in E. coli. To test this, we compared the fluorescence of the E. coli incubated in LB culture media with or without 20 mM MgCl2. After 1 h, the fluorescence of E. coli expressing tBroccoli increased by 36%, while the fluorescence of tSpinach2-expressing cells increased by 125% (Figure S11 (SI)). This substantially larger increase in tSpinach2 fluorescence suggests that the magnesium levels are insufficient for maximal tSpinach2 fluorescence in bacterial cells. Taken together, these experiments suggest that the reduced magnesium requirement for tBroccoli likely contributes to its improved performance in E. coli.
Broccoli Is an Enhanced Tag for Imaging RNA in Mammalian Cells
We next imaged tBroccoli in mammalian cells. Previously we imaged 5S, a noncoding RNA that associates with the ribosome and has additional functions in the cell.8 We followed the same strategy and fused tBroccoli or tdBroccoli to the 3′ terminus of 5S expressed from the pAV5S plasmid. The performance of these aptamers was compared to 5S-tSpinach2 in HEK293T cells.
In order to quantify the average brightness of the aptamers in cells, we first used flow cytometry. Transfected cells were analyzed in two channels: green (ex = 488 nm, em = 525 ± 50 nm) and red (ex = 561 nm, em = 610 ± 20). The latter channel was used to detect mCherry, which was used as a transfection control. As evidenced from Figure 8a, 5S-tBroccoli and 5S-tdBroccoli are clearly detectable in the green fluorescence channel. Calculation of the mean fluorescence intensity of the green population indicates that tdBroccoli is 70% brighter than tBroccoli (Figure S12 (SI)).
Figure 8.

Broccoli and dBroccoli are enhanced tRNA-independent tags for mammalian cell imaging. (a) Flow cytometry analysis of DFHBI-1T-treated HEK293T cells transfected with plasmids expressing 5S fused to aptamers in the tRNA scaffold. Untagged 5S was used as a negative control. mCherry expressed from another plasmid was used for assessing transfection efficiency. Transfected cells were analyzed in two channels: green (ex = 488 nm, em = 525 ± 50 nm) and red (ex = 561 nm, em = 610 ± 20). Where indicated, cells were also pretreated with 5 mM MgSO4. tSpinach2-induced fluorescence can only be observed upon magnesium treatment. (b) Fluorescent microscopy microphotographs of the cells from panel a. Cells were pretreated with 20 μM DFHBI-1T, 5 μg/mL Hoechst 33258, and 0.3 M sucrose and, where indicated, with 5 mM MgSO4. Exposure times are 0.5 s for the green fluorescence and 200 ms for mCherry and Hoechst. Scale bar, 10 μm. (c) Total RNA from the same transfected HEK293T cells was run on a urea-PAGE gel and stained with DFHBI-1T to reveal the aptamers. Gels were then subsequently stained with SYBR Gold to stain all RNA and allow RNA quantification. The same gel also shows total RNA from HEK293T cells expressing 5S fused to the aptamers without a tRNA scaffold. Endogenous 5S is used as a loading control. (d) Flow cytometry analysis of DFHBI-1T-treated HEK293T cells transfected with the plasmids expressing 5S fused to the aptamers without tRNA scaffold. Again, mCherry expression was used for transfection efficiency normalization and cells were analyzed in two channels: green (ex = 488 nm, em = 525 ± 50 nm) and red (ex = 561 nm, em = 610 ± 20). 5S-Spinach2 expressing cells were also tested in the presence of 5 mM MgSO4. No Spinach2 fluorescence is observed without a tRNA scaffold. (e) Fluorescent microscopy images of HEK293T cells expressing 5S-Broccoli or 5S-dBroccoli. Cells were pretreated with 20 μM DFHBI-1T and 0.3 M sucrose. Exposure time is 0.5 s. Scale bar, 10 μm.
We compared the fluorescence of tBroccoli-expressing cells to tSpinach2-expressing cells. The standard mammalian imaging protocol for Spinach2 uses magnesium-supplemented media.8,11 In the absence of additional magnesium, few fluorescent cells are seen (Figure 8a). Inclusion of 5 mM MgSO4 resulted in a population of green fluorescent cells, although the number of cells was noticeably smaller than tBroccoli-expressing cells (Figures 8a and S12). Notably, magnesium did not induce a substantial effect on the fluorescence of tBroccoli- and tdBroccoli-expressing cells (Figure 8a). Taken together, these results suggest that Broccoli does not require magnesium supplementation for imaging.
To confirm the flow cytometry data on a single cell level we imaged the same cells using widefield fluorescence microscopy. In order to unambiguously detect aptamer-tagged 5S-RNA, we treated the cells with 0.3 M sucrose, which induces RNA 5S granule formation.8 Sucrose treatment resulted in clearly visible cytoplasmic RNA foci in case of 5S-tBroccoli and 5S-tdBroccoli using media that had no added magnesium (Figure 8b). These foci were brighter than those detected in 5S-tSpinach2-expressing cells imaged in the presence of magnesium (Figure 8b).
Finally, we confirmed the expression in cells of the 5S-fused aptamers in the tRNA scaffold by extracting RNA from transfected HEK293T cells and subjecting it to PAGE (Figure 8c). As shown by gel staining with DFHBI-1T and then with SYBR Gold, all tRNA-fused aptamers are readily detectable, with 5S-tBroccoli being expressed at the highest level.
Broccoli Can Be Imaged without a tRNA Scaffold
Although a tRNA scaffold is often used to promote the folding of aptamers in vitro(33) and in vivo,23 tRNA-fused aptamers are recognized by cellular enzymes23 which in turn can potentially lead to undesirable processing. The tRNA scaffold is also large, which significantly increases the size of the aptamer tag when the tRNA is used. Thus, a tRNA-independent aptamer is desirable.
Since Broccoli demonstrated high folding efficiency without a tRNA scaffold in vitro (Figure 6d), we asked if tRNA was required for imaging Broccoli in mammalian cells. To test this, Broccoli and dBroccoli were fused to the 3′ terminus of 5S without tRNA and the resulting plasmids were transfected into HEK293T cells. Using flow cytometry, we found that both Broccoli and dBroccoli can be detected in cells (Figure 8d). Moreover, the average cellular brightness was higher than for 5S fused to tRNA-aptamer constructs (Figure S12). This supports the idea that the tRNA scaffold has a negative impact on RNA expression. Notably, 5S-Spinach2 lacking the tRNA scaffold did not show any bright events even at higher magnesium concentrations indicating that Spinach2 is dependent on the tRNA scaffold for folding in cells (Figure 8d).
We next confirmed the fluorescence of Broccoli- and dBroccoli-tagged RNA by fluorescence microscopy. As with the tRNA-tagged constructs, the constructs lacking tRNA were readily detectable in sucrose-treated cells (Figure 8e).
As a control, we monitored aptamer expression levels by harvesting cellular RNA and staining the PAGE-separated RNA with SYBR Gold and DFHBI-1T. These data showed that the 5S-aptamer fusions are expressed at comparable levels in HEK293T cells and at higher levels than when the tRNA scaffold is not present (Figure 8c). Taken together, these data show that Broccoli does not require a tRNA scaffold for efficient folding or cellular fluorescence.
Discussion
This manuscript presents a novel platform for isolating fluorescent “light up” aptamers that are compatible for cellular expression and intracellular imaging. We show that the process of selecting aptamers in cells results in rapid identification of aptamers that are highly optimized for folding in the cellular milieu. Using this platform, we identified Broccoli, which shows highly efficient cellular performance exceeding that of Spinach2. The folding properties of Broccoli support the idea that using in vivo selection produces aptamers suitable for cellular function.
SELEX is a problematic approach for generating fluorescent RNA–fluorophore complexes since the selection is based only on binding, not on fluorescence. Unlike Spinach, Broccoli was identified using a mixed SELEX-FACS approach in which SELEX was terminated early and the RNA pool was screened using FACS. Stopping SELEX early is important since valuable RNA–fluorophore complexes may be lost at later stages of SELEX. By screening aptamer pools at early rounds of SELEX, a larger pool of aptamers can evaluated for their fluorescence properties. Terminating SELEX early is also advantageous because it shortens the time needed for aptamer discovery.
In addition to simplifying SELEX, FACS-based screening provides an approach for directed evolution. Directed evolution allowed us to take the short 29-1 core sequence with reduced fluorescence and identify mutations that improve its folding so that it exhibited nearly identical fluorescence as 29-1. Directed evolution resulted in Broccoli, which has the same high folding efficiency in vitro as Spinach2, but is substantially shorter than Spinach or Spinach2, does not require tRNA for imaging, exhibits substantially improved thermostability, and does not require magnesium for imaging. It was notable that subsequent rounds of directed evolution did not substantially improve Broccoli. This may indicate that the high folding, extinction coefficient and quantum yield of Broccoli brought it nearly to its brightness limit. Conceivably FACS may not be sensitive enough to detect further subtle improvements in these parameters.
Cell-based screening provides a way to overcome aptamer misfolding. Aptamer misfolding is a major problem that limits the effectiveness of endogenously expressed aptamers, such as protein-inhibiting RNA aptamers developed by SELEX.18 We were able to take advantage of the fact that in our case properly folded aptamers produce a fluorescence signal that is detectable by FACS. By screening aptamers in living cells, aptamers that are positively or negatively influenced by ions and other cellular constituents can be readily discriminated. Overall, cell-based fluorescence screening overcomes the key challenges that limit the development of fluorescent aptamers for cellular RNA imaging.
Although our focus was on obtaining RNAs that fold well, RNAs that are selected by cell-based screening are likely to be resistant to RNA degradation. RNAs are often unstable in cells, which can reduce the overall effectiveness of RNA–fluorophore complexes. However, RNAs that are resistant to intracellular RNases and RNA degradation pathways will accumulate, resulting in a higher overall cellular fluorescence signal that can be detected by FACS. Thus, cell-based selection can also lead to aptamers that are more stable in cells.
Our data suggest that Broccoli has numerous advantages over Spinach2 for cellular imaging. Although both Spinach2 and Broccoli share certain sequence elements, other domains appear to confer improved imaging properties to Broccoli. This improvement mostly comes from the low magnesium dependence of Broccoli. Mammalian cell imaging with Spinach2 requires preincubation of cells in 5 mM magnesium. Since adding exogenous magnesium could influence cellular function, the use of Broccoli overcomes this potential problem. Additional factors, such as higher thermostability and higher expression level of Broccoli may also contribute to its improved performance in cells. These features appear to be a direct consequence of cell-based selection of Broccoli.
Another important property of Broccoli is its ability to fold without a tRNA scaffold. Even though the tRNA scaffold was shown to improve in vivo folding,23 its similarity to cellular tRNAs makes it prone to processing32 and thus can reduce cellular aptamer levels. Directed evolution likely selected for aptamers that have high folding, making the tRNA scaffold unnecessary.
A unique characteristic of Broccoli is its short size. Broccoli is 49 nt, which is shorter than the 96-nt-long Spinach2 and the 168-nt-long tSpinach2. The short size of Broccoli may improve its versatility for some RNAs that might not tolerate a large tag.
An important new imaging tag developed here is dBroccoli. dBroccoli was obtained following our examination of clones that were produced during directed evolution. These experiments suggested that the terminal stem was dispensable for fluorescence. We tested this by inserting a second Broccoli aptamer into this stem. The resulting dBroccoli is nearly twice as fluorescent as Broccoli. Notably, dBroccoli shares the same enhanced cellular performance and tRNA scaffold independence as Broccoli. Thus, Broccoli and dBroccoli are valuable imaging tags.
Although flow cytometry was used here to quantify cellular fluorescence, it is noteworthy that FACS is often used to study gene expression in cell populations.34 However, these experiments often rely on quantifying GFP, which is detected 10–30 min after gene transcription. The use of Broccoli, dBroccoli, and related RNA tags can be useful to obtain more direct and temporally accurate measurements of RNA levels and promoter activity.
Acknowledgments
We thank W. Song for synthesis of the fluorophores used in this study and, together with M. You and R. S. Strack, for useful comments and suggestions. We are also grateful to J. McCormick and S. Z. Merlin (Department of Pathology and Laboratory Medicine) for their help with flow cytometry. This work was supported by NIH grants to S.R.J. (R01 NS064516 and R01 EB010249).
Supporting Information Available
Methods section, and additional figures. This material is available free of charge via the Internet at http://pubs.acs.org.
The authors declare the following competing financial interest(s): S.R.J. and G.S.F. are authors of a patent application (provisional patent USPTO# 61/874,819) related to technology described in this paper.
Funding Statement
National Institutes of Health, United States
Supplementary Material
References
- Tyagi S. Nat. Methods 2009, 6, 331. [DOI] [PubMed] [Google Scholar]
- Bertrand E.; Chartrand P.; Schaefer M.; Shenoy S. M.; Singer R. H.; Long R. M. Mol. Cell 1998, 2, 437. [DOI] [PubMed] [Google Scholar]
- Rackham O.; Brown C. M. EMBO J. 2004, 23, 3346. [DOI] [PMC free article] [PubMed] [Google Scholar]
- Babendure J. R.; Adams S. R.; Tsien R. Y. J. Am. Chem. Soc. 2003, 125, 14716. [DOI] [PubMed] [Google Scholar]
- Constantin T. P.; Silva G. L.; Robertson K. L.; Hamilton T. P.; Fague K.; Waggoner A. S.; Armitage B. A. Org. Lett. 2008, 10, 1561. [DOI] [PubMed] [Google Scholar]
- Da Costa J. B.; Andreiev A. I.; Dieckmann T. Biochemistry 2013, 52, 6575. [DOI] [PubMed] [Google Scholar]
- Sando S.; Narita A.; Hayami M.; Aoyama Y. Chem. Commun. 2008, 3858. [DOI] [PubMed] [Google Scholar]
- Paige J. S.; Wu K. Y.; Jaffrey S. R. Science 2011, 333, 642. [DOI] [PMC free article] [PubMed] [Google Scholar]
- Ward W. W.; Bokman S. H. Biochemistry 1982, 21, 4535. [DOI] [PubMed] [Google Scholar]
- Niwa H.; Inouye S.; Hirano T.; Matsuno T.; Kojima S.; Kubota M.; Ohashi M.; Tsuji F. I. Proc. Natl. Acad. Sci. U.S.A. 1996, 93, 13617. [DOI] [PMC free article] [PubMed] [Google Scholar]
- Strack R. L.; Disney M. D.; Jaffrey S. R. Nat. Methods 2013, 10, 1219. [DOI] [PMC free article] [PubMed] [Google Scholar]
- Paige J. S.; Nguyen-Duc T.; Song W.; Jaffrey S. R. Science 2012, 335, 1194. [DOI] [PMC free article] [PubMed] [Google Scholar]
- Song W.; Strack R. L.; Jaffrey S. R. Nat. Methods 2013, 10, 873. [DOI] [PMC free article] [PubMed] [Google Scholar]
- Kellenberger C. A.; Wilson S. C.; Sales-Lee J.; Hammond M. C. J. Am. Chem. Soc. 2013, 135, 4906. [DOI] [PMC free article] [PubMed] [Google Scholar]
- Hofer K.; Langejurgen L. V.; Jaschke A. J. Am. Chem. Soc. 2013, 135, 13692. [DOI] [PubMed] [Google Scholar]
- Pothoulakis G.; Ceroni F.; Reeve B.; Ellis T. ACS Synth. Biol. 2014, 3, 182. [DOI] [PubMed] [Google Scholar]
- Wang S.; Zhao X.; Suran R.; Vogt V. M.; Lis J. T.; Shi H. Nucleic Acids Res. 2010, 38, e154. [DOI] [PMC free article] [PubMed] [Google Scholar]
- Martell R. E.; Nevins J. R.; Sullenger B. A. Mol. Ther. 2002, 6, 30. [DOI] [PubMed] [Google Scholar]
- Song W.; Strack R. L.; Svensen N.; Jaffrey S. R. J. Am. Chem. Soc. 2014, 136, 1198. [DOI] [PMC free article] [PubMed] [Google Scholar]
- Ameta S.; Winz M. L.; Previti C.; Jaschke A. Nucleic Acids Res. 2014, 42, 1303. [DOI] [PMC free article] [PubMed] [Google Scholar]
- Schutze T.; Wilhelm B.; Greiner N.; Braun H.; Peter F.; Morl M.; Erdmann V. A.; Lehrach H.; Konthur Z.; Menger M.; Arndt P. F.; Glokler J. PloS One 2011, 6, e29604. [DOI] [PMC free article] [PubMed] [Google Scholar]
- Schindelin J.; Arganda-Carreras I.; Frise E.; Kaynig V.; Longair M.; Pietzsch T.; Preibisch S.; Rueden C.; Saalfeld S.; Schmid B.; Tinevez J. Y.; White D. J.; Hartenstein V.; Eliceiri K.; Tomancak P.; Cardona A. Nat. Methods 2012, 9, 676. [DOI] [PMC free article] [PubMed] [Google Scholar]
- Ponchon L.; Dardel F. Nat. Methods 2007, 4, 571. [DOI] [PubMed] [Google Scholar]
- Shcherbo D.; Shemiakina I. I.; Ryabova A. V.; Luker K. E.; Schmidt B. T.; Souslova E. A.; Gorodnicheva T. V.; Strukova L.; Shidlovskiy K. M.; Britanova O. V.; Zaraisky A. G.; Lukyanov K. A.; Loschenov V. B.; Luker G. D.; Chudakov D. M. Nat. Methods 2010, 7, 827. [DOI] [PMC free article] [PubMed] [Google Scholar]
- Vu M. M.; Jameson N. E.; Masuda S. J.; Lin D.; Larralde-Ridaura R.; Luptak A. Chem. Biol. 2012, 19, 1247. [DOI] [PMC free article] [PubMed] [Google Scholar]
- Zuker M. Nucleic Acids Res. 2003, 31, 3406. [DOI] [PMC free article] [PubMed] [Google Scholar]
- Bartel D. P.; Zapp M. L.; Green M. R.; Szostak J. W. Cell 1991, 67, 529. [DOI] [PubMed] [Google Scholar]
- Heus H. A.; Pardi A. Science 1991, 253, 191. [DOI] [PubMed] [Google Scholar]
- Romani A. M. Metal Ions Life Sci. 2013, 12, 69. [DOI] [PubMed] [Google Scholar]
- Grubbs R. D. Biometals 2002, 15, 251. [DOI] [PubMed] [Google Scholar]
- Tuma R. S.; Beaudet M. P.; Jin X.; Jones L. J.; Cheung C. Y.; Yue S.; Singer V. L. Anal. Biochem. 1999, 268, 278. [DOI] [PubMed] [Google Scholar]
- Morl M.; Marchfelder A. EMBO Rep. 2001, 2, 17. [DOI] [PMC free article] [PubMed] [Google Scholar]
- Iioka H.; Loiselle D.; Haystead T. A.; Macara I. G. Nucleic Acids Res. 2011, 39, e53. [DOI] [PMC free article] [PubMed] [Google Scholar]
- Ducrest A. L.; Amacker M.; Lingner J.; Nabholz M. Nucleic Acids Res. 2002, 30, e65. [DOI] [PMC free article] [PubMed] [Google Scholar]
Associated Data
This section collects any data citations, data availability statements, or supplementary materials included in this article.