Abstract
The purpose of this study was to develop a clear aqueous mixed nanomicellar formulation (MNF) of dexamethasone utilizing both d-α-tocopherol polyethylene glycol-1000 succinate (Vit E TPGS) and octoxynol-40 (Oc-40). In this study, Vit E TPGS and Oc-40 are independent variables. Formulations were prepared following solvent evaporation method. A three level full-factorial design was applied to optimize the formulation based on entrapment efficiency, size, and polydispersity index (PDI). A specific blend of Vit E TPGS and Oc-40 at a particular wt% ratio (4.5:2.0) produced excellent drug entrapment, loading, small mixed nanomicellar size and narrow PDI. Solubility of DEX in MNF is improved by ~6.3-fold relative to normal aqueous solubility. Critical micellar concentration (CMC) for blend of polymers (4.5:2.0) was found to be lower (0.012 wt%) than the individual polymers (Vit E TPGS (0.025 wt%) and Oc-40 (0.107 wt%)). No significant effect on mixed nanomicellar size and PDI with one-factor or multi-factor interactions was observed. Qualitative 1H NMR studies confirmed absence of free drug in the outer aqueous MNF medium. MNF appeared to be highly stable. Cytotoxicity studies on rabbit primary corneal epithelial cells did not indicate any toxicity suggesting MNF of dexamethasone is safe and suitable for human topical ocular drops after further in vivo evaluations.
KEY WORDS: aqueous mixed nanomicelles, characterization, critical micellar concentration (CMC), dexamethasone, experimental design
INTRODUCTION
Dexamethasone (DEX), a glucocorticoid, is widely indicated as an anti-inflammatory and immunosuppressive drug (1) following cataract surgery or corneal procedure (2,3). DEX is also used in the treatment of posterior segment eye diseases such as uveitis and macular edema (4,5). It exerts anti-inflammatory activity by inhibiting multiple inflammatory cytokines (6,7). Additionally, DEX aids in lowering edema, fibrin deposition, retinal vein occlusion and migration of inflammatory cells (8–10). Conventional routes of drug administration such as oral or intravenous injections are known to cause gastric irritation and systemic toxicity at high doses or with chronic administration. To lower such adverse side effects, current research has been focused on local delivery of the drug. In this regard delivery systems including, but not limited to, microparticles (11), nanoparticles (12) and liposomes (13) are being studied following invasive mode of administration (intravitreal implants (14), intravitreal and peribulbar, subconjunctival injections) (15). However, none of the injectable strategies appears to be patient acceptable due to invasive methods including surgery, ocular injections for posterior segment disease treatment. Chronic treatment through these strategies is associated with side effects such as cataract progression, glaucoma, endophthalmitis, pseudoendophthalmitis, retinal detachment, hemorrhage, and elevated intraocular pressure (16–18). There is still an unmet need for development of an aqueous, clear topical drop formulation with prolonged release of DEX in therapeutic concentrations to ocular tissues. Amphiphilic polymers are useful in developing nanomicellar formulation. In the current study, we selected d-alpha tocopherol polyethylene glycol 1000 succinate (Vit E TPGS) and octoxynol-40 (Oc-40) as polymers.
Vit E TPGS is a safe and FDA approved water-soluble derivative of vitamin E. It is a nonionic polymer with a hydrophilic lipophilic balance (HLB index) of about 13 (19). It is generally added to lipid based drug delivery systems as a stabilizer. Oc-40 is a nonionic surfactant approved by FDA as a food additive and other pharmaceutical applications. Oc-40 (IGEPAL CA-897) has HLB index of about 18. Polymeric hydrophilic corona interacts with the external aqueous phase and prevents drug interaction with aqueous solution resulting in a stable aqueous solution. Also, the interaction between encapsulated drug and polymers may sustain drug release. Additionally, these polymer combinations may lower critical micellar concentration. This perfect blend of polymers is optimal to formulate concentrated aqueous DEX solution. The steroid is not very soluble in aqueous medium (159 μg/mL) with partition coefficient (log Ko/w) of 1.72 (20).
Amphiphilic nature of Vit. E TPGS and Oc-40 allows spontaneous formation of spherical nanomicelles with a hydrophobic interior and hydrophilic corona in aqueous milieu. It allows high concentrations of hydrophobic DEX to be incorporated into the micellar core. Therefore, the objective of this study was to optimize and develop a clear, stable, aqueous DEX-loaded mixed nanomicellar formulation (MNF) with full-factorial statistical design of experiments (DOE). Standard least square fit analysis was performed to identify the ideal polymeric blend to encapsulate DEX. Our method of DEX formulation preparation is simple, reproducible, easy to scale up for large-scale production (21) and most importantly minimizes drug loss in the manufacturing process.
MATERIALS AND METHODS
Materials
Dexamethasone and prednisolone were obtained from Tokyo chemical industry Co., Ltd, Japan. Vitamin E TPGS was purchased from Peboc division of Eastman Company, UK. Octoxynol-40 (Igepal) was obtained from Rhodio Inc., NJ, USA. HPLC grade methanol, acetonitrile, and dichloromethane were procured from Fisher Scientific, USA. Ethanol was purchased from Aaper alcohol and chemical Co., Shelbyville, KY, USA. Sodium phosphate monobasic and Sodium phosphate dibasic were purchased from Mallinckrodt, USA. Povidone K 90 (PVP-K-90, Kollidon® 90 F, Ph.Eur., USP) was purchased from Mutchler, Inc. Pharmaceutical ingredients, Harrington Park, NJ, USA.
Methods
HPLC Analysis
Analysis of DEX were performed by a reversed phase high performance liquid chromatography (RP-HPLC) method with a Waters 515 HPLC pump (Waters corporation, Milford, MA), Alcott autosampler (model 718 AL), Alcott 795 UV/Visible detector, Zorbax SB-phenyl column (5 μm, 25 × 4.6 mm) (Agilent Technologies, Santa Clara, CA) and Hewlett Packard HPLC integrator (Hewlett Packard, Palo Alto, CA). The mobile phase was comprised of acetonitrile (ACN), water and trifluoroacetic acid (TFA) (40:60:0.1% v/v), which was set at a flow rate of 1 mL/min. Detection wavelength was set at 254 nm. Calibration curve (0.5 to 1.5 μg/mL) for DEX was prepared by making appropriate dilutions from the stock solution. Prednisolone (1 mg/mL) was appropriately diluted and used as internal standard. An injection volume of 50 μl was injected into the HPLC column for analysis.
Sensitivity of the method was established with limit of detection (LOD) and limit of quantification for DEX with signal to noise ratio of 5:1. LOD and LOQ were determined by injecting a series of known concentrations of DEX. Precision was carried out at the LOQ level by injecting six replicates of DEX preparations at LOQ concentration by calculating relative standard deviation for each peak area. Intra-day and inter-day (three different days) RSD of <2.0% was considered to be acceptable for analytical method sensitivity.
Experimental Design
As a preliminary study to screen the weight percent of polymers, effects of formulation variables on DEX entrapment, MNF size and polydispersity index (PDI) were evaluated based on statistical design of experimental (DOE) protocol. Student version of JMP® 9.0 software (SAS institute, USA) was used to develop the experimental design and analyze the data. Two independent (X1 and X2) and three dependent variables (Y1, Y2, and Y3) were identified. Independent variables X1 and X2 are Vit E TPGS and Oc-40, respectively. Dependent variables Y1, Y2 and Y3 represent percent entrapment efficiency, micellar size and polydispersity index, respectively. “Screening design” option in JMP® was selected to create a design that included the categorical variables that cannot be quantified. In the same way, other continuous variables (polymer concentration in weight percent (wt%)) were selected. A three level full-factorial design with nine runs was chosen from the “design list” (Table I). Coded values −1, 0, +1 were assigned to the weight percent levels for the two polymers.
Table I.
Results of Full Factorial Design
| Formulation code/number | MNF code patterna | Vit E TPGS (wt%) | Oc-40 (wt%) | % Entrapment efficiency | MNF effective diameter (nm) | MNF PDI | Loading efficiency | CMC (wt% ×10−3) |
|---|---|---|---|---|---|---|---|---|
| F1 | ++ | 4.5 | 2.0 | 98.7 ± 5.5 | 10.46 | 0.086 | 1.50 | 12 |
| F2 | +0 | 4.5 | 1.05 | 92.3 ± 2.3 | 11.33 | 0.099 | 1.64 | 59 |
| F3 | +− | 4.5 | 0.1 | 85.5 ± 3.4 | 12.15 | 0.078 | 1.85 | 90 |
| F4 | 0+ | 3.5 | 2.0 | 92.7 ± 2.7 | 10.08 | 0.057 | 1.66 | 103 |
| F5 | 00 | 3.5 | 1.05 | 82.3 ± 5.8 | 11.86 | 0.123 | 1.79 | 127 |
| F6 | 0− | 3.5 | 0.1 | 25.5 ± 3.5 | 10.15 | 0.078 | 0.70 | 420 |
| F7 | −+ | 2.5 | 2.0 | 82.4 ± 3.2 | 10.94 | 0.132 | 1.79 | 218 |
| F8 | −0 | 2.5 | 1.05 | 81.1 ± 4.2 | 12.16 | 0.085 | 2.25 | 172 |
| F9 | −− | 2.5 | 0.1 | 23.4 ± 5.7 | 13.40 | 0.089 | 0.86 | 620 |
| Vit E TPGS | 4.5 | 0.0 | 66.9 ± 3.7 | 10.02 | 0.069 | 1.45 | 25 | |
| Oc-40 | 0.0 | 2.0 | N.D | N.D | N.D | N.D | 107 |
MNF mixed nanomicellar formulation, PDI polydispersity index, CMC critical micellar concentration, nm nanometer, wt% weight percent, N.D not determined
aMNF code pattern: (+) high, (0) medium, (−) low
Preparation of DEX-Loaded Mixed Nanomicelles
Mixed nanomicellar formulation of DEX was prepared by solvent evaporation method. The interactions between the hydrophobic core of polymers and the drug (0.1 wt%) improve the drug entrapment. Direct addition of the drug to the aqueous polymeric solution leaves most of the added drug unentrapped. Therefore, the novel formulations were prepared in two steps:
1. Preparation of basic formulation and 2. rehydration. In step one, DEX, Vit E TPGS and Oc-40 were dissolved separately in 10 mL of ethanol. These three solutions were mixed together in a round bottom flask to obtain a homogenous solution. Ethanol was removed by rotary evaporation to obtain a solid thin film. The residue was kept overnight under high vacuum at room temperature to remove residual solvent. In step two, the resultant thin film was hydrated with 50 mL of double distilled deionized water and kept under sonication for 20 min in a water bath sonicator (50/60 Hz, 125 W). The volume of the rehydrated formulation was made up with 2× phosphate buffer solution, (pH 6.8). Further to improve the viscosity of the MNF, povidone K 90 (solution viscosity enhancer) was added and mixed to obtain a clear solution. The solution was filtered through 0.2 μm nylon filter membrane to remove the unentrapped drug aggregates and other foreign particulates.
Characterization of Mixed Nanomicelle Formulation
Optical Clarity/Appearance
The optical clarity of all sample solutions was assessed by measuring absorbance at 400 nm with a UV/Visible spectrophotometer, (Model: Biomate-3, Thermo Spectronic, Waltham, MA). One milliliter of each sample was placed in a cuvette and absorbance was recorded (N = 3). Distilled deionized water served as the blank/control.
Osmolality and pH
Osmolality was measured with osmometer (The advanced Osmometer Model 3D3, Two technology way, Norwood, Massachusetts, USA). A sample volume of 400 μL was used to measure osmolality. The pH of the samples was measured with Oakton pH meter (Model: pH 510 series, Oakton Instruments, Vernon Hills, IL). Osmolality and pH for the prepared MNF is critical and need to be maintained in the physiological range to avoid adverse effects of the formulation on the eye. In general, to adjust tonicity, agents such as glucose, xylitol, glycerol, boric acid or sodium chloride are used (22). Tears have the tonicity equivalent to 0.9% solution of sodium chloride (23) which produces osmolality of ~305 mOsm/kg. Hypertonicity or hypotonicity of the topical drops may cause irritation to the eye. To maintain isotonic with tears, prepared formulations were subjected to tonicity testing and adjusted with sodium chloride solution to ~305 mOsm/kg. The pH of the tear ranges from 7.31 to 7.62 (24). Variation in the pH may have detrimental effects on the eye. Therefore, the pH of the formulations was adjusted similar to the tear pH of ~6.8 ± 0.1 with 0.1 N sodium hydroxide or hydrochloric acid solution.
Viscosity
MNF viscosity was measured with Ostwald-Cannon-Fenske viscometer. The viscometer was filled from one end with sufficient volumes of MNF with extreme care to avoid air bubble formation. The solution was aspirated from the other end. Time taken by the liquid to flow down under gravity was measured. Density of the liquid was also determined.
Thermal Dissociation
Experiments were carried out to determine the thermal stability of the MNFs. Glass vials containing samples were kept in water bath with a thermometer inserted inside the glass vial. Formulation dissociation studies were conducted over a range of 30°C to 100°C to determine their thermal stability. Formulations were observed for development of turbidity and temperature was recorded.
Mixed Nanomicellar Regeneration Time
After attaining the turbid temperature, the samples were allowed to cool down to room temperature. Time taken by the turbid sample to become transparent or to original clear solution state, was recorded. This duration of time is noted as regeneration time.
Mixed Nanomicellar Size, PDI and Surface Potential
The mean hydrodynamic micellar size, distribution, P.D.I and surface potential of MNFs were measured by dynamic light scattering (DLS) (Brookhaven instruments Corporation, Austin, TX, NY). A sample volume of 500 μL for size, distribution, PDI and 1,000 μL for surface potential measurement was used. The average values of three micellar diameter measurements were calculated for all samples.
Transmission Electron Microscopy
To determine the shapes and surface morphology of DEX-loaded MNF transmission electron microscopy (TEM) (TEM: JEOL JEM 1200 EX II Electron Microscope) was utilized. Sample preparation included the grids (Ted pella Inc): glider grids center marked, 300 mesh copper G300. A layer of nitrocellulose and carbon in the evaporator was applied. To fix DEX mixed nanomicelles on the grids, uranyl formate (UF) stain (Pfaltz and Bauer Inc, U01000 lot 115080-3) was utilized. To prepare a 1% stain, 37.5 mg of UF was added to 5 mL of boiling water. Further the solution was boiled for 5 min and then 50 μL of 1 M NaOH was added and boiling was continued for 5 min. The solution was allowed to cool to room temperature and then filtered prior to use. To visualize mixed nanomicelles with TEM, negative staining was applied. Preparation of negative staining is described here.
Negative stain: The grids were etched for 30 s with SPI supplied Plasma Prep II, then added to 5 μL of DEX mixed nanomicellar sample was added on to the grid as a drop, allowed 30 s to adsorb onto the grid. It was rinsed three times with distilled deionized water and stain was applied for 30 s. The stain was blotted with filter paper and dried.
Entrapment and Loading Efficiency
The entrapment efficiency is the percentage of drug loaded with respect to the amount of initial drug. In the present study, the total amount of entrapped drug in the formulation was determined by RP-HPLC. Ten milliliter of each MNF sample was collected and centrifuged at 10,000 rpm for 10 min at 4°C. One milliliter of supernatant was carefully collected into fresh vials and lyophilized to obtain a solid pellet. In the organic phase, the orientations of hydrophobic and hydrophilic segments are reversed to form reversed micelles (25) and release the contents. Addition of dichloromethane reverses the MNF and release the drug in the surrounding organic environment. This solution mixture was evaporated under speed vacuum (Genevac Technologies VC3000D speed vacuum, USA) to obtain a solid pellet of reverse micelles. Further, this solid pellet was appropriately diluted in HPLC mobile phase and the amount of drug present in the samples was determined. Amount of drug in the core of micelles was calculated by subtracting the total amount of unentrapped drug from the amount of entrapped drug. The percent entrapment and loading efficiency of the DEX was calculated by the following equations:
| 1 |
| 2 |
Determination of Critical Micellar Concentration
Critical micellar concentration (CMC) of the individual polymers i.e., Vit E TPGS and Oc-40, and a blend of polymer mixture used in the preparation of MNF was determined (N = 3) following a slight modification of previously described procedure (26,27). CMC was determined with iodine as a probe. Earlier studies demonstrated that CMC values determined with iodine as probe were similar to other methods such as static surface tension and differential refractive index (28). Iodine, I2, is fairly hydrophobic and particularly insoluble in water. The aqueous solubility of I2 is improved by adding its salt, potassium iodide, which forms KI3 solution. When this solution is added to the polymer solution and incubated for sufficient time, pure I2 from KI3 partitions into the hydrophobic core of mixed nanomicelles. Iodine partitioning develops a donor–acceptor complex between polymer and I2 (in aqueous medium) with electron donation by ether oxygen of polyoxyethylene group (28). The micelle entrapped I2 shows a blue shift from 460 to 366 nm in the presence of polymeric surfactant medium. Shift in absorbance is due to the donation of electrons to the vacant σ* orbital of iodine by the ether oxygen of polyoxyethylene group of the polymer. Partitioning of the iodine into the hydrophobic microenvironment/core of nanomicelles causes a rise in iodine absorbance indicates increase in micelle concentration. As the concentration of monomers in the formulation increases, a sudden rise in absorbance will be observed. The point at which the constant absorbance values and the increased absorbance intersect is regarded as CMC. Briefly, thirty different concentrations of the polymer solutions ranging from 1 to 4.5 × 10⁻⁵ wt% were prepared. Similarly, other blend of polymers were diluted to determine their CMC. Iodine solution was prepared by dissolving 0.5:1 ratio of iodine and potassium iodide in distilled deionized water. Iodine solution was protected from light. The resulting solution was diluted to half of its original concentration with distilled deionized water for further experiments. Iodine solution (25 μL) was added to each polymer solution. All the solutions were incubated at room temperature for 15 h in dark. After allowing sufficient incubation time, samples (200 μL) were transferred to 96 well plates. Absorbance of hydrophobic iodine, I2, entrapped in the core of mixed nanomicelle was measured with the help of DDX 880, Beckman Coulter, and multimode detection software version 2.0.012.
1H NMR Characterization
Qualitative studies were conducted with proton nuclear magnetic resonance (1H NMR) analysis to determine the presence of free DEX in the solution. Studies were performed for DEX, blank MNF and DEX-loaded in Vit E TPGS/Oc-40 mixed nanomicelles. 1H NMR spectra were recorded on a Varian 400 MHz spectrometer (Varian, USA) in deuterated water (D2O) or deuterated chloroform (CDCl3) at room temperature.
Cell Culture
Following topical drop administration, MNF comes in contact primarily with corneal epithelial cells. Therefore, we aimed to test the effect of MNF on rabbit primary corneal epithelial cells (rPCEC) cells. Rabbit corneal epithelial cells were cultured according to a previously published method from our laboratory (29). In brief, cells were grown with culture medium comprising MEM, 10% FBS, HEPES, sodium bicarbonate, penicillin, streptomycin sulfate, and 1% (v/v) nonessential amino acids, adjusted to pH 7.4. Cells were grown at 37°C, in a humidified atmosphere of 5% CO2 and 90% relative humidity. Culture medium was replaced every alternate day. Cells with passage numbers between 14 and 20 were selected for further experiments.
Cytotoxicity Assay
In vitro cytotoxicity of blank and DEX-loaded MNFs was carried out with Cell Titer 96® Aqueous Non-Radioactive Cell Proliferation Assay Kit (Promega, Madison, WI). rPCEC cells were grown on 96-well plates at a density of 10,000 cells/well. MNFs (blank and DEX-loaded) were prepared in serum free cell culture media. Further, these formulations were filtered with 0.22 μm nylon membrane filters under laminar flow. To each well 100 μL of MNFs (blank and DEX-loaded) were added and cells were incubated for 1 h at 37°C. Cell proliferation in the presence of blank and DEX-loaded MNFs was compared with a serum free cell culture medium (without drug) and 10% Triton-X 100 as negative and a positive control respectively. After sufficient incubation, the amount of formazan formed was measured with a 96-well micro titer plate reader (SpectraFluor Plus, Tecan, Maennedorf, Switzerland). Absorbance was set at 490 nm wavelength and it was directly proportional to the number of living cells in culture.
LDH Assay
In vitro cytotoxicity (rPCEC plasma membrane damage) of blank and DEX-loaded MNFs was quantitatively measured with Takara Aqueous Non-Radioactive LDH cytotoxicity detection Kit (Takara Bio Inc, CA, USA). rPCEC cells were grown on to 96-well plates at a density of 10,000 cells/well. MNFs (blank and DEX-loaded) were prepared as described above. One hundred microliters of blank and DEX-loaded MNFs were added to each well. Following this cells were incubated for 2 h, 6 h and 24 h at 37°C. In this assay cell culture media and 10% Triton-X 100 served as negative and positive controls, respectively. After incubation, the plate was centrifuged at 250×g for 10 min and 100 μL of supernatant was collected to quantify the released LDH following manufacturer’s protocol. The amount of LDH formed was utilized to calculate the cytotoxicity as shown in equation (Eq. 3).
| 3 |
In Vitro DEX Release
A fixed volume (1 ml) of DEX-loaded micellar solutions prepared with only Vit E TPGS and a blend of Vit E TPGS and Oc-40 (4.5:2.0) was suspended in dialysis bag (molecular mass cut-off 1,000 Da, Spectrum labs, CA, USA). The dialysis bags were subsequently placed into vials containing 5 mL DPBS (pH 7.4) buffer solution. DEX (1 mg) dissolved in absolute ethanol served as control. All the samples were then placed in a shaking water bath at 60 rpm and a constant temperature of 37°C. At predetermined time points, the entire buffer medium was replaced with fresh buffer. Collected incubation medium containing the released drug was immediately stored at −80°C until further analysis. Prior to analysis samples were thawed and vortexed. The supernatant was extracted for DEX and analyzed by RP-HPLC.
Mixed Nanomicelle Stability
Stability studies were conducted for F1 MNFs. DEX-loaded and blank mixed nanomicelles, were stored at 40°C, room temperature and 4°C. To avoid microbial growth during long term storage sodium azide, 0.025% w/v, was added. At predetermined time intervals, each sample was collected, centrifuged at 10,000×g for 5 min. The supernatant was collected and DEX was extracted from MNF following the procedure described for entrapment efficiency. The concentration of DEX remaining in solution was measured using RP-HPLC. Also, the size of mixed nanomicelles was determined at each time point following the previously described procedure.
Statistical Analysis
The experimental design and the data analysis were performed by student version of JMP® 9.0 software. Standard least squares were used to fit the models. Data for in vitro experiments were conducted at least in quadruplicate (n = 4) and the results were expressed as mean ± standard deviation (SD). Statistical comparison of mean values was performed with Student’s t test. A P value of <0.05 was considered to be statistically significant.
RESULTS AND DISCUSSION
Selection of Critical (or Meaningful) Factors Based on Experimental Design
In this study, we selected full-factorial DOE to screen essential independent factors for outcomes (entrapment, size, and PDI). All the formulations were subjected to other characterizations such as loading efficiency, CMC, optical absorbance, osmolality, pH, dissociation temperature, regeneration time, osmolality, viscosity and surface potential (Tables I and II). The results for dependent variables (Y1, Y2, and Y3) from nine sets of MNFs are presented in Table I. The standard least square fit analysis via JMP® 9.0 software (30) was performed to identify the most influencing factors for each dependent variable. The model fit was significant when one of the formulations (F8 in Table I) was excluded from the analysis. Therefore, eight sets of formulations were considered for formulation optimization following standard least square fit analysis. The main effects of one-factor and two-factor interaction effects were taken into consideration. The rationale behind this selection was higher interactions are less significant. The parameters that exhibited most significant outcome were selected and processed with standard least square regression model to fit those parameters. We could fit the model for percent entrapment efficiency but not for size and PDI. The summary for fit model for entrapment efficiency is presented in Table III. Further, analysis of variance (ANOVA) for entrapment efficiency showed a significant effect with F ratio (probability > F) of 0.026.
Table II.
Characterization of Mixed Nanomicellar Formulation
| Formulation code/number | Absorbance at 400 nm ± S.D | D.T (°C) ± S.D | R.T (sec) ± S.D | Osmolality (mOsm/kg) | Viscosity (cP) | Zeta potential (mV) | |
|---|---|---|---|---|---|---|---|
| Before | After | ||||||
| F1 | 0.040 ± 0.001 | A.D.T | N.D | 205 | 299 | 1.79 | −2.26 |
| F2 | 0.013 ± 0.002 | 83.9 ± 0.87 | 9.0 ± 1.00 | 218 | 307 | 1.68 | −1.67 |
| F3 | 0.020 ± 0.001 | 76.3 ± 1.49 | 40.0 ± 1.70 | 219 | 315 | 1.72 | −2.92 |
| F4 | 0.046 ± 0.001 | 92.5 ± 0.87 | 16.0 ± 2.31 | 253 | 289 | 1.59 | −1.63 |
| F5 | 0.025 ± 0.001 | 76.2 ± 0.76 | 28.0 ± 1.73 | 203 | 315 | 1.74 | −1.32 |
| F6 | 0.044 ± 0.001 | 73.5 ± 0.87 | 42.0 ± 12.0 | 222 | 308 | 1.65 | −2.30 |
| F7 | 0.046 ± 0.001 | 71.3 ± 0.81 | 18.0 ± 2.31 | 201 | 295 | 1.69 | −3.41 |
| F8 | 0.044 ± 0.001 | 91.2 ± 0.30 | 15.0 ± 1.00 | 214 | 301 | 1.75 | −2.47 |
| F9 | 0.025 ± 0.001 | 71.0 ± 0.79 | 40.0 ± 5.00 | 216 | 298 | N.D | −1.89 |
In osmolality columns “before” means before addition of tonicity enhancing agent and “after” means improved tonicity after addition of tonicity enhancer
D.T dissociation temperature, R.T regeneration time, mOsm/kg milliOsmols/kilogram, cP centipoise, mV millivolts, A.D.T. above detection point (>100°C), N.D not determined
Table III.
Summary Showing Fit to the Model Prediction of Entrapment, Size and PD
| Entrapment efficiency (%Y1) | MNF Size (nm) (Y2) | MNF PDI (Y3) | |
|---|---|---|---|
| R square | 0.88032 | 0.413733 | 0.228791 |
| R square adjusted | 0.790559 | −0.020597 | −0.34962 |
| Root mean square error | 13.91169 | 1.154439 | 0.028684 |
| Mean of response | 72.85 | 11.29625 | 0.09275 |
| Observations | 8 | 8 | 8 |
MNF mixed nanomicellar formulation, PDI polydispersity index
Master Formula (Prediction Equation)
The fit model developed the following polynomial equations for the output: entrapment efficiency (Eq. 4), MNF size (Eq. 5) and PDI (Eq. 6):
| 4 |
| 5 |
| 6 |
(where X1 = Vit E TPGS level/experimental code; X2 = Oc-40 level/experimental code and X1X2 are the interaction levels/experimental code of Vit E TPGS and Oc-40).
After interpreting the data obtained (Eqs. 4, 5, and 6), polynomial equation for the response variable (Y1, Y2, and Y3) for three level, two-factor variables was developed. Since the polynomial equations for Y1 fit well (R2 = 0.880), it was used for optimization process. The other two polynomial equations for Y2 and Y3 did not fit (R2 = 0.41 and 0.23). The possible reasons for low fit may be due to extreme small size range of mixed nanomicelles. Results show that there is no significant difference in mixed nanomicellar size and PDI (Table I). Therefore, the obtained polynomial equation for entrapment efficiency (Y1) was applied to predict entrapment efficiencies of MNFs by adjusting the levels of input variables. Of all the predicted entrapment efficiencies, MNF F1 was predicted to be (102.33%) when both polymers are set at high levels.
A Pareto chart was developed for each individual outcome. It is used to determine which factors and interactions are relevant. These charts are developed using the absolute value obtained from the half the value of main effects. The bars in the chart that extend past the line indicate values reaching statistical significance (α = 0.05). In the case of entrapment efficiency both factors, Vit E TPGS and Oc-40, are found to pass the line indicating their statistically significant effect on entrapment efficiency (Fig. 1a). But, interactions between these two input factors did not cross the line and was not significant for DEX entrapment efficiency. Similarly, effects of input variables on the MNF size and PDI outcomes were determined with Pareto chart and found to have negligible effect (Fig. 1b, c). These results indicate that only DEX entrapment was dependent on individual input variables (Vit E TPGS and Oc-40). As said earlier, we were unable to fit the model for mixed nanomicellar size and PDI. Other models have to be tried to fit the model. From the obtained results in Table I, there appeared no significant difference in mixed nanomicellar size and PDI. Therefore, we did not make any attempts to use the fit model results. Also, the results obtained from the standard least square fit model for mixed nanomicellar size and PDI revealed that there is no statistically significant difference in the outcome (data not shown). Prediction profiler for entrapment efficiency, size and PDI was developed (Fig. 2). Prediction profiler helps to determine the levels of input variables to be adjusted in a combination where the outcome can be predicted. We found that when both the input variables (Vit E TPGS and Oc-40) kept at high levels (4.5:2.0) resulted in high entrapment efficiency (98.7 ± 5.5), which is evident from the results. The prediction profiler results and the experimental results are in agreement. Therefore, the combination of variables at high level with high entrapment efficiency was assumed to be the better formulation. Further to determine the effects of the input variables on the entrapment efficiency we developed Contour plot (data not shown). Contour plot is a three dimensional representation for the outcome when the input variables are adjusted. From the contour plot, one can estimate the levels of the input variables and determine the outcome (present on the surface of the box). The shaded region in contour plot indicates the lower entrapment region of DEX. On the other hand, the unshaded region represents the higher entrapment. We observed that when both variables (Vit E TPGS and Oc-40) set at high level, high entrapment efficiency was predicted. Experimental design results and our experimental outcome suggest that when the polymer combination is kept at high level results in higher entrapment. Results appear to be in agreement with the outcome. From the prediction equation and contour plot, high entrapment efficiency was predicted when input variables were set at high levels. Taking input levels at high levels, entrapment efficiency was predicted to be 101.44%. We conducted MNF preparation following the procedure described earlier and the entrapment efficiency was determined according to the RP-HPLC method. Results confirmed that percent DEX entrapment into MNF to be 97.5 ± 2.5, which is in agreement with the DOE.
Fig. 1.
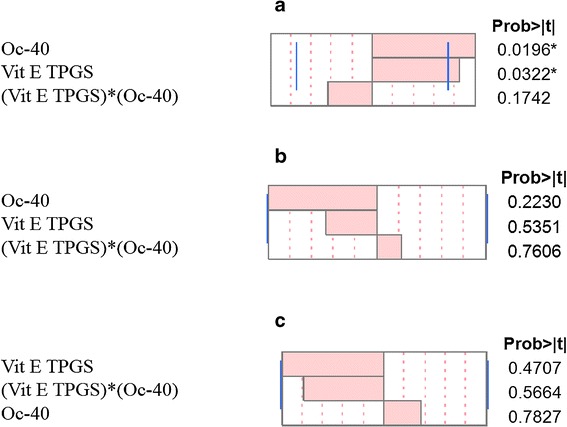
Pareto charts a Entrapment efficiency for DEX b Mixed nanomicellar size c Polydispersity index
Fig. 2.
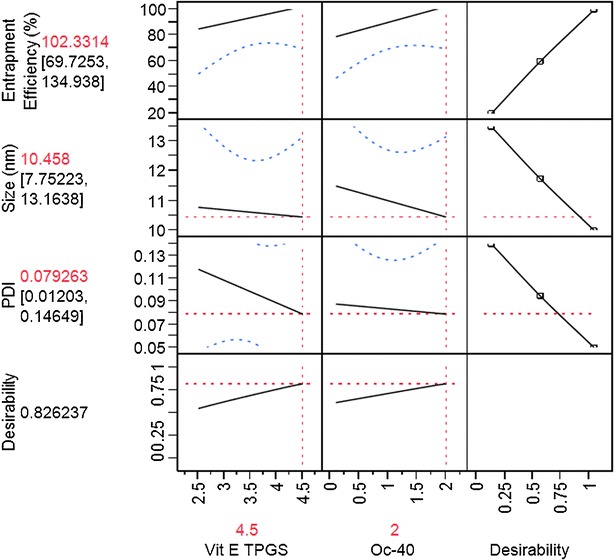
Prediction profiler
Entrapment and Loading Efficiency
DEX entrapment and loading into the mixed nanomicelles was determined with RP-HPLC method described earlier. All the MNFs showed excellent drug entrapment and loading efficiencies, which are summarized in Table I. Among the formulations prepared and from the experimental design results it can be concluded that formulation F1 has the highest entrapment efficiency with optimal drug loading. Before conducting further characterization for F1 formulation, all the formulations were commonly subjected to appearance, viscosity, osmolality, size, PDI, surface charge, dissociation temperature, and regeneration time tests (Table II).
Micellar Size, Polydispersity, Surface Charge, and Morphology
Mixed nanomicellar size and polydispersity indices were determined for all the prepared formulations. Results show a size range between 10 and 40 nm (Table I). Polydispersity indices were observed to be in the range of 0.080–0.135 (Table I). DEX-loaded MNF are slightly larger than blank MNF. Blank MNF (Vit E TPGS: Oc-40; 4.5:2.0) and optimally DEX-loaded MNF (F1) exhibited a size of 10.2 ± 0.3 nm and 10.46 ± 0.3 nm, respectively (Fig. 3). We assume that the size of MNF to be sufficiently suitable to traverse across aqueous scleral channels/pore that have a size range between 20 and 80 nm (31). Also, these micelles display a narrow and unimodal particle size distribution. However, no significant changes in micelles size or size distribution were noted. Since these MNF’s are in the same size range as membrane receptors, proteins, and other biomolecules, such carriers may have the ability to bind with cellular barriers. Surface charge of MNFs was found to carry a slight negative charge (Table II). Surface morphology of DEX-loaded MNFs was studied with TEM and results revealed that the MNFs are spherical in shape with smooth surface architecture without any aggregation (see Fig. 4). The particle size visualized by TEM were in agreement with the size obtained by DLS.
Fig. 3.
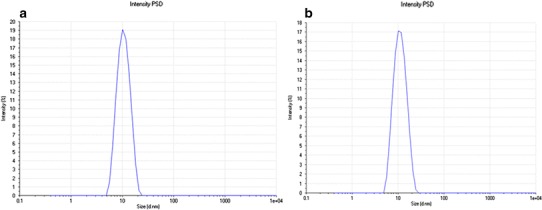
Size distribution for mixed nanomicelles. a Blank mixed nanomicelles effective diameter 10.2 ± 0.3 nm. b DEX-loaded mixed nanomicelles effective diameter 10.46 ± 0.3 nm
Fig. 4.
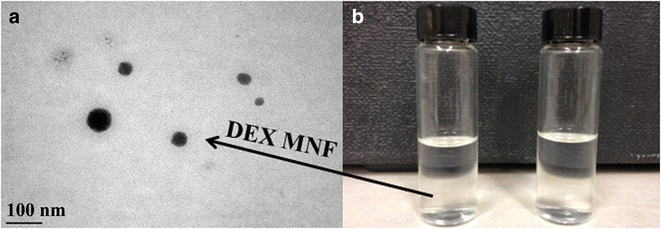
TEM image of DEX encapsulated mixed nanomicellar formulation. a TEM picture of DEX encapsulated nanomicelles (scale bar = 100 nm), and b 0.1% DEX nanomicellar formulation on the left compared with DI water on right
Optical Clarity/Appearance
One of the major objectives of this study was to prepare an aqueous clear solution of DEX. Optical clarity/appearance refers to 90% or greater transmission of light of 400 nm wavelength in a 1.0 cm path. Micelle size, typically smaller than the smallest wavelength of a visible light radiation (about 350 nm), denotes clarity of the solution. In general, light scattering occurs when any particle interferes with the visible light wavelengths. Due to extremely small size of the mixed nanomicelles, light is not scattered, which denotes a transparent/clear aqueous solution. Ophthalmic compositions of the present DEX formulations are substantially clear with an absorption units below 0.05 measured at 400 nm (data not shown). The low absorbance of the formulation indicates the clarity of the formulation which is devoid of any particulate matter. For example, absorbance data for the formulation (F1) used for the characterization studies was (0.040 ± 0.001). Optical clarity of the formulation was compared with distilled deionized water as blank. This study indicates that all the formulations are similar to water with no particulate matter present in the MNFs.
Viscosity
Viscosity of the formulation is another critical factor that needs to be maintained. Optimal viscosity helps to increase the mean residence time of MNF at the administration site (precorneal and under eye lid pocket). Therefore, bioadhesive polymers such as PVP-K-30, hydroxypropyl methyl cellulose, hydroxyethyl cellulose or polycarbophil could be used. High concentrations of these polymers were required to improve viscosity which resulted in undesirable outcomes like increase in MNF size, PDI or reduced MNF dissociation temperature (data not shown). However, PVP-K-90 polymer had negligible effect on the MNF and raised the dissociation temperature. Therefore, PVP-K-90 was selected as a bioadhesive and viscosity enhancing excipient/agent. Formulation viscosity was adjusted to be less than 2.0 centipoise (cP) (well below critical point of 4.4 cP) to hold the formulation in the cul-de-sac and which does not affect the rate of tear drainage (32).
Thermal Dissociation and Regeneration Time
The MNF has to be robust and the parameters used, in general, include thermal dissociation and regeneration time. DEX-loaded MNF with very high thermal dissociation temperature (DT) indicates the formulation is stable at high temperature. Following thermal dissociation when MNFs are allowed to cool to room temperature under ambient conditions, micelles were regenerated within less than 1 min resulting in optically clear solutions. In general micelles are unstable structures possessing two characteristic relaxation times i.e., fast (τ1) and slow (τ2). The results show the time taken to regenerate the micelles is in seconds (Table II), because both surfactants are nonionic in nature. This peculiar behavior of the formulation indicates that the hydrophobic DEX is entrapped in the nanomicellar core even after being subjected to harsh conditions. Thermal dissociation/dissociation temperature of the blank MNF is about 20–40°C higher than the formulation containing drug. With temperature rising above DT, micelles appear to dissociate into individual monomer units. Such disruption of micelle structures causes drug release in surrounding aqueous medium. Such destabilization of mixed nanomicelles results in the formation of a cloudy or milky white solution. DT of the optimized formulation appears to be extremely high (>100°C) which provides maximal stability to the formulation at normal room temperature. The results clearly show that increase in concentration of Oc-40 raises the DT at constant Vit E TPGS.
Critical Micellar Concentration
Ocular drug delivery is impeded from delivering therapeutic concentrations of drug due to ocular static and dynamic barrier which includes tear/tear dilution (33). CMC is a critical factor that regulates premature release of drug due to tear dilution after topical drop administration. Of the total volume applied, only 20% of the formulation is available for absorption (34). The applied formulation occupies the space in precorneal pocket by replacing lacrimal fluid. The total volume of tear that precorneal pocket can hold without overflowing is 10 μl (35). Tear turnover rate is ~0.7 μl/min (35). The formulation applied will be continuously diluted by tears. This tear dilution may disrupt the micelles and release the drug at the site of application. To prevent the disruption of micelles by dilution a low CMC of the formulation is desired (36). Therefore, to reduce the CMC of the polymeric surfactants a blend of nonionic polymers is used. This low CMC provides the DEX-entrapped MNF with high stability after topical drop application. In the current study, CMC was determined for Vit E TPGS, Oc-40 and for the blend of polymer mixtures (see Table I) with iodine as a probe. A lowering in CMC is an indicator of stable formulation at low surfactant concentrations. The results obtained were plotted for iodine intensity vs log wt% of polymer or blend of polymers to determine the intersection, which is CMC. CMC of Vit E TPGS was found to be approximately 0.025 wt%, which is in agreement with the literature value. The other polymer, Oc-40, generated a CMC value of 0.107 wt% which is greater than the CMC of Vit E TPGS. A combination of the surfactants in varying ratio decreased the CMC value to 0.012 wt% (Formulation F1). The obtained individual results were subjected to student t test. The obtained CMC values are significant at p < 0.05 level.
1H NMR Characterization
1H NMR analysis is used to determine the presence of drug molecules in solution at parts per million (ppm) levels. In the current study, qualitative 1H NMR spectral analysis was conducted to confirm drug entrapment into the inner core of mixed nanomicelles in CDCl3 and D2O. MNFs were prepared in different media such as CDCl3 and D2O. 1H NMR spectroscopy studies were conducted for DEX (Fig. 5a), mixture of polymers dissolved in CDCl3 (Fig. 5b) and entrapped drug in CDCl3 and D2O. The concentration of DEX entrapped in the MNF is ~6.3 times higher than its aqueous solubility (0.159 mg/mL) (20). Addition of higher concentration of DEX in the aqueous environment leads to drug precipitation at the bottom of the vial due to insolubility. In our studies, we did not observe any precipitate at the bottom of the vial. Also, due to DEX aqueous solubility, a small amount of unentrapped DEX may be present in the outer aqueous environment (D2O), which may not be identified visually or with naked eye. Results show that in CDCl3, the resonance peaks corresponding to DEX and mixed nanomicelles are present (Fig. 5c). In D2O, peaks corresponding to mixed nanomicelles are only detected and no peaks for DEX were evident (Fig. 5d). These results clearly indicate, DEX was entrapped into the inner hydrophobic microenvironment/core of mixed nanomicelles. Also, study suggests that no free/unentrapped DEX was present in the MNF. These results are similar to earlier shown results for paclitaxel-loaded mixed polymeric micelles in D2O (26,37).
Fig. 5.
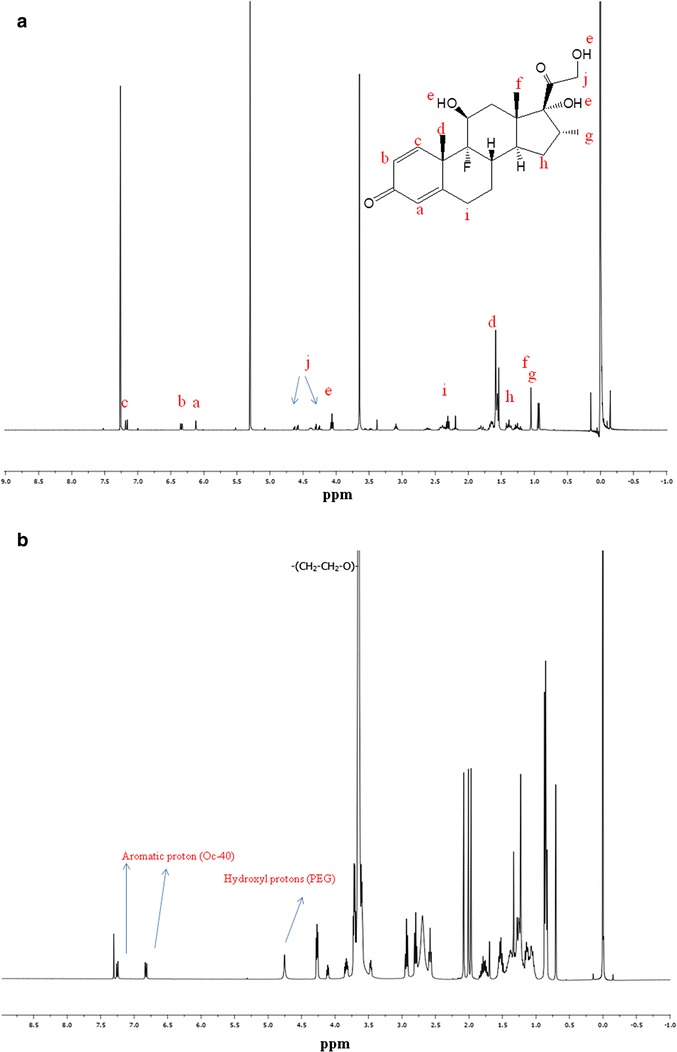
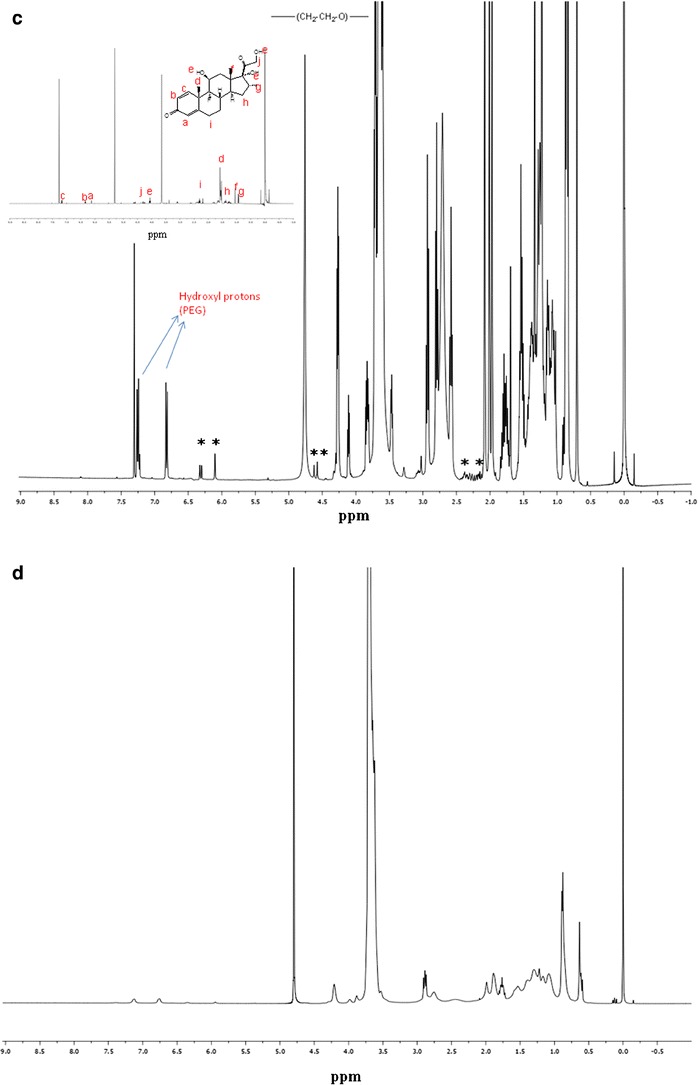
1H NMR for DEX and mixed nanomicellar formulation. a 1H NMR dexamethasone in CDCl3 b 1H NMR blank mixed nanomicelles in CDCl3, c 1H NMR mixed nanomicellar formulation of dexamethasone in CDCl3. The symbol “*” indicates the resonance peaks corresponding to dexamethasone, d 1H NMR dexamethasone entrapped mixed nanomicellar formulation in D2O (abbreviation Oc-40 stands for octoxynol 40)
In Vitro Cytotoxicity
To evaluate the cytotoxic effect of MNFs (blank and DEX-loaded), MTS and LDH assays were performed on rPCEC cells. Since eye drops are rapidly cleared from the precorneal pocket (38,39) MTS assay was performed till 1 h. It was assumed that a 1 h incubation period would be sufficient to evaluate any toxicity. Percent viable cells for all the MNFs were comparable to that of negative control (culture medium) (Fig. 6a). Triton-X 100 served as positive control and reduced the percent cell viability to 10% of the total cell number. In another set of studies, cell plasma membrane damage test (LDH assay). Studies were conducted following manufacturer’s protocol for 2 h, 6 h and 24 h incubation and examined for LDH release. The amount of LDH released in the culture media directly correlates with cytotoxicity. Triton-X 100 caused significant toxicity/membrane damage. Percentage cytotoxicity to rPCEC cells post exposure to MNFs (blank and DEX-loaded) appeared to be negligible (Fig. 6b) indicating MNFs did not cause cell membrane damage. Results from these assays clearly suggest that our MNFs does not cause cell death or damage to plasma membrane and are safe for topical ocular application.
Fig. 6.
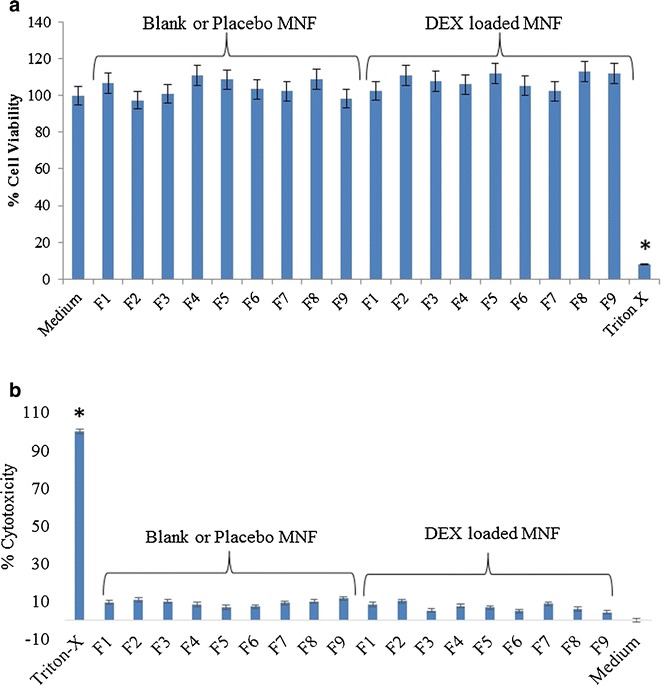
Cytotoxicity of blank and 0.1% DEX-loaded mixed nanomicellar formulations on rabbit primary corneal epithelial cells (rPCEC). a Cytotoxicity of blank and DEX-loaded mixed nanomicellar formulations on rabbit primary corneal epithelial cells (rPCEC), 1 h exposure time, Triton-X 100 positive control and culture medium negative control; b Cell membrane damage (LDH assay) studies on rPCEC cells, 24 h incubation time, Triton-X 100 positive control and culture medium negative control (Formulation abbreviation are described in Table I)
In Vitro DEX Release
In vitro release kinetics of DEX from Vit E TPGS and mixed nanomicelles (F1) were investigated at a physiological pH of 7.4 at 37°C. An equal quantity of DEX (1 mg) was dissolved in 1 ml of absolute ethanol that served as a control. DEX release from ethanolic solution was much more rapid than DEX in Vit E TPGS and mixed nanomicelles. Almost 100% DEX release occurs in approximately 4 h for ethanolic DEX. The release kinetic profiles of ethanolic and encapsulated DEX from the nanomicelles have been depicted in Fig. 7. Mixed nanomicellar DEX release half-lives were slow and not associated with any significant burst effect. The results suggest a sustained release of DEX from the core of mixed nanomicelles over a period of 4.2 days. Results suggest that under physiological conditions, topical administration of DEX MNF helps to sustain release of DEX. As a result, it aids in achieving therapeutic concentrations of DEX in ocular tissues thereby reducing dosing frequency.
Fig. 7.
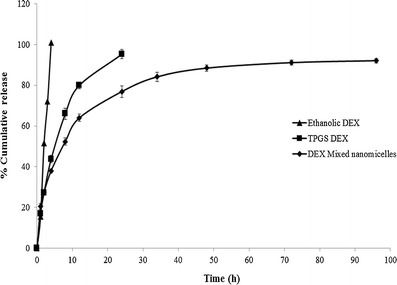
In vitro dexamethasone release studies. Graph showing dexamethasone release under in vitro conditions (N = 4). (Black triangle) dexamethasone release from ethanolic solution. Dexamethasone was completely released in 4 h (black square) dexamethasone release from Vit E TPGS alone. Dexamethasone release was sustained up to ~22 h and (black diamond) dexamethasone release from blend of Vit E TPGS and Oc-40 (4.5:2.0) mixture for more than 100 h
Mixed Nanomicelle Stability
The stability of MNFs is a very important segment in the formulation development process. In order to determine the stability of the novel MNF, we selected F1 formulation for long term stability studies. MNF F1 has low CMC, high entrapment efficiency, small size, narrow polydispersity index, and high dissociation temperature. Formulation F1 was stored at 40°C, 25°C and 4°C for 6 months. Samples were monitored for time-dependent changes in mixed nanomicellar size and drug content during the storage period. At predetermined time points, MNF sample was collected, centrifuged at 10,000 rpm for 10 min at 4°C, supernatant was collected and analyzed for DEX with RP-HPLC. Analysis shows that the drug concentration was low (Fig. 8). A plot of Ln DEX concentration vs time (h) was used to determine the shelf and half-lives of MNF. The formulation stored at 40°C exhibited a shelf life (t90) of 4.2 days and half-life of 27.72 days respectively (Fig. 8). Simultaneously, mixed nanomicellar size determination studies were conducted. No difference in micellar size for the samples was observed (data not shown). The micellar size for the formulation remained the same in the stability studies conducted at 40°C, room temperature (25°C) and 4°C. MNF of DEX stored at 25°C and 4°C are stable for more than 3 and 6 months, respectively (data not shown). Quantitative estimation of remainder DEX in the aqueous MNF was conducted with RP-HPLC as described earlier. At high temperature, the formulation showed decreasing DEX concentration with time. Free drug precipitated out of the formulation and settled at the bottom of the vial, which was confirmed by RP-HPLC after separation of precipitate from the aqueous MNF.
Fig 8.
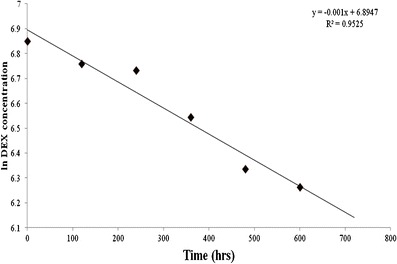
Formulation stability studies (N = 4) at 40°C
CONCLUSIONS
A clear, stable, aqueous DEX-loaded MNF was prepared and optimized with full-factorial statistical DOE. Results indicate that DEX entrapment efficiency was dependent on two input factors Vit E TPGS and Oc-40. A specific blend of Vit E TPGS and Oc-40 at a particular wt% ratio (4.5:2.0) produced excellent drug entrapment, loading and small mixed nanomicellar size as well as narrow PDI. This method of drug entrapment can minimize drug loss during large-scale production. Since this aqueous DEX-loaded MNF formulation is highly stable for prolonged period and it appears from the results that it may not be very toxic, it may be suitable for human application as ocular drops after in vivo evaluations.
ACKNOWLEDGMENTS
This study has been supported by NIH grants R01EY09171-16, R01EY010659-14 and LUX biosciences, NJ, USA. We would like to thank Dr. Vladimir Dusevich, UMKC School of Dentistry, for helping with the operation of transmission electron microscopy and Mrs. RajyaLaxmi Earla, UMKC school of Pharmacy for helping in NMR sample preparation.
REFERENCES
- 1.Kim DH, Martin DC. Sustained release of dexamethasone from hydrophilic matrices using PLGA nanoparticles for neural drug delivery. Biomaterials. 2006;27(15):3031–7. doi: 10.1016/j.biomaterials.2005.12.021. [DOI] [PubMed] [Google Scholar]
- 2.Einar Stefansson TL. Cyclodextrins in eye drop formulations. J Incl Phenom Macrocycl Chem. 2002;44:23–7. doi: 10.1023/A:1023015201493. [DOI] [Google Scholar]
- 3.Chang DT, Herceg MC, Bilonick RA, Camejo L, Schuman JS, Noecker RJ. Intracameral dexamethasone reduces inflammation on the first postoperative day after cataract surgery in eyes with and without glaucoma. Clin Ophthalmol. 2009;3:345–55. doi: 10.2147/OPTH.S5730. [DOI] [PMC free article] [PubMed] [Google Scholar]
- 4.Capone A, Jr, Singer MA, Dodwell DG, Dreyer RF, Oh KT, Roth DB, et al. Efficacy and safety of two or more dexamethasone intravitreal implant injections for treatment of macular edema related to retinal vein occlusion (Shasta study) Retina. 2014;34(2):342–51. doi: 10.1097/IAE.0b013e318297f842. [DOI] [PubMed] [Google Scholar]
- 5.Sivaprasad S, McCluskey P, Lightman S. Intravitreal steroids in the management of macular oedema. Acta Ophthalmol Scand. 2006;84(6):722–33. doi: 10.1111/j.1600-0420.2006.00698.x. [DOI] [PubMed] [Google Scholar]
- 6.Umland SP, Schleimer RP, Johnston SL. Review of the molecular and cellular mechanisms of action of glucocorticoids for use in asthma. Pulm Pharmacol Ther. 2002;15(1):35–50. doi: 10.1006/pupt.2001.0312. [DOI] [PubMed] [Google Scholar]
- 7.Abraham SM, Lawrence T, Kleiman A, Warden P, Medghalchi M, Tuckermann J, et al. Antiinflammatory effects of dexamethasone are partly dependent on induction of dual specificity phosphatase 1. J Exp Med. 2006;203(8):1883–9. doi: 10.1084/jem.20060336. [DOI] [PMC free article] [PubMed] [Google Scholar]
- 8.Haller JA, Bandello F, Belfort R, Jr, Blumenkranz MS, Gillies M, Heier J, et al. Dexamethasone intravitreal implant in patients with macular edema related to branch or central retinal vein occlusion twelve-month study results. Ophthalmology. 2011;118(12):2453–60. doi: 10.1016/j.ophtha.2011.05.014. [DOI] [PubMed] [Google Scholar]
- 9.Elg M, Gustafsson D. A combination of a thrombin inhibitor and dexamethasone prevents the development of experimental disseminated intravascular coagulation in rats. Thromb Res. 2006;117(4):429–37. doi: 10.1016/j.thromres.2005.03.014. [DOI] [PubMed] [Google Scholar]
- 10.Vachon P, Moreau JP. Low doses of dexamethasone decrease brain water content of collagenase-induced cerebral hematoma. Can J Vet Res = Rev Can Rech Vet. 2003;67(2):157–9. [PMC free article] [PubMed] [Google Scholar]
- 11.Loftsson T, Hreinsdottir D, Stefansson E. Cyclodextrin microparticles for drug delivery to the posterior segment of the eye: aqueous dexamethasone eye drops. J Pharm Pharmacol. 2007;59(5):629–35. doi: 10.1211/jpp.59.5.0002. [DOI] [PubMed] [Google Scholar]
- 12.Boddu SH, Jwala J, Vaishya R, Earla R, Karla PK, Pal D, et al. Novel nanoparticulate gel formulations of steroids for the treatment of macular edema. J Ocul Pharmacol Ther: Off J Assoc Ocul Pharmacol Ther. 2010;26(1):37–48. doi: 10.1089/jop.2009.0074. [DOI] [PMC free article] [PubMed] [Google Scholar]
- 13.Ebrahim S, Peyman GA, Lee PJ. Applications of liposomes in ophthalmology. Surv Ophthalmol. 2005;50(2):167–82. doi: 10.1016/j.survophthal.2004.12.006. [DOI] [PubMed] [Google Scholar]
- 14.Hsu J. Drug delivery methods for posterior segment disease. Curr Opin Ophthalmol. 2007;18(3):235–9. doi: 10.1097/ICU.0b013e3281108000. [DOI] [PubMed] [Google Scholar]
- 15.Weijtens O, Schoemaker RC, Lentjes EG, Romijn FP, Cohen AF, van Meurs JC. Dexamethasone concentration in the subretinal fluid after a subconjunctival injection, a peribulbar injection, or an oral dose. Ophthalmology. 2000;107(10):1932–8. doi: 10.1016/S0161-6420(00)00344-4. [DOI] [PubMed] [Google Scholar]
- 16.Cunningham MA, Edelman JL, Kaushal S. Intravitreal steroids for macular edema: the past, the present, and the future. Surv Ophthalmol. 2008;53(2):139–49. doi: 10.1016/j.survophthal.2007.12.005. [DOI] [PubMed] [Google Scholar]
- 17.Yamashita T, Uemura A, Kita H, Sakamoto T. Intraocular pressure after intravitreal injection of triamcinolone acetonide following vitrectomy for macular edema. J Glaucoma. 2007;16(2):220–4. doi: 10.1097/IJG.0b013e31802d6e16. [DOI] [PubMed] [Google Scholar]
- 18.Gillies MC, Kuzniarz M, Craig J, Ball M, Luo W, Simpson JM. Intravitreal triamcinolone-induced elevated intraocular pressure is associated with the development of posterior subcapsular cataract. Ophthalmology. 2005;112(1):139–43. doi: 10.1016/j.ophtha.2004.07.017. [DOI] [PubMed] [Google Scholar]
- 19.Sheu MT, Chen SY, Chen LC, Ho HO. Influence of micelle solubilization by tocopheryl polyethylene glycol succinate (TPGS) on solubility enhancement and percutaneous penetration of estradiol. J Control Release: Off J Control Release Soc. 2003;88(3):355–68. doi: 10.1016/S0168-3659(02)00492-3. [DOI] [PubMed] [Google Scholar]
- 20.Loftsson T, Hreinsdottir D. Determination of aqueous solubility by heating and equilibration: a technical note. AAPS PharmSciTech. 2006;7(1):E4. doi: 10.1208/pt070104. [DOI] [PubMed] [Google Scholar]
- 21.Duong AD, Ruan G, Mahajan K, Winter JO, Wyslouzil BE. Scalable, semicontinuous production of micelles encapsulating nanoparticles via electrospray. Langmuir: ACS J Surf Colloids. 2014;30(14):3939–48. doi: 10.1021/la404679r. [DOI] [PubMed] [Google Scholar]
- 22.Mitra AK, Velagaleti PR, Natesan S, inventor. Ophthalmic Compositions. USA patent US 13/974,241. 2013.
- 23.Craig JP, Simmons PA, Patel S, Tomlinson A. Refractive index and osmolality of human tears. Optom Vis Sci: Off Publ Am Acad Optom. 1995;72(10):718–24. doi: 10.1097/00006324-199510000-00004. [DOI] [PubMed] [Google Scholar]
- 24.Janszky I, Vamosi P, Orszagh I, Berta A. Demonstration of increasing standard pH value of lacrimal fluid with increase of flow rate. Acta Ophthalmol Scand. 2001;79(2):180–3. doi: 10.1034/j.1600-0420.2001.079002180.x. [DOI] [PubMed] [Google Scholar]
- 25.Dong XY, Meng Y, Feng XD, Sun Y. A metal-chelate affinity reverse micellar system for protein extraction. Biotechnol Prog. 2010;26(1):150–8. doi: 10.1002/btpr.291. [DOI] [PubMed] [Google Scholar]
- 26.Wei Z, Hao J, Yuan S, Li Y, Juan W, Sha X, et al. Paclitaxel-loaded Pluronic P123/F127 mixed polymeric micelles: formulation, optimization and in vitro characterization. Int J Pharm. 2009;376(1–2):176–85. doi: 10.1016/j.ijpharm.2009.04.030. [DOI] [PubMed] [Google Scholar]
- 27.Saxena V, Hussain MD. Poloxamer 407/TPGS mixed micelles for delivery of gambogic acid to breast and multidrug-resistant cancer. Int J Nanomedicine. 2012;7:713–21. doi: 10.2147/IJN.S28745. [DOI] [PMC free article] [PubMed] [Google Scholar]
- 28.Hait SK, Moulik SP. Determination of critical micellar concentration of non-ionic surfactants by donor-acceptor interaction with iodine and correlation of CMC with hydrophile-lipophile balance and other parameters of the surfactants. J Surfactant Deterg. 2001;4(3):303–9. doi: 10.1007/s11743-001-0184-2. [DOI] [Google Scholar]
- 29.Hariharan S, Minocha M, Mishra GP, Pal D, Krishna R, Mitra AK. Interaction of ocular hypotensive agents (PGF2 alpha analogs-bimatoprost, latanoprost, and travoprost) with MDR efflux pumps on the rabbit cornea. J Ocul Pharmacol Ther: Off J Assoc Ocul Pharmacol Ther. 2009;25(6):487–98. doi: 10.1089/jop.2009.0049. [DOI] [PMC free article] [PubMed] [Google Scholar]
- 30.Acharya G, Lee CH, Lee Y. Optimization of cardiovascular stent against restenosis: factorial design-based statistical analysis of polymer coating conditions. PLoS ONE. 2012;7(8):e43100. doi: 10.1371/journal.pone.0043100. [DOI] [PMC free article] [PubMed] [Google Scholar]
- 31.Chopra P, Hao J, Li SK. Iontophoretic transport of charged macromolecules across human sclera. Int J Pharm. 2010;388(1–2):107–13. doi: 10.1016/j.ijpharm.2009.12.046. [DOI] [PMC free article] [PubMed] [Google Scholar]
- 32.Zhu H, Chauhan A. Effect of viscosity on tear drainage and ocular residence time. Optom Vis Sci: Off Publ Am Acad Optom. 2008;85(8):715–25. doi: 10.1097/OPX.0b013e3181824dc4. [DOI] [PubMed] [Google Scholar]
- 33.Cholkar K, Patel A, Dutt Vadlapudi A, Mitra AK. Novel nanomicellar formulation approaches for anterior and posterior segment ocular drug delivery. Recent Patents Nanomed. 2012;2(2):82–95. doi: 10.2174/1877912311202020082. [DOI] [PMC free article] [PubMed] [Google Scholar]
- 34.Cholkar K, Patel SP, Vadlapudi AD, Mitra AK. Novel strategies for anterior segment ocular drug delivery. J Ocul Pharmacol Ther: Off J Assoc Ocul Pharmacol Ther. 2013;29(2):106–23. doi: 10.1089/jop.2012.0200. [DOI] [PMC free article] [PubMed] [Google Scholar]
- 35.Mitra AK. In: Ophthalmic drug delivery systems. Mitra AK, editor. New York: Marcel Dekker; 2008. [Google Scholar]
- 36.Gao Y, Li LB, Zhai G. Preparation and characterization of Pluronic/TPGS mixed micelles for solubilization of camptothecin. Colloids Surf B: Biointerfaces. 2008;64(2):194–9. doi: 10.1016/j.colsurfb.2008.01.021. [DOI] [PubMed] [Google Scholar]
- 37.Lee SC, Huh KM, Lee J, Cho YW, Galinsky RE, Park K. Hydrotropic polymeric micelles for enhanced paclitaxel solubility: in vitro and in vivo characterization. Biomacromolecules. 2007;8(1):202–8. doi: 10.1021/bm060307b. [DOI] [PMC free article] [PubMed] [Google Scholar]
- 38.Lang JC. Ocular drug delivery conventional ocular formulations. Adv Drug Deliv Rev. 1995;16:39–43. doi: 10.1016/0169-409X(95)00012-V. [DOI] [Google Scholar]
- 39.Järvinen KJT, Urtti A. Ocular absorption following topical delivery. Adv Drug Deliv Rev. 1995;16:3–19. doi: 10.1016/0169-409X(95)00010-5. [DOI] [Google Scholar]


