

Background: Molecular mechanisms of insulin resistance in diabetes are poorly understood.
Results: Quantitative systems-wide data reveal that a single mechanism can explain insulin resistance throughout the signaling network in human adipocytes.
Conclusion: The most important aspect of the insulin resistance mechanism is an attenuated feedback signal.
Significance: The study demonstrates how insulin resistance originates and propagates throughout the signaling network in cells from patients with diabetes.
Keywords: Adipocyte, Extracellular Signal-regulated Kinase (ERK), Insulin Resistance, Mathematical Modeling, Protein Phosphorylation, Signal Transduction, Type 2 Diabetes, Elk1, MAPK, Human
Abstract
The response to insulin is impaired in type 2 diabetes. Much information is available about insulin signaling, but understanding of the cellular mechanisms causing impaired signaling and insulin resistance is hampered by fragmented data, mainly obtained from different cell lines and animals. We have collected quantitative and systems-wide dynamic data on insulin signaling in primary adipocytes and compared cells isolated from healthy and diabetic individuals. Mathematical modeling and experimental verification identified mechanisms of insulin control of the MAPKs ERK1/2. We found that in human adipocytes, insulin stimulates phosphorylation of the ribosomal protein S6 and hence protein synthesis about equally via ERK1/2 and mTORC1. Using mathematical modeling, we examined the signaling network as a whole and show that a single mechanism can explain the insulin resistance of type 2 diabetes throughout the network, involving signaling both through IRS1, PKB, and mTOR and via ERK1/2 to the nuclear transcription factor Elk1. The most important part of the insulin resistance mechanism is an attenuated feedback from the protein kinase mTORC1 to IRS1, which spreads signal attenuation to all parts of the insulin signaling network. Experimental inhibition of mTORC1 using rapamycin in adipocytes from non-diabetic individuals induced and thus confirmed the predicted network-wide insulin resistance.
Introduction
Insulin regulates cellular functions by binding to its cell surface receptor, which signals the control of diverse processes throughout the cell. Understanding insulin signaling in different cell types is important because perturbation of insulin signaling is a fundamental feature of the metabolic disarrays of major diseases, such as obesity, the metabolic syndrome, diabetes, and some cancers. In obesity and type 2 diabetes (T2D),3 the adipocytes are of particular interest because insulin resistance in these cells is a direct result of the obesity and contributes to systemic insulin resistance and T2D. Although there are much data and knowledge available on insulin signaling normally and in various models of insulin resistance, the mechanisms that explain the impaired intracellular signaling by insulin, the underlying cause of insulin resistance, are not understood. Several experimental studies have demonstrated that the insulin resistance can be detected in different parts of the signaling network, but there is today no consensus regarding where this resistance may mechanistically originate or how it propagates to the rest of the network. An important reason for this is that data are fragmented and not directly comparable because they are obtained under different conditions, from different cell lines and animal models of insulin resistance/T2D.
We have taken a systems approach to the investigation of the mechanisms of insulin resistance, and we have previously described the branch of the insulin signaling network that leads to control of glucose uptake in human adipocytes, normally and in T2D (1–4) (Fig. 1). The resulting model was based on consistently obtained dynamic and steady-state data for key signal mediators in adipocytes from both healthy individuals and patients with T2D (3). However, the current model is not complete, and it is not known how the mechanisms of impaired insulin signaling identified for the glucose uptake branch relate to signaling through other branches, in particular the important MAPK branch (Fig. 1).
FIGURE 1.

The insulin signaling network. Examined phosphorylation sites in signaling intermediaries are indicated (-P). mTORC2, mammalian target of rapamycin in complex with rictor and Elk1 (ETS domain-containing protein). The green arrow indicates positive feedback signal. Red arrows indicate functional effects of insulin-resistant insulin signaling in T2D. The gray area indicates the focus of this investigation, with dashed gray arrows indicating outstanding questions answered herein: whether the MAPK pathway is controlled via IRS1, another adapter protein or both (1); whether ERK1/2 signaling cross-talks with the other branches of the insulin signaling network (2); and to what extent ERK1/2 signaling is affected in T2D and whether the same mechanisms are involved as in the rest of the signaling network (3).
In common with other growth factors, insulin also signals via a “mitogenic” MAPK branch of the signaling network to control nuclear transcription. In order to describe and understand signaling through the entire insulin signaling network and how the signaling propagates in insulin resistance of T2D, we therefore need to expand our model of insulin signaling to include also the MAPKs extracellular signal-regulated kinases 1/2 (ERK1/2) and their control of the transcription factor ETS domain-containing protein Elk1. Research on insulin signaling through ERK1/2 has been relatively neglected, and not much is known about the performance of this important signaling branch, especially in T2D (Fig. 1), where findings are inconsistent. For instance, a slight (20%) increase of phospho-ERK1/2 basally, with unaffected insulin stimulation, has been reported for human adipocytes in the diabetic state (5). In skeletal muscle, phosphorylation of ERK1/2 was reported to not be affected in T2D (6, 7), whereas the basal level of phospho-ERK1/2 has also been reported to be increased in skeletal muscle (8) and in myotubes (9) from patients with T2D. In contrast, insulin-stimulated phosphorylation of ERK1/2 was impaired in skeletal muscle from obese Zucker rats (10) and ob/ob mice (11).
The autophosphorylated and activated insulin receptor phosphorylates the insulin receptor substrate-1 (IRS1). Tyrosine-phosphorylated IRS1 forms a hub with a branch to “metabolic” control through protein kinase B (PKB) and further downstream to control of protein synthesis via a second hub, the protein kinase mammalian target of rapamycin (mTOR) in complex with raptor (mTORC1). The signaling branch to “mitogenic” control via ERK1/2 leads to phosphorylation of transcription factors as well as other nuclear and non-nuclear proteins. It is, however, unclear whether also this branch is controlled via Grb2 binding to IRS1 or to Shc or another adapter protein (Fig. 1). ERK1/2 is activated in response to insulin or other growth factors when phosphorylated at a threonine and a tyrosine residue by mitogen-activated protein kinase kinases 1 and 2 (MEK1/2). Phosphorylated and activated ERK1/2 acts in the cytosol and, after translocation into the nucleus, phosphorylates transcription factors, such as Elk1 (reviewed in Refs. 12–14). Although ERK1/2 signaling in response to growth factors, in particular EGF, has been extensively modeled, insulin control of ERK1/2 signaling has been the subject of only limited modeling, and none of the existing models have been based on data from human adipocytes. With little effect of insulin by itself, insulin potentiation of EGF signaling to ERK1/2 has been analyzed in HEK cells (15); the dynamics of insulin-EGF-TNF signal interaction has been analyzed in human carcinoma cells using fuzzy logic (16); and control of ERK1/2 by insulin has been subject to theoretical modeling not based on data (17).
Herein we have collected internally consistent and directly comparable quantitative network-wide dynamic and steady-state data on insulin control of glucose transport, protein synthesis, and ERK1/2- and Elk1-mediated nuclear transcription in human adipocytes, isolated in parallel from non-diabetic and diabetic subjects. Based on these data, we present a comprehensive dynamic model of the insulin signaling network. Analyses of the model in the normal and diabetic states define a single mechanism that can explain the insulin resistance and demonstrate how the insulin resistance propagates throughout the signaling network.
EXPERIMENTAL PROCEDURES
Subjects
Informed consent was obtained from all participants. Procedures were approved by the ethics board, Linköping University, and were performed in accordance with the WMA Declaration of Helsinki. Subcutaneous fat was obtained from elective abdominal surgery during general anesthesia. A slice of subcutaneous tissue from skin to muscle fascia was excised. Subjects were recruited consecutively from elective surgery at the University Hospital in Linköping. To ensure inclusion only of patients with T2D related to obesity, they were selected when diagnosed with T2D and obese/overweight (BMI > 27). In the comparison group, the only selection criterion for non-diabetic subjects was that they were not diagnosed with diabetes. Thus, there will be some obese insulin-resistant subjects in the non-diabetic comparison group (patient data are given in the respective figure legend). This approach allows for examination of the common obesity-related T2D and for a wide significance of the results.
Materials
Rabbit anti-phospho-p70S6K-Thr389 (catalog no. 9205), anti-phospho-S6-Ser235/236 (catalog no. 2211), anti-phospho-ERK1/2-Thr202/Tyr204 (catalog no. 9101), and anti-phospho-IRS1-Ser302 (murine sequence, catalog no. 2384) were from Cell Signaling Technology (Danvers, MA). Monoclonal mouse anti-β-tubulin antibodies were from Sigma-Aldrich (T5201), and anti-actin (Sc-1616), anti-phospho-Elk1-Ser383 (Sc-8406), and anti-Elk1 (Sc-22804) antibodies were from Santa Cruz Biotechnology, Inc. Rapamycin and other chemicals were from Sigma-Aldrich unless otherwise stated.
Isolation and Incubation of Adipocytes
Adipocytes were isolated from subcutaneous adipose tissue by collagenase (type 1; Worthington) digestion as described (18). Cells were incubated in a shaking water bath in supplemented Krebs-Ringer solution as described (19). 100 nm phenylisopropyladenosine and 0.5 units/ml adenosine deaminase were added to the cells 10–20 min before the indicated treatment (18, 20).
SDS-PAGE and Immunoblotting
Cell incubations were terminated by separating cells from medium using centrifugation through dinonylphtalate. To minimize postincubation signaling and protein modifications, cells were immediately dissolved in SDS and β-mercaptoethanol with protease and protein phosphatase inhibitors, frozen within 10 s, and thawed in boiling water for further processing, as described (18). Immunoblotting after SDS-PAGE (19) was evaluated by chemiluminescence imaging (Las 1000, Image-Gauge, Fuji, Tokyo, Japan). After adjusting the concentration of primary and secondary antibodies, the linearity of the chemiluminiscence signal to the amount of each specific protein was ascertained. β-Tubulin was used as a loading control, and all samples were normalized for the amount of β-tubulin. The total amount of ERK1/2 or Elk1 protein in the adipocytes did not change during incubation with insulin (see “Results”); hence, the determined total phosphorylation of ERK1/2 and Elk1 represents the extent of their phosphorylation. For comparison of the level of phosphorylation between subjects, a standard mix of adipocyte proteins was run in duplicate on each gel so that all samples were normalized to the mean intensity of the corresponding phosphorylated protein in the standard mix.
Confocal Microscopy of Adipocytes
The cells were fixed in 3% paraformaldehyde for 15 min and attached to poly-l-lysine-coated coverslips. Coverslips were then washed in glycine (50 mm)/phosphate buffer (137 mm NaCl, 2.7 mm KCl, 10 mm Na2HPO4, and 1.8 mm KH2PO4). Cells were permeabilized in 0.1% saponin and blocked with 3% normal horse serum with 1% bovine serum albumin in phosphate buffer for 1 h at 37 °C. Incubation with primary antibody ERK1 (K-23: sc-94, Santa Cruz Biotechnology) was overnight at 4 °C. Following washes, cells were incubated with fluorescent secondary antibody (Alexa Fluor 488, Molecular Probes, Eugene, OR) for 2 h at room temperature. Confocal scanning microscopy was performed with a LSM 700 (Carl Zeiss, Jena, Germany).
Mathematical Modeling and Model Simulation
We formulated ordinary differential equation models in the Systems Biology Toolbox for Matlab (21, 22). To reduce the number of parameters, we used mass action kinetics in the rate equations. We first simulated a steady-state using in total 100% of each protein as initial conditions, and second, we simulated the effect of insulin with the obtained steady state as initial conditions to the states in the model. The evaluated mathematical models are described in detail in the supplemental material.
Parameter Estimation
Values of model parameters for the insulin signaling system have not been measured experimentally in human adipocytes. We instead estimated values of the parameters using the ordinary differential equation model and experimental data using optimization algorithms to test different parameter values within realistic limits (10−6 to 104). To evaluate the agreement between simulated outputs of the model and experimental data, commonly referred to as the cost, we used the sum of squares of the residuals weighted by the data variance. The data variance was estimated by the S.E. because the model describes a mean cell. We used a modified version of the simannealingSBAO function in the Systems Biology Toolbox to search through the parameter space. In our modified version, the simulated annealing approach in simannealingSBAO is complemented with not a single but multiple downhill simplexes to enable us to find different areas in the parameter space with acceptable parameters (1, 23). We approximate the set of found acceptable parameters by simulating the model for all extreme acceptable parameter sets (i.e. the parameter sets that contain a maximum or a minimum value of one of the parameters in the set). We use this approximation of acceptable parameters in the search for uniquely defined predictions (i.e. core predictions) (1, 23). We also search for extreme values for predictions with a modified optimization algorithm that maximize or minimize the prediction, still fitting with original data (23). We use a slightly different method to maximize or minimize the prediction. Instead of increasing the contribution of the prediction to the cost until the fit with data is not acceptable, as presented in step 2 in Ref. 23, we use an extra cost for deviation from a certain value of the prediction and go through the different possible values of the prediction (25). As a final check of rejected hypotheses, we use step 3 in Ref. 23, originally introduced in Ref. 1 (i.e. we try to find parameters that fit with both the original data and the newly obtained data that we use to compare with core predictions).
Statistical Analysis
In the hypothesis-testing approach, we test the agreement between model simulations and experimental data using χ2 statistical tests. We calculated the number of used experimental data points for IRS1 and ERK1/2 phosphorylation (18 + 14 = 32) and compensated for normalization of data when we approximated the degrees of freedom (32 − 4 = 28) and calculated the threshold for rejection for the χ2 test using 95% as the level of significance (χ2 (28, 0.95) = 41). We compared the sum of squares of the residuals weighted by the data S.E. for the best found parameters with the threshold to decide upon rejection.
All experimental values are mean ± S.E. for the indicated number (n) of cell preparations, which is the same as the number of different subjects. One-sample or Student's t test were used, with p < 0.05 considered significant.
RESULTS
The Dynamics of ERK1/2 Phosphorylation in Response to Insulin
We analyzed the time course for phosphorylation of ERK1/2 in response to insulin in cells from non-diabetic individuals (Fig. 2A, blue). The phosphorylation peaks around 10 min and then reverts back to basal at 60 min. This is qualitatively different from the dynamics of insulin signaling in the parallel signaling branch to glucose uptake, which has a faster response and no tendency to decrease back to basal level during 60 min with insulin (3). The ERK1/2 response is also qualitatively different from the upstream phosphorylation of the insulin receptor (IR) and IRS1 at tyrosine (Fig. 3A), which peak with an overshoot at 1 min and then remain at an elevated steady-state level (3). We have earlier described how the dynamics of phosphorylation of IR and IRS1 are explained by a feedback to IR (1). In order to include the ERK1/2-signaling branch in a detailed insulin signaling model, we will here identify and analyze mechanisms that may transform the dynamics of upstream phosphorylation of IR and IRS1 into the slower onset of phosphorylation and the return to basal steady-state level of the downstream phosphorylation of ERK1/2.
FIGURE 2.
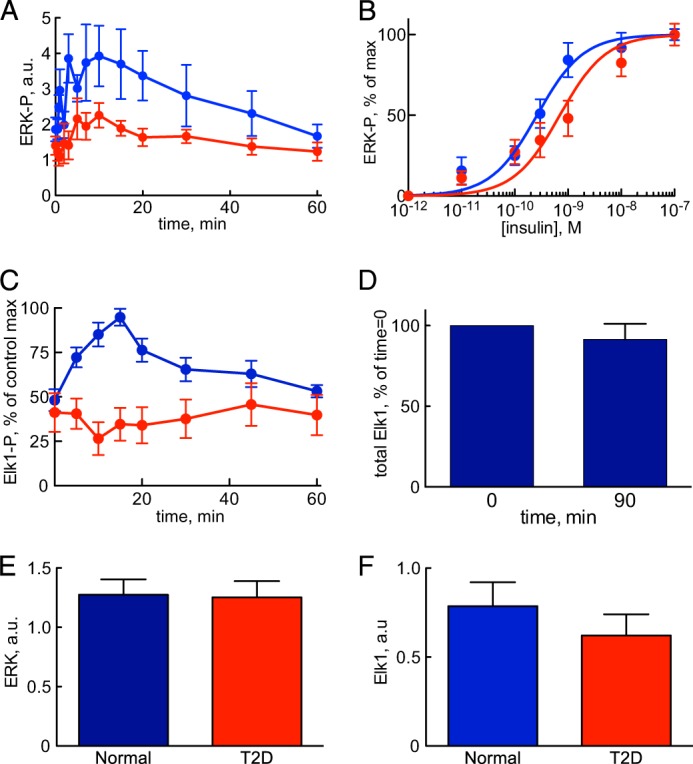
Insulin control of phosphorylation of ERK1/2 and Elk1 normally and in T2D. Shown are results from adipocytes obtained from non-diabetic controls (blue) and from patients with T2D (red). Shown are the average ± S.E. (error bars) of cell preparations from the indicated number of subjects. Examined phosphorylation sites are shown in Fig. 1. A, time course for phosphorylation of ERK1/2-Thr202/Tyr204-P in response to 10 nm insulin for the indicated times. Adipocytes from seven non-diabetic control subjects (age 31–72, average 54 years; BMI 24–47, average 30 kg/m2) and seven patients with type 2 diabetes (age 27–79, average 61 years; BMI 28–60, average 39 kg/m2) were analyzed. B, dose response for phosphorylation of ERK1/2-Thr202/Tyr204-P in response to indicated concentration of insulin for 10 min. Adipocytes from 12 non-diabetic control subjects (age 29–77, average 58 years; BMI 22–39, average 27 kg/m2) and 13 patients with type 2 diabetes (age 48–76, average 61 years; BMI 28–48, average 36 kg/m2) were analyzed (59). C, time course for phosphorylation of Elk1-Ser383-P in response to 10 nm insulin for the indicated times. Adipocytes from five non-diabetic control subjects (age 51–61, average 58 years; BMI 25–28, average 26 kg/m2) and five patients with type 2 diabetes (age 44–82, average 67 years; BMI 29–52, average 40 kg/m2) were analyzed. D, total amount of Elk1 protein in adipocytes before and after incubation with insulin. Adipocytes were incubated without or with insulin for 90 min, when the total amount of Elk1 protein was determined by SDS-PAGE and immunoblotting. Results expressed as a percentage of time 0 ± S.E., n = 3 cell preparations from different subjects. E, total amount of ERK1/2 protein. Adipocytes from 11 non-diabetic control subjects (age 33–91, average 63 years; BMI 19–30, average 25 kg/m2) and 10 patients with type 2 diabetes (age 28–81, average 54 years; BMI 27–49, average 36 kg/m2) were analyzed. F, total amount of Elk1 protein. Adipocytes from 10 non-diabetic control subjects (age 33–91, average 61 years; BMI 19–30, average 25 kg/m2) and 10 patients with type 2 diabetes (age 28–81, average 54 years; BMI 27–49, average 36 kg/m2) were analyzed. a.u., arbitrary units.
FIGURE 3.

Minimal model analysis of ERK1/2 dynamics; rejected hypotheses. Model structures with insulin signal input to control of ERK1/2, via IR and IRS1 (1). Reactions of ERK1/2 are shown with arrows; phosphorylated ERK1/2 is shown with a circled P. A, different dynamics of phosphorylation of IRS1 and of ERK1/2 in response to insulin. Experimental observations after the addition of 10 nm insulin reveal a late time of maximal ERK1/2-Thr202/Tyr204-P and a return to basal level (bottom; data from Fig. 2), compared with IRS1-YP (from Ref. 1), which exhibits an elevated steady-state level of ∼50% of the maximal level (top). B–E, hypothesis H1(ERK1/2 degradation). B, model structure. φ, ERK1/2 degradation. C, model simulation (line) for ERK1/2 phosphorylation dynamics. The best agreement with data (dots ± S.E.) is shown. D, total amount of ERK1/2 must be reduced to 60% at 90 min if the degradation hypothesis shall describe the dynamics of ERK1/2 phosphorylation. The different lines correspond to different simulations with stepwise reduction of total amount of ERK1/2 at 90 min while also fitting with ERK1/2 phosphorylation dynamics. E, experimental test of the prediction; the total amount of ERK1/2 was not significantly reduced at 90 min incubation with insulin, average ± S.E. in cells from three subjects. F and G, hypothesis H2 (negative/positive feedback). F, model structure. FB, the dynamic state that governs the negative or positive feedback. G, negative feedback mechanisms cannot describe ERK1/2 phosphorylation dynamics. The best agreement between the model (line) and data (dots ± S.E.) is shown. H–K, hypothesis H3 (cross-feedback). H, model structure. FB, the dynamic state that governs the negative cross-feedback. I, model simulation (line) for ERK1/2 phosphorylation dynamics. The best agreement with the data (dots ± S.E.) is shown. J, simulations for an approximation of all acceptable parameters reveal a slow insulin response with maximal activation of the feedback after >60 min. K, rapamycin inhibition of mTORC1 did not significantly increase the ERK1/2-Thr202/Tyr204 phosphorylation at 60 min of incubation with insulin, average ± S.E. in cells from five subjects (for experimental details, see Fig. 6E). a.u., arbitrary units.
Test of Mechanisms for the Phosphorylation Dynamics of ERK1/2
We used our previously developed approach involving minimal models, model rejections, and uniquely identified predictions that account for the uncertainty in the data, combined with experimental tests using adipocytes from non-diabetic individuals (1, 26). Note that this approach identifies possible mechanisms through rejection of several non-sufficient mechanisms. Herein we identified and tested six different potential mechanisms (Figs. 3 and 4, hypotheses H1–H6) with the IR-to-IRS1 signaling model presented in Ref. 1 as input to the different small/minimal models of ERK1/2 signaling.
FIGURE 4.

Minimal model analysis of ERK1/2 dynamics, an accepted hypothesis. Reactions of ERK1/2 are shown with arrows; phosphorylated ERK1/2 is shown with a circled P. Model structures with insulin signal input to control of ERK1/2, via IR and IRS1 (1). The accumulating ERK1/2 state is shown in light gray, and dashed arrows are shown for reaction rates that have to be slow for the hypotheses to explain ERK1/2 dynamics. A, the model structure of hypothesis H4 (nuclear translocation) and the best fit simulation (line) compared with data (dots ± S.E.). B, the model structure of hypothesis H5 (dual phosphorylation) and the best fit simulation (line) compared with data (dots ± S.E.). C, the model structure of hypothesis H6 (scaffolding) and the best fit simulation (line) compared with data (dots ± S.E.). D–G, a common minimal model. D, the minimal model of ERK1/2 phosphorylation dynamics consists of three states, three rate reactions (v1–v3), and three parameters. E, simulations for an approximation of all acceptable parameters (lines) show the agreement with data (dots ± S.E.). F, simulations that agree with data reveal that the sequestered pool of ERK1/2 has to be >40%. G, simulations that agree with data show that the ratio between ERK1/2 transition (v3) and ERK1/2 dephosphorylation (v2) is always <1 (i.e. the transition is always slower than the dephosphorylation). a.u., arbitrary units.
Hypothesis H1; Degradation of ERK1/2
It has been shown that stress, but not growth factor stimulation, induces degradation of ERK1/2 after >3 h (27). A minimal model of degradation of ERK1/2 after phosphorylation (Fig. 3B) can indeed explain the experimental data with a slow return to basal levels (Fig. 3C) (χ2(H1) = 32 < 41). A search for parameters that minimize the required extent of degradation while still agreeing with data (23, 28) showed that a statistically acceptable fit required that >40% ERK1/2 is degraded after 90 min (Fig. 3D). Examination of this prediction experimentally demonstrated that maximally 10% of ERK1/2 was degraded after 90-min stimulation with insulin (Fig. 3E), resulting in rejection of this hypothesis.
Hypothesis H2; Negative or Positive Feedback
Several negative and positive feedbacks from ERK1/2 to upstream signaling proteins (reviewed in Ref. 30) have been described and modeled in other cell types (31–36). In a minimal model structure (Fig. 3F), we examined a negative or positive feedback from downstream ERK1/2, but we could not find a statistically good enough fit between model simulations and data for any parameters (Fig. 3G) (χ2(H2) = 48 > 41). Therefore, this negative/positive feedback hypothesis was rejected without further analysis. This does not exclude the existence of feedbacks and only means that a simple feedback in the pathway cannot explain the conversion of IR/IRS1 dynamics into the dynamics of ERK1/2 phosphorylation.
Hypothesis H3; Cross-feedback
We also tested if a negative feedback from a different branch of insulin signaling can cause the reduced phosphorylation of ERK1/2 (Fig. 3H). We found an agreement between model simulations and data (Fig. 3I) (χ2(H3) = 31 < 41). The agreement required a slow onset of the negative feedback such that maximal effect is obtained after >60 min (Fig. 3J). The only insulin-signaling branch that is known to exhibit such behavior is signaling downstream mTORC1 to phosphorylation of S6K (3). Thus, a negative signal from mTORC1/S6K to phosphorylation of ERK1/2 can explain the dynamics of ERK1/2 phosphorylation. We tested this particular hypothesis experimentally by inhibiting mTORC1 with rapamycin and determined the extent of phosphorylation of ERK1/2 after 60 min with insulin (Fig. 3K). However, the transient phosphorylation of ERK1/2 was not prevented from returning to basal level by inhibition of mTORC1. We therefore also rejected the cross-feedback hypothesis as an explanation.
Hypothesis H4; Translocation of ERK1/2 into the Nucleus
ERK1/2 translocates into the nucleus upon activation. We tested a minimal model for nuclear translocation where phosphorylated ERK1/2 enters the nucleus (Fig. 4A, top). In the nucleus, dephosphorylation occurs before ERK1/2 can translocate back to the cytosol. For the nuclear translocation hypothesis, there are parameters that give model simulations in agreement with the experimental data (Fig. 4A, bottom), and the hypothesis was not rejected (χ2(H4) = 32 < 41).
Hypothesis H5; Dual Phosphorylation of ERK1/2
MEK1/2 phosphorylates ERK1/2 at both threonine 202 and tyrosine 204, and this process has been extensively modeled with a particular emphasis on the phosphorylation mechanism, where the dual phosphorylation either occurs on the first encounter between MEK1/2 and ERK1/2 (processive mechanism) or requires dissociation and rebinding for the second-site phosphorylation (distributive mechanism) (37, 38). A minimal model of this dual phosphorylation process (Fig. 4B, top) could also explain the observed behavior of ERK1/2 phosphorylation (Fig. 4B, bottom), and the hypothesis was not rejected (χ2(H5) = 32 < 41).
Hypothesis H6; Scaffolding of ERK1/2
Scaffolds can facilitate signal transduction, segregate signaling pathways from cross-talk, and target signals to specific locations in the cell (14). The effects of scaffolding proteins in ERK1/2 signaling in other cell types have been examined with mathematical modeling approaches (39–43). We tested a minimal model where phospho-ERK1/2 binds and remains bound after dephosphorylation and is thus not immediately available for rephosphorylation (Fig. 4C, top). The same model applies to the reverse situation, where ERK1/2 is phosphorylated on the scaffold, released, and cannot rebind after dephosphorylation. Also this hypothesis can explain experimental data (Fig. 4C, bottom) and was therefore not rejected (χ2(H6) = 32 < 41).
One Minimal Model That Explains Hypotheses H4–H6
We found that the three hypotheses that we could not reject (H4 (nuclear translocation), H5 (dual phosphorylation), and H6 (binding to a scaffolding protein)) exhibit the same crucial feature, namely a pool of dephosphorylated ERK1/2 that is temporarily unavailable for rephosphorylation and is therefore accumulating after insulin stimulation (Fig. 4, marked in light gray). The three acceptable hypotheses can therefore be reduced to a common minimal model (Fig. 4D) that explains the experimental data (Fig. 4E). We analyzed this minimal model to search for general behaviors, such as core predictions (1, 23), and analyzed an approximation of the parameters that agreed with the data. The analysis showed that >40% of ERK1/2 has to be in the unavailable pool (Fig. 4F), and the transition between the non-phosphorylated pools of ERK1/2 is always slower than the rate of dephosphorylation (Fig. 4G). These two predictions are in concord with different pools of ERK1/2 that have been described (44–47). To test these predictions in human adipocytes, we examined the localization of ERK1/2 by immunofluorescence labeling and confocal microscopy. There was a strong concentration of ERK1/2 in the nuclear region (Fig. 5), a finding that is compatible with sequestration of a significant fraction of ERK1/2. It should be noted that the peculiar architecture of the mature adipocyte, with a central lipid droplet leaving only a thin film of cytosol between the droplet and the plasma membrane (Fig. 5), severely restricts signaling from the majority of insulin receptors to the perinuclear compartment.
FIGURE 5.

Localization of ERK1/2 in a human adipocyte. Adipocytes were immunostained with fluorescent antibodies against ERK1 (green fluorescence), stained for nuclei with DAPI (blue fluorescence) (A and C), and examined by fluorescence confocal microscopy. One cell is shown, with a single plane through the nucleus (A and B) and a three-dimensional stack of the perimeter of the cell containing the nucleus (C and D). A scale bar is also shown.
The Minimal ERK1/2 Model Extends the Detailed Insulin Signaling Model
Based on the minimal model for the dynamics of phosphorylation of ERK1/2 (Fig. 4D), we introduced an ERK1/2-signaling module in the insulin signaling model (3) and searched for parameters for the new reactions. The combined model does not directly concern intricacies of the signaling pathway between IRS1 and ERK1/2 but rather how that pathway as a whole transmits the insulin signal in the insulin signaling network. Simulation with the best found parameter values demonstrated a close correspondence with experimental data (Fig. 6A, blue).
FIGURE 6.

Comparison of model simulations with experimental data for ERK1/2 and Elk1 phosphorylation in the non-diabetic and T2D states. Shown are model simulations (lines) and experimental data (dots with error bars (S.E.); from Fig. 1) for the non-diabetic state (blue) and in T2D (red). A, time course of ERK1/2-Thr202/Tyr204-P in response to 10 nm insulin for the indicated times, scaled with a normalization constant for best fit with experimental data normally. B, dose response of ERK1/2-Thr202/Tyr204-P in response to the indicated concentrations of insulin for 10 min and normalized 0–100%. C, time course of Elk1-Ser383-P in response to 10 nm insulin for the indicated times, scaled with a normalization constant for best fit with experimental data normally. D, simulations of model variable ERK1/2-Thr202/Tyr204-P (blue) when the effect of mTORC1 inhibitor rapamycin is implemented as reduced mTORC1 activation by 50, 75, 83, 88, 90, 92, and 93% (cyan). E, effect of 50 nm rapamycin (cells preincubated 30 min) on the time course for phosphorylation of ERK1/2-Thr202/Tyr204 in response to 10 nm insulin for the indicated times. Adipocytes from five non-diabetic control subjects (age 51–66, average 60 years; BMI 18–27, average 24 kg/m2) were analyzed. F, insulin signaling for control of ERK1/2 and Elk1 phosphorylation, normally and in T2D. For more details, see the legend to Fig. 1. a.u., arbitrary units.
Phosphorylation of ERK1/2 in Response to Different Concentrations of Insulin
We next examined the phosphorylation of ERK1/2 in response to different concentrations of insulin, using cells from non-diabetic individuals (Fig. 2B, blue). Half-maximal effect (EC50) of insulin was obtained at 0.2 nm insulin, which is similar to the phosphorylation of upstream IRS1 by the insulin receptor (3). Therefore, no modification was required in the model structure (Fig. 6B, blue). Strikingly, the alignment of the dose-response curves in the signaling cassette IRS1-Grb2-Sos-Ras-Raf-Mek1/2-ERK1/2 is in sharp contrast to the 10-fold increase in insulin sensitivity4 in the parallel IRS1-PI3K-PKB-AS160 cassette mediating insulin control of glucose uptake (3). The function of this difference in insulin signal transduction is not known, but it has been shown in yeast cells that alignment of dose-response curves, due to negative feedback signals, in MAPK signaling allows for higher fidelity in signal transmission (48).
Phosphorylation of Elk1 in Response to Insulin
We then examined the phosphorylation of the nuclear transcription factor Elk1 by ERK1/2 in response to insulin in the human adipocytes. The time course for phosphorylation of Elk1 (Fig. 2C, blue) largely reflects that of the phosphorylating protein kinase ERK1/2 (Fig. 2A, blue). The amount of Elk1 protein did not change during the 90-min course of the experiment (Fig. 2D). A model based on mass action kinetics is sufficient to describe the dynamics of ERK1/2-catalyzed phosphorylation of Elk1 in the model of insulin signaling (Fig. 6C, blue).
The congruent time courses for phosphorylation of total ERK1/2 and of Elk1 (both are transient and with no significant delay between them) suggest that total phospho-ERK1/2 reflects active ERK1/2 in the nucleus, similarly to EGF stimulation of ERK1/2 in U138 glioblastoma cells (49). In contrast, a mismatch between phospho-ERK1/2 and ERK1/2 activity in the nucleus of a mouse fibroblast cell line, in response to high concentrations of platelet-derived growth factor, was explained by ERK1/2 binding to high affinity substrates (50).
Phosphorylation of ERK1/2 and Elk1 in T2D
We also investigated the phosphorylation of ERK1/2 and its nuclear substrate Elk1 in response to insulin in human adipocytes from obese patients with T2D. The time course for phosphorylation of ERK1/2 in response to insulin revealed that the maximal response to insulin was significantly curtailed in diabetes (Fig. 2A, red). The response time, however, was not affected in the diabetic cells. The maximal phosphorylation of Elk1 was similarly attenuated in the cells from patients with diabetes (Fig. 2C, red). The total amount of ERK1/2 (Fig. 2E) or of Elk1 (Fig. 2F) protein was not significantly different in adipocytes from the patients with T2D compared with adipocytes from non-diabetic control subjects.
The phosphorylation of ERK1/2 in response to increasing concentrations of insulin revealed that EC50 was increased from EC50 of about 0.2 nm insulin normally to about 0.7 nm insulin in diabetes (Fig. 2B, red). Compared with the upstream signaling, phosphorylation of ERK1/2 displayed a smaller increase, in diabetes, than the 10-fold increase of EC50 for phosphorylation of IRS1 by IR (3) and a larger increase than the unchanged autophosphorylation of IR in diabetes (3). To capture the intermediate extent of increase in EC50 for phosphorylation of ERK1/2 in the diabetic state of the model, we allowed the ERK1/2 signaling branch to be activated both via IRS1 (large increase in EC50) and directly from IR (no change in EC50). We have previously shown that in human mature adipocytes, insulin control of the phosphorylation of ERK1/2 and the transcription factor Elk1 involves IRS1 (51), but the activation of the ERK1/2 signaling branch can also be mediated via a second adapter protein (cf. Ref. 52).
We have earlier identified three fundamental differences between insulin signaling for metabolic control in normal and in diabetic adipocytes (i.e. (i) a reduced concentration of insulin receptor by 45%, (ii) a reduced concentration of insulin-regulated glucose transporter 4 (GLUT4) by 50%, and (iii) an 85% reduced positive feedback from mTORC1 to IRS1 (3)). These three diabetes parameters were sufficient to describe the diabetes data also for phosphorylation of ERK1/2 (Fig. 6, A and B, red) and Elk1 (Fig. 6C, red) in response to insulin. This means that ERK1/2 signaling in the diabetic state can be explained by the same mechanism as the diabetic state in the metabolic branches of insulin signaling.
To confirm this mechanism and the crucial role of the feedback from mTORC1 to IRS1 in the diabetic state, we examined how inhibition of mTORC1 affects insulin control of ERK1/2 phosphorylation (Fig. 6F). Model simulations predict that progressive inhibition (50–93% inhibition) of the feedback should progressively inhibit insulin stimulation of ERK1/2 phosphorylation (Fig. 6D). Experimental inhibition of mTORC1 with rapamycin induced the diabetic phenotype in the non-diabetic cells (Fig. 6E) precisely as the model predicts and in close agreement with experimental data for the diabetic state (Fig. 2A, red).
ERK1/2 Cross-talk with mTORC1 in Control of S6 Phosphorylation
Inhibition of the phosphorylation and activation of ERK1/2, using either of two different MEK1/2 inhibitors, PD184352 (Fig. 7A) or U0126 (not shown), blocked the phosphorylation of ERK1/2 in response to insulin in the human adipocytes. Interestingly, this inhibition of ERK1/2 activation also inhibited the phosphorylation of ribosomal protein S6 at serine residues 235/236 by about 50% in response to maximal insulin stimulation (Fig. 7, B and E). This reveals a significant cross-talk between insulin signaling through the ERK1/2 pathway and through the mTORC1 pathway for control of protein synthesis. In contrast, the inhibition of ERK1/2 activation had no significant effect on phosphorylation of S6K1 at threonine 389 (Fig. 7C), which mediates insulin stimulation of S6 phosphorylation through the branch PKB-mTORC1-S6K1 of insulin signaling. Likewise, the inhibition had no significant effect on the mTORC1-mediated phosphorylation of IRS1 at serine 307 (Fig. 7D), which mediates the positive feedback. It is hence most likely that the insulin-stimulated phosphorylation of S6 via ERK1/2 is mediated by phosphorylation and activation of p90 ribosomal S6 kinase (RSK) by ERK1/2 (53) (reviewed in Ref. 54). Moreover, contrary to other cell types (reviewed in Ref. 55), our findings indicate that there is little, if any, activation of S6K or mTORC1 via ERK1/2 in response to insulin in human adipocytes. We thus introduced a signal path from ERK1/2 to phosphorylation of S6 in the insulin signaling model (Fig. 7G). We used the PD184352 inhibition data to quantify the contribution of ERK1/2 to the phosphorylation of S6. Simulations with 50–93% inhibition of ERK1/2 activation are shown in Fig. 7F (yellow lines). Inhibition of mTORC1 with rapamycin or with rapamycin in combination with PD184352 also inhibited the phosphorylation of S6 and S6K1 (Fig. 7, B and C). The corresponding simulations with 50–93% inhibition are shown in Fig. 7F (cyan and green lines).
FIGURE 7.

ERK1/2 versus mTORC1 phosphorylation of S6, effects of MEK1/2 inhibitor PD184352/U0126 and mTOR inhibitor rapamycin. Cells were preincubated with DMSO (vehicle), 10 μm U0126, 10 μm PD184352, and/or 50 nm rapamycin for 30 min, as indicated, before incubating with 10 nm insulin for 10 min (ERK1/2 and IRS1) or 30 min (S6 and S6K1). Quantified phosphorylation data are normalized to the effect of insulin in control. Mean ± S.E. (error bars) is shown; n = number of cell preparations from different subjects. Shown is the effect of MEK1/2 inhibitor PD184352 (yellow), mTORC1 inhibitor rapamycin (cyan), or PD184352 + rapamycin (green), compared with vehicle/control (blue), on phosphorylation of ERK1/2 at Thr202/Tyr204 rapamycin (n = 5) compared with control (n = 5) (A) or S6 at Ser235/236, PD184352 (n = 7), rapamycin (n = 3), and PD184352 + rapamycin (n = 3) compared with control (n = 7) (B); or S6K1 at Thr389, PD184352 (n = 6), rapamycin (n = 4), and PD184352 + rapamycin (n = 6) compared with control (n = 6) (C); or IRS1 at Ser307, PD184352 (n = 6) compared with control (n = 6) (D). E, effect of MEK1/2 inhibitor U0126 (yellow) compared with vehicle/control (blue) on phosphorylation of S6 at Ser235/236. F, simulations of model variables ERK1/2-Thr202/Tyr204-P, S6-Ser235/236-P, and S6K-Thr389-P (blue) compared with the effect of MEK1/2 inhibitor PD184352 implemented as reduced activation of ERK1/2 by 50, 75, 83, 88, 90, 92, and 93% (left panels, yellow); mTORC1 inhibitor rapamycin implemented as reduced mTORC1 activation by 50, 75, 83, 88, 90, 92, and 93% (middle panels, cyan); or the combined effect of PD184352 + rapamycin implemented as a combination of the two effects (right panels, green). The time points for corresponding experiments in A–C are indicated with gray bars. G, insulin signaling network with the cross-talk from ERK1/2 to S6. Indicated in yellow text is the inhibition of MEK1/2-catalyzed phosphorylation of ERK1/2 by PD184352/U0126, and shown in blue text is the inhibition of mTORC1 with rapamycin. For more details, see the legend to Fig. 1. a.u., arbitrary units.
Analysis of the Comprehensive Insulin Signaling Model
We simulated our comprehensive model of the insulin signaling network (Fig. 8) for both control via PKB-AS160 (glucose uptake) and PKB-mTORC1 (protein synthesis, autophagy) and control via ERK1/2-Elk1 (nuclear transcription), both normally and in the diabetic state (attenuated mTORC1-to-IRS1 feedback, reduced concentration of IR, and reduced concentration of GLUT4), including the cross-talk from ERK1/2 to S6. Simulation with the best found parameters demonstrates a network-wide good correspondence with experimental data, normally and in T2D (Fig. 9).
FIGURE 8.

Structure of the complete mathematical model for insulin signaling in human adipocytes. Model equations are described in detail in the supplemental material. Indicated are the rate of reactions (v1a–v11b) and phosphorylation sites (YP, S307P, etc.). Heavy arrows represent transitions between states of the same protein, and arrows represent activation/deactivation. The three diabetes parameters are indicated.
FIGURE 9.

A comprehensive dynamic model of insulin signaling. Shown are model simulations (lines) for insulin signaling normally (blue) and in T2D (red) and comparison with the corresponding experimental data (dots and error bars (S.E.)) for the indicated signaling intermediaries. The experimental data are explained in the legend to Fig. 2 and in Ref. 3. T2D is simulated with the three diabetes parameters: 45% reduced concentration of IR, 50% reduced concentration of GLUT4, and 85% reduced mTORC1-to-IRS1 feedback. a.u., arbitrary units.
This demonstrates that a single mechanism (attenuated mTORC1-to-IRS1 feedback, reduced concentration of IR, and reduced concentration of GLUT4) can explain the network-wide impairment of insulin signaling in T2D. With the model we examined the individual contributions of the three diabetes parameters (Fig. 8). The reduced concentration of GLUT4 only contributes locally to reduce maximal glucose uptake (Fig. 10, black dotted line). The reduced concentration of IR primarily has a local effect on the maximal phosphorylation/internalization of IR but otherwise marginally contributes to the diabetic state (Fig. 10, red dotted line). Importantly, the attenuation of the positive feedback from mTORC1 to IRS1 can explain much of the diabetic state throughout the insulin signaling network, including ERK1/2 and Elk1 (Fig. 10, red dashed line).
FIGURE 10.

Simulating individual effects of the three diabetes parameters in the comprehensive dynamic insulin signaling model. Shown are model simulations of insulin signaling normally (blue solid lines) and in T2D (red solid lines) for indicated signaling intermediaries. The effect of reducing the IR concentration to 55% of normal is a slight reduction of the activation of most signaling intermediaries (red dotted lines). Reducing the GLUT4 concentration by 50% influences solely the total level of glucose uptake (black dotted lines, shown only in the graph of total glucose uptake). The main contribution to the T2D state is the reduction of the mTORC1-IRS1 feedback to 15% (red dashed lines) of normal, which affects both maximal activation and insulin sensitivity for all signaling intermediaries that are affected in the T2D state. a.u., arbitrary units.
DISCUSSION
The mechanisms of insulin signaling and its malfunction in the insulin resistant state of T2D have been the subject of intense research and much data and knowledge have accumulated. Experimental studies have provided evidence that the insulin resistance can be detected in different parts of the signaling network, but there is no consensus regarding where this resistance mechanistically originates and how it spreads to the rest of the network. We have taken a systems approach to unravel these mechanisms. A key component of this approach was to collect internally consistent sets of data that cover the whole network, data that were obtained under the same conditions and from the same cell type and therefore are comparable. A second key component was mathematical modeling. In a first step, minimal models allowed us to test different potential mechanisms. In a second step, the resulting mechanism was inserted into a comprehensive detailed model of insulin signaling. This approach thus allowed us to systematically put the pieces of the insulin signaling network together and to analyze signaling through the entire network as a whole. With this analysis, we could make a direct quantitative comparison of signaling in the normal and diabetic states of the network.
The most important aspect of our findings is that a single mechanism can explain the insulin resistance of T2D through all examined branches of the insulin signaling network: signaling through IRS1, PKB, mTOR, and ERK1/2. The dominant part of the insulin resistance mechanism is an attenuated feedback from the protein kinase mTORC1 to IRS1, which attenuates signaling in all parts of the signaling network (Fig. 10, red dashed line). We confirmed this mechanism experimentally by inhibiting mTORC1, which largely reproduced model predictions for insulin control of ERK1/2 (Fig. 6, D and E), as well as IRS1 (56), glucose transport (57), protein synthesis (3), and autophagy (58). The primacy of attenuation of mTORC1 activity in insulin resistance is compatible with previous data that implicate, for example, endoplasmic reticulum stress, inflammation, hypoxia, and mitochondrial dysfunction as potential causes of insulin resistance because all of these factors are well known to inhibit mTORC1 signaling. There is, however, no a priori reason to expect that the same mechanism of insulin resistance that we have identified in adipocytes from human beings is operational in other tissues or even in adipocytes from other species.
We (3, 56, 58–60) and others (61, 62) have previously found that phosphorylation of IRS1 at serine 307 in response to insulin is coupled to a positive feedback. In particular, our earlier mathematical model analysis showed that a positive feedback best explained data for the whole system (3). The feedback to IRS1 serine 307 fits the bill, but parallel phosphorylation of IRS1 at other sites may convey or add to the positive feedback signal.
The internal consistency of our data allows us to draw strong conclusions (i.e. reject hypotheses that are incompatible with the data) and thus systematically untangle the mechanisms of signaling. We do this with a combination of small/minimal models, model predictions, and experimental tests of predictions. The analysis shows that experimental data for ERK1/2 phosphorylation dynamics can be explained by dephosphorylated ERK1/2 being temporarily made unavailable for phosphorylation by MEK1/2 but cannot be explained by simple feedback mechanisms to upstream intermediaries, by feedback from other known parts of the insulin signaling network, or by degradation of ERK1/2. This unavailable state can be interpreted as ERK1/2 sequestered in the nucleus or at other cellular structures, which is a plausible explanation because sequestration of ERK1/2 has been described in many systems (44–47). Similarly, sequestration of upstream signaling components (14, 39) could also explain the transient dynamics of ERK1/2 phosphorylation.
Our findings identify a significant cross-talk between ERK1/2 and mTORC1 pathways for insulin control of ribosomal protein S6 and hence protein synthesis. Because inhibition of ERK1/2 phosphorylation did not affect the phosphorylation of p70-S6K1, we can exclude ERK1/2- or p90-RSK-catalyzed phosphorylation of both mTORC1 and S6K1 (63, 64). Our findings show that, in mature human adipocytes, ERK1/2 probably phosphorylates S6 through phosphorylation of p90-RSK (reviewed in Ref. 54), as has been suggested for rat adipocytes (29). The magnitude of the cross-talk in response to insulin has not previously been quantified. In mature human adipocytes, we find that up to half of the signal can be mediated by ERK1/2-p90-RSK. This is important for the understanding of insulin control of protein synthesis and for understanding the hypertrophy of adipocytes commonly seen in obesity. The importance of metabolic cross-talk with ERK1/2 in humans was also indicated by mutations in the Raf-MEK-ERK1/2-scaffolding protein kinase suppressor of Ras-2 (KSR2), where afflicted individuals displayed hyperphagy and metabolic dysfunction (24).
To conclude, our approach to gradually and systematically build a mathematical model of the insulin signaling network, based on internally consistent data from physiologically relevant cells, has demonstrated that a single mechanism can explain the network-wide impairment of insulin signaling in adipocytes from patients with type 2 diabetes. This opens up new approaches to further understanding and to treatment of the disease. In particular, our quantitative dynamic model of the insulin signaling network, normally and in diabetes, will provide a unique tool for drug target identification and testing of drug candidates in silico. This model is, moreover, a paragon for research in other disease areas, in particular cancer, that face many of the same challenges.
Supplementary Material
Acknowledgments
We thank Dr. Preben Kjølhede for unfailingly supplying biopsies from surgery and Rikard Johansson for discussion on modeling.
This study was supported by the Swedish Diabetes Fund, University of Linköping, and the Swedish Research Council.

This article contains supplemental mathematical models and analyses, a catalog containing the data, models, and scripts in Matlab format to simulate the models in the article.
Insulin sensitivity/resistance sometimes refers to the magnitude of the maximal insulin response. Herein we have restricted it to refer to the concentration of insulin that produces a half-maximal response, such that higher insulin sensitivity and lower insulin resistance result in a left shift in the dose-response curve to lower concentrations of insulin and lower EC50 values. Lower insulin sensitivity and higher insulin resistance consequently refer to a right shift to higher EC50 values.
- T2D
- type 2 diabetes
- IR
- insulin receptor
- IRS1
- insulin receptor substrate-1
- mTOR
- mammalian target of rapamycin
- mTORC1
- mTOR in complex with raptor
- GLUT4
- insulin-regulated glucose transporter 4
- S6K1
- p70 ribosomal S6 kinase
- AS160
- Akt substrate of 160 kDa
- RSK
- p90 ribosomal protein S6 kinase
- BMI
- body mass index.
REFERENCES
- 1. Brännmark C., Palmér R., Glad S. T., Cedersund G., Strålfors P. (2010) Mass and information feedbacks through receptor endocytosis govern insulin signaling as revealed using a parameter-free modeling framework. J. Biol. Chem. 285, 20171–20179 [DOI] [PMC free article] [PubMed] [Google Scholar]
- 2. Nyman E., Brännmark C., Palmér R., Brugård J., Nyström F. H., Strålfors P., Cedersund G. (2011) A hierarchical whole body modeling approach elucidates the link between in vitro insulin signaling and in vivo glucose homeostasis. J. Biol. Chem. 286, 26028–26041 [DOI] [PMC free article] [PubMed] [Google Scholar]
- 3. Brännmark C., Nyman E., Fagerholm S., Bergenholm L., Ekstrand E.-M., Cedersund G., Strålfors P. (2013) Insulin signalling in type 2 diabetes: experimental and modeling analyses reveal mechanisms of insulin resistance in human adipocytes. J. Biol. Chem. 288, 9867–9880 [DOI] [PMC free article] [PubMed] [Google Scholar]
- 4. Rajan M. R., Fagerholm S., Jönsson C., Kjølhede P., Turkina M. V., Strålfors P. (2013) Phosphorylation of IRS1 at serine 307 in response to insulin in human adipocytes is not likely to be catalyzed by p70 ribosomal S6 kinase. PLoS One 8, e59725. [DOI] [PMC free article] [PubMed] [Google Scholar]
- 5. Carlson C. J., Koterski S., Sciotti R. J., Poccard G. B., Rondinone C. M. (2003) Enhanced basal activation of mitogen-activated protein kinases in adipocytes from type 2 diabetes. Potential role of p38 in the downregulation of GLUT4 expression. Diabetes 52, 634–641 [DOI] [PubMed] [Google Scholar]
- 6. Cusi K., Maezono K., Osman A., Pendergrass M., Patti M. E., Pratipanawatr T., DeFronzo R. A., Kahn C. R., Mandarino L. J. (2000) Insulin resistance differentially affects the PI 3-kinase and MAP kinase-mediated signaling in human muscle. J. Clin. Invest. 105, 311–320 [DOI] [PMC free article] [PubMed] [Google Scholar]
- 7. Krook A., Björnholm M., Galuska D., Jiang X. J., Fahlman R., Myers M. G., Jr., Wallberg-Henriksson H., Zierath J. R. (2000) Characterization of signal transduction and glucose transport in skeletal muscle from type 2 diabetic patients. Diabetes 49, 284–292 [DOI] [PubMed] [Google Scholar]
- 8. Bandyopadhyay G. K., Yu J. G., Ofrecio J., Olefsky J. M. (2005) Increased p85/55/50 expression and decreased phosphatidylinositol 3-kinase activity in insulin-resistant human skeletal muscle. Diabetes 54, 2351–2359 [DOI] [PubMed] [Google Scholar]
- 9. Bouzakri K., Roques M., Gual P., Espinosa S., Guebre-Egziabher F., Riou J. P., Laville M., Le Marchand-Brustel Y., Tanti J. F., Vidal H. (2003) Reduced activation of phosphatidylinositol-3 kinase and increased serine 636 phosphorylation of insulin receptor substrate-1 in primay culture of skeletal muscle cells from patients with type 2 diabetes. Diabetes 52, 1319–1325 [DOI] [PubMed] [Google Scholar]
- 10. Osman A. A., Hancock J., Hunt D. G., Ivy J. L., Mandarino L. J. (2001) Exercise training increases ERK2 activity in skeletal muscle of obese Zucker rats. J. Appl. Physiol. 90, 454–460 [DOI] [PubMed] [Google Scholar]
- 11. Leng Y., Steiler T. L., Zierath J. R. (2004) Effects of insulin, contraction, and phorbol esters on mitogen-activated protein kinase signaling in skeletal muscle from lean and ob/ob mice. Diabetes 53, 1436–1444 [DOI] [PubMed] [Google Scholar]
- 12. Kyriakis J. M., Avruch J. (2001) Mammalian mitogen-activated protein kinase signal transduction pathways activated by stress and inflammation. Physiol. Rev. 81, 807–869 [DOI] [PubMed] [Google Scholar]
- 13. Plotnikov A., Zehorai E., Procaccia S., Seger R. (2011) The MAPK cascades: signaling components, nuclear roles and mechanisms of nuclear translocation. Biochim. Biophys. Acta 1813, 1619–1633 [DOI] [PubMed] [Google Scholar]
- 14. Roskoski R. (2012) ERK1/2 MAP kinases: structure, function and regulation. Pharmacol. Res. 66, 105–143 [DOI] [PubMed] [Google Scholar]
- 15. Borisov N., Aksamitiene E., Kiyatkin A., Legewie S., Berkhout J., Maiwald T., Kaimachnikov N. P., Timmer J., Hoek J. B., Kholodenko B. N. (2009) Systems-level interactions between insulin-EGF networks amplify mitogenic signaling. Mol. Syst. Biol. 5, 256. [DOI] [PMC free article] [PubMed] [Google Scholar]
- 16. Aldridge B. B., Saez-Rodriguez J., Muhlich J. L., Sorger P. K., Lauffenburger D. A. (2009) Fuzzy logic analysis of kinase pathway crosstalk in TNF/EGF/insulin-induced signaling. PLoS Comput. Biol. 5, e1000340. [DOI] [PMC free article] [PubMed] [Google Scholar]
- 17. Nijhout H. F., Callier V. (2013) A new mathematical approach for qualitative modeling of the insulin-TOR-MAPK network. Front. Physiol. 4, 245. [DOI] [PMC free article] [PubMed] [Google Scholar]
- 18. Strålfors P., Honnor R. C. (1989) Insulin-induced dephosphorylation of hormone-sensitive lipase: correlation with lipolysis and cAMP-dependent protein kinase activity. Eur. J. Biochem. 182, 379–385 [DOI] [PubMed] [Google Scholar]
- 19. Danielsson A., Ost A., Lystedt E., Kjolhede P., Gustavsson J., Nystrom F. H., Strålfors P. (2005) Insulin resistance in human adipocytes downstream of IRS1 after surgical cell isolation, but at the level of phosphorylation of IRS1 in type 2 diabetes. FEBS J. 272, 141–151 [DOI] [PubMed] [Google Scholar]
- 20. Honnor R. C., Dhillon G. S., Londos C. (1985) cAMP-dependent protein kinase and lipolysis in rat adipocytes. I. Cell preparation, manipulation, and predictability in behavior. J. Biol. Chem. 260, 15122–15129 [PubMed] [Google Scholar]
- 21. Schmidt H., Jirstrand M. (2006) Systems Biology Toolbox for MATLAB: a computational platform for research in systems biology. Bioinformatics 22, 514–515 [DOI] [PubMed] [Google Scholar]
- 22. Schmidt H. (2007) SBaddon: high performance simulation for the Systems Biology Toolbox for MATLAB. Bioinformatics 23, 646–647 [DOI] [PubMed] [Google Scholar]
- 23. Cedersund G. (2012) Conclusions via unique predictions obtained despite unidentifiability: new definitions and a general method. FEBS J. 279, 3513–3527 [DOI] [PubMed] [Google Scholar]
- 24. Pearce L. R., Atanassova N., Banton M. C., Bottomley B., van der Klaauw A. A., Revelli J.-P., Hendricks A., Keogh J. M., Henning E., Doree D., Jeter-Jones S., Garg S., Bochukova E. G., Bounds R., Ashford S., Gayton E., Hindmarsh P. C., Shield J. P. H., Crowne E., Barford D., Wareham N. J., UK10K consortium, O'Rahilly S., Murphy M. P., Powell D. R., Barroso I., Farooqi I. S. (2013) KSR2 mutations are associated with obesity, insulin resistance, and impaired cellular fuel oxidation. Cell 155, 765–777 [DOI] [PMC free article] [PubMed] [Google Scholar]
- 25. Kreutz C., Raue A., Timmer J. (2012) Likelihood based observability analysis and confidence intervals for predictions of dynamic models. BMC Syst. Biol. 6, 120. [DOI] [PMC free article] [PubMed] [Google Scholar]
- 26. Nyman E., Cedersund G., Strålfors P. (2012) Insulin signaling: mathematical modeling comes of age. Trends Endocrinol. Metab. 23, 107–115 [DOI] [PubMed] [Google Scholar]
- 27. Lu Z., Xu S., Joazeiro C., Cobb M. H., Hunter T. (2002) The PHD domain of MEKK1 acts as an E3 ubiquitin ligase and mediates ubiquitination and degradation of ERK1/2. Mol. Cell 9, 945–956 [DOI] [PubMed] [Google Scholar]
- 28. Kreutz C., Raue A., Timmer J. (2012) Likelihood based observability analysis and cnfidence intervals for predictions of dynamic models. BMC Syst. Biol. 6, 120. [DOI] [PMC free article] [PubMed] [Google Scholar]
- 29. Lin T.-A., Lawrence J. C., Jr. (1994) Activation of ribosomal protein S6 kinases does not increase glycogen synthesis or glucose transport in rat adipocytes. J. Biol. Chem. 269, 21255–21261 [PubMed] [Google Scholar]
- 30. Ramos J. W. (2008) The regulation of extracellular signal-regulated kinase (ERK) in mammalian cells. Int. J. Biochem. Cell Biol. 40, 2707–2719 [DOI] [PubMed] [Google Scholar]
- 31. Shin S. Y., Rath O., Choo S. M., Fee F., McFerran B., Kolch W., Cho K. H. (2009) Positive- and negative-feedback regulations coordinate the dynamic behavior of the Ras-Raf-MEK-ERK signal transduction pathway. J. Cell Sci. 122, 425–435 [DOI] [PubMed] [Google Scholar]
- 32. Kucharska A., Rushworth L. K., Staples C., Morrice N. A., Keyse S. M. (2009) Regulation of the inducuble nuclear dual-specificity phosphatase DUSP5 by ERK MAPK. Cell. Signal. 21, 1794–1805 [DOI] [PubMed] [Google Scholar]
- 33. Balan V., Leicht D. T., Zhu J., Balan K., Kaplun A., Singh-Gupta V., Qin J., Ruan H., Comb M. J., Tzivion G. (2006) Identification of novel in vivo Raf-1 phosphorylation sites mediating positive feedback Raf-1 regulation by extracellular signal-regulated kinase. Mol. Biol. Cell 17, 1141–1153 [DOI] [PMC free article] [PubMed] [Google Scholar]
- 34. Fritsche-Guenther R., Witzel F., Sieber A., Herr R., Schmidt N., Braun S., Brummer T., Sers C., Blüthgen N. (2011) Strong negative feedback from Erk to Raf confers robustness to MAPK signalling. Mol. Syst. Biol. 7, 489. [DOI] [PMC free article] [PubMed] [Google Scholar]
- 35. Cirit M., Wang C.-C., Haugh J. M. (2010) Systematic quantification of negative feedback mechanisms in the extracellular signal-regulated kinase (ERK) signaling network. J. Biol. Chem. 285, 36736–36744 [DOI] [PMC free article] [PubMed] [Google Scholar]
- 36. Hao N., Yildirim N., Nagiec M. J., Parnell S. C., Errede B., Dohlman H. G., Elston T. C. (2012) Combined computational and experimental analysis reveals mitogen-activated protein kinase-mediated feedback phosphorylation as a mechanism for signal specificity. Mol. Biol. Cell 23, 3899–3910 [DOI] [PMC free article] [PubMed] [Google Scholar]
- 37. Ferrell J. E., Jr., Bhatt R. R. (1997) Mechanistic studies of the dual phosphorylation of mitogen-activated protein kinase. J. Biol. Chem. 272, 19008–19016 [DOI] [PubMed] [Google Scholar]
- 38. Aoki K., Yamada M., Kunida K., Yasuda S., Matsuda M. (2011) Processive phosphorylation of ERK MAP kinase in mammalian cells. Proc. Natl. Acad. Sci. U.S.A. 108, 12675–12680 [DOI] [PMC free article] [PubMed] [Google Scholar]
- 39. Kolch W. (2005) Coordinating ERK/MAPK signalling through scaffolds and inhibitors. Nat. Rev. Mol. Cell Biol. 6, 827–837 [DOI] [PubMed] [Google Scholar]
- 40. Levchenko A., Bruck J., Sternberg P. W. (2000) Scaffold proteins may biphasically affect the levels of mitogen-activated protein kinase signaling and reduce its threshold properties. Proc. Natl. Acad. Sci. U.S.A. 97, 5818–5823 [DOI] [PMC free article] [PubMed] [Google Scholar]
- 41. Locasale J. W., Shaw A. S., Chakraborty A. K. (2007) Scaffold proteins confer diverse regulatory properties to protein kinase cascades. Proc. Natl. Acad. Sci. U.S.A. 104, 13307–13312 [DOI] [PMC free article] [PubMed] [Google Scholar]
- 42. Huang L., Pan C. Q., Li B., Tucker-Kellogg L., Tidor B., Chen Y., Low B. C. (2011) Simulating EGFR-ERK signaling control by scaffold proteins KSR and MP1 reveals differential ligand-sensitivity co-regulated by Cbl-CIN85 and endophlin. Plos One 6, e22933. [DOI] [PMC free article] [PubMed] [Google Scholar]
- 43. Witzel F., Maddison L., Blüthgen N. (2012) How scaffolds shape MAPK signaling: what we know and opportunities for systems approaches. Front. Physiol. 3, 475. [DOI] [PMC free article] [PubMed] [Google Scholar]
- 44. Kondoh K., Torii S., Nishida E. (2005) Control of MAP kinase signaling to the nucleus. Chromosoma 114, 86–91 [DOI] [PubMed] [Google Scholar]
- 45. Wortzel I., Seger R. (2011) The ERK cascade: distinct functions within various subcellular organelles. Genes Cancer 2, 195–209 [DOI] [PMC free article] [PubMed] [Google Scholar]
- 46. Engelman J. A., Chu C., Lin A., Jo H., Ikezu T., Okamoto T., Kohtz D. S., Lisanti M. P. (1998) Caveolin-mediated regulation of signaling along the p42/44 MAP kinase cascade in vivo. A role of the caveolin-scaffolding domain. FEBS Lett. 428, 205–211 [DOI] [PubMed] [Google Scholar]
- 47. Volmat V., Camps M., Arkinstall S., Pouysségur J., Lenormand P. (2001) The nucleus, a site for signal termination by sequestration and inactivation of p42/p44 MAP kinases. J. Cell Sci. 114, 3433–3443 [DOI] [PubMed] [Google Scholar]
- 48. Yu R. C., Pesce C. G., Colman-Lerner A., Lok L., Pincus D., Serra E., Holl M., Benjamin K., Gordon A., Brent R. (2008) Negative feedback that improves information transmission in yeast signalling. Nature 456, 755–761 [DOI] [PMC free article] [PubMed] [Google Scholar]
- 49. Mut M., Lule S., Demir O., Kurnaz I. A., Vural I. (2012) Both mitogen-activated protein kinas (MAPK)/extracellular-signal-regulated kinases (ERK)1/2 and phosphatidylinositide-3-OH kinase (PI3K)/Akt pathways regulate activation of E-twenty-six (ETS)-like transcription factor (Elk-1) in U138 glioblastoma cells. Int. J. Biochem. Cell Biol. 44, 302–310 [DOI] [PubMed] [Google Scholar]
- 50. Ahmed S., Grant K. G., Edwards L. E., Rahman A., Cirit M., Goshe M. B., Haugh J. M. (2014) Data-driven modeling reconciles kinetics or ERK phosphorylation, localization, and activity states. Mol. Syst. Biol. 10, 718. [DOI] [PMC free article] [PubMed] [Google Scholar]
- 51. Stenkula K. G., Said L., Karlsson M., Thorn H., Kjølhede P., Gustavsson J., Söderström M., Strålfors P., Nystrom F. H. (2004) Expression of a mutant IRS inhibits metabolic and mitogenic effects of insulin in human adipocytes. Mol. Cell. Endocrinol. 221, 1–8 [DOI] [PubMed] [Google Scholar]
- 52. Gogg S., Smith U. (2002) Epidermal growth factor and transforming growth factor alpha mimic the effects of insulin in human fat cells and augment donwstream signaling in insulin resistance. J. Biol. Chem. 277, 36045–36051 [DOI] [PubMed] [Google Scholar]
- 53. Roux P. P., Shahbazian D., Vu H., Holz M. K., Cohen M. S., Taunton J., Sonenberg N., Blenis J. (2007) RAS/ERK signaling promotes site-specific ribosomal protein S6 phosphorylation via RSK and stimulates Cap-dependent translation. J. Biol. Chem. 282, 14056–14064 [DOI] [PMC free article] [PubMed] [Google Scholar]
- 54. Blenis J. (1993) Signal transduction via the MAP kinases: proceed at your own RSK. Proc. Natl. Acad. Sci. U.S.A. 90, 5889–5892 [DOI] [PMC free article] [PubMed] [Google Scholar]
- 55. Dibble C. C., Manning B. D. (2013) Signal integration by mTORC1 coordinates nutrient inputs with biosynthetic output. Nat. Cell Biol. 15, 555–564 [DOI] [PMC free article] [PubMed] [Google Scholar]
- 56. Danielsson A., Ost A., Nystrom F. H., Strålfors P. (2005) Attenuation of insulin-stimulated insulin receptor substrate-1 serine 307 phosphorylation in insulin resistance of type 2 diabetes. J. Biol. Chem. 280, 34389–34392 [DOI] [PubMed] [Google Scholar]
- 57. Pereira M. J., Palming J., Rizell M., Aureliano M., Carvalho E., Svensson M. K., Eriksson J. W. (2012) mTOR inhibition with rapamycin causes impaired insulin signalling and glucose uptake in human subcutaneous and omental adipocytes. Mol. Cell. Endocrinol. 355, 96–105 [DOI] [PubMed] [Google Scholar]
- 58. Ost A., Svensson K., Ruishalme I., Brännmark C., Franck N., Krook H., Sandström P., Kjolhede P., Strålfors P. (2010) Attenuated mTOR signaling and enhanced autophagy in adipocytes from obese patients with type 2 diabetes. Mol. Med. 16, 235–246 [DOI] [PMC free article] [PubMed] [Google Scholar]
- 59. Ost A., Danielsson A., Lidén M., Eriksson U., Nystrom F. H., Strålfors P. (2007) Retinol-binding protein-4 attenuates insulin-induced phosphorylation of IRS1 and ERK1/2 in primary human adipocytes. FASEB J. 21, 3696–3704 [DOI] [PubMed] [Google Scholar]
- 60. Danielsson A., Fagerholm S., Ost A., Franck N., Kjolhede P., Nystrom F. H., Strålfors P. (2009) Short-term over-eating induces insulin resistance in fat cells in lean human subjects. Mol. Med. 15, 228–234 [DOI] [PMC free article] [PubMed] [Google Scholar]
- 61. Giraud J., Leshan R., Lee Y.-H., White M. F. (2004) Nutrient-dependent and insulin-stimulated phosphorylation of insulin receptor substrate-1 on serine 302 correlates with increased insulin signaling. J. Biol. Chem. 279, 3447–3454 [DOI] [PubMed] [Google Scholar]
- 62. Weigert C., Kron M., Kalbacher H., Pohl A. K., Runge H., Häring H. U., Schleicher E., Lehmann R. (2008) Interplay and effects of temporal changes in the phosphorylation state of serine-302, -307, and -318 of insulin receptor substrate-1 on insulin action in skeletal muscle cells. Mol. Endocrinol. 22, 2729–2740 [DOI] [PMC free article] [PubMed] [Google Scholar]
- 63. Roux P. P., Ballif B. A., Anjum R., Gygi S. P., Blenis J. (2004) Tumor-promoting phorbol esters and activated Ras inactivate the tuberous sclerosis tumor suppressor complex via p90 ribosomal S6 kinase. Proc. Natl. Acad. Sci. U.S.A. 101, 13489–13494 [DOI] [PMC free article] [PubMed] [Google Scholar]
- 64. Ma L., Chen Z. (2005) Phosphorylation and functional inactivation of TSC2 by Erk, implications for tuberous sclerosis and cancer pathogenesis. Cell 121, 179–193 [DOI] [PubMed] [Google Scholar]
Associated Data
This section collects any data citations, data availability statements, or supplementary materials included in this article.