

Abstract
• Background and Aims DNA C-values in land plants (comprising bryophytes, lycophytes, monilophytes, gymnosperms and angiosperms) vary ∼1000-fold from approx. 0·11 to 127·4 pg. To understand the evolutionary significance of this huge variation it is essential to evaluate the phylogenetic component. Recent increases in C-value data (e.g. Plant DNA C-values database; release 2.0, January 2003; http://www.rbgkew.org.uk/cval/homepage.html) together with improved consensus of relationships between and within land plant groups makes such an analysis timely.
• Methods Insights into the distribution of C-values in each group of land plants were gained by superimposing available C-value data (4119 angiosperms, 181 gymnosperms, 63 monilophytes, 4 lycophytes and 171 bryophytes) onto phylogenetic trees. To enable ancestral C-values to be reconstructed for clades within land plants, character-state mapping with parsimony and MacClade was also applied.
• Key Results and Conclusions Different land plant groups are characterized by different C-value profiles, distribution of C-values and ancestral C-values. For example, the large (∼1000-fold) range yet strongly skewed distribution of C-values in angiosperms contrasts with the very narrow 12-fold range in bryophytes. Further, character-state mapping showed that the ancestral genome sizes of both angiosperms and bryophytes were reconstructed as very small (i.e. ≤1·4 pg) whereas gymnosperms and most branches of monilophytes were reconstructed with intermediate C-values (i.e. >3·5, <14·0 pg). More in-depth analyses provided evidence for several independent increases and decreases in C-values; for example, decreases in Gnetaceae (Gymnosperms) and heterosperous water ferns (monilophytes); increases in Santalales and some monocots (both angiosperms), Pinaceae, Sciadopityaceae and Cephalotaxaceae (Gymnosperms) and possibly in the Psilotaceae + Ophioglossaceae clade (monilophytes). Thus, in agreement with several focused studies within angiosperm families and genera showing that C-values may both increase and decrease, it is apparent that this dynamic pattern of genome size evolution is repeated on a broad scale across land plants.
Keywords: Genome size, C-values, genomic downsizing, land plants, evolution, bryophytes, pteridophytes, monilophytes, lycophytes, gymnosperms, angiosperms, algae
INTRODUCTION
Recent years have seen significant advances in our understanding of how the genome size (1C nuclear DNA amount) of species may change. Increases in DNA occur predominantly either via polyploidy or by transposon amplification (e.g. see reviews by Wendel, 2000; Bennetzen, 2002; Leitch and Bennett, 2004; Bennetzen et al., 2005), whereas decreases involve either recombinational mechanisms, for example, unequal homologous (Vicient et al., 1999; Shirasu et al., 2000) and illegitimate (Devos et al., 2002; Vitte and Panaud, 2003) recombination, or DNA loss during repair of double-stranded breaks (Kirik et al., 2000; Orel and Puchta, 2003). There has also been progress in understanding the nature of the evolutionary forces acting on these mechanisms to drive changes in genome size (e.g. Gregory, 2001, 2003; Petrov, 2002).
C-values of different organisms vary extensively (e.g. C-values in eukaryotes vary ∼3300-fold; Gregory, 2005), so insights into the direction of genome size changes are also essential for a holistic perspective of genome size evolution. Such analyses require that genome size data are viewed within a robust phylogenetic framework. In angiosperms, a few studies have followed this approach at the family or genus level (Bennetzen and Kellogg, 1997; Cox et al., 1998; Wendel et al., 2002; Johnston et al., 2005; Price et al., 2005), while Leitch et al. (1998) and Soltis et al. (2003) have conducted broader analyses across the entire angiosperm phylogeny. Together, these studies showed that both increases and decreases in genome size have taken place during angiosperm evolution and provided insights into the size of the ancestral angiosperm genome.
This paper extends the studies noted above for angiosperms by analysing available C-value data for all land plants (Embryophyta) within a robust phylogenetic framework. This is timely for two reasons:
(1) Knowledge of C-values in land plants has increased significantly in recent years with estimates now available for 4538 species (4119 angiosperms, 181 gymnosperms, 67 pteridophytes and 171 bryophytes). These data are located either in the Plant DNA C-values database (release 2.0, January 2003; http://www.rbgkew.org.uk/cval/homepage.html), in Bennett and Leitch (2005), or Hanson and Leitch (2002). Analysis shows that C-values in land plants vary ∼1000-fold from approx. 0·1 pg in Fragaria viridis Duchesne to 127·4 pg in tetraploid Fritillaria assyriaca Baker (Table 1).
Table 1.
Minimum (min.), maximum (max.), mean, mode and range (max./min.) of 1C DNA values in major groups of land plants together with the level of species representation of C-value data
| Min. (pg) |
Max. (pg) |
Mean (pg) |
Mode (pg) |
Range (max./min.) |
No. of species with DNA C-values |
No. of species recognized* |
Representation (%) |
|
|---|---|---|---|---|---|---|---|---|
| Bryophytes | 0·17 | 2·05 | 0·51 | 0·45 | 12·1 | 171 | ∼18 000 | ∼1·0 |
| Lycophytes | 0·16 | 11·97 | 3·81 | n/a | 74·8 | 4 | ∼900 | ∼0·4 |
| Monilophytes | 0·77 | 72·68 | 13·58 | 7·80 | 95·0 | 63 | ∼11 000 | ∼0·6 |
| Gymnosperms | 2·25 | 32·20 | 16·99 | 9·95 | 14·3 | 181 | 730 | 24·8 |
| Angiosperms | ∼0·11 | 127·40 | 6·30 | 0·60 | ∼1000 | 4119 | ∼250 000 | ∼1·4 |
| All land plants | ∼0·11 | 127·40 | 6·46 | 0·60 | ∼1000 | 4538 | ∼280 000 | ∼1·6 |
Numbers of species recognised for bryophytes from Qiu and Palmer (1999), for lycophytes and monilophytes from Raven et al. (1999), for gymnosperms from Murray (1998) and for angiosperms from Bennett and Leitch (1995).
(2) Recent studies have made significant advances in clarifying relationships between and within land plant groups (Fig. 1; Pryer et al., 2001). These analyses place hornworts, liverworts and mosses as sisters to all other land plants, although relationships among these three bryophyte lineages remain controversial (Renzaglia et al., 2000). The remaining land plants form a clade comprising all extant vascular plants (tracheophytes). Vascular plants are further divided into three monophyletic groups: (a) lycophytes (Lycopodiaceae, Selaginellaceae and Isoetaceae), which are sister to all other vascular plants; (b) a monilophyte clade comprising Psilotaceae + Ophioglossaceae, horsetails (equisetophytes), and all eusporangiate and leptosporangiate ferns; and (c) the seed plants (Spermatophyta) comprising a clade of extant gymnosperms as the sister group to angiosperms.
Fig. 1.

Land plant phylogeny (left; based on Pryer et al., 2001) and C-value data (middle) showing the mean (•) followed by the range of nuclear DNA C-values encountered in each group. The number in brackets following the group name gives the number of species with C-value data. Land plants and their major subdivisions are shown on the right.
VARIATION IN THE DISTRIBUTION OF C-VALUES ACROSS LAND PLANTS
Superimposing C-value data onto the land plant phylogeny reveals differences between the groups in terms of the minimum and maximum, range, mean and modal C-values (Fig. 1, Table 1). Further differences are highlighted when histograms, showing the frequency of known C-values, are plotted for each group (Fig. 2). For example, the large (∼1000-fold) range, yet strongly skewed distribution, of C-values in angiosperms (Fig. 2A) contrasts with the very narrow 12-fold range in bryophytes (Fig. 2E). However, the percentage of species represented for all but gymnosperms is poor (Table 1). Thus, the analysis presented below must include the caveat that available data may not be entirely representative and that further data may extend the range and distribution of C-values for each group. The exception to this might be the angiosperms as the ∼1000-fold range was first reported in 1982 based on C-values for 993 species (Bennett et al., 1982). Since then, the addition of a further 3126 species has not extended this range.
Fig. 2.
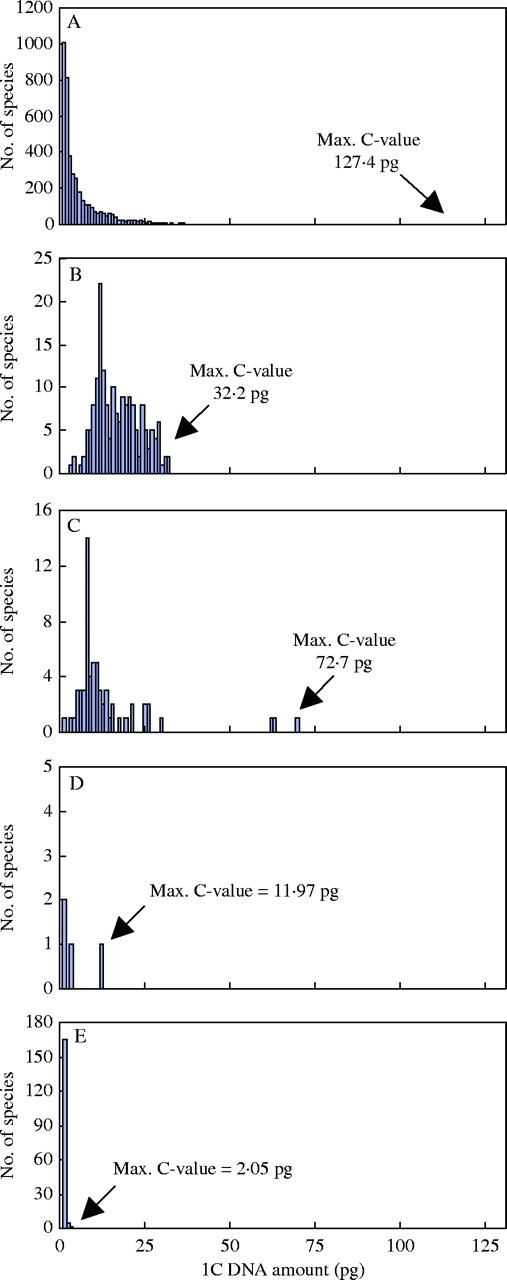
Histograms showing the distribution of DNA C-values for (A) 4119 angiosperms, (B) 181 gymnosperms, (C) 63 monilophytes, (D) 4 lycophytes, and (E) 171 bryophytes. The maximum C-value for each group is indicated.
INSIGHTS INTO THE ANCESTRAL C-VALUES OF LAND PLANT GROUPS USING CHARACTER-STATE RECONSTRUCTION
To provide further insights into how C-values are distributed within land plants, C-value data were superimposed onto more detailed phylogenetic trees for each group (Fig. 3). In addition, to enable ancestral C-values to be reconstructed for clades within the land plants, character-state mapping with parsimony and MacClade (versions 3.04 and 4.0; Maddison and Maddison, 1992) was conducted using the following size categories: species with C-values of ≤1·4 pg and ≤3·5 pg were defined as having' very small' and ‘small’ genomes, respectively. C-values of >3·5 and <14·0 pg were defined as ‘intermediate’, whereas species with C-values ≥14·0 pg and ≥35·0 pg were defined as having ‘large’ and ‘very large’ C-values, respectively. Except for the ‘intermediate’ category, these size classes are the same as those originally defined by Leitch et al. (1998) and were used by Soltis et al. (2003).
Fig. 3.

Molecular phylogeny (left) and C-value data (middle) showing the mean (•) followed by the range of nuclear DNA C-values encountered in each group or family of (A) angiosperms, (B) gymnosperms, (C) monilophytes and lycophytes, and (D) bryophytes. The number in brackets following the group or family name gives the number of species with C-value data. Major subdivisions within the angiosperms are shown on the right. Phylogenetic trees taken from the following sources: angiosperms, APG II (2003); gymnosperms, Soltis et al. (2002); monilophytes and lycophytes, Pryer et al. (2001); bryophytes, Beckert et al. (1999).
For character-state reconstructions three ‘trace’ options available with MacClade were used: ‘all most-parsimonious states’, accelerated transformation (ACCTRAN) and delayed transformation (DELTRAN). A conservative estimate of phylogeny that contained a polytomy within the leptosporangiate ferns was used for the ‘all most-parsimonious states’ reconstruction. This polytomy was depicted as resolved in the ACCTRAN and DELTRAN optimizations because these methods cannot be employed when polytomies are present. However, the polytomy had no effect on the reconstructions. The ‘all most-parsimonious states’ and DELTRAN optimizations were very similar, with most deep nodes in the land plants reconstructed as equivocal (see Fig. 7). The ACCTRAN optimization had a major impact on the reconstruction of the ancestral states at these deep nodes (see Fig. 8). However, within clades the reconstructions obtained were identical regardless of the trace option used; exceptions are highlighted below.
Fig. 7.

Parsimony reconstruction of C-value diversification across land plants using the ‘all most-parsimonious states’ resolving option of MacClade. Equisetum 1 and 2 = Equisetum subgenus Equisetum and subgenus Hippochaete, respectively. ANGIOS. = angiosperms; LYCO. = lycophytes; BRYO. = bryophytes.
Fig. 8.

Parsimony reconstruction of C-value diversification across land plants using the ACCTRAN option of MacClade. Equisetum 1 and 2 = Equisetum subgenus Equisetum and subgenus Hippochaete, respectively. ANGIOS. = angiosperms; LYCO. = lycophytes; BRYO. = bryophytes.
EVOLUTION OF GENOME SIZE IN THE ANGIOSPERMS
The first large-scale analysis of genome size evolution in angiosperms (Leitch et al., 1998), based on an analysis of C-value data for 2802 species, used the most robust phylogenetic tree available at the time, which placed Ceratophyllaceae sister to all other angiosperms (Chase et al., 1993). Superimposing C-value data onto the phylogeny showed that, while all groups analysed contained species with small genome sizes (i.e. ≤3·5 pg), very large genomes (i.e. ≥35·0 pg) were restricted to just two clades—monocots and Santalales. It was concluded that the size of the ancestral angiosperm genome was small.
Subsequently, there have been two important developments. First, an increased amount of DNA sequence data has resulted in greater resolution and internal support for the relationships among basal angiosperms, revealing that Amborellaceae are sister to all other angiosperms followed by Nymphaeaceae and Austrobaileyales (e.g. Qiu et al., 1999; Zanis et al., 2002). Second, C-value data for angiosperms have increased by nearly 50 % and now include representatives of all the most basal families (Leitch and Hanson, 2002).
Repeating the analysis by superimposing the larger dataset of 4119 species onto the more robust angiosperm phylogeny gave similar results (Fig. 3A) to those obtained by Leitch et al. (1998), with just the monocot and Santalales clades containing species with very large genomes. To gain a more objective insight into the size of the ancestral genome of angiosperms, character-state reconstruction using gymnosperms as the outgroup was conducted (Soltis et al., 2003; Fig. 4). This revealed that not only was the ancestral genome size of all angiosperms reconstructed as very small (i.e. ≤1·4 pg), but that most of the major clades within angiosperms (e.g. monocots, magnoliids, eudicots, Ranunculales, Caryophyllales and asterids) also had very small ancestral genomes.
Fig. 4.
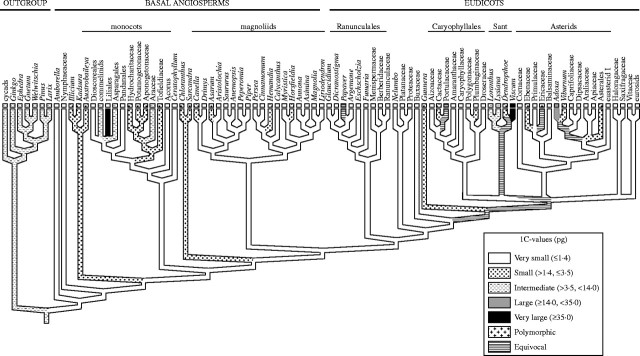
Parsimony reconstruction of C-value diversification in the angiosperms using the ‘all most-parsimonious states’ resolving option of MacClade (based on Soltis et al., 2003). Sant = Santalales.
Soltis et al. (2003) also noted that a closer examination of monocots and Santalales revealed that species possessing very large C-values occupied derived positions within these clades. In monocots, species with very large C-values were restricted to just one family in the commelinids, five families in Asparagales and three families in Liliales (Fig. 5). Based on character-state reconstruction, very large C-values must have evolved at least twice within monocots and possibly more (Soltis et al., 2003). However, the number of independent origins in Asparagales and Liliales is currently uncertain. Although some species in these clades do have very large genomes (for example, some Allium, Fritillaria, Tulipa and Lilium species), most species, for which C-value data are available, are smaller. Thus, it is unclear whether the common ancestor of Asparagales and Liliales had a very large genome or if it originated multiple times with these two clades (see equivocal labelling of branch point on Fig. 5). Additional C-value data and a better-resolved phylogeny are needed to resolve this issue.
Fig. 5.

Parsimony reconstruction of C-value diversification in the monocots using the ‘all most-parsimonious states’ resolving option of MacClade (based on Soltis et al., 2003). Families containing species with very large C-values (i.e. ≥35·0 pg) are marked in bold.
Within Santalales, very large genomes are known for just two species of Viscum (V. album L., 1C = 76·0 pg and V. cruciatum Sieber ex Spreng., 1C = 79·3 pg). A histogram of C-values within Santalales (Fig. 6) showed these two species to be outliers; the species with the next smallest C-value is Macrosolen colchinchinensis (Lour.) Blume with 1C = 17·5 pg. Further, recent phylogenetic data shows Viscum to be derived in Santalales (Nickrent and Melecot, 2001), thus character-state analysis reconstructs the ancestral genome size of Sanatales as equivocal (Soltis et al., 2003; Fig. 4). Very large genomes are only reconstructed as ancestral in the branch leading to Viscum suggesting that genome size expansion has only occurred on a limited scale within Santalales.
Fig. 6.

Distribution of DNA C-values for 62 species of Santalales. The C-values for two Viscum species are arrowed. Data taken from the Plant DNA C-values database (Bennett and Leitch, 2003).
The possession of a small or very small genome in the angiosperms is thus the norm, with more than half the species (2365 out of 4119 species) possessing genomes that are ≤3·5 pg. Moreover, character-state reconstruction highlights further a very small genome size as the ancestral state not only at the root of all angiosperms, but also for most of the major clades within angiosperms. The evolution of very large genomes appears to be phylogenetically restricted, occurring independently in just a few places within the monocot and Santalales clades (Soltis et al., 2003).
EVOLUTION OF GENOME SIZE IN THE GYMNOSPERMS
Extant gymnosperms are a much smaller group than angiosperms, represented by only 730 species compared with the ∼250 000 species recognized in angiosperms. Yet, from a C-value perspective, gymnosperms are much better represented with data for 25 % of all species, including at least one value for each of the 17 families recognized (Leitch et al., 2001). Gymnosperms are characterized by possessing larger genomes than angiosperms with a modal value (9·95 pg) over 16 times the modal value for angiosperms (Table 1). However, the range is much narrower, being only 14-fold compared with ∼1000-fold encountered in angiosperms. Furthermore, no gymnosperm species with very small or very large genomes have been reported; the smallest C-value listed for a gymnosperm is 2·3 pg for Gnetum ula Brongn., whereas the largest is for Pinus nelsonii Shaw with 1C = 32·2 pg.
Reconstruction of evolutionary changes in C-values in gymnosperms has only recently become possible due to some progress in understanding relationships among different gymnosperm groups (e.g. Bowe et al., 2000; Chaw et al., 2000; Soltis et al., 2002). Recent studies place cycads (Cycadales) followed by Ginkgo (Ginkgoales) as sisters to Gnetales and conifers (which are further divided into Pinaceae and ‘Coniferales II’ comprising all remaining coniferous families). Relationships among Gnetales (Welwitchiaceae, Ephedraceae, Gnetaceae) and conifers remain contentious. Some analyses place Gnetales within conifers as sister to Pinaceae, whereas others place Gnetales sister to all conifers, as shown in Figs 3B, 7 and 8.
Leitch et al. (2001) superimposed data for 152 species available at the time onto the phylogenetic tree of Bowe et al. (2000) and Chaw et al. (2000) and concluded that the ancestors of extant gymnosperms were probably characterized by larger C-values than the ancestral state for angiosperms. Repeating the analysis, but including data for an additional 29 species showed essentially the same result (Fig. 3B). Character-state reconstructions showed the ancestral genome size of extant gymnosperms to be ‘intermediate’, a state that is retained in most gymnosperm groups (Figs 7 and 8). The two notable exceptions are (1) the small ancestral genome size reconstructed for Gnetaceae, suggesting that there has been a contraction of the genome within some Gnetales, and (2) the large ancestral genome size reconstructed for Pinaceae and the monotypic families Sciadopityaceae and Cephalotaxaceae, suggesting that genome size expansion occurred on multiple occasions during conifer evolution. These exceptions were observed regardless of the trace option used (e.g. see Figs 7 and 8) or the relationships used for Gnetales and Pinaceae (data not shown).
EVOLUTION OF C-VALUES IN MONILOPHYTES
The monilophyte clade is the most diverse group of land plants after angiosperms with >11 000 species recognized by some workers (Raven et al., 1999). Yet, knowledge of C-values within this group is still sparse with robust data available for only 63 species (0·7 %). Nevertheless, owing to targeted work to improve phylogenetic coverage, available data are spread across the phylogeny (Obermayer et al., 2002). Whilst most families and groups are characterized by intermediate C-values (Fig. 3C), and reconstructed with ‘intermediate’ ancestral genome sizes (Figs 7 and 8), as in gymnosperms, there are two exceptions.
(1) Very large genomes are restricted to the basal eusporangiate clade comprising Ophioglossaceae + Psilotaceae, where C-values for two Ophioglossum (O. petiolatum Hook.; 1C = 65·6 pg; O. gramineum Willd.; 1C = 64·8 pg) and one Psilotum (P. nudum (L.) Griseb; 1C = 72·7 pg) species are clearly outliers (Fig. 2C), and more than double the next smallest C-value (=Equisetum variegatum; 1C = 30·35 pg). Further, character-state reconstruction shows that the Ophioglossaceae + Psilotaceae clade is unique in being the only monilophyte branch to be reconstructed with a very large ancestral C-value (Figs 7 and 8). Depending on the trace option used in MacClade, the ancestral genome size of monilophytes is reconstructed as either equivocal (‘all most-parsimonious states’ and DELTRAN, Fig. 7) or intermediate (ACCTRAN, Fig. 8). If the ACCTRAN reconstruction is correct, it implies that massive genome expansion occurred in the ancestor of Psilotaceae and Ophioglossaceae. Interestingly, these very large C-values are apparently determined by differing degrees of two different cytological processes, namely polyploidization and changes in chromosome size. Whereas polyploidy is likely to have been important in both genera, it has played a more prominent role in Ophioglossum, which is characterized by numerous, small chromosomes (1·5–4·5 µm long; Abraham et al., 1962) and 2n up to 1440 (Khandelwal, 1990), whereas in Psilotum an increase in chromosome size has also been important as the genus is characterized by fewer (2n = 104, 156, 208), but larger, chromosomes (4·5–18 µm long (Abraham et al., 1962).
(2) Very small genomes in the monilophytes are only found in the heterosporous water fern clade, where the smallest C-value so far reported is 1C = 0·77 pg for Azolla microphylla Kaulf. Further, character-state analysis reconstructs the ancestral genome size of the heterosporous water ferns as very small (Figs 7 and 8) suggesting that evolution of this clade was accompanied by genome downsizing. However, within heterosporous water ferns, C-values have not remained static. There is evidence of secondary genome size expansion in Marsilea (Marsileaceae), as this genus has small, rather than very small genomes (Fig. 8).
Observations in other clades, where there is evidence of increases (Todea [Osmundaceae], Plagiogyria [Plagiogyriaceae], and Equisitum subgenus Hippochaetae [Equisetaceae]) and decreases (Ceratopteris [Parkeriaceae], Asplenium [Aspleniaceae]) in C-value (Figs 7 and 8), further highlight the dynamic nature of C-value evolution within the monilophytes and emphasize the need for more data to elucidate the trends and mechanisms in operation.
EVOLUTION OF GENOME SIZE IN THE LYCOPHYTES AND BRYOPHYTES
Lycophytes
Of the ∼900 species of lycophytes (clubmosses) recognized, only four C-values are available. Meaningful insights into the distribution and evolution of C-values in this clade are not yet feasible, except to note that despite few data, C-values for this clade already range 75-fold from 0·16 pg in Selaginella kraussiana (Kunze) A.Br. (Selaginellaceae) to 11·97 pg in Isoetes lacustris Weig. (Isoetaceae) (Table 1, Fig. 2D). The possible significance of this large range is discussed below (see ‘Trends in genome size evolution across land plants’).
Bryophytes
Knowledge of C-values in bryophytes has improved significantly in recent years, mainly due to the targeted work of Voglmayr (2000) and Temsch et al. (1998), who estimated C-values for 171 moss taxa. There are, however, no reliable values for either liverworts or hornworts (see Voglmayr, 2000), although the majority of published data to date suggest that these groups are characterized by small or very small genomes (Renzaglia et al., 1995), and, in hornworts, this agrees with observations showing the group to be characterized by low numbers of very small chromosomes (Proskauer, 1958). The significant gap in C-value data for hornworts and liverworts needs to be targeted, as both groups have been considered sister to all other land plants depending on the analysis (Kugita et al., 2003). Uniquely among land plants, C-values in mosses are nearly all very small (only three species have C-values >1·4 pg, one of which is a polyploid) and vary only 12-fold from 0·17 pg in Holomitrium arboreum Mitt. (Dicranaceae) to 2·05 pg in Mnium marginatum (Dicks.) P. Beauv. (Mniaceae). Moreover, within the narrow range, 65 % of species have C-values within 0·1 pg of the mode (0·45 pg). Taken together, mosses occupy the lowest 1·6 % of the known range of land plants.
Current phylogenetic studies show that the basal families of mosses comprise Sphagnaceae, Polytrichaceae, Andreaeaceae, Tetraphidaceae and Buxbaumiaceae as successive sisters to the subclass Bryidae (Beckert et al., 1999). All of these families have very small C-values, and plotting the data on to the tree does not reveal any noticeable trends (Fig. 3D). Regardless of how the subclass Bryidae is coded (i.e. very small, small or polymorphic) the ancestral genome size for mosses is reconstructed as very small (Figs 7 and 8).
TRENDS IN GENOME SIZE EVOLUTION ACROSS LAND PLANTS
The major patterns in the evolution of genome size across land plants are:
(1) Different land plant groups are characterized by different ancestral C-values. Whilst angiosperms and bryophytes are reconstructed with very small ancestral genomes, in gymnosperms and most branches of the monilophyte clade the ancestral genome is reconstructed as intermediate in size (Figs 4, 7 and 8).
(2) Genome size evolution across land plants has been dynamic with evidence for several independent increases and decreases. Examples of genome size reductions have been noted within the monilophyte clade at the base of the heterosporous water ferns and within the gymnosperms in the branch leading to Gnetaceae. Evidence of large independent increases have been observed in the monocots and Santalales (angiosperms), and perhaps in the Ophioglossaceae + Psilotaceae clade (monilophytes). Thus, observations made within some angiosperm families that both increases and decreases can take place during genome size evolution (e.g. Wendel et al., 2002) appear to form a pattern that is repeated across all land plants, except perhaps in bryophytes where all species to date have small or very small genomes.
(3) The differences in C-value profiles (Figs 2 and 3) and patterns of evolution based on reconstruction data (Figs 4, 7 and 8) strongly suggest that each major group of land plants has been subject to different evolutionary or selective forces. The nature of these pressures is currently unclear, although some ideas have been proposed. For example, it has been suggested that the small ancestral genome size of angiosperms may help to explain their competitive success over gymnosperms. Small genome size is known to correlate with several developmental phenotypic characters (e.g. rapid seedling establishment, short minimum generation time, reduced cost of reproduction and an increased reproductive rate; Bennett, 1972, 1987; Midgley and Bond, 1991), which together may permit great evolutionary flexibility. Thus, smaller genome sizes in angiosperms may provide one functional explanation as to why they were so successful in competing with other plants (Leitch et al., 1998).
In bryophytes and two lycophyte genera, Lycopodium (Lycopodiaceae) and Selaginella (Selaginellaceae), all with biflagellate sperm, the low upper-limit of C-values has been suggested to be under strong selection pressure as a consequence of the nucleotypic correlation between DNA amount and cell size (Renzaglia et al., 1995). With only two flagella, increasing DNA amount would result in larger sperm cells with reduced mobility, and it is expected that this would reduce the efficiency with which sperm were able to move from the antheridia to the archegonia to effect fertilization. Selection is therefore expected to favour smaller, more mobile sperm and hence those with smaller DNA amounts. Interestingly, the recent report of a C-value for Isoetes (Isoetaceae; i.e. 1C = 11·97 pg; Hanson and Leitch, 2002) that is up to 75 times greater than those in Selaginellaceae (1C = 0·16–0·36 pg) and Lycopodiaceae (1C = 2·86 pg) supports this hypothesis as Isoetes is the only lycophyte with multiflagellate sperm for which a C-value is available. It suggests that without the constraint imposed by possessing just two flagella, the DNA amount in Isoetes is not under such tight nucleotypic control and can therefore increase.
Genomic downsizing is suggested for the heterosporous water ferns and for the aquatic fern Ceratopteris. Both the water ferns and Ceratopteris occur in clades with terrestrial ferns and the aquatic habit appears to be derived in these lineages. These results pose the question as to whether selection for smaller genome size may have been associated with this shift into an aquatic habit.
BEYOND THE LAND PLANTS
Whilst analyses presented here enable patterns and trends to be highlighted, due to major differences in the C-value profiles between the land plant groups, the ‘all most-parsimonious states’ and DELTRAN trace options of character-state mapping were unable to resolve ancestral genome sizes for seed plants, monilophytes and all vascular plants (Fig. 7). Using the ACCTRAN transformation option, the ancestral genome size for all these groups was reconstructed as intermediate (Fig. 8). If correct, this implies that the very small ancestral genome size of angiosperms is a derived condition, and that ancestral angiosperms underwent extensive genomic downsizing early in their evolution.
To investigate these observations further, and to shed light on the ancestral genome size of all land plants (which is reconstructed as equivocal regardless of the trace option used; Figs 7 and 8), the DNA amount in fossil ancestral plants themselves could be estimated. While such an approach is not straightforward, there are a few studies that have used cell sizes in fossils as proxies for C-values to detect changes in DNA amounts. In plants, Masterson (1994) used the size of fossil guard cells to track changes in DNA amount in fossil angiosperms over 100 million years. In animals, Conway Morris and Harper (1988) used this approach to identify changes in genome size in conodonts (Chordata) over 270 million years, and Thomson (1972) examined changes in DNA amount in fossil lungfish over 400 million years. These studies highlight the potential of such an approach to shed light on the evolution of DNA amounts at key points in the land plant phylogeny and even to the ancestral C-value of all land plants. Finally, the recent studies which point to the Charophycean lineage of algae as sister to all land plants (Karol et al., 2001; Turmel et al., 2003) suggest that adopting a similar approach could provide insights into the changes in genome size that took place during the remarkable evolutionary transition from aquatic algae to terrestrial plants approx. 470 million years ago.
LITERATURE CITED
- Abraham A, Ninan CA, Mathew PM. 1962. Studies on the cytology and phylogeny of the pteridophytes VII. Observations on one hundred species of South Indian ferns. Journal of the Indian Botanical Society 41: 339–421. [Google Scholar]
- APG II. 2003. An update of the Angiosperm Phylogeny Group classification for the orders and families of flowering plants. Botanical Journal of the Linnean Society 141: 399–436. [Google Scholar]
- Beckert S, Steinhauser S, Muhle H, Knoop V. 1999. A molecular phylogeny of bryophytes based on nucleotide sequences of the mitochondrial nad5 gene. Plant Systematics and Evolution 218: 179–192. [Google Scholar]
- Bennett MD. 1972. Nuclear DNA content and minimum generation time in herbaceous plants. Proceedings of the Royal Society of London Series B, Biological Sciences 181: 109–135. [DOI] [PubMed] [Google Scholar]
- Bennett MD. 1987. Variation in genomic form in plants and its ecological implications. New Phytologist 106: 177–200. [Google Scholar]
- Bennett MD, Leitch IJ. 1995. Nuclear DNA amounts in angiosperms. Annals of Botany 76: 113–176. [Google Scholar]
- Bennett MD, Leitch IJ. 2003. Plant DNA C-values database (release 2.0, Jan. 2003). http://www.rbgkew.org.uk/cval/homepage.html [Google Scholar]
- Bennett MD, Leitch IJ. 2005. Nuclear DNA amounts in angiosperms: progress, problems and prospects. Annals of Botany 95: 45–90. [DOI] [PMC free article] [PubMed] [Google Scholar]
- Bennett MD, Smith JB, Heslop-Harrison JS. 1982. Nuclear DNA amounts in angiosperms. Proceedings of the Royal Society of London Series B, Biological Sciences 216: 179–199. [DOI] [PubMed] [Google Scholar]
- Bennetzen JL, Ma J, Devos KM. 2005. Mechanisms of recent genome size variation in flowering plants. Annals of Botany 95: 127–132. [DOI] [PMC free article] [PubMed] [Google Scholar]
- Bennetzen JL. 2002. Mechanisms and rates of genome expansion and contraction in flowering plants. Genetica 115: 29–36. [DOI] [PubMed] [Google Scholar]
- Bennetzen JL, Kellogg EA. 1997. Do plants have a one-way ticket to genomic obesity? Plant Cell 9: 1509–1514. [DOI] [PMC free article] [PubMed] [Google Scholar]
- Bowe LM, Coat G, dePamphilis CW. 2000. Phylogeny of seed plants based on all three genomic compartments: Extant gymnosperms are monophyletic and Gnetales' closest relatives are conifers. Proceedings of the National Academy of Sciences of the USA 97: 4092–4097. [DOI] [PMC free article] [PubMed] [Google Scholar]
- Chase MW, Soltis DE, Olmstead RG, Morgan D, Les DH et al. 1993. Phylogenetics of seed plants—an analysis of nucleotide-sequences from the plastid gene rbc L. Annals of the Missouri Botanical Garden 80: 528–580. [Google Scholar]
- Chaw SM, Parkinson CL, Cheng YC, Vincent TM, Palmer JD. 2000. Seed plant phylogeny inferred from all three plant genomes: monophyly of extant gymnosperms and origin of Gnetales from conifers. Proceedings of the National Academy of Sciences of the USA 97: 4086–4091. [DOI] [PMC free article] [PubMed] [Google Scholar]
- Conway Morris S, Harper E. 1988. Genome size in Conodonts (Chordata): inferred variation during 270 million years. Science 241: 1230–1232. [DOI] [PubMed] [Google Scholar]
- Cox AV, Abdelnour GJ, Bennett MD, Leitch IJ. 1998. Genome size and karyotype evolution in the slipper orchids (Cypripedioideae: Orchidaceae). American Journal of Botany 85: 681–687. [PubMed] [Google Scholar]
- Devos KM, Brown JKM, Bennetzen JL. 2002. Genome size reduction through illegitimate recombination counteracts genome expansion in Arabidopsis. Genome Research 12: 1075–1079. [DOI] [PMC free article] [PubMed] [Google Scholar]
- Gregory TR. 2001. Coincidence, coevolution, or causation? DNA content, cell size, and the C-value enigma. Biological Reviews 76: 65–101. [DOI] [PubMed] [Google Scholar]
- Gregory TR. 2003. Is small indel bias a determinant of genome size? Trends in Genetics 19: 485–488. [DOI] [PubMed] [Google Scholar]
- Gregory TR. 2005. The C-value enigma in plants and animals: a review of parallels and an appeal for partnership. Annals of Botany 95: 133–146. [DOI] [PMC free article] [PubMed] [Google Scholar]
- Hanson L, Leitch IJ. 2002. DNA amounts for five pteridophyte species fill phylogenetic gaps in C-value data. Botanical Journal of the Linnean Society 140: 169–173. [Google Scholar]
- Johnston JS, Pepper AE, Hall AE, Chen ZJ, Hodnett G, Drabek J, Lopez R, Price HJ. 2005. Evolution of genome size in Brassicaceae. Annals of Botany 95: 229–235. [DOI] [PMC free article] [PubMed] [Google Scholar]
- Karol KG, McCourt RM, Cimino MT, Delwiche CF. 2001. The closest living relatives of land plants. Science 294: 2351–2353. [DOI] [PubMed] [Google Scholar]
- Khandelwal S. 1990. Chromosome evolution in the genus Ophioglossum L. Botanical Journal of the Linnean Society 102: 205–217. [Google Scholar]
- Kirik A, Salomon S, Puchta H. 2000. Species-specific double-strand break repair and genome evolution in plants. EMBO Journal 19: 5562–5566. [DOI] [PMC free article] [PubMed] [Google Scholar]
- Kugita M, Kaneko A, Yamamoto Y, Takeya Y, Matsumoto T, Yoshinaga K. 2003. The complete nucleotide sequence of the hornwort (Anthoceros formosae) chloroplast genome: insight into the earliest land plants. Nucleic Acids Research 31: 716–721. [DOI] [PMC free article] [PubMed] [Google Scholar]
- Leitch IJ, Bennett MD. 2004. Genome downsizing in polyploid plants. Biological Journal of the Linnean Society 82: 651–663. [Google Scholar]
- Leitch IJ, Chase MW, Bennett MD. 1998. Phylogenetic analysis of DNA C-values provides evidence for a small ancestral genome size in flowering plants. Annals of Botany 82: 85–94. [Google Scholar]
- Leitch IJ, Hanson L. 2002. DNA C-values in seven families fill phylogenetic gaps in the basal angiosperms. Botanical Journal of the Linnean Society 140: 175–179. [Google Scholar]
- Leitch IJ, Hanson L, Winfield M, Parker J, Bennett MD. 2001. Nuclear DNA C-values complete familial representation in gymnosperms. Annals of Botany 88: 843–849. [Google Scholar]
- Maddison WP, Maddison DR. 1992.MacClade: analysis of phylogeny and character evolution. Sunderland, MA: Sinauer Associates Inc. [DOI] [PubMed] [Google Scholar]
- Masterson J. 1994. Stomatal size in fossil plants—evidence for polyploidy in majority of angiosperms. Science 264: 421–424. [DOI] [PubMed] [Google Scholar]
- Midgley JJ, Bond WJ. 1991. Ecological aspects of the rise of angiosperms: a challenge to the reproductive superiority hypotheses. Biological Journal of the Linnean Society 44: 81–92. [Google Scholar]
- Murray BG. 1998. Nuclear DNA amounts in gymnosperms. Annals of Botany 82: 3–15. [Google Scholar]
- Nickrent DL, Melecot V. 2001. A molecular phylogeny of Santalales. In: Fer AP, Thalouarn P, Joel JM, Musselman, Parker C et al, eds. Proceedings of the 7th International Parasitic Weed Symposium. Nantes, France: Université de Nantes, 69–74. [Google Scholar]
- Obermayer R, Leitch IJ, Hanson L, Bennett MD. 2002. Nuclear DNA C-values in 30 species double the familial representation in pteridophytes. Annals of Botany 90: 209–217. [DOI] [PMC free article] [PubMed] [Google Scholar]
- Orel N, Puchta H. 2003. Differences in the processing of DNA ends in Arabidopsis thaliana and tobacco: possible implications for genome evolution. Plant Molecular Biology 51: 523–531. [DOI] [PubMed] [Google Scholar]
- Petrov DA. 2002. Mutational equilibrium model of genome size evolution. Theoretical Population Biology 61: 531–544. [DOI] [PubMed] [Google Scholar]
- Price HJ, Dillon SL, Hodnett G, Rooney WL, Ross L, Johnston JS. 2005. Genome evolution in the genus Sorghum (Poaceae). Annals of Botany 95: XXX–YYY. [DOI] [PMC free article] [PubMed] [Google Scholar]
- Proskauer J. 1958. Studies on the Anthocerotales. V. Phytomorphology 7: 113–135. [Google Scholar]
- Pryer KM, Schneider H, Smith AR, Cranfill R, Wolf pg, Hunt JS, Sipes SD. 2001. Horsetails and ferns are a monophyletic group and the closest living relatives to seed plants. Nature 409: 618–622. [DOI] [PubMed] [Google Scholar]
- Qiu YL, Lee JH, Bernasconi-Quadroni F, Soltis DE, Soltis PS et al. 1999. The earliest angiosperms: evidence from mitochondrial, plastid and nuclear genomes. Nature 402: 404–407. [DOI] [PubMed] [Google Scholar]
- Qiu YL, Palmer JD. 1999. Phylogeny of early land plants: insights from genes and genomes. Trends in Plant Science 4: 26–30. [DOI] [PubMed] [Google Scholar]
- Raven PH, Evert RF, Eichhorn C. 1999.Biology of Plants, 6th edn. New York: W.H. Freeman and Company. [Google Scholar]
- Renzaglia KS, Duff RJ, Nickrent DL, Garbary DJ. 2000. Vegetative and reproductive innovations of early land plants: implications for a unified phylogeny. Philosophical Transactions of the Royal Society of London Series B, Biological Sciences 355: 769–793. [DOI] [PMC free article] [PubMed] [Google Scholar]
- Renzaglia KS, Rasch EM, Pike LM. 1995. Estimates of nuclear DNA content in bryophyte sperm cells: phylogenetic considerations. American Journal of Botany 82: 18–25. [Google Scholar]
- Shirasu K, Schulman AH, Lahaye T, Schulze-Lefert P. 2000. A contiguous 66-kb barley DNA sequence provides evidence for reversible genome expansion. Genome Research 10: 908–915. [DOI] [PMC free article] [PubMed] [Google Scholar]
- Soltis DE, Soltis PS, Bennett MD, Leitch IJ. 2003. Evolution of genome size in the angiosperms. American Journal of Botany 90: 1596–1603. [DOI] [PubMed] [Google Scholar]
- Soltis DE, Soltis PS, Zanis MJ. 2002. Phylogeny of seed plants based on evidence from eight genes. American Journal of Botany 89: 1670–1681. [DOI] [PubMed] [Google Scholar]
- Temsch EM, Greilhuber J, Krisai R. 1998. Genome size in Sphagnum (peat moss). Botanica Acta 111: 325–330. [Google Scholar]
- Thomson KS. 1972. An attempt to reconstruct evolutionary changes in the cellular DNA content of lungfish. Journal of Experimental Biology 180: 363–372. [Google Scholar]
- Turmel M, Otis C, Lemieux C. 2003. The mitochondrial genome of Chara vulgaris: insights into the mitochondrial DNA architecture of the last common ancestor of green algae and land plants. Plant Cell 15: 1888–1903. [DOI] [PMC free article] [PubMed] [Google Scholar]
- Vicient CM, Suoniemi A, Anamthawat-Jonsson K, Tanskanen J, Beharav A, Nevo E, Schulman AH. 1999. Retrotransposon BARE-1 and its role in genome evolution in the genus Hordeum Plant Cell 11: 1769–1784. [DOI] [PMC free article] [PubMed] [Google Scholar]
- Vitte C, Panaud O. 2003. Formation of solo-LTRs through unequal homologous recombination counterbalances amplifications of LTR retrotransposons in rice Oryza sativa L. Molecular Biology and Evolution 20: 528–540. [DOI] [PubMed] [Google Scholar]
- Voglmayr H. 2000. Nuclear DNA amounts in mosses (Musci). Annals of Botany 85: 531–546. [Google Scholar]
- Wendel JF. 2000. Genome evolution in polyploids. Plant Molecular Biology 42: 225–249. [PubMed] [Google Scholar]
- Wendel JF, Cronn RC, Johnston JS, Price HJ. 2002. Feast and famine in plant genomes. Genetica 115: 37–47. [DOI] [PubMed] [Google Scholar]
- Zanis MJ, Soltis DE, Soltis PS, Mathews S, Donoghue MJ. 2002. The root of the angiosperms revisited. Proceedings of the National Academy of Sciences of the USA 99: 6848–6853. [DOI] [PMC free article] [PubMed] [Google Scholar]