

Abstract
Despite the low prevalence of activating point mutation of RAS or RAF genes, the RAS–extracellular signal-regulated kinase (ERK) pathway is implicated in breast cancer pathogenesis. Indeed, in triple-negative breast cancer (TNBC), there is recurrent genetic alteration of pathway components. Using short hairpin RNA (shRNA) methods, we observed that the zinc finger transcription factor Krüppel-like factor 4 (KLF4) can promote RAS-ERK signaling in TNBC cells. Endogenous KLF4 bound to the promoter regions and promoted the expression of two microRNAs (miRs), miR-206 and miR-21 (i.e., miR-206/21). Antisense-mediated knockdown (anti-miR) revealed that miR-206/21 coordinately promote RAS-ERK signaling and the corresponding cell phenotypes by inhibiting translation of the pathway suppressors RASA1 and SPRED1. In TNBC cells, including cells with mutation of RAS, the suppression of either RASA1 or SPRED1 increased the levels of GTP-bound, wild-type RAS and activated ERK 1/2. Unlike the control cells, treatment of RASA1- or SPRED1-suppressed cells with anti-miR-206/21 had little or no impact on the level of activated ERK 1/2 or on cell proliferation and failed to suppress tumor initiation. These results identify RASA1 and SPRED1 mRNAs as latent RAS-ERK pathway suppressors that can be upregulated in tumor cells by anti-miR treatment. Consequently, KLF4-regulated miRs are important for the maintenance of RAS-ERK pathway activity in TNBC cells.
INTRODUCTION
In comparison to simpler organisms, the evolution of metazoans required adaptations for the proper regulation of cell fate (1). One such adaptation is the mitogen-activated protein kinase (MAPK) pathway, composed of RAS, RAF, MEK, and extracellular signal-regulated kinase (ERK), which regulates a variety of cell physiologic processes (2–9). Diverse stimuli, including growth factors, interaction with extracellular components, and cell stress, can signal through receptor tyrosine kinases (RTKs), integrins, or ion channels to regulate signaling through the RAS GTPases. GTP-bound RAS (RAS-GTP) can activate mitogen-activated protein kinase kinase kinases (MAP3Ks) (i.e., the RAF family of protein kinases), leading to sequential phosphorylation and activation of MAP2Ks (i.e., MEK 1/2) and the extracellular signal-regulated kinases (ERK 1/2).
Inhibitory proteins play important roles in RAS-ERK pathway regulation. These include the RAS p21 protein activator (GTPase-activating protein [GAP]) 1 (RASA1), the GAP neurofibromin 1 (NF1), the sprouty homologs SPRY1 and SPRY2, and the sprouty-related, EVH1 domain-containing (SPRED) proteins, SPRED1 and SPRED2 (10–12). SPRED1 associates with NF1 to mediate its membrane localization, implicating GAP activity as a shared molecular mechanism among pathway inhibitory proteins (13). Congenital disorders that deregulate this kinase cascade include neurofibromatosis type I, Legius syndrome, Noonan syndrome, Costello syndrome, and cardiofaciocutaneous syndrome (8, 9, 14–16).
In addition, somatic alteration of this pathway is critical for the initiation and progression of a variety of cancers. Activating point mutations of RAS genes or BRAF occur in approximately 15 to 30% and 7% of all human cancers, respectively (3, 17–20). In human breast cancer, point mutation of these genes is rare, but activated ERK 1/2 levels are frequently elevated and contribute to the aggressive behavior of cancer cells (21, 22).
RAS-ERK pathway activity appears particularly critical in triple-negative breast cancers (TNBCs), tumors that are deficient in estrogen receptor alpha (ERα), HER2, and progesterone receptor (23, 24). This group of clinically aggressive tumors overlaps extensively the basal-like and claudin-low molecular subtypes (25). Genomic analysis of human basal-like breast tumors indicates frequent copy number gain of KRAS (32%) and BRAF (30%) and reduced gene copy number for pathway inhibitors, such as RASA1 and DUSP4 (26–31). For RASA1, the correlation of mRNA levels, genomic copy number, and clinical outcome supports a functional role in TNBC (29). Consistent with these results, basal-like breast tumors have a high RAS-ERK pathway activity signature (24, 30). Despite this insight, therapeutic targeting of the pathway is hindered by cellular mechanisms of escape, including dynamic reprogramming of the kinome and phosphatidylinositol 3-kinase (PI 3-kinase) activation, and improved strategies for inhibiting the pathway are needed (32, 33).
The zinc finger transcription factor Krüppel-like factor 4 (KLF4) is a pluripotency factor that functions in tumors in a context-dependent fashion, capable of exerting both protumorigenic and antitumorigenic effects (34–36). Supporting a tumor suppressor role, its expression is reduced during development of tumors such as colorectal cancer, and endogenous Klf4 suppresses tumorigenesis in the ApcMin mouse model (37). In normal cells, KLF4 is often induced in response to cell stress or wounding, and protumorigenic influences may reflect its role in the stress response (38–46). Loss- or gain-of-function studies show that KLF4 can promote malignant properties, including epithelial transformation in vitro, escape from RAS-induced senescence, enhanced cell survival following gamma radiation-induced DNA damage, increased tumorigenicity of colorectal cancer stem cell-enriched spheroid cells, and skin tumor initiation in transgenic mice (43, 47–50).
In human breast cancers, there is typically higher expression of KLF4 in tumor cells compared with the adjacent, uninvolved epithelium. This elevated protein level, or else demethylation of the KLF4 promoter, portends a poor prognosis (51–54). We previously identified microRNA 206 (miR-206) as a potential downstream effector of KLF4 that, in turn, directly regulates KLF4 translation, constituting a feedback loop (55). miRs associate with the RNA-induced silencing complex (RISC) to regulate the translation of cognate mRNAs. miR deregulation occurs in multiple cancer types and can promote or inhibit tumorigenesis (56–58).
In the present study, we suppressed KLF4 in TNBC cells and observed a decrease in miR-206 levels, attributed to the reduced association of KLF4 with a MIR206 promoter-proximal consensus site. Pathway analysis of putative miR-206 regulated genes identified this miR as a likely regulator of MAPK signaling, and in KLF4-deficient cells, we observed marked downregulation of activated ERK 1/2 regardless of the RAS mutational status. As miRs can function in a combinatorial fashion, we sought additional miR effectors of KLF4 signaling to RAS-ERK. The protumorigenic microRNA miR-21 is upregulated in breast cancer and was previously validated to target RAS-ERK pathway inhibitory proteins (59–65). Furthermore, pathway enrichment identified MAPK signaling as likely to be cotargeted by miR-206 and miR-21 (miR-206/21). We subsequently observed reduced levels of miR-21 in KLF4-deficient cells, attributed to a direct interaction of KLF4 with the MIR21 promoter. These results identified a pathway by which a pluripotency factor can signal through two distinct miRs to impact RAS-ERK signaling.
The loss of activated ERK 1/2 upon KLF4 depletion corresponded to a decrease in the level of GTP-bound wild-type (WT) RAS, and we found that miR-206 and miR-21 cotarget both RASA1 and SPRED1 to repress their translation. Although each miR alone had only modest effects on the level of activated ERK 1/2, simultaneous inhibition of both miRs led to marked downregulation of activated ERK 1/2, similarly to what was observed for KLF4-deficient cells. In RAS WT and RAS mutant cells alike, depletion of either RASA1 or SPRED1 promoted RAS-ERK pathway activity by modulating the levels of WT RAS-GTP. Knockdown of either RASA1 or SPRED1 conferred resistance to antisense miR (anti-miR)-mediated inhibition of RAS-ERK signaling and promoted in vivo tumor initiation. These studies identify miR-206/21 as protumorigenic outputs of KLF4 signaling in TNBC cells, identify RASA1 and SPRED1 transcripts as latent RAS-ERK suppressors, and point to antagonists of KLF4-dependent miRs as potential agents for the therapeutic reexpression of RAS-ERK pathway inhibitory proteins.
MATERIALS AND METHODS
Cell lines, cell culture, and drug treatments.
The MDA-MB-231, HCC1143, HCC1937, MDA-MB-468, and Hs578t breast cancer cell lines were obtained from ATCC. MCF10A and MCF10AT cells were provided by Steven M. Frisch (West Virginia University). SUM159PT cells were provided by Gary L. Johnson (University of North Carolina at Chapel Hill), and M6 cells were provided by Jeffrey E. Green (National Cancer Institute). MDA-MB-231 and M6 cells were cultured in Dulbecco's modified Eagle's medium (DMEM) supplemented with 10% (vol/vol) fetal bovine serum (FBS). HCC1143 cells were cultured in RPMI 1640 supplemented with 10% FBS. Hs578t cells were cultured in DMEM supplemented with 5 μg/ml insulin and 10% FBS. HCC1937 and MDA-MB-468 cells were cultured in RPMI 1640 supplemented with 5 μg/ml insulin and 10% FBS. SUM159PT cells were cultured in 50:50 DMEM–F-12 supplemented with 5 μg/ml insulin, 1 μg/ml hydrocortisone, and 5% horse serum. MCF10A and MCF10AT cells were cultured in 50:50 DMEM–F-12 supplemented with 10 μg/ml insulin, 0.5 μg/ml hydrocortisone, 20 ng/ml epidermal growth factor (EGF), 100 ng/ml cholera toxin, and 5% horse serum. Cell culture medium was also supplemented with penicillin and streptomycin. 4-Hydroxytamoxifen (4-OHT) was dissolved in ethanol and used at 0.3 μM. U0126 (Sigma) was dissolved in dimethyl sulfoxide (DMSO) and used at 20 μM. 5-Aza-2′-deoxycytidine–decitabine (AZA; Selleck Chemicals) and trichostatin A (TSA; Selleck Chemicals) were dissolved in DMSO and used at 10 μM and 400 nM, respectively. Subconfluent cell cultures were treated with AZA for 96 h or TSA for 12 h. For the AZA treatment, the drug-containing medium was replenished every 24 h.
Retroviral transduction.
Suppression studies utilized pGIPZ lentiviral short hairpin RNAmir (shRNAmir) plasmids (V2LHS_28277–shKLF4-1, V3LHS_410934–shKLF4-2, V2LHS_28349–shKLF4-3, V3LHS_376638–shKLF4-4, V3LHS_410935–shKLF4-5, V2LHS_149857–shRASA1-1, V2LHS_203287–shRASA1-2, V2LHS_49151–shSPRED1-1, or V3LHS_634744–shSPRED1-2 [Open Biosystems]). The retroviral vector pLJD-HA-KLF4 was previously described (51). pLJD-KLF4-ER was generated by transfer of the insert from pBpuro-KLF4-ER to pLJD (48). Viral transduction was performed as described previously, and pGIPZ- and pLJD-transduced cells were selected using puromycin (0.5 μg/ml for HCC1937 and MDA-MB-468; 1 μg/ml for MCF10A, MCF10AT, MDA-MB-231, Hs578t, SUM159PT, and HCC1143; and 5 μg/ml for M6) or Geneticin (200 μg/ml), respectively (55).
Plasmid construction.
The pMIR-REPORT firefly luciferase (luc) vector was purchased from Ambion/Invitrogen. pRL-TK Renilla luc reporter was obtained from Promega (Madison, WI). cDNA clones containing full-length RASA1 (clone ID BC033015) and a 1.2-kb fragment of the 3′ untranslated region (3′ UTR) of SPRED1 (clone ID BG167687) were purchased from Open Biosystems. To construct a WT RASA1 translational reporter, a 926-bp fragment of the RASA1 3′ UTR was generated by sequential treatment with BamHI, Klenow fragment, and XbaI. This fragment was inserted into pMIR-REPORT vector that was prepared by sequential treatment with HindIII, Klenow fragment, and SpeI. To construct a WT SPRED1 reporter containing the putative miR-206 binding site, the 1.2-kb SPRED1 3′ UTR from clone BG167687 was excised by treatment with MluI and inserted into the same site of pMIR-REPORT. Finally, a 744-bp fragment of the SPRED1 3′ UTR containing two putative miR-21 binding sites was amplified by PCR from MDA-MB-231 cDNA using the oligonucleotides 5′-cccacgcgtTGAAAAACTGTTTAACTCATGT-3′ and 5′-cccacgcgtTGAAAAACCTGTAAATAAGCAC-3′. (The SPRED1 sequence is indicated in uppercase.) Following MluI digestion, the product was cloned into the same site of the pMIR-REPORT vector.
To generate RASA1 and SPRED1 reporters with mutation of miR seed complementary regions, the WT reporter sequence was altered so as to conserve the predicted secondary structure of the WT 3′ UTR, as indicated by the mfold Web Server (66). Oligonucleotides for PCR mutagenesis included the following (shown as the forward and then reverse sequence with mutated bases in lowercase): RASA1–miR-206 site (5′-AAAAATAGCACACTTTTCCAacTctCAGTGATGTGTGAGCTATGC-3′ and 5′-GCATAGCTCACACATCACTGagAgtTGGAAAAGTGTGCTATTTTT-3′), SPRED1–miR-206 site (5′-ATATATATATCTACTGTCAacTctCATATATTTTGAATATTTAAC-3′ and 5′-GTTAAATATTCAAAATATATGagAgtTGACAGTAGATATATATAT-3′), SPRED1–miR-21 site 1 (5′-GTATTCAGATTTTTTTTTAAGTCTCTAgatcAATAATGTTATATTTATTG-3′ and 5′-CAATAAATATAACATTATTgatcTAGAGACTTAAAAAAAAATCTGAATAC-3′), and SPRED1–miR-21 site 2 (5′-TTGGTAACATGTTGCAGCTAccCTAATGACCTTAAGTGGCAATTG-3′ and 5′-CAATTGCCACTTAAGGTCATTAGggTAGCTGCAACATGTTACCAA-3′). Cloned PCR products were confirmed by sequence analysis.
Transient-transfection and translational reporter assays.
Anti-miR inhibitors (AM) and miR mimics (PM) were obtained from Ambion/Invitrogen, including, Homo sapiens miR-206 (hsa-miR-206) (AM10409 and PM10409), hsa-miR-21-5p (AM17000 and PM17100), AM negative-control 1 (AM17010), and PM negative-control 1 (AM17110). Inhibitors and mimics were diluted to 20 μM in nuclease-free water and where indicated transfected either singly or in combination into cells at a final total concentration of 25 nM. Where two miR reagents were cotransfected, the final concentration was 12.5 nM each. For analysis of endogenous protein or miR levels, two sequential transfections were performed. Cells were subjected to reverse transfection, and 24 h later, forward transfection was performed as described previously (55). At 24 h after the start of the forward transfection, cell extracts were prepared for expression studies, or cells were used for phenotypic studies. Translational reporter assays were performed after only a single transfection, and extracts were prepared at 24 h after the start of the reverse transfection. Inhibitors or mimics were cotransfected with reporter plasmids, including the pRL-TK control, and dual-luciferase reporter (DLR) assays (Promega) were performed as described previously (55).
In vitro cell proliferation, transwell migration, and anoikis assays.
Cells were plated for the respective assay at 24 h following the final transfection with AM or PM. To measure cell proliferation, 1 × 10³ cells/well were transferred to 96-well plates and cultured for the indicated interval. Cell proliferation was determined using the ATPlite luminescence ATP detection assay system (PerkinElmer). Cell number was calculated by constructing a standard curve and correlating the cell number with the luminescence signal. In parallel, two-dimensional (2D) cell viability was measured by trypan blue exclusion.
For transwell migration assays, 1 × 10⁴ cells were plated in the top chamber using growth medium containing 0.5% FBS (24-well plates, pore size, 8 μm; BD Biosciences). Growth medium containing 10% FBS was used as a chemoattractant in the lower chamber. After 24 h, cells on the lower surface of the membrane were stained using the Diff-Quik stain set (Siemens) and counted.
To quantitate cell death (anoikis), 1 × 10⁵ cells/well in DMEM complete growth medium containing 1% (wt/vol) methylcellulose were added to a 6-well Ultralow attachment cluster dish (Costar). After 24 h in suspension, the cells were washed twice with phosphate-buffered saline (PBS) and suspended in 200 μl of AccuMax (Innovative Cell Tech). Cell death was measured by trypan blue exclusion. Alternatively, suspended cells were analyzed for cell death by flow cytometry.
Flow cytometry.
Flow cytometric analysis of apoptosis was performed using the Alexa Fluor 488-annexin V/dead cell apoptosis kit (Invitrogen). Samples were analyzed on a BD Fortessa flow cytometer using BD FACSDiva 7.0 software (BD Biosciences). A total of 10,000 events were collected per sample. Data analysis was performed using FCS Express 4 Research Edition software (De Novo Software).
Immunoblot analysis and antibodies.
Cells were maintained as subconfluent monolayers in complete growth medium. For analysis of protein levels, including the levels of phosphorylated MEK 1/2 and ERK 1/2, cells were fed with complete growth medium 18 to 24 h prior to extraction. Cells were washed twice in PBS and then lysed in ice-cold radioimmunoprecipitation assay (RIPA) buffer (150 mM NaCl, 1% [wt/vol] sodium deoxycholate, 1% [vol/vol] Triton X-100, 5 mM EDTA, 50 mM Tris-HCl [pH 7.5], 0.25 mM phenylmethylsulfonyl fluoride [PMSF], 1 mM benzamidine, 1 mM pepstatin, 1 μg/ml leupeptin, 1 μg/ml aprotinin, 0.4 mM sodium orthovanadate, 40 mM β-glycerophosphate, 20 mM NaF). Extracts were centrifuged at 15,000 × g, and the protein concentration was determined using the Bradford assay (Bio-Rad). Following electrophoresis, proteins were transferred onto nitrocellulose membranes and probed with the indicated antibody. Antibodies included anti-phospho-ERK 1/2 (anti-pERK 1/2; Thr202/Tyr204) (9101; Cell Signaling), anti-ERK2 (C-14; Santa Cruz), anti-phospho-MEK 1/2 (anti-pMEK 1/2) (9154; Cell Signaling), total anti-MEK 1/2 (anti-tMEK 1/2) (9126; Cell Signaling), antihemagglutinin (anti-HA) (3F10; Roche), anti-KLF4 (H-180; Santa Cruz), anti-β-actin (C-4; Santa Cruz), anti-p21Cip1/Waf1 (C-19; Santa Cruz), anti-RASA1 (B4F8; Santa Cruz), anti-SPRED1 (77079; Abcam), anti-PDCD4 (600-401-965; Rockland Immunochemicals), anti-HRAS (C-20; Santa Cruz), anti-NRAS (F155; Santa Cruz), and anti-KRAS (F234; Santa Cruz). Bound antibodies were detected using Pierce ECL enhanced chemiluminescence Western blotting substrate (Thermo Scientific). Scanned images were quantitated using ImageJ software, with normalization to the loading control. Column data indicate the average of three independent experiments.
RAS-GTP affinity precipitation.
Affinity precipitation of active RAS (RAS-GTP) utilized the RAS assay reagent, a glutathione S-transferase (GST) fusion protein corresponding to the RAS binding domain (RBD [residues 1 to 149]) of Raf-1 (Millipore). For analysis of RAS-GTP levels, cells were fed with complete growth medium 18 to 24 h prior to protein extraction. Cells were washed twice in PBS and then lysed in ice-cold magnesium-containing lysis buffer (MLB) (25 mM HEPES, pH 7.5, 150 mM NaCl, 1% Igepal CA-630, 0.25% sodium deoxycholate, 10% glycerol, 10 mM MgCl2, 1 mM EDTA, 25 mM NaF, 1 mM sodium orthovanadate, 10 μg/ml leupeptin, 10 μg/ml aprotinin). Whole-cell lysates (WCL) were centrifuged at 15,000 × g for 15 min, and the protein concentration was determined using the Bradford assay (Bio-Rad). WCLs were diluted to 1 mg/ml, and 1 ml of the lysate was precleared with glutathione-agarose and used for affinity precipitation with 10 μg of the Raf-1 RBD-agarose conjugate. The agarose beads were collected by centrifugation at 15,000 × g and washed three times with MLB. Beads were resuspended in 2× Laemmli sample buffer and boiled at 95°C for 5 min. Samples were diluted to 1× Laemmli buffer and subjected to SDS-PAGE and immunoblot analysis.
Reverse transcription and real-time PCR detection of miRs.
Total RNA was extracted using the mirVana miR isolation kit (Ambion/Invitrogen). For mRNA analysis, total RNA was reverse transcribed using SuperScript II reverse transcriptase (Invitrogen). ESR1 transcripts were analyzed using the Brilliant II SYBR green quantitative PCR (qPCR) master mix (Agilent) with the following primers: 5′-AGGTGGACCTGATCATGGAG-3′ and 5′-AAGCTTCGATGATGGGCTTA-3′. Reactions were normalized to B2M (5′-TCTCTGCTGGATGACGTGAG-3′ and 5′-TAGCTGTGCTCGCGCTACT-3′). Individual miRs were analyzed by stem-loop reverse transcription followed by quantitative real-time PCR (qPCR) detection using TaqMan microRNA assays (Applied Biosystems) and normalized to U6 snRNA: hsa-miR-206 (000510), hsa-miR-21-5p (000397), and U6 snRNA (001973). PCRs were performed on an Mx3005P real-time PCR system (Stratagene). mRNA and miR levels were determined by the threshold cycle (ΔΔCT) method. Three independent experiments were performed in duplicate fashion.
ChIP.
Potential KLF4 binding sites were identified using JASPAR (67). Chromatin from 4 × 10⁷ cells was prepared as described previously (68) and used as the input for each immunoprecipitation (IP). Chromatin was sonicated in ice water using a Bioruptor (Diagenode) set at high energy, cycling on/off at 30-s intervals for 6 cycles of 10 min each. IP was performed using 1 μg of the indicated antibody. Following IP, elution, reversal of cross-links, and proteinase K digestion, DNA was purified using Qiaquick spin columns (Qiagen) and then eluted in 50 μl of 10 mM Tris-HCl (pH 8.0). Two percent of the chromatin immunoprecipitation (ChIP) yield was used as the input for each PCR. ChIP intensity levels were determined by use of the ΔCT method to compare the yield obtained using anti-KLF4 or normal IgG. The sequences of oligonucleotides are as follows: miR-21 site 1, 5′-CTTAGATTGAGAAAGACCGC-3′ and 5′-ACTTATGCTTGTGTCATCCC-3′; miR-21 site 2, 5′-GCAACCTCCACTTCCTGGGT-3′ and 5′-CCAACACAGTGAAACCCTGT-3′; miR-206 site 1, 5′-CATCAACAACACCCCAAGCG-3′ and 5′-GGCACAGTTTTGGATCAACCC-3′; and miR-206 site 2, 5′-TGCAAAGCACAGAGAAACGTG-3′ and 5′-ACCTTCTTCCCATTTTCCTGGAC-3′.
Animal studies.
Female athymic nude mice [Crl:NU(NCr)-Foxn1nu] (Charles River) were obtained at 6 to 8 weeks of age. A total of 2 × 10⁶ cells in in 100 μl of DMEM were injected into the 4th mammary fat pad. Caliper measurements were performed twice a week, and tumor initiation was defined as ≥4 mm for both the long axis (L1) and short axis (L2). All animal procedures were performed under an approved protocol.
Statistical analysis.
Data were analyzed using the unpaired two-tailed t test or else one-way analysis of variance (ANOVA) followed by Tukey's multiple comparison ad hoc posttest. Growth curves were analyzed using nonlinear regression curve fitting. Tumor initiation was analyzed using a 2-by-2 contingency table with Fisher's exact test. Statistical analyses were performed in Prism 5 (GraphPad Software). Except where noted, assays were performed three times in duplicate fashion. Cell proliferation assays were performed in three independent experiments, each containing 5 replicates. Differences were considered significant when the analysis yielded a P value of <0.05.
RESULTS
KLF4 regulates miR-206 and ERK signaling in TNBC cells.
Consistent with our previous study, miR-206 levels were markedly repressed in KLF4-depleted cells (Fig. 1A) (55). Similar results were obtained in the RAS mutant (KRASG13D) and claudin-low tumor line MDA-MB-231 and the RAS-WT and basal-like HCC1143 cells. ChIP analysis of KLF4 at consensus sites in the MIR206 locus identified enrichment of site 1, located within the promoter-proximal region (Fig. 1B). Supporting specificity, this enrichment was reduced in KLF4-deficient cells and increased in cells with exogenous KLF4 (Fig. 1C).
FIG 1.

KLF4 is bound to the MIR206 promoter region and induces miR-206 expression. (A) TNBC cells were transduced with lentiviral vectors expressing KLF4 shRNA or a nontargeting control (Ctl). Endogenous miR-206 levels in stably selected cells were measured by stem-loop reverse transcriptase real-time quantitative PCR. miR-206 levels were measured relative to U6 snRNA. Mean values are shown; error bars represent standard errors (SE). **, P < 0.01; ***, P < 0.001. (B) Schematic of the MIR206 locus (left panel) indicating KLF4 consensus binding sites that were analyzed by ChIP analysis of MDA-MB-231 cells (right panel). n.s., not significant. (C) KLF4 protein levels (upper panels) and the KLF4-MIR206 ChIP intensity levels (lower panels) were analyzed in MDA-MB-231 cells expressing shKLF4, a KLF4 transgene, or controls. β-Actin served as a loading control for immunoblot analysis.
As protumorigenic mechanisms of KLF4 signaling remain poorly understood, we sought potential effectors of miR-206. In silico enrichment analysis identified MAPK signaling as likely to be regulated by miR-206, which has the potential to target 17 genes in this pathway (P = 1.24 × 10⁻²) (Table 1). Because of its ability to regulate miR-206, we first determined whether endogenous KLF4 can regulate steady-state RAS-ERK activity in TNBC cells by analyzing ERK 1/2 activation loop phosphorylation (i.e., activated ERK 1/2 or pERK 1/2). In KLF4-deficient cells, the pERK 1/2 levels were suppressed (Fig. 2A). In these cell lines, the reduction of pERK 1/2 reflected lower levels of WT RAS-GTP, whereas mutant RAS-GTP levels were unaffected by KLF4 knockdown (Fig. 2B). In KLF4-deficient MDA-MB-231 cells, introduction of HA-tagged KLF4 rescued the levels of miR-206 and pERK 1/2 (Fig. 2C).
TABLE 1.
Pathway enrichment analysis of putative miR-206-regulated genesa
| KEGG pathway | P value | No. of predicted targets in pathway |
|---|---|---|
| Dorsoventral axis formation | 2.58E−6 | 6 |
| Gap junction | 2.58E−6 | 9 |
| Glioma | 1.39E−5 | 9 |
| Long-term potentiation | 5.16E−5 | 9 |
| Transcriptional misregulation in cancer | 8.44E−5 | 16 |
| Thyroid cancer | 2.86E−4 | 4 |
| Chronic myeloid leukemia | 1.06E−3 | 8 |
| Prostate cancer | 1.48E−3 | 9 |
| Pentose phosphate pathway | 2.14E−3 | 4 |
| Neurotrophin signaling pathway | 4.13E−3 | 10 |
| Insulin signaling pathway | 4.13E−3 | 11 |
| Melanoma | 4.13E−3 | 7 |
| Spliceosome | 5.11E−3 | 11 |
| Bacterial invasion of epithelial cells | 5.11E−3 | 7 |
| mRNA surveillance pathway | 6.73E−3 | 7 |
| Alcoholism | 6.73E−3 | 12 |
| Non-small cell lung cancer | 8.82E−3 | 6 |
| MAPK signaling pathway | 1.24E−2 | 17 |
| Regulation of actin cytoskeleton | 1.38E−2 | 13 |
| Endometrial cancer | 1.47E−2 | 5 |
| Lysine degradation | 1.73E−2 | 4 |
| GnRH signaling pathway | 1.73E−2 | 7 |
| Dilated cardiomyopathy | 1.85E−2 | 7 |
| Progesterone-mediated oocyte maturation | 2.25E−2 | 7 |
| Glycosphingolipid biosynthesis—lacto and neolacto series | 2.75E−2 | 1 |
Genes containing potential miR-206 binding sites were analyzed using DIANA miRPath (97). Results representing the MAPK signaling pathway have been highlighted in boldface.
FIG 2.

KLF4 rapidly induces miR-206 and RAS-ERK signaling. (A) The indicated proteins, including phospho-ERK 1/2 (pERK 1/2) and ERK2, were analyzed by immunoblot analysis of TNBC cells expressing shKLF4 or shCtl. Bar graph data indicate the average of three independent experiments. Error bars represent standard deviations (SD). (B) The levels of GTP-bound (active) HRAS, NRAS, and KRAS in cell extracts were analyzed by affinity precipitation using the RAS binding domain (RBD) of Raf-1. RAS proteins were analyzed by immunoblotting. The level of each RAS isoform in the whole-cell lysate (WCL) served as the loading control. (C) KLF4-deficient MDA-MB-231 cells were transduced with retroviral vector expressing hemagglutinin (HA) epitope-tagged KLF4 or empty vector (Ctl). miR-206 levels (left panel) and levels of the indicated proteins (right panel) were analyzed. (D) KLF4-deficient MDA-MB-231 cells were transduced with a 4-hydroxytamoxifen (4-OHT)-dependent transgene, coding for KLF4-ER, or empty vector. KLF4 and KLF4-ER levels were analyzed by immunoblotting. (E) miR-206 levels (left panel) and levels of the indicated proteins (right panel) were analyzed. CDKN1A is regulated by KLF4, and p21Cip1/Waf1 therefore served as an indicator of KLF4 activity. *, P < 0.05; **, P < 0.01; ***, P < 0.001.
To temporally correlate the induction of miR-206 and pERK 1/2 by KLF4, we transduced KLF4-depleted MDA-MB-231 cells with KLF4-ER or empty vector (Fig. 2D). The KLF4-ER fusion protein is constitutively expressed but functionally inactive until treatment of cells with 4-hydroxytamoxifen (4-OHT) (48, 69). As previously reported, addition of 4-OHT to KLF4-ER cells resulted in upregulation of miR-206 between 0.5 and 2 h posttreatment (Fig. 2E, left panel) (55). In this experiment, the induction of pERK 1/2 was apparent by 2 h (Fig. 2E, right panel). KLF4-ER activity was supported by the induction of cyclin-dependent kinase inhibitor 1A (p21Cip1/Waf1) in these cells (70) (Fig. 2E, right panel). The modest induction of activated ERK 1/2 by exogenous KLF4 (Fig. 2C and E) was in contrast to the larger fold effect of endogenous KLF4 (Fig. 2A), identifying a discordance between the two approaches.
miR-206 suppresses the translation of the RAS-ERK pathway inhibitors RASA1 and SPRED1.
Consistent with the mutual dependence of both miR-206 and RAS-ERK activity upon KLF4, we sought to identify specific components of the RAS-ERK pathway that are regulated by this miR. The two RAS-ERK pathway suppressors RASA1 and SPRED1 were consistently identified as likely miR-206 targets across multiple miR algorithms (Table 2). Consistent with regulation by miR-206, KLF4 depletion was associated with higher levels of RASA1 and SPRED1 (Fig. 3A). To examine a role for endogenous miR-206, we utilized antisense inhibitor specific to the mature miR (anti-miR). Compared to the control, anti-miR-206 depleted the miR levels in TNBC cells (Fig. 3B). This suppression of miR-206 activity was sufficient to increase the levels of the two pathway inhibitors (Fig. 3C, left panels). Conversely, transfection of exogenous miR-206 (miR-206 mimic) decreased the level of each protein (Fig. 3C, right panels). These results identified miR-206 as a potential link between KLF4 and RAS-ERK signaling.
TABLE 2.
Putative miR-206 target genes related to the MAPK/ERK signaling pathway
| Target gene | Result bya: |
Total no. of hitsb | ||||||
|---|---|---|---|---|---|---|---|---|
| DIANA | MIRANDA | MIRBRIDGE | PICTAR | PITA | RNA22 | TARGETSCAN | ||
| RASA1 | V | V | V | V | V | V | V | 7 |
| SPRED1 | V | V | V | V | V | V | 6 | |
| RIT2 | V | V | V | V | V | V | 6 | |
| MAP4K3 | V | V | V | V | V | V | 6 | |
| BDNF | V | V | V | V | V | V | 6 | |
| NGFR | V | V | V | V | V | 5 | ||
| PDGFA | V | V | V | V | V | 5 | ||
| PDCD4 | V | V | V | V | 4 | |||
| MAPK1 | V | V | V | V | 4 | |||
| CRK | V | V | V | V | 4 | |||
| MAP3K1 | V | V | V | V | 4 | |||
| SRC | V | V | V | 3 | ||||
| RPS6KA5 | V | V | V | 3 | ||||
| RAP1A | V | V | V | 3 | ||||
| RALA | V | V | V | 3 | ||||
| MAPK3 | V | V | V | 3 | ||||
| KRAS | V | V | V | 3 | ||||
| GNB1 | V | V | V | 3 | ||||
| IKBKB | V | V | V | 3 | ||||
| RAPGEF2 | V | V | V | 3 | ||||
| PRKACB | V | V | V | 3 | ||||
Candidate miR-206 target genes relevant to MAPK/ERK signaling were identified using KEGG, BIOCARTA, or REACTOME pathway analysis tools. V, the transcript is predicted to contain a miR-206 binding site by the relevant miR analysis tool.
Ranking (total number of hits) was performed using miRSystem (98).
FIG 3.

KLF4 and miR-206 regulate the levels of two RAS-ERK pathway suppressors, RASA1 and SPRED1. (A) RASA1 and SPRED1 levels were determined by immunoblot analysis of KLF4-deficient cells and control cells. (B) TNBC cells were transfected with either anti-miR-206 or a nontargeting anti-miR (Ctl), and miR-206 levels were determined. (C) TNBC cells were transfected with the indicated anti-miR or miR mimic. RASA1 and SPRED1 levels were analyzed by immunoblotting. *, P < 0.05; **, P < 0.01; ***, P < 0.001.
To analyze the regulation of protein translation by miR-206, we utilized translational reporter assays. Fragments of the 3′ UTRs containing putative miR-206 binding sites were cloned downstream of the open reading frame of firefly luc (Fig. 4A and B). Relative to the control anti-miR, in MDA-MB-231 cells transfected with anti-miR-206, the luc activity was 3.9-fold induced for the WT RASA1 reporter and 2.4-fold induced for the WT SPRED1 reporter (Fig. 4C and D, top and middle panels). Conversely, transfection of each reporter with the miR-206 mimic decreased luc activity by 32% for the RASA1 reporter and by 64% for the SPRED1 reporter (Fig. 4C and D, bottom panels). Reporter regulation by miR-206 was abolished by mutation of RASA1 or SPRED1 sequences important for miR-206 binding (Fig. 4C and D). These results identify miR-206 as a direct regulator of these transcripts, supporting a role for KLF4 in promotion of RAS-ERK signaling through miR-206-mediated suppression of RASA1 and SPRED1.
FIG 4.

miR-206 represses the translation of RASA1 and SPRED1 by directly targeting the 3′ UTRs. (A and B) Schematic of the RASA1 3′ UTR (A) and the SPRED1 3′ UTR (B) indicating potential miR-206 binding sites. The portion of each 3′ UTR that was cloned into the translational reporter is indicated relative to the stop codon and polyadenylation signal. The sequence of the miR-206 candidate binding site is indicated below each schematic for several mammals: Homo sapiens (Hsa), Pan troglodytes (Ptr), Mus musculus (Mmu), and Bos taurus (Bta). (The seed sequence complement is underlined.) (C and D) For analysis of protein translation, WT and mutant versions of the RASA1 3′ UTR (C) or SPRED1 3′ UTR (D) were inserted into the 3′ UTR of firefly luc (top panels, 3′ UTR WT and 3′ UTR Mut). MDA-MB-231 cells were cotransfected with reporters in combination with either anti-miR (middle panels) or the miR mimic (bottom panels). The normalized activity of the reporters relative to empty luc vector was analyzed at 24 h posttransfection. *, P < 0.05; **, P < 0.01; n.s., not significant.
miR-21 is a KLF4-dependent miR that represses the translation of both RASA1 and SPRED1.
As modulation of miR-206 alone was not sufficient to recapitulate the effects of KLF4 on pERK 1/2 levels, we therefore sought additional downstream effectors. Similarly to miR-206, miR-21 is upregulated in breast cancer and is predicted by pathway enrichment analysis to regulate MAPK signaling (P = 2.09 × 10⁻³) (Table 3) (59). Furthermore, miR-21 has been validated to directly regulate the translation of several RAS-ERK-activator protein 1 (AP-1) inhibitory components, including RASA1, SPRY1, SPRY2, and PDCD4 (56–58). These common features suggested the possibility of shared signaling by these two miRs. Providing compelling support for this idea, MAPK signaling was ranked first among the pathways likely to be coregulated by miR-206/21 (P = 3.00 × 10⁻⁴) (Table 4).
TABLE 3.
Pathway enrichment analysis of putative miR-21-regulated genesa
| KEGG pathway | P value | No. of predicted targets in pathway |
|---|---|---|
| Cytokine-cytokine receptor interaction | 6.55E−7 | 9 |
| Steroid biosynthesis | 1.26E−3 | 2 |
| Jak-STAT signaling pathway | 1.31E−3 | 7 |
| MAPK signaling pathway | 2.09E−3 | 9 |
| Transforming growth factor β signaling pathway | 5.88E−3 | 4 |
| Pancreatic cancer | 6.23E−3 | 4 |
| N-Glycan biosynthesis | 7.71E−3 | 2 |
| Hepatitis B | 1.06E−2 | 5 |
| Neurotrophin signaling pathway | 1.49E−2 | 5 |
| Viral carcinogenesis | 1.49E−2 | 6 |
| Small cell lung cancer | 1.49E−2 | 4 |
| Regulation of actin cytoskeleton | 2.60E−2 | 6 |
| Cell cycle | 2.76E−2 | 5 |
| Pathways in cancer | 3.06E−2 | 9 |
Genes containing potential miR-21 binding sites were analyzed using DIANA miRPath (97). Results representing the MAPK signaling pathway have been highlighted in boldface.
TABLE 4.
Intersection of the pathways targeted by miR-206 and miR-21a
| KEGG pathway | P value | No. of predicted targets in pathway |
|---|---|---|
| MAPK signaling pathway | 3.00E−4 | 26 |
| Neurotrophin signaling pathway | 6.59E−4 | 14 |
| Regulation of actin cytoskeleton | 3.19E−3 | 19 |
Analysis was performed using DIANA miRPath (97).
The ability of KLF4 to regulate RAS-ERK signaling, and the established role of miR-21 in regulation of this pathway identified KLF4 as a potential regulator of miR-21. To determine whether KLF4 might signal through miR-21, we assayed KLF4-deficient TNBC cells for miR-21 levels, observing marked suppression (Fig. 5A). ChIP analysis of KLF4 at consensus sites in the MIR21 locus of MDA-MB-231 cells identified enrichment of site 1, located within the promoter region (Fig. 5B). This enrichment was reduced in KLF4-deficient cells and increased in cells with exogenous KLF4 (Fig. 5C). In contrast to the enhanced ChIP intensity signal in cells with exogenous KLF4, miR-21 levels were not enhanced (Fig. 5D). Restoration of KLF4 in MDA-MB-231/shKLF4 cells was likewise insufficient to increase miR-21 (Fig. 5E). As a control, miR-206 levels were induced by exogenous KLF4 in these experiments (Fig. 5D), suggesting different modes of miR regulation by KLF4.
FIG 5.

Endogenous KLF4 is bound to the MIR21 promoter region and maintains miR-21 expression in TNBC cells. (A) miR-21 levels were analyzed in KLF4-deficient or control TNBC cells. (B) Schematic of the MIR21 locus (left panel) indicating a KLF4 consensus binding site that was analyzed in MDA-MB-231 cells by ChIP (right panel). (C) Similarly as shown in Fig. 1C, the KLF4-MIR21 ChIP intensity levels were analyzed in MDA-MB-231 cells expressing shKLF4, a KLF4 transgene, or controls. (D) TNBC cells were transduced with empty vector or with vector encoding KLF4 or KLF4-ER. Where indicated, cells were treated with 4-OHT, and the levels of the indicated miRs were analyzed. (E) Similarly to what is shown in Fig. 2C to E, miR-21 levels were analyzed in KLF4-deficient TNBC cells following rescue with exogenous KLF4 (left panel) or KLF4-ER (right panel). (F) TNBC cells were transduced with the indicated shRNA vector. Proteins were analyzed by immunoblotting (left panels), and miR levels were determined (right panels). (G) Cells were treated with 5-aza-2′-deoxycytidine (AZA; 96 h) or trichostatin A (TSA; 12 h). ESR1 mRNA levels were analyzed as a positive control for drug activity (right panel). *, P < 0.05; **, P < 0.01; ***, P < 0.001; n.s., not significant.
To address possible off-targeting by KLF4 shRNAs (shKLF4), we analyzed additional shKLF4 constructs. We observed only weak activity of shKLF4-3, but more efficient KLF4 suppression by shKLF4-4 and shKLF4-5 (Fig. 5F, left panels). Compared to control (shCtl) and shKLF4-3, cells transduced with the active constructs had consistently reduced levels of miR-21 (Fig. 5F, right panels). Consequently, the regulation of miR-21 by endogenous KLF4 was supported by a total of four active shRNAs (Fig. 5A and F).
The failure of exogenous KLF4 to restore miR-21 levels appeared consistent with a stable alteration of MIR21 chromatin in KLF4-deficient cells (71, 72). To examine this possibility, we treated shCtl cells or shKLF4-1 cells with the DNA methyltransferase inhibitor AZA or the histone deacetylase inhibitor TSA (Fig. 5G). Unlike TSA, AZA largely restored miR-21 levels (Fig. 5G, left panel). Neither AZA nor TSA significantly altered miR-206 levels, whereas ESR1 served as a positive control and was induced by both agents (Fig. 5G, middle and right panels, respectively) (73, 74). These results show that endogenous KLF4 is permissive for the expression of miR-21 in TNBC cells and support a role for chromatin modification in the suppression of miR-21 following KLF4 depletion.
The regulation of RASA1 by miR-21 is well established (64). Our results above indicate that RASA1 is cotargeted by miR-206/21, suggesting a broader role for this pair as coregulators of RAS-ERK pathway components (Fig. 4). Although miR-206 was predicted to regulate SPRED1, and this was subsequently validated, whether miR-21 can likewise regulate this factor was unknown. Nevertheless, transfection of anti-miR-21 into MDA-MB-231 cells increased the protein levels of both RASA1 and SPRED1, whereas exogenous miR-21 was suppressive (Fig. 6A). Unlike the well-conserved miR-21 sites in RASA1, analysis in TargetScan revealed that SPRED1 contains two candidate binding sites for miR-21 with only limited species conservation (Fig. 6B and C) (75). Translational reporter assays identified only one of these sites as functional and supported the direct regulation of both RASA1 and SPRED1 transcripts by miR-21 (Fig. 6D and E). As a control, transfection of anti-miR-21 led to reduced miR-21 activity, as indicated by immunoblot analysis of PDCD4, a well-established target of this miR (Fig. 6A) (63). These results validate SPRED1 as a miR-21-targeted transcript. Therefore, the miR-206/21 pair can indeed cotarget distinct RAS-ERK pathway components, validating the idea that MAPK signaling represents an important signaling intersection for these two miRs (Table 4).
FIG 6.

miR-21 directly represses the translation of RASA1 and SPRED1. (A) MDA-MB-231 cells were transfected with the indicated anti-miR or miR mimic, and RASA1 and SPRED1 levels were determined by immunoblotting. PDCD4 is encoded by an miR-21-targeted transcript and was analyzed in parallel. (B) To construct a WT translational reporter, a portion of the RASA1 3′ UTR containing an established miR-21 binding site was inserted into the 3′ UTR of firefly luc (64). The sequences of the miR-21 binding site are indicated for several vertebrates: Homo sapiens (Hsa), Pan troglodytes (Ptr), Mus musculus (Mmu), and Gallus gallus (Gga). (The seed sequence complement is underlined.) (C) Schematic of the SPRED1 3′ UTR indicating potential miR-21 binding sites. (D and E) For analysis of protein translation, WT or mutant versions of the indicated 3′ UTR were inserted into the 3′ UTR of firefly luc (top panels). MDA-MB-231 cells were cotransfected with reporters in combination with either anti-miR or the miR mimic. The normalized activity of the reporters relative to that of the empty luc vector was analyzed at 24 h posttransfection. *, P < 0.05; **, P < 0.01; n.s., not significant.
Consistent KLF4 regulation of miR-206/21 levels and RAS-ERK signaling in RAS WT and RAS mutant tumor cells.
The results observed for MDA-MB-231 and HCC1143 cells suggested a functional relationship between the KLF4–miR-206/21 axis and the RAS-ERK pathway. We analyzed this signaling in a broader panel of mammary epithelial cells (MECs) and cancer cells (Fig. 7A). KLF4 depletion in nontumorigenic MCF10A cells, in HRAS mutant MCF10AT cells, or in a variety of human or mouse TNBC lines led to consistently reduced levels of activated ERK 1/2 and to increased levels of RASA1 and/or SPRED1. In the KLF4-deficient TNBC cells, RASA1 and SPRED1 were concordantly upregulated. However, in MECs, the RASA1 levels were not appreciably altered, and reduced pERK 1/2 levels were associated with increased SPRED1 alone. KLF4 depletion was likewise associated with reduced miR-206/21 levels, except in MDA-MB-468 cells where miR-206 was undetected (Fig. 7B). In this miR-206-deficient cell line, the overall effect of KLF4 on pERK 1/2 appeared more modest. In summary, KLF4-miR-206/21 signaling appears to generally regulate the RAS-ERK pathway in TNBC cells, with similar effects in RAS WT (HCC1143, HCC1937, and MDA-MB-468) and RAS mutant cells (MDA-MB-231, Hs578t, and SUM159PT).
FIG 7.

KLF4 promotes activated ERK 1/2 levels and miR-206 and miR-21 expression in a panel composed of human mammary epithelial cells and TNBC cell lines. (A) Cells were transduced with the indicated shRNA vector. Stably selected cells were analyzed for the indicated proteins by immunoblotting. (B) miR levels were analyzed in the indicated cells. For MDA-MB-468 cells, the miR-206 cycle threshold exceeded 40, and the expression level was therefore designated “not detected” (n.d.). *, P < 0.05; **, P < 0.01; ***, P < 0.001.
miR-206 and miR-21 cooperate to promote RAS-ERK signaling and ERK 1/2-dependent phenotypes.
Transfection of anti-miR-206 or anti-miR-21 alone did not have prominent effects on pERK 1/2 levels (Fig. 8, lanes 2, 3, 6, and 7). To test for cooperativity, we inhibited both miRs in TNBC cells (i.e., anti-miR-206/21) and then assayed for RASA1 and SPRED1 levels (Fig. 8, lanes 4 and 8). Compared to the individual anti-miRs, SPRED1 was consistently induced to a greater extent by anti-miR-206/21. In contrast, RASA1 levels responded to each of the anti-miRs (lanes 2 and 6), but anti-miR-206/21 cooperativity was only apparent in HCC1143 cells (lanes 4 and 8). Nevertheless, anti-miR-206/21 transfection of TNBC cells reduced the levels of pMEK 1/2 and pERK 1/2 to a greater extent than did either anti-miR when used alone. These findings identify two KLF4-dependent miRs as maintenance factors for RAS-ERK signaling in TNBC cells, potentially through cooperativity for regulation of SPRED1 and/or other pathway regulators.
FIG 8.

Endogenous miR-206 and miR-21 cooperate to promote RAS-ERK signaling. TNBC cells were transfected with the indicated anti-miR, and protein levels were analyzed by immunoblotting. pMEK 1/2, phospho-MEK 1/2; tMEK 1/2, total MEK 1/2. Transfections were performed using a 12.5 nM concentration of the indicated anti-miR, with 25 nM as the final concentration of all species combined, using anti-miR-Ctl where indicated (−). *, P < 0.05; **, P < 0.01; ***, P < 0.001; n.s., not significant.
In breast cancer cells, the RAS-ERK pathway promotes cell proliferation, migration, and resistance to cell death (21, 22). TNBC cells transfected with both anti-miRs displayed slower growth over a 3-day time course than did control or single anti-miR-transfected cells (Fig. 9A, upper panels). This marked attenuation of proliferation was not explained by changes in cell viability as measured by trypan blue exclusion (Fig. 9A, lower panels).
FIG 9.

Inhibition of miR-206 and miR-21 cooperatively suppresses ERK 1/2-dependent phenotypes in TNBC cells. (A) TNBC cells were transfected with the indicated anti-miR and plated 24 h posttransfection (i.e., day 0). Cell proliferation was measured using an ATP-based luminescence assay (n = 3; error bars, SE). (B) Migration of anti-miR-transfected TNBC cells was measured in a Boyden chamber transwell assay (n = 3; error bars, SE). (C) Anti-miR-transfected cells were analyzed in an anoikis assay. After 24 h in suspension, cell death was analyzed by trypan blue staining (n = 3; error bars, SE). In parallel, cells were treated with MEK inhibitor U0126. (D) Three experiments were performed independently of those in panel C, and anoikis was assessed by annexin V-propidium idodide (PI) staining. The percentage of annexin V+ cells, representing both early and late apoptotic cells, is depicted in the right panel for each treatment group (n = 3; error bars, SD). *, P < 0.05; **, P < 0.01; ***, P < 0.001; n.s., not significant.
Similarly to cell proliferation, inhibition of both miRs abrogated TNBC cell migration in transwell chambers to a greater extent than the inhibition of either miR alone (Fig. 9B). Finally, anti-miR-206/21 rendered TNBC cells more susceptible to cell death in anoikis assays (Fig. 9C and D). As a control, treatment of matrix-deprived MDA-MB-231 cells with the MEK 1/2 inhibitor U0126 yielded a higher rate of cell death (76). These results indicate that miR-206/21 can cooperate to promote RAS-ERK pathway signaling as well as pathway-dependent phenotypes.
miR-206 and miR-21 promote RAS-ERK signaling by repression of RASA1 and SPRED1.
To determine whether miR-206 and -21 impact RAS-ERK signaling through their coregulation of RASA1 and/or SPRED1, we depleted either RASA1 (Fig. 10A) or SPRED1 (Fig. 10B). Knockdown of either factor had little effect upon the other protein. Regardless of the RAS mutational status, knockdown of RASA1 or SPRED1 led to increased steady-state levels of pERK 1/2 relative to control cells. This increase in pathway activity was associated with elevated levels of WT RAS-GTP (Fig. 10C). In contrast to the results obtained for WT RAS proteins, the KRAS-GTP levels in MDA-MB-231 cells (KRASG13D) were not appreciably altered by suppression of RASA1 or SPRED1. Similarly, the HRAS-GTP levels in SUM159PT cells (HRASG12D) were unchanged by suppression of either RASA1 or SPRED1, even though pERK 1/2 levels were increased (Fig. 10D). These results suggest that WT RAS proteins mediate the enhanced RAS-ERK pathway activity in RASA1- or SPRED1-deficient TNBC cells.
FIG 10.

RASA1 and SPRED1 are limiting factors for RAS-ERK signaling in TNBC cells. (A) TNBC cells were stably transduced with shRNA vector targeting RASA1 (R1 or R2) or with a nontargeting control (Ctl). The indicated proteins were analyzed by immunoblotting. (B) Cells were stably transduced with shRNA vector targeting SPRED1 (S1 or S2) or with a nontargeting Ctl. The indicated proteins were analyzed by immunoblotting. (C) RAS-GTP levels were analyzed by the RBD pulldown assay in RASA1 and SPRED1 knockdown cells and control cells. (D) SUM159PT TNBC cells were stably transduced with the indicated shRNA expression vector, and the indicated proteins and RAS-GTP levels were analyzed. *, P < 0.05; **, P < 0.01; ***, P < 0.001; n.s., not significant.
To test for a function of RASA1 and SPRED1 as mediators of miR-206/21 effects on RAS-ERK signaling, we delivered anti-miR-206/21 to control cells or cells deficient in either protein (Fig. 11A). As an indicator of successful miR suppression, we assayed the protein levels of PDCD4, which is regulated by miR-21. As expected, combined miR-206/21 inhibition in control cells reduced the levels of pERK 1/2 (Fig. 11A, lanes 1 and 2 in each panel). Suppression of RASA1 rendered cells largely independent of miR-206/21, as pERK 1/2 showed little or no attenuation by anti-miR (lanes 3 and 4). In SPRED1-suppressed cells, RASA1 and/or some other miR-206/21-dependent component appeared to be limiting for pathway activity, as anti-miRs induced RASA1 and also suppressed the levels of pERK 1/2 (lanes 5 and 6). In TNBC cells depleted of RASA1 or SPRED1 and then treated with anti-miR-206/21, the residual activated ERK 1/2 was increased relative to that in control cells (Fig. 11A, lanes 2, 4, and 6). This anti-miR-resistant signaling supports functional roles for both RASA1 and SPRED1 as mediators of the KLF4-dependent miRs.
FIG 11.

RASA1 and SPRED1 mediate the regulation of RAS-ERK pathway signaling by miR-206 and miR-21. (A) TNBC cells expressing the indicated shRNAs were treated with anti-miR-206 and anti-miR-21 in combination (anti-miR-206/21) or with anti-miR-Ctl. Whole-cell extracts were prepared, and the indicated proteins were analyzed by immunoblotting. Two distinct cell culture models were analyzed (MDA-MB-231 versus HCC1143) using independent shRNAs (R1, S1, R2, and S2). For pERK 1/2, both short (S) and long (L) exposures are indicated. (B) Absent any anti-miR transfection (Untransfected), baseline cell proliferation was analyzed for cells expressing the indicated shRNA and for the untransduced, parental cells (P). Following anti-miR transfection, cell proliferation was measured for control TNBC cells (shCtl) or cells deficient in RASA1 (shR1 and shR2) or SPRED1 (shS1 and shS2). Assays were performed following transfection of anti-miR-Ctl (AC) or anti-miR-206/21 (A+). (C) MDA-MB-231 cells expressing the indicated shRNAs were transfected with either anti-miR-206/21 or anti-miR-Ctl. A total of 2 × 10⁶ cells were orthotopically injected into the left fourth mammary gland of athymic mice. Biweekly tumor measurements were made using calipers. For each treatment group, the number of mice in which tumor initiation occurred by day 28 is indicated (Initiated/Total). *, P < 0.05; **, P < 0.01; ***, P < 0.001; n.s., not significant.
Phenotypic data consistent with these immunoblot results were obtained by analysis of cell proliferation (Fig. 11B). Compared to parental (untransduced and untransfected) TNBC cells or control (shCtl) cells, shRASA1 and shSPRED1 cells proliferated at a rate that was only slightly faster. For each cell line, we next measured cell proliferation following treatment with either anti-miR-Ctl or anti-miR-206/21. Whereas shCtl cells transfected with anti-miR-206/21 proliferated much more slowly (P < 0.001), shRASA1 cells displayed anti-miR-206/21-resistant cell proliferation (P > 0.05) (Fig. 11B). shSPRED1 cells had an intermediate phenotype, with a smaller effect than that observed for shCtl cells that were treated with anti-miR-206/21 (P < 0.05) (Fig. 11B). The effects of anti-miR-206/21 on cell proliferation appeared consistent with the residual levels of activated ERK 1/2 (Fig. 11A).
Consistent results were obtained when anti-miR-treated TNBC cells were orthotopically injected into the mammary gland of immunodeficient mice (Fig. 11C). Relative to anti-miR-Ctl, anti-miR-206/21 suppressed tumor initiation by the control cells (shCtl), attributed to their decreased proliferation and/or increased cell death following implantation into the mammary gland. In contrast, cells deficient in RASA1 or SPRED1 were competent for tumor initiation. These results support functional roles for both RASA1 and SPRED1 in miR-206/21 signaling.
Restoration of RAS-ERK signaling by exogenous miR-206/21 in KLF4-depleted cells promotes resistance to cell death.
To complement the anti-miR data, we delivered exogenous miRs into KLF4-deficient TNBC cells (Fig. 12A). Compared to the individual miR mimics (Fig. 12A, lanes 2, 3, 6, and 7), more pronounced signaling effects were obtained using the miR-206/21 mimic (lanes 4 and 8). These effects included suppression of RASA1 and SPRED1 and the induction of activated MEK 1/2 and ERK 1/2.
FIG 12.

Exogenous miR-206 and miR-21 cooperate to promote RAS-ERK signaling and cell survival in KLF4-depleted cells. (A) KLF4-depleted TNBC cells were transfected with the indicated miR mimic, and protein levels were analyzed by immunoblotting. (B) Anoikis assays were performed following transfection of the indicated miR mimic into KLF4-depleted TNBC cells. For MDA-MB-231, cells transduced with KLF4 vector or empty vector were analyzed in parallel. *, P < 0.05; **, P < 0.01; ***, P < 0.001.
Relative to the control, transfection of either miR-206 or the miR-21 mimic into KLF4-depleted cells reduced the cell death following matrix deprivation (Fig. 12B, lanes 2, 3, 8, and 9). Consistent with the cooperative regulation of pERK 1/2 levels (Fig. 12A, lanes 4 and 8), a greater fold effect on cell death was observed for cells treated with both mimics (Fig. 12B, lanes 4 and 10). In these studies, exogenous KLF4 effects were similar to that of the miR mimics and suppressed cell death (Fig. 12B, left panel, lanes 5 and 6). These gain-of-function studies provide independent support for the cooperative regulation of RAS-ERK signaling by KLF4-dependent miRs-206/21. In the light of previous studies by others, our results support a model for miR-206/21 cotargeting and coregulation of RAS-ERK signaling (Fig. 13).
FIG 13.
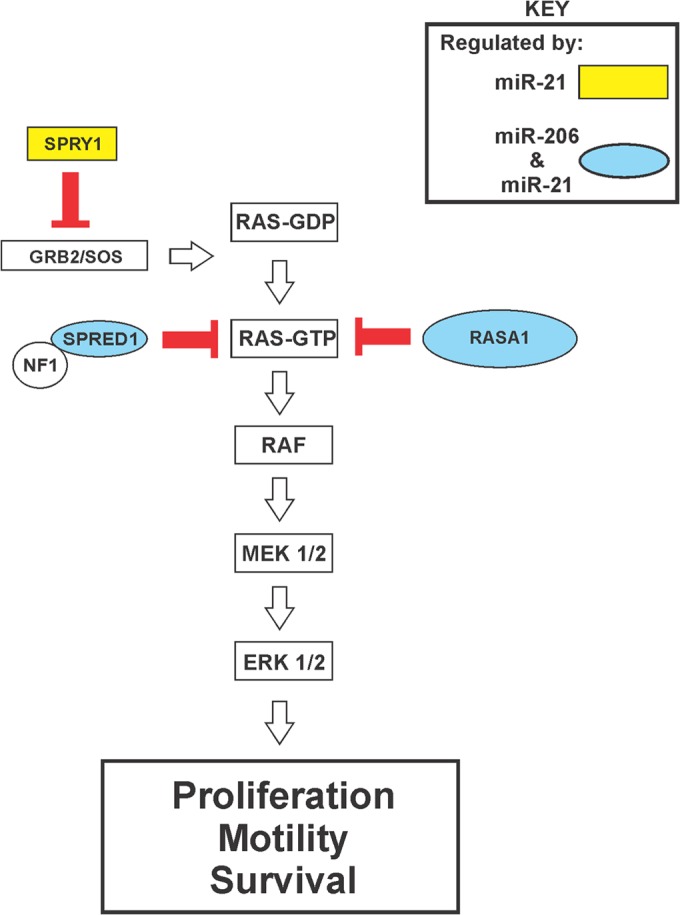
KLF4-dependent miRs cooperatively promote RAS-ERK pathway activity by cotargeting of pathway inhibitors. The schematic shows the organization of the RAS-ERK pathway. miR-206/21-cotargeted repressors of RAS-ERK signaling are shown in blue ovals. The GAP protein NF1 is indicated as a likely catalytic partner of SPRED1 (13).
DISCUSSION
Compared to other breast cancer subtypes, TNBCs express elevated levels of RTKs, such as epidermal growth factor receptor (EGFR) and fibroblast growth factor receptors (FGFRs), that represent major regulators of RAS-ERK signaling (30, 77). Although genetic changes in these receptors or the mutational activation of RAS or RAF are rare, these tumors often harbor other genetic alterations that promote RAS-ERK pathway activity (26–31). Supporting the importance of this signaling, TNBC cells are particularly sensitive to drugs such as MEK or PI 3-kinase inhibitors, and combination therapies have been analyzed in clinical trials (23, 24, 78, 79).
KLF4 is a major regulator of pluripotency with the potential to either promote or suppress malignant properties, and dissection of the relevant mechanisms has the potential to identify new therapeutic approaches. We previously implicated miR-206 as a potential downstream effector of KLF4 (55). Evidence from the present study supported a direct role of KLF4 in regulation of miR-206. Consistent with a role for this signaling in TNBCs, miR-206 is upregulated in breast cancer, and ER-negative tumors express higher levels relative to ER-positive tumors (59, 80).
miR-206 has been well characterized in muscle cells, where it promotes skeletal muscle regeneration in response to injury (81–83). An in silico search for cancer-relevant influences of miR-206 identified regulation of MAPK signaling as a likely effector pathway with potential effects on RASA1 and SPRED1 (Tables 1 and 2). Subsequently, analysis of KLF4-deficient cells revealed upregulation of these two pathway inhibitors in conjunction with markedly reduced levels of pERK 1/2, and protein translation reporter studies identified direct roles for miR-206 in regulation of RASA1 and SPRED1.
Compared to the pronounced effect of endogenous KLF4 on pERK 1/2 levels, modulation of miR-206 alone revealed only modest effects (Fig. 12A), and we therefore sought additional effectors downstream of KLF4. We evaluated miR-21 as a candidate because of its upregulation in breast cancer and its known role in regulation of RAS-ERK pathway components, including RASA1 (Table 3) (58–65). Strikingly, an intersection approach identified MAPK signaling as the pathway most likely to be coregulated by miR-206/21 (Table 4). We subsequently observed a critical role for endogenous KLF4 in maintenance of miR-21 levels and found that both RASA1 and SPRED1 contain binding sites for miR-206/21. These results identified a recurrent regulatory strategy in which two KLF4-regulated miRs can impact the same transcript. As shown by suppression of KLF4 or by the introduction of anti-miR-206/21, this regulation results in pronounced alteration of RAS-ERK signaling in the multiple TNBC models examined.
The protumorigenic miR-21 is abundant in TNBC cells and inhibits the translation of multiple negative regulators of RAS-ERK-AP1 signaling (Fig. 13). Despite extensive interactions with the RAS-ERK pathway, we and others have observed that antisense-mediated inhibition of endogenous miR-21 has relatively modest effects on overall pathway activity, as indicated by analysis of activated ERK 1/2 (Fig. 8). In the present study, we observed that miR-206 and -21 function as a pair to cotarget RAS-ERK pathway inhibitory proteins, with profound consequences for RAS-ERK signaling. Such cotargeting is not without precedent. For example, miR-27a, miR-96, and miR-182 cotarget the tumor suppressor FOXO1 in breast cancer cells (84).
Our analysis of KLF4-depleted TNBC cells indicated that endogenous KLF4 could influence the levels of both miR-206 and miR-21, a response obtained using each of four distinct KLF4 shRNAs (Fig. 5A and F). We also characterized the temporal KLF4 regulation of miR levels using a 4-OHT–conditional KLF4-ER fusion protein. In combination with ChIP data that strongly supported direct interaction of KLF4 with the promoter-proximal regions of MIR206 and MIR21, these studies implicated MIR206 and MIR21 as direct transcriptional targets of KLF4, but with distinct modes of regulation.
Unlike for the regulation of MIR206, we observed that endogenous KLF4 and exogenous KLF4 function discordantly for regulation of MIR21. Previous studies have shown that MIR21 is transcribed as an independent unit located in the intron of the TMEM49 gene (85). Relative to the control cells, in KLF4-deficient cells we observed a decrease of TMEM49 by close to 35% (not shown). Unlike for miR-206, exogenous KLF4 did not alter miR-21 levels in TNBC cells. Similarly, restoration of KLF4 activity in KLF4-depleted tumor cells induced miR-206 but did not significantly alter miR-21 levels. The insufficiency of exogenous KLF4 for induction of miR-21 suggests an “on/off” mode of regulation and identifies KLF4 suppression as a potential hit-and-run strategy for the therapeutic silencing of miR-21 in tumors. Also, this lack of regulation of miR-21 by exogenous KLF4 is quite consistent with the more limited effect of exogenous KLF4 on activated ERK 1/2 levels relative to the endogenous transcription factor (Fig. 2A and C).
These results suggested a working model in which endogenous KLF4 maintains an open chromatin structure at MIR21. Initial support for this model was obtained by analyzing a role for DNA methylation. In KLF4-deficient cells but not in control cells, treatment with the DNA methyltransferase inhibitor AZA was sufficient to upregulate miR-21 levels. Krüppel-like factors such as erythroid Krüppel-like factor (EKLF or KLF1) can regulate chromatin structure by interacting with chromatin-modifying proteins or chromatin remodelers (86–88). The observed regulation of MIR21 by KLF4 is especially interesting given the relationship between open chromatin and pluripotency (89).
KLF4–miR-21 signaling highlights the potential for distinct effects of KLF4 in loss- and gain-of-function experimental settings. As the oncogenic miR-21 is expressed independently of exogenous KLF4, KLF4 gain-of-function phenotypic studies may potentially underestimate protumorigenic signaling by the endogenous transcription factor. It is currently unclear whether KLF4 can regulate other loci in a similar fashion as for MIR21 or whether its regulation of MIR21 extends to other cell types.
Importantly, shRNA studies revealed both RASA1 and SPRED1 to be limiting endogenous factors for steady-state RAS-ERK signaling through modulation of WT RAS-GTP levels, identifying these components as potential mediators of miR-206/21 effects (Fig. 10). miR loss- and gain-of-function studies using single anti-miRs or miR mimics indicated that either miR-21 or miR-206 could individually regulate the level of these pathway inhibitors, but with only subtle effects on pERK 1/2 levels. Indicating cooperativity, larger fold effects were observed when anti-miRs or miR mimics were combined to modulate both miR-206 and -21. Cooperativity was observed for the expression level of SPRED1, for the levels of pERK 1/2, and for relevant phenotypic parameters, including tumor cell proliferation, migration, and survival.
As observed for SPRED1, RASA1 protein levels were dependent upon both miR-206 and miR-21. However, RASA1 did not consistently show cooperative regulation. Strikingly, RASA1 expression was nevertheless critical for miR-206/21 signaling, as anti-miR-206/21 had little or no discernible effect on pERK 1/2 levels in RASA1-deficient cells (Fig. 11). Likewise, cell proliferation and tumor initiation were concordantly anti-miR resistant in RASA1-deficient cells.
Supporting a functional role for SPRED1 in KLF4-miR signaling to RAS-ERK, SPRED1-suppressed cells not only displayed elevated pERK 1/2 levels but also had resistance to anti-miR-206/21 that was intermediate compared to that of shCtl cells and shRASA1 cells. This was shown by analysis of pERK 1/2 and cell proliferation, and tumor initiation in mice was anti-miR resistant. The failure of anti-miR-206/21 to regulate pERK 1/2 levels in RASA1-deficient cells, despite upregulation of SPRED1, suggests that SPRED1 activity may be somehow limited in this context (Fig. 11). For example, this piece of data would appear consistent with a critical role for RASA1 in signaling by SPRED1 or SPRED1-NF1 (13). On the other hand, in the context of MDA-MB-231 cells, where SPRED1 but not RASA1 was cooperatively induced by anti-miR-206/21, the cooperative suppression of pERK 1/2 levels may be largely attributed to SPRED1, with RASA1 serving a more permissive role (Fig. 8).
Of interest in the present study were the similar effects of anti-miR-206/21 on RAS-ERK signaling in RAS WT and RAS mutant breast cancer cells alike. In RAS mutant cells that were analyzed for RAS-GTP levels, only the WT RAS-GTP was increased following depletion of either RASA1 or SPRED1. Consistent with our results, previous studies support the potential for these pathway inhibitors to antagonize signaling in cells harboring activated RAS (90–92). The effects of RASA1 and SPRED1 that we observed appear consistent with an important role of WT RAS proteins (i.e., KRAS, NRAS, and/or HRAS) for pathway activation in RAS mutant TNBC cells. This model is supported by several previous analyses in nonmammary contexts (93–96). For example, suppression of the guanine nucleotide exchange factor SOS1 in a RAS mutant context results in attenuation of WT RAS-GTP levels and pERK 1/2 levels and suppresses tumorigenesis (94). In addition to effects on WT RAS proteins, the possibility that RASA1 and/or SPRED1 suppress signaling by impacting other steps in the pathway is not excluded. Although additional studies are needed, these results support the targeting of RASA1 and SPRED1 for therapy of RAS mutant as well as RAS WT cancers.
We have identified a facet of KLF4 signaling that promotes malignant properties in TNBC cells, through miR-mediated activation of RAS-ERK signaling. The results highlight RASA1 and SPRED1 transcripts as latent tumor suppressors in TNBC cells held at bay through KLF4-dependent miRs. The pronounced inhibitory effect of anti-miR-206/21 on the level of activated ERK 1/2 identifies the enhanced translation of RASA1 and SPRED1 as an attractive therapeutic strategy. In TNBCs, the use of MEK 1/2 inhibitors typically induces a rapid compensatory reprogramming of the kinome, leading to drug resistance (33). Suppression of KLF4 or else the antisense-mediated silencing of miR-206 and/or miR-21 might be used in combination with MEK inhibitors or other pathway antagonists to attenuate this drug resistance.
ACKNOWLEDGMENTS
We thank Steven M. Frisch (West Virginia University), Gary L. Johnson (University of North Carolina at Chapel Hill), and Jeffrey E. Green (NIH) for providing cell lines.
This work was supported by grant NCI RO1 CA127405 and the Jo and Ben Statler Chair in Breast Cancer Research. Flow cytometry experiments were performed in the West Virginia University Flow Cytometry Core Facility, which is supported by NIH equipment grant RR020866 and the Institutional Development Award (IDeA) from the National Institute of General Medical Sciences under grants P30GM103488 (CoBRE) and P20GM103434 (INBRE). Orthotopic tumor cell injections were performed in the West Virginia University Animal Models & Imaging Facility, which has been supported by the Mary Babb Randolph Cancer Center and NIH grants P20 RR016440, P30 RR032138/GM103488, and S10 RR026378.
Footnotes
Published ahead of print 8 September 2014
REFERENCES
- 1.Weinberg RA. 2007. Growth factors, receptors, and cancer, p 119–158 In Weinberg RA. (ed), The biology of cancer. Garland Science, Taylor and Francis Group, LLC, New York, NY. [Google Scholar]
- 2.Johnson GL, Lapadat R. 2002. Mitogen-activated protein kinase pathways mediated by ERK, JNK, and p38 protein kinases. Science 298:1911–1912. 10.1126/science.1072682. [DOI] [PubMed] [Google Scholar]
- 3.Downward J. 2003. Targeting RAS signalling pathways in cancer therapy. Nat. Rev. Cancer 3:11–22. 10.1038/nrc969. [DOI] [PubMed] [Google Scholar]
- 4.Kolch W. 2005. Coordinating ERK/MAPK signalling through scaffolds and inhibitors. Nat. Rev. Mol. Cell Biol. 6:827–837. 10.1038/nrm1743. [DOI] [PubMed] [Google Scholar]
- 5.McCubrey JA, Steelman LS, Abrams SL, Lee JT, Chang F, Bertrand FE, Navolanic PM, Terrian DM, Franklin RA, D'Assoro AB, Salisbury JL, Mazzarino MC, Stivala F, Libra M. 2006. Roles of the RAF/MEK/ERK and PI3K/PTEN/AKT pathways in malignant transformation and drug resistance. Adv. Enzyme Regul. 46:249–279. 10.1016/j.advenzreg.2006.01.004. [DOI] [PubMed] [Google Scholar]
- 6.Roberts PJ, Der CJ. 2007. Targeting the Raf-MEK-ERK mitogen-activated protein kinase cascade for the treatment of cancer. Oncogene 26:3291–3310. 10.1038/sj.onc.1210422. [DOI] [PubMed] [Google Scholar]
- 7.Mebratu Y, Tesfaigzi Y. 2009. How ERK1/2 activation controls cell proliferation and cell death: is subcellular localization the answer? Cell Cycle 8:1168–1175. 10.4161/cc.8.8.8147. [DOI] [PMC free article] [PubMed] [Google Scholar]
- 8.Young A, Lyons J, Miller AL, Phan VT, Alarcon IR, McCormick F. 2009. Ras signaling and therapies. Adv. Cancer Res. 102:1–17. 10.1016/S0065-230X(09)02001-6. [DOI] [PubMed] [Google Scholar]
- 9.Pylayeva-Gupta Y, Grabocka E, Bar-Sagi D. 2011. RAS oncogenes: weaving a tumorigenic web. Nat. Rev. Cancer 11:761–774. 10.1038/nrc3106. [DOI] [PMC free article] [PubMed] [Google Scholar]
- 10.Boguski MS, McCormick F. 1993. Proteins regulating Ras and its relatives. Nature 366:643–654. 10.1038/366643a0. [DOI] [PubMed] [Google Scholar]
- 11.Yoshimura A. 2009. Regulation of cytokine signaling by the SOCS and Spred family proteins. Keio J. Med. 58:73–83. 10.2302/kjm.58.73. [DOI] [PubMed] [Google Scholar]
- 12.Vigil D, Cherfils J, Rossman KL, Der CJ. 2010. Ras superfamily GEFs and GAPs: validated and tractable targets for cancer therapy? Nat. Rev. Cancer 10:842–857. 10.1038/nrc2960. [DOI] [PMC free article] [PubMed] [Google Scholar]
- 13.Stowe IB, Mercado EL, Stowe TR, Bell EL, Oses-Prieto JA, Hernandez H, Burlingame AL, McCormick F. 2012. A shared molecular mechanism underlies the human rasopathies Legius syndrome and neurofibromatosis-1. Genes Dev. 26:1421–1426. 10.1101/gad.190876.112. [DOI] [PMC free article] [PubMed] [Google Scholar]
- 14.Brems H, Chmara M, Sahbatou M, Denayer E, Taniguchi K, Kato R, Somers R, Messiaen L, De Schepper S, Fryns JP, Cools J, Marynen P, Thomas G, Yoshimura A, Legius E. 2007. Germline loss-of-function mutations in SPRED1 cause a neurofibromatosis 1-like phenotype. Nat. Genet. 39:1120–1126. 10.1038/ng2113. [DOI] [PubMed] [Google Scholar]
- 15.Schubbert S, Shannon K, Bollag G. 2007. Hyperactive Ras in developmental disorders and cancer. Nat. Rev. Cancer 7:295–308. 10.1038/nrc2109. [DOI] [PubMed] [Google Scholar]
- 16.Tidyman WE, Rauen KA. 2009. The RASopathies: developmental syndromes of Ras/MAPK pathway dysregulation. Curr. Opin. Genet. Dev. 19:230–236. 10.1016/j.gde.2009.04.001. [DOI] [PMC free article] [PubMed] [Google Scholar]
- 17.Bos JL. 1989. RAS oncogenes in human cancer: a review. Cancer Res. 49:4682–4689. [PubMed] [Google Scholar]
- 18.Davies H, Bignell GR, Cox C, Stephens P, Edkins S, Clegg S, Teague J, Woffendin H, Garnett MJ, Bottomley W, Davis N, Dicks E, Ewing R, Floyd Y, Gray K, Hall S, Hawes R, Hughes J, Kosmidou V, Menzies A, Mould C, Parker A, Stevens C, Watt S, Hooper S, Wilson R, Jayatilake H, Gusterson BA, Cooper C, Shipley J, Hargrave D, Pritchard-Jones K, Maitland N, Chenevix-Trench G, Riggins GJ, Bigner DD, Palmieri G, Cossu A, Flanagan A, Nicholson A, Ho JW, Leung SY, Yuen ST, Weber BL, Seigler HF, Darrow TL, Paterson H, Marais R, Marshall CJ, Wooster R, Stratton MR, Futreal PA. 2002. Mutations of the BRAF gene in human cancer. Nature 417:949–954. 10.1038/nature00766. [DOI] [PubMed] [Google Scholar]
- 19.Prior IA, Lewis PD, Mattos C. 2012. A comprehensive survey of Ras mutations in cancer. Cancer Res. 72:2457–2467. 10.1158/0008-5472.CAN-11-2612. [DOI] [PMC free article] [PubMed] [Google Scholar]
- 20.Garnett MJ, Marais R. 2004. Guilty as charged: B-RAF is a human oncogene. Cancer Cell 6:313–319. 10.1016/j.ccr.2004.09.022. [DOI] [PubMed] [Google Scholar]
- 21.Santen RJ, Song RX, McPherson R, Kumar R, Adam L, Jeng MH, Yue W. 2002. The role of mitogen-activated protein (MAP) kinase in breast cancer. J. Steroid Biochem. Mol. Biol. 80:239–256. 10.1016/S0960-0760(01)00189-3. [DOI] [PubMed] [Google Scholar]
- 22.Whyte J, Bergin O, Bianchi A, McNally S, Martin F. 2009. Key signalling nodes in mammary gland development and cancer. Mitogen-activated protein kinase signalling in experimental models of breast cancer progression and in mammary gland development. Breast Cancer Res. 11:209. 10.1186/bcr2361. [DOI] [PMC free article] [PubMed] [Google Scholar]
- 23.Mirzoeva OK, Das D, Heiser LM, Bhattacharya S, Siwak D, Gendelman R, Bayani N, Wang NJ, Neve RM, Guan Y, Hu Z, Knight Z, Feiler HS, Gascard P, Parvin B, Spellman PT, Shokat KM, Wyrobek AJ, Bissell MJ, McCormick F, Kuo WL, Mills GB, Gray JW, Korn WM. 2009. Basal subtype and MAPK/ERK kinase (MEK)-phosphoinositide 3-kinase feedback signaling determine susceptibility of breast cancer cells to MEK inhibition. Cancer Res. 69:565–572. 10.1158/0008-5472.CAN-08-3389. [DOI] [PMC free article] [PubMed] [Google Scholar]
- 24.Hoeflich KP, O'Brien C, Boyd Z, Cavet G, Guerrero S, Jung K, Januario T, Savage H, Punnoose E, Truong T, Zhou W, Berry L, Murray L, Amler L, Belvin M, Friedman LS, Lackner MR. 2009. In vivo antitumor activity of MEK and phosphatidylinositol 3-kinase inhibitors in basal-like breast cancer models. Clin. Cancer Res. 15:4649–4664. 10.1158/1078-0432.CCR-09-0317. [DOI] [PubMed] [Google Scholar]
- 25.Prat A, Perou CM. 2011. Deconstructing the molecular portraits of breast cancer. Mol. Oncol. 5:5–23. 10.1016/j.molonc.2010.11.003. [DOI] [PMC free article] [PubMed] [Google Scholar]
- 26.van Beers EH, van Welsem T, Wessels LF, Li Y, Oldenburg RA, Devilee P, Cornelisse CJ, Verhoef S, Hogervorst FB, van't Veer LJ, Nederlof PM. 2005. Comparative genomic hybridization profiles in human BRCA1 and BRCA2 breast tumors highlight differential sets of genomic aberrations. Cancer Res. 65:822–827. [PubMed] [Google Scholar]
- 27.Herschkowitz JI, Simin K, Weigman VJ, Mikaelian I, Usary J, Hu Z, Rasmussen KE, Jones LP, Assefnia S, Chandrasekharan S, Backlund MG, Yin Y, Khramtsov AI, Bastein R, Quackenbush J, Glazer RI, Brown PH, Green JE, Kopelovich L, Furth PA, Palazzo JP, Olopade OI, Bernard PS, Churchill GA, Van Dyke T, Perou CM. 2007. Identification of conserved gene expression features between murine mammary carcinoma models and human breast tumors. Genome Biol. 8:R76. 10.1186/gb-2007-8-5-r76. [DOI] [PMC free article] [PubMed] [Google Scholar]
- 28.Rakha EA, Reis-Filho JS, Ellis IO. 2008. Basal-like breast cancer: a critical review. J. Clin. Oncol. 26:2568–2581. 10.1200/JCO.2007.13.1748. [DOI] [PubMed] [Google Scholar]
- 29.Hu X, Stern HM, Ge L, O'Brien C, Haydu L, Honchell CD, Haverty PM, Peters BA, Wu TD, Amler LC, Chant J, Stokoe D, Lackner MR, Cavet G. 2009. Genetic alterations and oncogenic pathways associated with breast cancer subtypes. Mol. Cancer Res. 7:511–522. 10.1158/1541-7786.MCR-08-0107. [DOI] [PubMed] [Google Scholar]
- 30.Cancer Genome Atlas Network. 2012. Comprehensive molecular portraits of human breast tumours. Nature 490:61–70. 10.1038/nature11412. [DOI] [PMC free article] [PubMed] [Google Scholar]
- 31.Balko JM, Cook RS, Vaught DB, Kuba MG, Miller TW, Bhola NE, Sanders ME, Granja-Ingram NM, Smith JJ, Meszoely IM, Salter J, Dowsett M, Stemke-Hale K, Gonzalez-Angulo AM, Mills GB, Pinto JA, Gomez HL, Arteaga CL. 2012. Profiling of residual breast cancers after neoadjuvant chemotherapy identifies DUSP4 deficiency as a mechanism of drug resistance. Nat. Med. 18:1052–1059. 10.1038/nm.2795. [DOI] [PMC free article] [PubMed] [Google Scholar]
- 32.Gysin S, Salt M, Young A, McCormick F. 2011. Therapeutic strategies for targeting ras proteins. Genes Cancer 2:359–372. 10.1177/1947601911412376. [DOI] [PMC free article] [PubMed] [Google Scholar]
- 33.Duncan JS, Whittle MC, Nakamura K, Abell AN, Midland AA, Zawistowski JS, Johnson NL, Granger DA, Jordan NV, Darr DB, Usary J, Kuan PF, Smalley DM, Major B, He X, Hoadley KA, Zhou B, Sharpless NE, Perou CM, Kim WY, Gomez SM, Chen X, Jin J, Frye SV, Earp HS, Graves LM, Johnson GL. 2012. Dynamic reprogramming of the kinome in response to targeted MEK inhibition in triple-negative breast cancer. Cell 149:307–321. 10.1016/j.cell.2012.02.053. [DOI] [PMC free article] [PubMed] [Google Scholar]
- 34.Takahashi K, Yamanaka S. 2006. Induction of pluripotent stem cells from mouse embryonic and adult fibroblast cultures by defined factors. Cell 126:663–676. 10.1016/j.cell.2006.07.024. [DOI] [PubMed] [Google Scholar]
- 35.Rowland BD, Peeper DS. 2006. KLF4, p21 and context-dependent opposing forces in cancer. Nat. Rev. Cancer 6:11–23. 10.1038/nrc1780. [DOI] [PubMed] [Google Scholar]
- 36.McConnell BB, Yang VW. 2010. Mammalian Kruppel-like factors in health and diseases. Physiol. Rev. 90:1337–1381. 10.1152/physrev.00058.2009. [DOI] [PMC free article] [PubMed] [Google Scholar]
- 37.Ghaleb AM, McConnell BB, Nandan MO, Katz JP, Kaestner KH, Yang VW. 2007. Haploinsufficiency of Kruppel-like factor 4 promotes adenomatous polyposis coli dependent intestinal tumorigenesis. Cancer Res. 67:7147–7154. 10.1158/0008-5472.CAN-07-1302. [DOI] [PMC free article] [PubMed] [Google Scholar]
- 38.McCormick SM, Eskin SG, McIntire LV, Teng CL, Lu CM, Russell CG, Chittur KK. 2001. DNA microarray reveals changes in gene expression of shear stressed human umbilical vein endothelial cells. Proc. Natl. Acad. Sci. U. S. A. 98:8955–8960. 10.1073/pnas.171259298. [DOI] [PMC free article] [PubMed] [Google Scholar]
- 39.Yoon HS, Chen X, Yang VW. 2003. Kruppel-like factor 4 mediates p53-dependent G1/S cell cycle arrest in response to DNA damage. J. Biol. Chem. 278:2101–2105. 10.1074/jbc.M211027200. [DOI] [PMC free article] [PubMed] [Google Scholar]
- 40.Pedersen TX, Leethanakul C, Patel V, Mitola D, Lund LR, Dano K, Johnsen M, Gutkind JS, Bugge TH. 2003. Laser capture microdissection-based in vivo genomic profiling of wound keratinocytes identifies similarities and differences to squamous cell carcinoma. Oncogene 22:3964–3976. 10.1038/sj.onc.1206614. [DOI] [PubMed] [Google Scholar]
- 41.Liu Y, Sinha S, McDonald OG, Shang Y, Hoofnagle MH, Owens GK. 2005. Kruppel-like factor 4 abrogates myocardin-induced activation of smooth muscle gene expression. J. Biol. Chem. 280:9719–9727. 10.1074/jbc.M412862200. [DOI] [PubMed] [Google Scholar]
- 42.Liu Y, Wang J, Yi Y, Zhang H, Liu J, Liu M, Yuan C, Tang D, Benjamin IJ, Xiao X. 2006. Induction of KLF4 in response to heat stress. Cell Stress Chaperones 11:379–389. 10.1379/CSC-210.1. [DOI] [PMC free article] [PubMed] [Google Scholar]
- 43.Ghaleb AM, Katz JP, Kaestner KH, Du JX, Yang VW. 2007. Kruppel-like factor 4 exhibits antiapoptotic activity following gamma-radiation-induced DNA damage. Oncogene 26:2365–2373. 10.1038/sj.onc.1210022. [DOI] [PMC free article] [PubMed] [Google Scholar]
- 44.Hamik A, Lin Z, Kumar A, Balcells M, Sinha S, Katz J, Feinberg MW, Gerzsten RE, Edelman ER, Jain MK. 2007. Kruppel-like factor 4 regulates endothelial inflammation. J. Biol. Chem. 282:13769–13779. 10.1074/jbc.M700078200. [DOI] [PubMed] [Google Scholar]
- 45.Liao X, Haldar SM, Lu Y, Jeyaraj D, Paruchuri K, Nahori M, Cui Y, Kaestner KH, Jain MK. 2010. Kruppel-like factor 4 regulates pressure-induced cardiac hypertrophy. J. Mol. Cell. Cardiol. 49:334–338. 10.1016/j.yjmcc.2010.04.008. [DOI] [PMC free article] [PubMed] [Google Scholar]
- 46.Lai JK, Wu HC, Shen YC, Hsieh HY, Yang SY, Chang CC. 2012. Kruppel-like factor 4 is involved in cell scattering induced by hepatocyte growth factor. J. Cell Sci. 125:4853–4864. 10.1242/jcs.108910. [DOI] [PubMed] [Google Scholar]
- 47.Foster KW, Ren S, Louro ID, Lobo-Ruppert SM, McKie-Bell P, Grizzle W, Hayes MR, Broker TR, Chow LT, Ruppert JM. 1999. Oncogene expression cloning by retroviral transduction of adenovirus E1A-immortalized rat kidney RK3E cells: transformation of a host with epithelial features by c-MYC and the zinc finger protein GKLF. Cell Growth Differ. 10:423–434. [PubMed] [Google Scholar]
- 48.Foster KW, Liu Z, Nail CD, Li X, Fitzgerald TJ, Bailey SK, Frost AR, Louro ID, Townes TM, Paterson AJ, Kudlow JE, Lobo-Ruppert SM, Ruppert JM. 2005. Induction of KLF4 in basal keratinocytes blocks the proliferation-differentiation switch and initiates squamous epithelial dysplasia. Oncogene 24:1491–1500. 10.1038/sj.onc.1208307. [DOI] [PMC free article] [PubMed] [Google Scholar]
- 49.Rowland BD, Bernards R, Peeper DS. 2005. The KLF4 tumour suppressor is a transcriptional repressor of p53 that acts as a context-dependent oncogene. Nat. Cell Biol. 7:1074–1082. 10.1038/ncb1314. [DOI] [PubMed] [Google Scholar]
- 50.Leng Z, Tao K, Xia Q, Tan J, Yue Z, Chen J, Xi H, Li J, Zheng H. 2013. Kruppel-like factor 4 acts as an oncogene in colon cancer stem cell-enriched spheroid cells. PLoS One 8:e56082. 10.1371/journal.pone.0056082. [DOI] [PMC free article] [PubMed] [Google Scholar]
- 51.Pandya AY, Talley LI, Frost AR, Fitzgerald TJ, Trivedi V, Chakravarthy M, Chhieng DC, Grizzle WE, Engler JA, Krontiras H, Bland KI, Lobuglio AF, Lobo-Ruppert SM, Ruppert JM. 2004. Nuclear localization of KLF4 is associated with an aggressive phenotype in early-stage breast cancer. Clin. Cancer Res. 10:2709–2719. 10.1158/1078-0432.CCR-03-0484. [DOI] [PubMed] [Google Scholar]
- 52.Chu PY, Hsu NC, Liao AT, Yeh KT, Hou MF, Liu CH. 2011. Elevated Kruppel-like factor 4 transcription factor in canine mammary carcinoma. BMC Vet. Res. 7:58. 10.1186/1746-6148-7-58. [DOI] [PMC free article] [PubMed] [Google Scholar]
- 53.Kamalakaran S, Varadan V, Giercksky Russnes HE, Levy D, Kendall J, Janevski A, Riggs M, Banerjee N, Synnestvedt M, Schlichting E, Karesen R, Shama PK, Rotti H, Rao R, Rao L, Eric Tang MH, Satyamoorthy K, Lucito R, Wigler M, Dimitrova N, Naume B, Borresen-Dale AL, Hicks JB. 2011. DNA methylation patterns in luminal breast cancers differ from non-luminal subtypes and can identify relapse risk independent of other clinical variables. Mol. Oncol. 5:77–92. 10.1016/j.molonc.2010.11.002. [DOI] [PMC free article] [PubMed] [Google Scholar]
- 54.Chen CJ, Lin SE, Lin YM, Lin SH, Chen DR, Chen CL. 2012. Association of expression of Kruppel-like factor 4 and Kruppel-like factor 5 with the clinical manifestations of breast cancer. Pathol. Oncol. Res. 18:161–168. 10.1007/s12253-011-9422-7. [DOI] [PubMed] [Google Scholar]
- 55.Lin CC, Liu LZ, Addison JB, Ivanov AV, Ruppert JM. 2011. A KLF4-miRNA-206 autoregulatory feedback loop can promote or inhibit protein translation depending upon cell context. Mol. Cell. Biol. 31:2513–2527. 10.1128/MCB.01189-10. [DOI] [PMC free article] [PubMed] [Google Scholar]
- 56.Lee YS, Dutta A. 2009. MicroRNAs in cancer. Annu. Rev. Pathol. 4:199–227. 10.1146/annurev.pathol.4.110807.092222. [DOI] [PMC free article] [PubMed] [Google Scholar]
- 57.Kasinski AL, Slack FJ. 2011. Epigenetics and genetics. MicroRNAs en route to the clinic: progress in validating and targeting microRNAs for cancer therapy. Nat. Rev. Cancer 11:849–864. 10.1038/nrc3166. [DOI] [PMC free article] [PubMed] [Google Scholar]
- 58.Iorio MV, Croce CM. 2012. MicroRNA dysregulation in cancer: diagnostics, monitoring and therapeutics. A comprehensive review. EMBO Mol. Med. 4:143–159. 10.1002/emmm.201100209. [DOI] [PMC free article] [PubMed] [Google Scholar]
- 59.Iorio MV, Ferracin M, Liu CG, Veronese A, Spizzo R, Sabbioni S, Magri E, Pedriali M, Fabbri M, Campiglio M, Menard S, Palazzo JP, Rosenberg A, Musiani P, Volinia S, Nenci I, Calin GA, Querzoli P, Negrini M, Croce CM. 2005. MicroRNA gene expression deregulation in human breast cancer. Cancer Res. 65:7065–7070. 10.1158/0008-5472.CAN-05-1783. [DOI] [PubMed] [Google Scholar]
- 60.Meng F, Henson R, Wehbe-Janek H, Ghoshal K, Jacob ST, Patel T. 2007. MicroRNA-21 regulates expression of the PTEN tumor suppressor gene in human hepatocellular cancer. Gastroenterology 133:647–658. 10.1053/j.gastro.2007.05.022. [DOI] [PMC free article] [PubMed] [Google Scholar]
- 61.Thum T, Gross C, Fiedler J, Fischer T, Kissler S, Bussen M, Galuppo P, Just S, Rottbauer W, Frantz S, Castoldi M, Soutschek J, Koteliansky V, Rosenwald A, Basson MA, Licht JD, Pena JT, Rouhanifard SH, Muckenthaler MU, Tuschl T, Martin GR, Bauersachs J, Engelhardt S. 2008. MicroRNA-21 contributes to myocardial disease by stimulating MAP kinase signalling in fibroblasts. Nature 456:980–984. 10.1038/nature07511. [DOI] [PubMed] [Google Scholar]
- 62.Sayed D, Rane S, Lypowy J, He M, Chen IY, Vashistha H, Yan L, Malhotra A, Vatner D, Abdellatif M. 2008. MicroRNA-21 targets Sprouty2 and promotes cellular outgrowths. Mol. Biol. Cell 19:3272–3282. 10.1091/mbc.E08-02-0159. [DOI] [PMC free article] [PubMed] [Google Scholar]
- 63.Asangani IA, Rasheed SA, Nikolova DA, Leupold JH, Colburn NH, Post S, Allgayer H. 2008. MicroRNA-21 (miR-21) post-transcriptionally downregulates tumor suppressor Pdcd4 and stimulates invasion, intravasation and metastasis in colorectal cancer. Oncogene 27:2128–2136. 10.1038/sj.onc.1210856. [DOI] [PubMed] [Google Scholar]
- 64.Wickramasinghe NS, Manavalan TT, Dougherty SM, Riggs KA, Li Y, Klinge CM. 2009. Estradiol downregulates miR-21 expression and increases miR-21 target gene expression in MCF-7 breast cancer cells. Nucleic Acids Res. 37:2584–2595. 10.1093/nar/gkp117. [DOI] [PMC free article] [PubMed] [Google Scholar]
- 65.Hatley ME, Patrick DM, Garcia MR, Richardson JA, Bassel-Duby R, van Rooij E, Olson EN. 2010. Modulation of K-Ras-dependent lung tumorigenesis by MicroRNA-21. Cancer Cell 18:282–293. 10.1016/j.ccr.2010.08.013. [DOI] [PMC free article] [PubMed] [Google Scholar]
- 66.Zuker M. 2003. Mfold web server for nucleic acid folding and hybridization prediction. Nucleic Acids Res. 31:3406–3415. 10.1093/nar/gkg595. [DOI] [PMC free article] [PubMed] [Google Scholar]
- 67.Mathelier A, Zhao X, Zhang AW, Parcy F, Worsley-Hunt R, Arenillas DJ, Buchman S, Chen CY, Chou A, Ienasescu H, Lim J, Shyr C, Tan G, Zhou M, Lenhard B, Sandelin A, Wasserman WW. 2014. JASPAR 2014: an extensively expanded and updated open-access database of transcription factor binding profiles. Nucleic Acids Res. 42:D142–D147. 10.1093/nar/gkt997. [DOI] [PMC free article] [PubMed] [Google Scholar]
- 68.Boyd KE, Farnham PJ. 1999. Coexamination of site-specific transcription factor binding and promoter activity in living cells. Mol. Cell. Biol. 19:8393–8399. [DOI] [PMC free article] [PubMed] [Google Scholar]
- 69.Littlewood TD, Hancock DC, Danielian PS, Parker MG, Evan GI. 1995. A modified oestrogen receptor ligand-binding domain as an improved switch for the regulation of heterologous proteins. Nucleic Acids Res. 23:1686–1690. 10.1093/nar/23.10.1686. [DOI] [PMC free article] [PubMed] [Google Scholar]
- 70.Zhang W, Geiman DE, Shields JM, Dang DT, Mahatan CS, Kaestner KH, Biggs JR, Kraft AS, Yang VW. 2000. The gut-enriched Kruppel-like factor (Kruppel-like factor 4) mediates the transactivating effect of p53 on the p21WAF1/Cip1 promoter. J. Biol. Chem. 275:18391–18398. 10.1074/jbc.C000062200. [DOI] [PMC free article] [PubMed] [Google Scholar]
- 71.Geiman DE, Han TT, Johnson JM, Yang VW. 2000. Transactivation and growth suppression by the gut-enriched Krüppel-like factor (Krüppel-like factor 4) are dependent on acidic amino acid residues and protein-protein interaction. Nucleic Acids Res. 28:1106–1113. 10.1093/nar/28.5.1106. [DOI] [PMC free article] [PubMed] [Google Scholar]
- 72.Evans PM, Zhang W, Chen X, Yang J, Bhakat KK, Liu C. 2007. Kruppel-like factor 4 is acetylated by p300 and regulates gene transcription via modulation of histone acetylation. J. Biol. Chem. 282:33994–34002. 10.1074/jbc.M701847200. [DOI] [PubMed] [Google Scholar]
- 73.Yang X, Ferguson AT, Nass SJ, Phillips DL, Butash KA, Wang SM, Herman JG, Davidson NE. 2000. Transcriptional activation of estrogen receptor alpha in human breast cancer cells by histone deacetylase inhibition. Cancer Res. 60:6890–6894. [PubMed] [Google Scholar]
- 74.Sharma D, Blum J, Yang X, Beaulieu N, Macleod AR, Davidson NE. 2005. Release of methyl CpG binding proteins and histone deacetylase 1 from the estrogen receptor alpha (ER) promoter upon reactivation in ER-negative human breast cancer cells. Mol. Endocrinol. 19:1740–1751. 10.1210/me.2004-0011. [DOI] [PubMed] [Google Scholar]
- 75.Lewis BP, Burge CB, Bartel DP. 2005. Conserved seed pairing, often flanked by adenosines, indicates that thousands of human genes are microRNA targets. Cell 120:15–20. 10.1016/j.cell.2004.12.035. [DOI] [PubMed] [Google Scholar]
- 76.Fukazawa H, Noguchi K, Murakami Y, Uehara Y. 2002. Mitogen-activated protein/extracellular signal-regulated kinase kinase (MEK) inhibitors restore anoikis sensitivity in human breast cancer cell lines with a constitutively activated extracellular-regulated kinase (ERK) pathway. Mol. Cancer Ther. 1:303–309. [PubMed] [Google Scholar]
- 77.Turner N, Lambros MB, Horlings HM, Pearson A, Sharpe R, Natrajan R, Geyer FC, van Kouwenhove M, Kreike B, Mackay A, Ashworth A, Van de Vijver MJ, Reis-Filho JS. 2010. Integrative molecular profiling of triple negative breast cancers identifies amplicon drivers and potential therapeutic targets. Oncogene 29:2013–2023. 10.1038/onc.2009.489. [DOI] [PMC free article] [PubMed] [Google Scholar]
- 78.Infante JR, Papadopoulos KP, Bendell JC, Patnaik A, Burris HA, Rasco D, III, Jones SF, Smith L, Cox DS, Durante M, Bellew KM, Park JJ, Le NT, Tolcher AW. 2013. A phase 1b study of trametinib, an oral mitogen-activated protein kinase kinase (MEK) inhibitor, in combination with gemcitabine in advanced solid tumours. Eur. J. Cancer 49:2077–2085. 10.1016/j.ejca.2013.03.020. [DOI] [PubMed] [Google Scholar]
- 79.Britten CD. 2013. PI3K and MEK inhibitor combinations: examining the evidence in selected tumor types. Cancer Chemother. Pharmacol. 71:1395–1409. 10.1007/s00280-013-2121-1. [DOI] [PubMed] [Google Scholar]
- 80.Kondo N, Toyama T, Sugiura H, Fujii Y, Yamashita H. 2008. miR-206 expression is down-regulated in estrogen receptor α-positive human breast cancer. Cancer Res. 68:5004–5008. 10.1158/0008-5472.CAN-08-0180. [DOI] [PubMed] [Google Scholar]
- 81.Williams AH, Valdez G, Moresi V, Qi X, McAnally J, Elliott JL, Bassel-Duby R, Sanes JR, Olson EN. 2009. MicroRNA-206 delays ALS progression and promotes regeneration of neuromuscular synapses in mice. Science 326:1549–1554. 10.1126/science.1181046. [DOI] [PMC free article] [PubMed] [Google Scholar]
- 82.Dey BK, Gagan J, Dutta A. 2011. miR-206 and -486 induce myoblast differentiation by downregulating Pax7. Mol. Cell. Biol. 31:203–214. 10.1128/MCB.01009-10. [DOI] [PMC free article] [PubMed] [Google Scholar]
- 83.Liu N, Williams AH, Maxeiner JM, Bezprozvannaya S, Shelton JM, Richardson JA, Bassel-Duby R, Olson EN. 2012. microRNA-206 promotes skeletal muscle regeneration and delays progression of Duchenne muscular dystrophy in mice. J. Clin. Invest. 122:2054–2065. 10.1172/JCI62656. [DOI] [PMC free article] [PubMed] [Google Scholar]
- 84.Guttilla IK, White BA. 2009. Coordinate regulation of FOXO1 by miR-27a, miR-96, and miR-182 in breast cancer cells. J. Biol. Chem. 284:23204–23216. 10.1074/jbc.M109.031427. [DOI] [PMC free article] [PubMed] [Google Scholar]
- 85.Fujita S, Ito T, Mizutani T, Minoguchi S, Yamamichi N, Sakurai K, Iba H. 2008. miR-21 gene expression triggered by AP-1 is sustained through a double-negative feedback mechanism. J. Mol. Biol. 378:492–504. 10.1016/j.jmb.2008.03.015. [DOI] [PubMed] [Google Scholar]
- 86.Armstrong JA, Bieker JJ, Emerson BM. 1998. A SWI/SNF-related chromatin remodeling complex, E-RC1, is required for tissue-specific transcriptional regulation by EKLF in vitro. Cell 95:93–104. 10.1016/S0092-8674(00)81785-7. [DOI] [PubMed] [Google Scholar]
- 87.Kadam S, Emerson BM. 2003. Transcriptional specificity of human SWI/SNF BRG1 and BRM chromatin remodeling complexes. Mol. Cell 11:377–389. 10.1016/S1097-2765(03)00034-0. [DOI] [PubMed] [Google Scholar]
- 88.Wu JI, Lessard J, Crabtree GR. 2009. Understanding the words of chromatin regulation. Cell 136:200–206. 10.1016/j.cell.2009.01.009. [DOI] [PMC free article] [PubMed] [Google Scholar]
- 89.Gaspar-Maia A, Alajem A, Meshorer E, Ramalho-Santos M. 2011. Open chromatin in pluripotency and reprogramming. Nat. Rev. Mol. Cell Biol. 12:36–47. 10.1038/nrm3036. [DOI] [PMC free article] [PubMed] [Google Scholar]
- 90.Clark GJ, Quilliam LA, Hisaka MM, Der CJ. 1993. Differential antagonism of Ras biological activity by catalytic and Src homology domains of Ras GTPase activation protein. Proc. Natl. Acad. Sci. U. S. A. 90:4887–4891. 10.1073/pnas.90.11.4887. [DOI] [PMC free article] [PubMed] [Google Scholar]
- 91.Huang DC, Marshall CJ, Hancock JF. 1993. Plasma membrane-targeted ras GTPase-activating protein is a potent suppressor of p21ras function. Mol. Cell. Biol. 13:2420–2431. [DOI] [PMC free article] [PubMed] [Google Scholar]
- 92.Wakioka T, Sasaki A, Kato R, Shouda T, Matsumoto A, Miyoshi K, Tsuneoka M, Komiya S, Baron R, Yoshimura A. 2001. Spred is a Sprouty-related suppressor of Ras signalling. Nature 412:647–651. 10.1038/35088082. [DOI] [PubMed] [Google Scholar]
- 93.Fotiadou PP, Takahashi C, Rajabi HN, Ewen ME. 2007. Wild-type NRas and KRas perform distinct functions during transformation. Mol. Cell. Biol. 27:6742–6755. 10.1128/MCB.00234-07. [DOI] [PMC free article] [PubMed] [Google Scholar]
- 94.Jeng HH, Taylor LJ, Bar-Sagi D. 2012. Sos-mediated cross-activation of wild-type Ras by oncogenic Ras is essential for tumorigenesis. Nat. Commun. 3:1168. 10.1038/ncomms2173. [DOI] [PMC free article] [PubMed] [Google Scholar]
- 95.Young A, Lou D, McCormick F. 2013. Oncogenic and wild-type Ras play divergent roles in the regulation of mitogen-activated protein kinase signaling. Cancer Discov. 3:112–123. 10.1158/2159-8290.CD-12-0231. [DOI] [PubMed] [Google Scholar]
- 96.Grabocka E, Pylayeva-Gupta Y, Jones MJ, Lubkov V, Yemanaberhan E, Taylor L, Jeng HH, Bar-Sagi D. 2014. Wild-type H- and N-ras promote mutant K-ras-driven tumorigenesis by modulating the DNA damage response. Cancer Cell 25:243–256. 10.1016/j.ccr.2014.01.005. [DOI] [PMC free article] [PubMed] [Google Scholar]
- 97.Vlachos IS, Kostoulas N, Vergoulis T, Georgakilas G, Reczko M, Maragkakis M, Paraskevopoulou MD, Prionidis K, Dalamagas T, Hatzigeorgiou AG. 2012. DIANA miRPath v. 2.0: investigating the combinatorial effect of microRNAs in pathways. Nucleic Acids Res. 40:W498–W504. 10.1093/nar/gks494. [DOI] [PMC free article] [PubMed] [Google Scholar]
- 98.Lu TP, Lee CY, Tsai MH, Chiu YC, Hsiao CK, Lai LC, Chuang EY. 2012. miRSystem: an integrated system for characterizing enriched functions and pathways of microRNA targets. PLoS One 7:e42390. 10.1371/journal.pone.0042390. [DOI] [PMC free article] [PubMed] [Google Scholar]