

Abstract
Studies of newly emerged Apis mellifera worker bees have demonstrated that their guts are colonized by a consistent core microbiota within several days of eclosure. We conducted experiments aimed at illuminating the transmission routes and spatiotemporal colonization dynamics of this microbiota. Experimental groups of newly emerged workers were maintained in cup cages and exposed to different potential transmission sources. Colonization patterns were evaluated using quantitative real-time PCR (qPCR) to assess community sizes and using deep sequencing of 16S rRNA gene amplicons to assess community composition. In addition, we monitored the establishment of the ileum and rectum communities within workers sampled over time from natural hive conditions. The study verified that workers initially lack gut bacteria and gain large characteristic communities in the ileum and rectum within 4 to 6 days within hives. Typical communities, resembling those of workers within hives, were established in the presence of nurse workers or nurse worker fecal material, and atypical communities of noncore or highly skewed compositions were established when workers were exposed only to oral trophallaxis or hive components (comb, honey, bee bread). The core species of Gram-negative bacteria, Snodgrassella alvi, Gilliamella apicola, and Frischella perrara, were dependent on the presence of nurses or hindgut material, whereas some Gram-positive species were more often transferred through exposure to hive components. These results indicate aspects of the colony life cycle and behavior that are key to the propagation of the characteristic honey bee gut microbiota.
INTRODUCTION
The honey bee Apis mellifera is the dominant agricultural pollinator worldwide and has suffered population declines in recent years. These declines have been attributed to mite pests, microsporidian pathogens, and other microbial agents (1, 2) and to pollutants, such as insecticidal compounds used in agriculture (3). Genomic and metagenomic analysis of the microbial gut community of bees has shown that their characteristic bacteria harbor genes that may contribute to pathogen defense, detoxification of environmental contaminants, and digestion of pollen cell walls (4–6). Our aim in the current study is to characterize how this microbiota develops within individual workers and how it is transmitted within colonies.
Previous studies using non-culture-based molecular techniques have shown that adult A. mellifera workers possess a consistent set of nine bacterial species that are observed in bees collected worldwide and that dominate their gut communities (7–14). Here, we refer to these species as members of the core microbiota of A. mellifera.
Members of the core gut community include Snodgrassella alvi (Betaproteobacteria: Neisseriales) and Gilliamella apicola and Frischella perrara (Gammaproteobacteria: Orbales). These three species have been axenically cultured and characterized biochemically and morphologically (15, 16). The core microbiota also includes three species of Alphaproteobacteria (“Alpha-1,” “Alpha-2.1,” and “Alpha-2.2” [7]) and three Gram-positive species (“Bifido,” corresponding to Bifidobacterium asteroides [17], and “Firm-4” and “Firm-5” [both Firmicutes: Lactobacillaceae]) (7). Surveys of A. mellifera workers reveal the universal presence of S. alvi, G. apicola, and Firm-5, with individual bees containing distinct strains of each species (8). Discrete communities are found in different gut compartments: the crop and midgut contain very few bacteria, whereas hindgut compartments (ileum and rectum) house large communities with characteristic compositional profiles (18).
Workers eclose from the pupal stage without the core gut bacteria and are fully colonized within several days postemergence (18). Early culture-based studies noted that bees removed from frames as pupae could remain free of gut bacteria through adulthood (19). In more recent studies using molecular methodologies to amplify bacterial sequences from larvae, core species are absent or erratically present, and some noncore species have been detected (9, 13, 18, 20). During the pupal stage (21), the shedding of the integument and gut intima is expected to bar the carriage of gut microbes from the larval stage to the adult stage (18, 22). Developmental barriers to the transfer of gut microbes are overcome in some social insects by behavioral transmission, such as consuming recently shed exuviae, proctodeal (anal to oral) feeding, or coprophagy (23). Newly emerged A. mellifera workers (NEWs) are fed via oral trophallaxis by attendant nurse workers, consume bee bread, the fermented pollen food source stored within hives, and have many encounters with adult bees within the hive. Workers engage in age-related tasks, and NEWs typically work on hive maintenance and cleaning tasks for their first few days of life (21). Thus, interactions with older bees as well as contact with the comb and bee bread are all potential inoculation routes for young workers.
Other species of Apis and species of the related genus Bombus (bumblebees) share some gut bacterial species with A. mellifera, including S. alvi and G. apicola (18, 24). In Bombus species, social interactions play a role in transmission of gut microbiota, and related Bombus species tend to share similar strains of S. alvi and G. apicola, as expected if intracolony transmission is usual (24). A role of these bacteria in defense against bee parasites has been experimentally demonstrated in Bombus terrestris (25). Potentially, these bacteria play similar roles in defending A. mellifera against pathogens (26).
The current study used experimental manipulation of colonization conditions followed by quantitative real-time PCR (qPCR) and deep sequencing to further illuminate the transmission routes and colonization patterns of bacteria in the guts of A. mellifera workers.
MATERIALS AND METHODS
Transmission route experiment.
Brood frames were collected from two hives in West Haven, CT. Late-stage pupae (eyes pigmented but pupae lacking movement) were removed from these frames and placed on cotton pads in sterile plastic bins. These were placed in growth chambers at 35°C and high humidity (∼90% relative humidity) to simulate hive conditions, and pupae were allowed to eclose naturally. After eclosure, NEWs were briefly immobilized at 4°C, and bins were combined to randomize potential age variation. Cohorts of 10 individual NEWs were distributed to cup cages of previously described design (27) with the following conditions: (i) NEWs only (ϴ), (ii) NEWs plus five nurse worker adults (N), (iii) NEWs with a 2.5-cm by 2.5-cm square of comb with honey and bee bread recently removed from a hive (F), (iv) NEWs with five nurse workers and 2.5-cm by 2.5-cm square of frame (FN), (v) NEWs with freshly prepared nurse hindgut homogenate in addition to their food (HG), and (vi) NEWs plus five nurse workers restrained in modified microcentrifuge tubes so that only contact with nurse heads was possible, allowing oral trophallaxis but preventing other contact (NH). Each category was prepared in five replicate cup cages containing 10 NEWs per cage (see Fig. SI3a in the supplemental material). In cup cages with both NEWs and nurses, NEWs and nurses were marked with green or pink Testors paint. Treatment groups were also provided filter-sterilized 0.5 M sucrose syrup and gamma-irradiated (30 kGy) sterile bee bread ad libitum. Any dead nurses were replaced during a daily census. Replacement cup cages were introduced as needed.
The cup cages were maintained in growth chambers at the aforementioned settings for 8 days (9 days posteclosure), at which time all bees were collected directly into 95% ethanol in 15-ml Falcon tubes and immediately placed at −20°C for storage. (Previous results showed that gut communities are fully developed by day 9 [18].)
Five NEWs from each of 5 replicates (25 per treatment condition) were dissected. Dissections were carried out with flame-sterilized forceps and iris scissors under aseptic conditions. Bees were removed from cold ethanol and dried at room temperature for 5 to 10 min on a lint-free laboratory wipe (VWR, Radnor, PA, USA). The entire gut from crop to rectum was placed directly into a bead-beating tube and used for DNA extraction.
Within-hive colonization dynamics experiment.
NEWs were allowed to eclose from frames of two hives (hive E and hive P) in growth chambers at 35°C and ∼90% relative humidity for 4 h in the absence of any adult bees. Five NEWs from each frame were collected immediately after emerging from capped cells as baseline controls (t = 0 days). The remaining bees (n = 45 for each hive) were marked with paint (Testors, Rockford, IL, USA) and returned in equal numbers to their respective hives. Five marked bees were collected from each hive at time points of 0.5, 1, 2, 3, 4, 6, 8, and 16 days following introduction (1 to 16 October 2012; see Fig. SI3a in the supplemental material), placed in 95% ethanol, and stored at −20°C. Day 16 workers have not yet transitioned to foraging behavior and still maintain the hive and brood, as well as guarding the colony (21).
Prior to dissection, the specimens were allowed to dry on a lint-free laboratory wipe for 5 to 10 min. Ileums and rectums from five individuals at each time point from each hive were dissected under sterile conditions and placed in separate bead tubes for DNA extraction.
DNA extraction.
DNA was extracted from dissected tissues using a cetyltrimethylammonium bromide (CTAB), bead-beating method. Dissected material was placed in tubes containing ∼0.5 ml of 0.1-mm silica zirconia beads (BioSpec Products, Bartlesville, OK, USA), 728 μl CTAB, 2 μl 2-mercaptoethanol (Sigma, St. Louis, MO, USA) and 20 μl of 20 mg/ml proteinase K (Sigma). These tubes were then processed in a multisample bead beater (BioSpec Products) at full speed for 2 min, placed on ice for 1 min, and bead-beaten for 2 min. Sample tubes were then allowed to incubate at 56°C overnight. RNase A (Sigma) was added to the tubes (5 μl), which were vortexed briefly and placed at 37°C for 1 h. The samples were combined with 0.75 ml phenol-chloroform-isoamyl alcohol (25:24:1) (Ambion, Austin, TX, USA), shaken for 30 s, and placed on ice for at least 2 min. The sample tubes were centrifuged at full speed for 15 min at 4°C, and the aqueous phase was alcohol precipitated, washed, and air-dried prior to resuspension in 50 μl nuclease-free water.
Extracted DNA was arrayed on 96-well plates and quantified on a Nanodrop 2000 instrument (Nanodrop products, Wilmington, DE, USA). Concentrations were normalized to <200 ng/μl with nuclease-free water.
qPCR to estimate bacterial abundance.
Universal 16S rRNA gene primers 27F (5′-AGAGTTTGATCCTGGCTCAG-3′) and 355R (5′-CTGCTGCCTCCCGTAGGAGT-3′) were used to amplify total copies of the16S rRNA gene of each sample on an Eppendorf Mastercycler ep realplex instrument (Eppendorf, Hauppauge, NY, USA). Triplicate 10-μl reactions were carried out with 5 μl Kapa SYBR fast 2× master mix (Kapa Biosystems, Woburn, MA, USA), 0.2 μl (each) 10 μM primer, 4.1 μl H2O, and 0.5 μl 100× dilutions of template DNA. The cycling conditions consisted of 95°C for 3 min and 40 cycles of two-step PCR at 95°C for 3 s and 20 s at 60°C. Quantification was based on standard curves from amplification of the cloned target sequence in a pGEM-T vector (Promega, Madison, WI, USA).
Samples with copy amounts below the range of detection of the standard curve were assigned a value of 104 copies, corresponding to the lower limit of detection. Values were adjusted to account for dilution and log transformed for statistical tests. For statistical analyses of the transmission route experiment, samples were grouped by cup within treatment categories. Treatment group absolute abundances were analyzed using one-way analysis of variance (ANOVA). Mann-Whitney (Wilcoxon-rank) nonparametric U tests were used to test between treatment groups and between organs and hives at a given sampling using the software program JMP 9 (SAS, Cary, NC, USA).
Illumina sequencing (iTag) procedure.
Microbial diversity was assessed in each sample by performing Illumina-based bar coding and deep sequencing of amplicons of the V4 region of 16S rRNA genes (see Table SI2g in the supplemental material for primer and bar code sequences) (28).
Amplifications were performed in triplicate with a negative control using Phusion high-fidelity Taq polymerase (New England Biochemical, Ipswich, MA, USA). Each 30-μl reaction mixture contained 1 μl purified 100-fold-diluted template, 6 μl component buffer HF, 0.75 μl (each) 10 μM primer, 0.2 μl Phusion Taq, 0.6 μl 10 mM deoxynucleoside triphosphates (dNTPs), and 20.7 μl H2O. The cycling protocol was 1 min at 98°C, 35 cycles of 10 s at 98°C, 15 s at 54°C, and 15 s at 72°C, followed by 2 min at 72°C. Reaction mixtures were pooled to minimize amplification bias and were verified on a 2% agarose gel in 0.5× Tris-borate-EDTA (TBE). Any failed reactions were repeated with 10-fold-more-concentrated template. Reactions that failed to amplify with more-concentrated template were noted, and the A. mellifera elongation factor 1α gene (EF1-α) was amplified as described in reference 18 as a control to assess DNA quality of the sample. A process control of Escherichia coli strain K-12 DNA and the DNA of previously characterized sample AZ125.4 (8) were also amplified.
Amplicons were cleaned using Agencourt AMPure XP beads (Beckman Coulter Genomics, Indianapolis, IN, USA) and quantified using Pico Green (Invitrogen/Life Technologies, Grand Island, NY, USA) on a Victor X multilabel plate reader (PerkinElmer, Waltham, MA, USA). Equimolar amounts of clean amplicon were combined in a single pooled sample and submitted to the Yale Center for Genomic Analysis (YCGA) for a MiSeq 2 × 250 sequencing run (Illumina, San Diego, CA, USA).
The software program QIIME v1.7 (29) was used to demultiplex and quality filter the retrieved sequences at q20 and above. Paired samples were assembled using a modified script of PANDAseq. Assembled reads were then used to perform subsampled open reference operational taxonomic unit (OTU) picking utilizing the methods described in the QIIME v1.7 tutorial (http://qiime.org/tutorials/open_reference_illumina_processing.html). Final reference-based clustering was performed against the Greengenes May 2013 release sequence database at 0.97 similarity (http://greengenes.secondgenome.com/) (30). Representative reads were screened for chimeras using the software program ChimeraSlayer (31). Plastid, mitochondrial, chimeric, and singleton sequences were filtered from the OTU table, which was split into the “transmission route” and “colonization dynamics” experimental sets. Read processing is summarized in Table SI2a in the supplemental material.
OTU tables were randomly subsampled without replacement at a level of 3,500 reads. OTU tables were used to estimate alpha diversity (Shannon index and equitability) and beta diversity (weighted UniFrac) and to construct relative abundance plots. OTUs were binned to examine relative abundance by the following method. Sequences from high-abundance OTUs (>1% in any sample) were used as queries in a BLASTn search of the NCBI nr database, and the 10 top hits were reviewed for assignment of a taxonomic ID. These high-abundance OTUs were then binned to core bee-associated species or noncore groups (several families of Gammaproteobacteria and environmentally associated Firmicutes) based on BLAST assignment. The nine core associate bins represent tight phylogenetic clusters usually showing <3% divergence for the full-length 16S rRNA sequence, and we henceforth refer to these as “species” for simplicity.
Taxonomic abundance was visualized by building bar charts of individual sample composition and average abundance per group for the core and noncore species bins. The frequencies of these bins for each treatment group were calculated from their occurrence within an individual of a given group and were included if the bin had a relative abundance of 1% or more. Statistical analyses of relative species abundance were performed using nested ANOVA (cups nested within treatment categories) to account for cup effects within treatments. Tukey's honestly significant difference (HSD) post hoc tests in were run in JMP 9 to look for significant differences between treatment groups.
Scatter plots, heat maps, bar charts, and box plots were constructed in QIIME, JMP 9, and R (http://cran.r-project.org/) with native graphics or with ggplot2 (32).
Comparisons of beta diversity distances between treatment groups for transmission route samples were performed in the QIIME “make_distance_comparison_plots.py” workflow using 2-tailed t tests with 1,000 Monte Carlo permutations. The R VEGAN (33) Adonis method for permutational multivariate analysis of variance (PERMANOVA) (34) was used to examine variance between replicates in treatment groups in the transmission route experiment and between organs on a given day in the colonization dynamics experiment.
For the in-hive colonization dynamics experiment, absolute 16S rRNA copy numbers from qPCR were used to transform the average relative abundance of each species to yield absolute abundance (TAA) estimates. Numbers of rRNA operons vary among bacterial species and strains, so these estimates are a crude index for simultaneously comparing composition and size of the A. mellifera gut microbiota. Scatter plots were constructed in JMP 9 with TAA value trend lines to visualize colonization patterns within the ileum and rectum.
Nucleotide sequence accession number.
The sequence files are available from the Sequence Read Archive (http://www.ncbi.nlm.nih.gov/sra), BioProject identifier (ID) PRJNA225925.
RESULTS
Effect of exposure treatment on total community size.
NEWs that were removed from frames as late-stage pupae, allowed to eclose under germfree conditions, given sterile food, and assessed after 8 days had the lowest numbers of bacteria of any tested group (Fig. 1d, treatment condition = ϴ), with average 16S rRNA gene copy number estimated at 1.9 × 10⁶ (±3.0 × 10⁶ standard deviation [SD]). This number is likely an overestimate, since assay results below the detection level were assigned the value of 104, the minimal detectable number. Even so, the average 16S rRNA gene copy number was 100-fold lower than that for the next-highest treatment condition, NH, which contained NEWs exposed only to oral trophallaxis with nurse bees and for which the average copy number was 1.9 × 10⁸ (±1.5 × 10⁸ SD) copies (Mann-Whitney, P < 0.0001) (Fig. 1d).
FIG 1.

Bacterial communities established through different transmission route treatments.(a and b) Individual (a) or mean (b) community composition based on 72 high-abundance OTUs binned to species (phylotype) of representative sequence. (c) Heat map of the frequency of species (with ≥1% relative abundance) within treatment groups. (d) Total 16S rRNA gene copies for treatment groups. Box plots are of quantiles, and diamonds signify mean copy number. “ϴ,” unexposed NEWs. Letters to the right of the plot demonstrate shared significance groups (Mann-Whitney).
As a result of their low microbial loads, all samples from the unexposed NEWs failed to amplify with the bar-coded V4 primers regardless of the template dilution used. This template was successfully used to amplify the A. mellifera gene (EF1-α), demonstrating that the DNA preparations were of suitable quality for PCR. Thus, these samples could not be used for analyses of community composition.
HG had significantly higher bacterial loads than any other categories (Mann-Whitney, P < 0.0001) except F, which did not differ from HG (Mann-Whitney, P = 0.34) (Fig. 1d).
Total community size during in-hive colonization dynamics experiment.
For NEWs reintroduced into colonies, gut communities of the two hives showed similar trends in rates of increase and stabilization of total bacterial numbers (Fig. 2). Bacterial loads did not differ significantly on a given day between the hives, except for ileum samples at t = 0 days (Mann-Whitney, P = 0.037) and rectum samples at t = 1 day (Mann-Whitney, P = 0.022) and t = 8 days (Mann-Whitney, P = 0.012).
FIG 2.

Colonization dynamics within two sampled hives (upper and lower halves of figure) for ileum (left) and rectum (right). A time course is shown for relative abundance (top), total 16S gene copies (middle), and transformed absolute abundance (bottom). The transformed absolute abundances are total 16S rRNA gene copies transformed by relative abundance percentages, which provides a crude metric showing how numbers of each species change with worker age. Atypic., atypical; Env_Firm*, environmentally associated Firmicutes; Lacto, Lactobacillus.
Bees emerging from brood comb (t = 0 days) initially had very low microbial levels (average copy number across all groups estimated at 1.1 × 10⁵ [±4.7 × 10⁴ SD]), and none of these samples amplified with the V4 primers. Microbial levels stayed low through the first day. Overall community expansion was about 24 h earlier in hive P than in hive E. For t = 1 day ileum and rectum samples, only those from hive P amplified with the V4 primers. Gut communities in bees introduced to both hives exhibited logarithmic growth starting on day 1 or 2 and continuing until days 4 to 6. Hive E communities largely stabilized after this period, with average total 16S rRNA gene copies on day 6 at 1.1 × 10⁸ (±1.4 × 10⁸ SD) in the ileum and 3.1 × 10⁸ (±2.5 × 10⁸ SD) in the rectum. These values remained relatively static until day 16, when the rectal copy number climbed to 2.2 × 10⁹ (±2.6 × 10⁹ SD). Hive P bacterial populations appeared to fluctuate between the t = 6 days and t = 16 days span, with rectal averages climbing to 1.6 × 10⁹ (±1.3 × 10⁹ SD) on t = 8 days and ileum populations declining to 4.9 × 10⁷ (±3.4 × 10⁶ SD). By t = 16 days, these fluctuations had moderated around 5 × 10⁸. Some of this fluctuation likely reflects variation among individuals combined with limited sample sizes, with only five bees per hive per sampling point.
Effect of exposure treatment on community composition and diversity indices.
For the transmission route data set, we considered 72 high-abundance (>1% in any sample) OTUs that contained 96.4% of total reads. The relative abundances of species within individual samples as well as group mean abundances are shown in Fig. 1a and b, while the frequencies of species in each group are visualized in the Fig. 1c heat map.
Three treatment categories (NH, FN, and HG) had significant variation among replicate cups, based on weighted UniFrac beta diversity distances calculated using PERMANOVA (P < 0.002; see Table SI2e in the supplemental material for all results). Individuals often shared more similar communities within a cup than between cups within a treatment category (e.g., cups 3 and 5 in the FN category; Fig. 1a). Despite this cup-to-cup variation, there are some significant trends distinguishing the treatment categories.
Almost all bees tested contained large components of Firm-5, with some exceptions in the NH and F treatments. Firm-5 was present across treatments at frequencies of 72 to 100% and was the backdrop against which other shifts in community were observed. Here we consider shifts in other species, with focus on changes in the core Gram-negative species G. apicola, S. alvi, and F. perrara.
The NH and F treatment groups were characterized by their large constituents of Gram-positive and diminished proportions of core Gram-negative associates. Both groups lacked G. apicola entirely, had similarly low levels of S. alvi (frequency, 0.12 to 0.17), and zero to low levels of F. perrara (average frequency of 0 in the NH group and 0.13 in the F group). The average diversity and evenness measures of these groups were low and statistically indistinguishable (Fig. 3).
FIG 3.
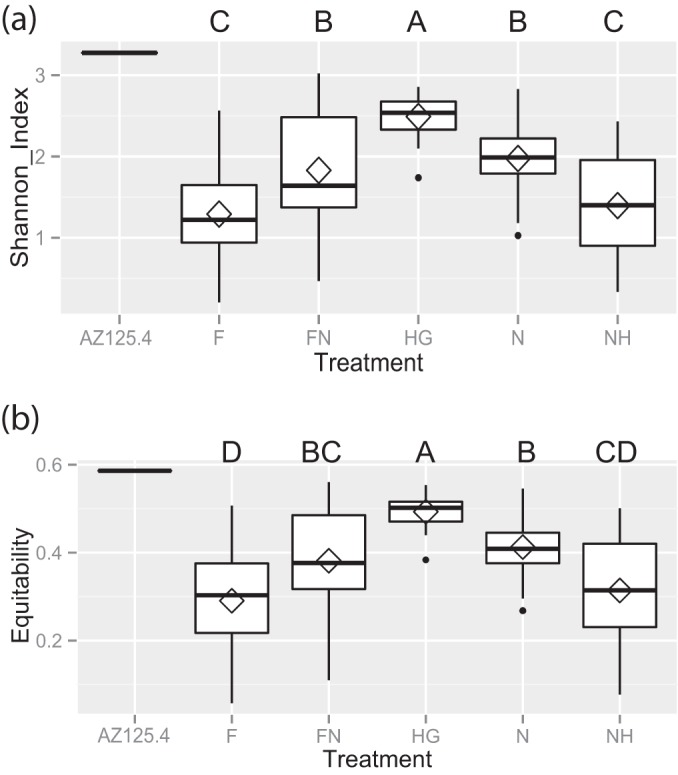
Alpha diversity measures of transmission route treatment groups. (a and b) Average richness (“Shannon_Index”) (a) or evenness (“Equitability”) (b) of treatment groups. Box plots are of quantiles, and diamonds signify mean values. Letters above the plot demonstrate shared significance groups (Tukey's HSD).
Gram-negative bacteria appeared more frequently and with higher relative abundance in the treatments with exposure to unrestrained nurses (N and FN), with G. apicola and F. perrara at frequencies of 0.24 to 0.32 and S. alvi at 0.36 to 0.56.
HG bees possessed the highest frequencies of all of the characteristic core microbiota members (see Fig. 1c) and had significantly higher representation of G. apicola (frequency = 0.68; mean abundance = 11.4% ± 13.8% SD) than any other group (nested ANOVA, P < 0. 001; Tukey's HSD post hoc, P < 0.002). This group also contained very high levels of S. alvi (frequency = 0.92; mean abundance = 26.8% ± 17.7% SD), comparable to those of the N treatment group (Tukey's HSD, P = 0.52) and significantly higher than values for all other groups (nested ANOVA, P < 0. 0001; Tukey's HSD post hoc, P < 0.0002).
A control sample used in an earlier study (AZ125.4), representing a normally colonized worker removed from a hive, yielded estimates of species proportions similar to those obtained previously (8) (see Table SI2b in the supplemental material), despite the utilization of different regions of the 16S rRNA gene sequence and different sequencing methods. There were some shifts in the relative abundances of G. apicola (17% versus 24% relative abundance in the current study) and Firm-4 (27% versus 19%). Nevertheless, all of the expected species were represented in roughly similar proportions, signifying that general observations about the presence and community structure of randomly collected individual adult workers in the earlier study apply to the current work. This control sample also had some of the highest measures of diversity and evenness observed in the data set (Fig. 3).
Correlations between binned taxon-specific read abundance (sampled at a depth of 3,500 reads) and 16S rRNA gene copy number were used to examine whether specific members of the community were associated with overall community size. The presence of environmentally associated (noncore) Firmicutes was negatively correlated with community size when examined across the entire transmission route data set (Pearson's correlation, r = −0.68; P < 0.0001). Negative correlations with community size were also observed for the environmentally associated Alpha-2.2 (Pearson's correlation, r = −0.56; P < 0.0001) and for the noncore gammaproteobacterial bins Gamma-5 (Pearson's correlation, r = −0.56; P < 0.0001) and Gamma-6 (Pearson's correlation, r = −0.52; P < 0.0001). In contrast, significantly positive correlations were observed with several of the core microbiota members (see Table SI2d in the supplemental material). Thus, the noncore types make up a greater proportion of the communities in small gut communities and have lower frequencies in larger gut communities.
Beta diversity between the transmission route groups was examined via principal coordinate analysis (PCoA) ordination of jackknifed weighted UniFrac distances (Fig. 4). This method uses multiple replicates of subsampled read abundances to weight an ordination based on phylogenetic distance and thus plot differences in beta diversity (35). This ordination, which accounts for 45% of the variation, shows a distribution largely characterized by two groups: the NH- and F-dominated region (blue ellipse) and the HG-dominated area (green ellipse). NH and F points are more tightly concentrated, whereas HG points are more dispersed. Other samples are spread between these two regions and do not display clear clustering by treatment. Weighted UniFrac distance from the AZ125.4 control sample was lowest to the HG group and significantly greater to the F, N, and NH groups (Fig. 5).
FIG 4.
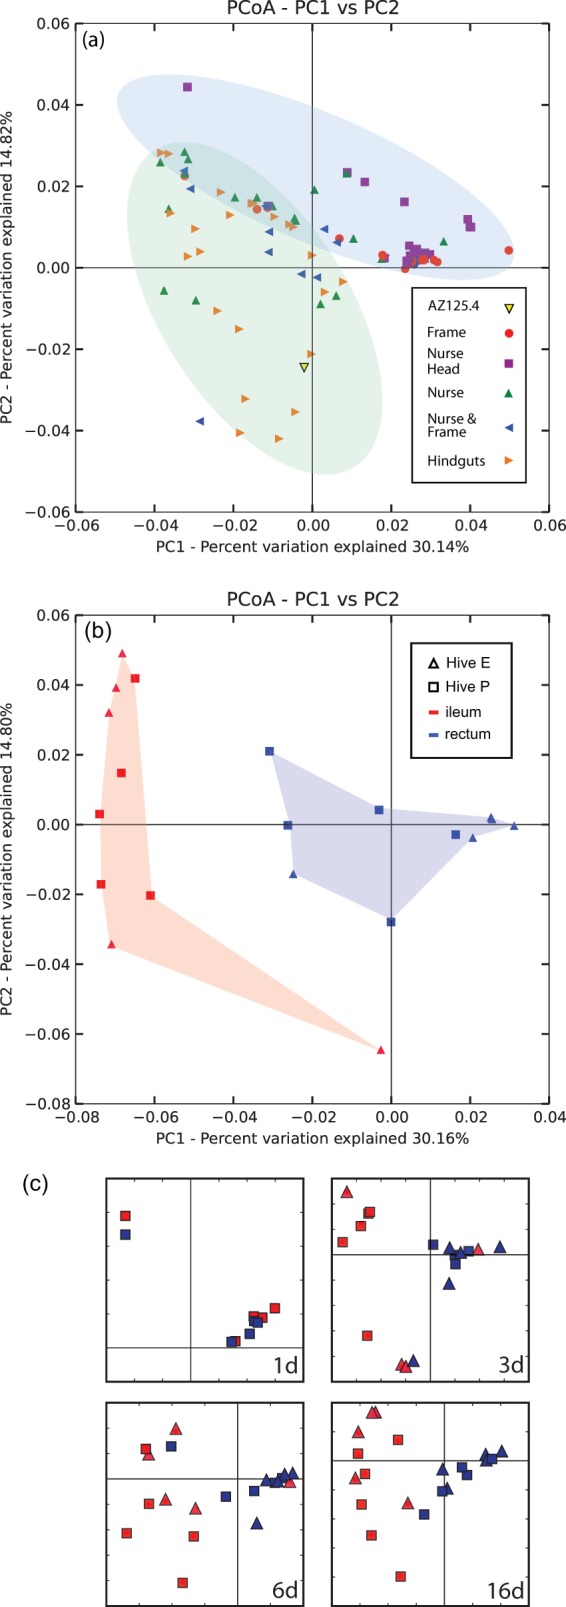
(a) Distances among communities of bees with different exposure treatments, represented as PCoA plots of jackknifed weighted UniFrac distances. The blue ellipse shows the area of plot dominated by the NH and F treatment groups. The green ellipse shows the area dominated by the HG and to a lesser extent N and NF treatments. (b) PCoA plot of jackknifed weighted UniFrac distances of t = 8-day samples in within-hive colonization experiment (sampled at an even depth of 3,500 sequences). Samples from the ileum and rectum are fully segregated and differ significantly at 8 days posteclosure (Adonis PERMANOVA, R2 = 0.42; F1,18 = 13.29; P < 0.001). (c) Simplified PCoA plots from within-hive colonization dynamics experiment. A detailed version of this plot with all points sampled is available in figure SI3b in the supplemental material.
FIG 5.
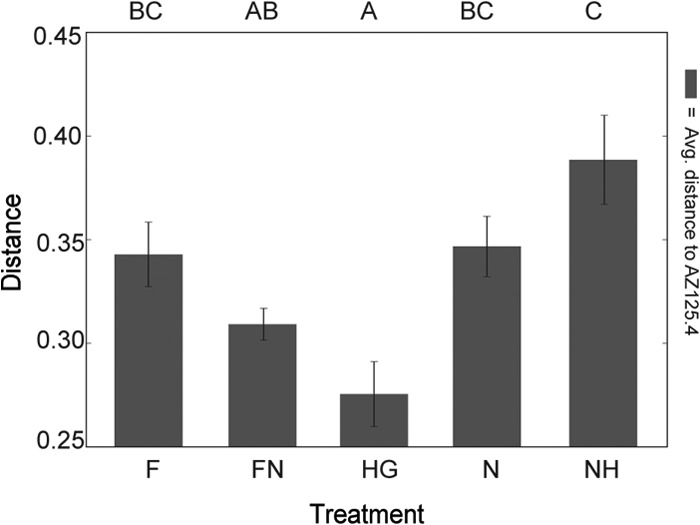
Average weighted UniFrac distances between representative control sample (AZ125.4) and transmission route treatment groups. Letters above the chart demonstrate shared significance groups at P < 0.05 evaluated with a 2-sided nonparametric t test with 1,000 Monte Carlo iterations, Bonferroni corrected.
Colonization dynamics within hives.
We estimated both absolute (via qPCR) and relative abundances (with 121 high-abundance OTUs that contained 96.0% of total reads) of bacterial species in gut compartments of bees in the two sampled hives (Fig. 2). Within the ileum, individuals in hive P were first to produce consistently amplifiable bacterial signal (by t = 1 day) and were initially dominated by a small population of noncore gammaproteobacteria. The community expanded in size at t = 2 days and t = 3 days, with successive blooms of F. perrara, S. alvi, and G. apicola, which dominated the ileum for the remainder of samplings. Hive E had fewer noncore species initially but had similar patterns of dominant core members for most of the series. The microbial populations in rectal samples from both hives were dominated by Firm-5, although hive P rectal samples had a higher mean relative abundance of S. alvi than did hive E at t = day 8 (P = 0.0065, one-way ANOVA).
For the experiment on colonization dynamics within hives, organ type was responsible for the most evident grouping of gut communities based on PCoA ordination of jackknifed weighted UniFrac distances. Communities in the ileum and rectum were statistically different by t = 3 days (Adonis PERMANOVA, R2 = 0.23; F1,17 = 5.01; P = 0.002) and diverged more by t = 8 days (Adonis PERMANOVA, R2 = 0.42; F1,18 = 13.29; P < 0.001) (Fig. 4b). Simplified PCoAs of the time series are summarized in Fig. 4c (detailed plots are available in Fig. SI3b in the supplemental material), and Adonis PERMANOVA results are included in Table SI2f. The ileum and rectum communities formed distinct groups within the t = 3 days, 6 days, 8 days, and 16 days ordinations (Fig. 4c).
DISCUSSION
Our results confirm findings of previous smaller-scale studies that A. mellifera workers emerge from the pupal stage without their core gut microbiota and with no or few bacteria of any kind (18, 19). Individuals eclosing outside the hive and not exposed to frame material or nurses failed to develop a substantial gut community even after 8 days, in contrast to bees exposed to natural hive conditions, which have a stable community dominated by core species by days 4 to 6. In addition, workers freshly collected after eclosing from frames (t = 0 days) in the within-hive experiment had extremely few bacteria. Bacterial DNA in these samples was too scarce to amplify for Illumina-based 16S rRNA gene sequencing.
The within-hive colonization dynamics experiment showed that both noncore and core microbes first colonize the ileum and subsequently colonize the rectum over the course of 2 days posteclosure (Fig. 2). This initial colonization phase is followed by rapid establishment of more consistent core communities within 4 to 6 days posteclosure. Organ-specific communities are evident by day 3 (Fig. 2 and 4c; see also Table SI2f in the supplemental material). The ileum is dominated by the core Gram-negative species, S. alvi, G. apicola, and F. perrara, and the rectum by the Gram-positive species, Firm-5. This result agrees with results of a previous study that found relatively high levels of S. alvi and G. apicola in the ileum and relatively high levels of Firm-5 in the rectum (18). Community sizes stabilize at 4 to 6 days posteclosure and continue at this high level at least through day 16, the last sampling point. Hives appear to differ in the rate at which bees are colonized and the speed at which a core microbiota is established. These differences could reflect hygienic habits within the colony as established by their genetics, bacterial strain differences, or colony disease status.
When exposed only to oral trophallaxis (NH) or comb material (F), workers acquire atypical microbial gut communities dominated by noncore taxa. These bees largely lacked the highly characteristic species G. apicola, F. perrara, and S. alvi, implying that these are not regularly transferred by oral trophallaxis or contact with hive surfaces. Instead, these three core Gram-negative species in the A. mellifera microbiota appear to depend on direct contact with fecal material for transfer. Whether this contact reflects specialized behavior or simply contact with recently deposited feces in the hive remains an area for future investigation. Potentially, feces deposited on comb surfaces remain a source of inoculation for a period of minutes; the comb used in our F treatment had been removed for approximately 24 h from the hive of origin. Within hives, NEWs may encounter fresh feces on the comb surface and through social interactions, a situation that may have been best mimicked by our HG treatment.
The HG treatment group had diverse and evenly composed gut communities (Fig. 3) with compositions closest to the characteristic core microbiotas of normal workers (Fig. 5). Although the HG treatment was artificial, it may parallel the exposure of bees at high densities within hives, and it demonstrates that these bacteria are transmissible through a fecal route. Although healthy workers are reported to defecate outside the hive exclusively (36, 37), our findings suggest that defecation and coprophagy occur inside the hive or that workers acquire gut bacteria through anal trophallaxis or anal grooming. We note that even a very low incidence of such behaviors would suffice for transmission of gut symbionts and that transmission of human gut symbionts also occurs through a fecal route (38).
Low-diversity communities containing mostly Firm-5 or noncore Firmicutes were observed in F treatments (Fig. 1a). Thus, Firm-5 can be routinely transmitted by contact with hive materials. This observation is consistent with previous studies in which lactobacilli (including Firm-5 isolates) were recovered from hive components (39–41). Workers exposed only to oral trophallaxis contained scarce gut communities similar to those of unexposed bees, whereas those bees exposed to frame material alone had the largest communities (Fig. 1d). Although trophallaxis was observed between the restrained nurses and NEWs in the NH treatment, its incidence was likely lower than that for unrestrained bees in a normal hive. Nevertheless, our data strongly weigh against oral or environmental transmission, alone or combined, as sufficient routes for NEWs to acquire their gut microbiota, especially the core Gram-negative species.
Interestingly, bees exposed to frame material alone had large communities of atypical composition, whereas those exposed to frame with nurses present or to nurses alone had much smaller communities (Fig. 1d). Thus, exposure to nurses appears to limit bacterial numbers in the gut, potentially indicating social immunity (42–45). Studies with other social insects, such as termites and carpenter ants, have demonstrated increases in immunocompetence due to social interaction (46), particularly trophallaxis (47). Other research on A. mellifera has linked the lactobacilli and Bifidobacterium bacteria of the foregut (honey stomach), which is the organ used in oral trophallaxis, to the presence of antimicrobial compounds (48). Exposure to prophylactic factors from nurses in these groups may suppress opportunistic infections by noncore bacteria or blooms of core species. Exposure to feces may also curb expansion of noncore microbes, as with bumblebees, which have been shown to gain immunity benefits against the pathogen Crithidia bombi after exposure to feces containing G. apicola and S. alvi (25).
The significant cup-to-cup variation is consistent with social transmission of many of these bacteria. Chance differences in exposure are likely for cups within a treatment; for example, introduced sets of nurses or pieces of comb probably display distinct bacterial community profiles. Any between-cup differences would be heightened by exchange of bacteria among NEWs within cups.
An implication of our findings is that honey bees are highly dependent on their hive-mates for acquisition of their normal gut bacteria. Each worker acquires a fully expanded, typical gut community before it leaves the hive. In light of recent findings of extensive strain diversity within the honey bee gut bacteria (5, 6), this raises the possibility that different colonies maintain distinct community profiles at the strain level. If so, biological variation among colonies could result in part from variation in gut communities.
Conclusion.
NEWs develop a characteristic core microbiota within hives. The absolute size and composition of this community likely reflect the interplay of exposure to social sources of colonization, socially acquired immunity factors, and interactions among gut community members. Some Gram-positive members of the core microbiota can be acquired through contact with hive surfaces. Gram-negative species, S. alvi, G. apicola, and F. perrara, appear to be acquired through contact with nurse bees or with fresh feces but not through oral trophallaxis.
For bees emerging normally within hives, the characteristic microbiota forms in predictable patterns wherein initial small communities of noncore species are supplanted by core species in communities distinctive of each gut region (Fig. 2). Our findings also suggest that social immunity factors or behavioral differences among colonies influence development and composition of gut communities; these possibilities remain to be further investigated.
Supplementary Material
ACKNOWLEDGMENTS
We thank Kim Hammond for maintaining bee colonies and for her work on the figures. We thank Allison Hansen, Jeffrey Ostermiller, and Patrick Degnan for advice on analyses.
This work was supported by National Science Foundation awards 1046153 and 1415604 (to N.A.M.) and by the University of Texas at Austin.
Footnotes
Published ahead of print 19 September 2014
Supplemental material for this article may be found at http://dx.doi.org/10.1128/AEM.01861-14.
REFERENCES
- 1.Cornman RS, Tarpy DR, Chen Y, Jeffreys L, Lopez D, Pettis JS, VanEngelsdorp D, Evans JD. 2012. Pathogen webs in collapsing honey bee colonies. PLoS One 7:e43562. 10.1371/journal.pone.0043562. [DOI] [PMC free article] [PubMed] [Google Scholar]
- 2.Vanengelsdorp D, Evans JD, Saegerman C, Mullin C, Haubruge E, Nguyen BK, Frazier M, Frazier J, Cox-Foster D, Chen Y, Underwood R, Tarpy DR, Pettis JS. 2009. Colony collapse disorder: a descriptive study. PLoS One 4:e6481. 10.1371/journal.pone.0006481. [DOI] [PMC free article] [PubMed] [Google Scholar]
- 3.Blacquière T, Smagghe G, van Gestel CA, Mommaerts V. 2012. Neonicotinoids in bees: a review on concentrations, side-effects and risk assessment. Ecotoxicology 4:973–992. 10.1007/s10646-012-0863-x. [DOI] [PMC free article] [PubMed] [Google Scholar]
- 4.Engel P, Martinson VG, Moran NA. 2012. Functional diversity within the simple gut microbiota of the honey bee. Proc. Natl. Acad. Sci. U. S. A. 109:11002–11007. 10.1073/pnas.1202970109. [DOI] [PMC free article] [PubMed] [Google Scholar]
- 5.Kwong WK, Engel P, Koch H, Moran NA. 2014. Genomics and host specialization of honey bee and bumble bee gut symbionts. Proc. Natl. Acad. Sci. U. S. A. 111:11509–11514. 10.1073/pnas.1405838111. [DOI] [PMC free article] [PubMed] [Google Scholar]
- 6.Engel P, Stepanauskas R, Moran NA. 2014. Hidden diversity in honey bee gut symbionts detected by single-cell genomics. PLoS Genet. 10:e1004596. 10.1371/journal.pgen.1004596. [DOI] [PMC free article] [PubMed] [Google Scholar]
- 7.Martinson VG, Danforth BN, Minckley RL, Rueppell O, Tingek S, Moran NA. 2011. A simple and distinctive microbiota associated with honey bees and bumble bees. Mol. Ecol. 20:619–628. 10.1111/j.1365-294X.2010.04959.x. [DOI] [PubMed] [Google Scholar]
- 8.Moran NA, Hansen AK, Powell JE, Sabree ZL. 2012. Distinctive gut microbiota of honey bees assessed using deep sampling from individual worker bees. PLoS One 7:e36393. 10.1371/journal.pone.0036393. [DOI] [PMC free article] [PubMed] [Google Scholar]
- 9.Ahn JH, Hong IP, Bok JI, Kim BY, Song J, Weon HY. 2012. Pyrosequencing analysis of the bacterial communities in the guts of honey bees Apis cerana and Apis mellifera in Korea. J. Microbiol. 50:735–745. 10.1007/s12275-012-2188-0. [DOI] [PubMed] [Google Scholar]
- 10.Yang X, Cox-Foster DL. 2005. Impact of an ectoparasite on the immunity and pathology of an invertebrate: evidence for host immunosuppression and viral amplification. Proc. Natl. Acad. Sci. U. S. A. 102:7470–7475. 10.1073/pnas.0501860102. [DOI] [PMC free article] [PubMed] [Google Scholar]
- 11.Disayathanoowat T, Young JPW, Helgason T, Chantawannakul P. 2012. T-RFLP analysis of bacterial communities in the midguts of Apis mellifera and Apis cerana honey bees in Thailand. FEMS Microbiol. Ecol. 79:273–281. 10.1111/j.1574-6941.2011.01216.x. [DOI] [PubMed] [Google Scholar]
- 12.Jeyaprakash A, Hoy MA, Allsopp MH. 2003. Bacterial diversity in worker adults of Apis mellifera capensis and Apis mellifera scutellata (Insecta: Hymenoptera) assessed using 16S rRNA sequences. J. Invertebr. Pathol. 84:96–103. 10.1016/j.jip.2003.08.007. [DOI] [PubMed] [Google Scholar]
- 13.Mohr KI, Tebbe CC. 2006. Diversity and phylotype consistency of bacteria in the guts of three bee species (Apoidea) at an oilseed rape field. Environ. Microbiol. 8:258–272. 10.1111/j.1462-2920.2005.00893.x. [DOI] [PubMed] [Google Scholar]
- 14.Olofsson TC, Vásquez A. 2008. Detection and identification of a novel lactic acid bacterial flora within the honey stomach of the honeybee Apis mellifera. Curr. Microbiol. 57:356–363. 10.1007/s00284-008-9202-0. [DOI] [PubMed] [Google Scholar]
- 15.Kwong W, Moran NA. 2012. Cultivation and characterization of the gut symbionts of honey bees and bumble bees: description of Snodgrassella alvi gen. nov., sp. nov., a member of the family Neisseriaceae of the Betaproteobacteria, and Gilliamella apicola gen. nov., sp. nov., a member of Orbaceae fam. nov., Orbales ord. nov., a sister taxon to the order ‘Enterobacteriales' of the Gammaproteobacteria. Int. J. Syst. Evol. Microbiol. 63:2008–2018. 10.1099/ijs.0.044875-0. [DOI] [PubMed] [Google Scholar]
- 16.Engel P, Kwong WK, Moran NA. 2013. Frischella perrara gen. nov., sp. nov., a gammaproteobacterium isolated from the gut of the honey bee, Apis mellifera. Int. J. Syst. Evol. Microbiol. 63:3646–3651. 10.1099/ijs.0.049569-0. [DOI] [PubMed] [Google Scholar]
- 17.Bottacini F, Milani C, Turroni F, Sánchez B, Foroni E, Duranti S, Serafini F, Viappiani A, Strati F, Ferrarini A, Delledonne M, Henrissat B, Coutinho P, Fitzgerald GF, Margolles A, van Sinderen D, Ventura M. 2012. Bifidobacterium asteroides PRL2011 genome analysis reveals clues for colonization of the insect gut. PLoS One 7:e44229. 10.1371/journal.pone.0044229. [DOI] [PMC free article] [PubMed] [Google Scholar]
- 18.Martinson VG, Moy J, Moran NA. 2012. Establishment of characteristic gut bacteria during development of the honeybee worker. Appl. Environ. Microbiol. 78:2830–2840. 10.1128/AEM.07810-11. [DOI] [PMC free article] [PubMed] [Google Scholar]
- 19.Gilliam M. 1971. Microbial sterility of the intestinal content of the immature honey bee, Apis mellifera. Ann. Entomol. Soc. Am. 63:315–316. [Google Scholar]
- 20.Vojvodic S, Rehan SM, Anderson KE. 2013. Microbial gut diversity of Africanized and European honey bee larval instars. PLoS One 8:e72106. 10.1371/journal.pone.0072106. [DOI] [PMC free article] [PubMed] [Google Scholar]
- 21.Winston ML. 1987. The biology of the honey bee. Harvard University Press, Cambridge, MA. [Google Scholar]
- 22.Kaltenpoth M, Goettler W, Koehler S, Strohm E. 2009. Life cycle and population dynamics of a protective insect symbiont reveal severe bottlenecks during vertical transmission. Evol. Ecol. 24:463–477. 10.1007/s10682-009-9319-z. [DOI] [Google Scholar]
- 23.Weiss MR. 2006. Defecation behavior and ecology of insects. Annu. Rev. Entomol. 51:635–661. 10.1146/annurev.ento.49.061802.123212. [DOI] [PubMed] [Google Scholar]
- 24.Koch H, Abrol DP, Li J, Schmid-Hempel P. 2013. Diversity and evolutionary patterns of bacterial gut associates of corbiculate bees. Mol. Ecol. 7:2028–2044. 10.1111/mec.12209. [DOI] [PubMed] [Google Scholar]
- 25.Koch H, Schmid-Hempel P. 2011. Socially transmitted gut microbiota protect bumble bees against an intestinal parasite. Proc. Natl. Acad. Sci. U. S. A. 108:19288–19292. 10.1073/pnas.1110474108. [DOI] [PMC free article] [PubMed] [Google Scholar]
- 26.Kaltenpoth M, Engl T. 2014. Defensive microbial symbionts in Hymenoptera. Funct. Ecol. 28:315–327. 10.1111/1365-2435.12089. [DOI] [Google Scholar]
- 27.Evans J, Chen YP, di Prisco GDP, Pettis J, Williams V. 2009. Bee cups: single-use cages for honey bee experiments. J. Apic. Res. 48:300–302. 10.3896/IBRA.1.48.4.13. [DOI] [Google Scholar]
- 28.Caporaso JG, Lauber CL, Walters WA, Berg-Lyons D, Huntley J, Fierer N, Owens SM, Betley J, Fraser L, Bauer M, Gormley N, Gilbert JA, Smith G, Knight R. 2012. Ultra-high-throughput microbial community analysis on the Illumina HiSeq and MiSeq platforms. ISME J. 6:1621–1624. 10.1038/ismej.2012.8. [DOI] [PMC free article] [PubMed] [Google Scholar]
- 29.Caporaso JG, Kuczynski J, Stombaugh J, Bittinger K, Bushman FD, Costello EK, Fierer N, Peña AG, Goodrich JK, Gordon JI, Huttley GA, Kelley ST, Knights D, Koenig JE, Ley RE, Lozupone CA, Mcdonald D, Muegge BD, Pirrung M, Reeder J, Sevinsky JR, Turnbaugh PJ, Walters WA, Widmann J, Yatsunenko T, Zaneveld J, Knight R. 2010. QIIME allows analysis of high-throughput community sequencing data. Nat. Methods 7:335–336. 10.1038/nmeth.f.303. [DOI] [PMC free article] [PubMed] [Google Scholar]
- 30.McDonald D, Price MN, Goodrich J, Nawrocki EP, DeSantis TZ, Probst A, Andersen GL, Knight R, Hugenholtz P. 2012. An improved Greengenes taxonomy with explicit ranks for ecological and evolutionary analyses of bacteria and archaea. ISME J. 6:610–618. 10.1038/ismej.2011.139. [DOI] [PMC free article] [PubMed] [Google Scholar]
- 31.Haas BJ, Gevers D, Earl AM, Feldgarden M, Ward DV, Giannoukos G, Ciulla D, Tabbaa D, Highlander SK, Sodergren E, Methé B, DeSantis TZ, Petrosino JF, Knight R, Birren BW. 2011. Chimeric 16S rRNA sequence formation and detection in Sanger and 454-pyrosequenced PCR amplicons. Genome Res. 21:494–504. 10.1101/gr.112730.110. [DOI] [PMC free article] [PubMed] [Google Scholar]
- 32.Wickham H. 2009. ggplot2: elegant graphics for data analysis. Springer; New York, NY. [Google Scholar]
- 33.Oksanen J, Blanchet FG, Kindt R, Legendre P, Minchin PR, O'Hara RB, Simpson GL, Solymos P, Stevens MHH, Wagner H. 2013. vegan: Community Ecology Package. [Google Scholar]
- 34.Anderson MJ. 2001. A new method for non-parametric multivariate analysis of variance. Austral Ecol. 26:32–46. 10.1111/j.1442-9993.2001.01070.pp.x. [DOI] [Google Scholar]
- 35.Lozupone C, Lladser ME, Knights D, Stombaugh J, Knight R. 2011. UniFrac: an effective distance metric for microbial community comparison. ISME J. 5:169–172. 10.1038/ismej.2010.133. [DOI] [PMC free article] [PubMed] [Google Scholar]
- 36.Michener C. 1974. The social behavior of the bees. Belknap, Cambridge, MA. [Google Scholar]
- 37.Seeley TD. 1985. Honeybee ecology: a study of adaptation in social life. Princeton University Press, Princeton, NJ. [Google Scholar]
- 38.Tannock GW, Fuller R, Smith SL, Hall MA. 1990. Plasmid profiling of members of the family Enterobacteriaceae, Lactobacilli, and Bifidobacteria to study the transmission of bacteria from mother to infant. J. Clin. Microbiol. 28:1225–1228. [DOI] [PMC free article] [PubMed] [Google Scholar]
- 39.Anderson KE, Sheehan TH, Mott BM, Maes P, Snyder L, Schwan MR, Walton A, Jones BM, Corby-Harris V. 2013. Microbial ecology of the hive and pollination landscape: bacterial associates from floral nectar, the alimentary tract and stored food of honey bees (Apis mellifera). PLoS One 8:e83125. 10.1371/journal.pone.0083125. [DOI] [PMC free article] [PubMed] [Google Scholar]
- 40.McFrederick QS, Cannone JJ, Gutell RR, Kellner K, Plowes RM, Mueller UG. 2013. Host specificity between Hymenoptera and lactobacilli is the exception rather than the rule. Appl. Environ. Microbiol. 6:1803–1812. 10.1128/AEM.03681-12. [DOI] [PMC free article] [PubMed] [Google Scholar]
- 41.Neveling DP, Endo A, Dicks LMT. 2012. Fructophilic Lactobacillus kunkeei and Lactobacillus brevis isolated from fresh flowers, bees and bee-hives. Curr. Microbiol. 65:507–515. 10.1007/s00284-012-0186-4. [DOI] [PubMed] [Google Scholar]
- 42.Ugelvig LV, Cremer S. 2007. Social prophylaxis: group interaction promotes collective immunity in ant colonies. Curr. Biol. 17:1967–1971. 10.1016/j.cub.2007.10.029. [DOI] [PubMed] [Google Scholar]
- 43.Cremer S, Sixt M. 2009. Analogies in the evolution of individual and social immunity. Philos. Trans. R. Soc. Lond. B Biol. Sci. 364:129–142. 10.1098/rstb.2008.0166. [DOI] [PMC free article] [PubMed] [Google Scholar]
- 44.Evans JD, Spivak M. 2010. Socialized medicine: individual and communal disease barriers in honey bees. J. Invertebr. Pathol. 103(Suppl):S62–S72. 10.1016/j.jip.2009.06.019. [DOI] [PubMed] [Google Scholar]
- 45.Hughes WOH, Eilenberg J, Boomsma JJ. 2002. Trade-offs in group living: transmission and disease resistance in leaf-cutting ants. Proc. Biol. Sci. 269:1811–1819. 10.1098/rspb.2002.2113. [DOI] [PMC free article] [PubMed] [Google Scholar]
- 46.Hamilton C, Lejeune BT, Rosengaus RB. 2011. Trophallaxis and prophylaxis: social immunity in the carpenter ant Camponotus pennsylvanicus. Biol. Lett. 7:89–92. 10.1098/rsbl.2010.0466. [DOI] [PMC free article] [PubMed] [Google Scholar]
- 47.Traniello JFA, Rosengaus RB, Savoie K. 2002. The development of immunity in a social insect: evidence for the group facilitation of disease resistance. Proc. Natl. Acad. Sci. U. S. A. 99:6838–6842. 10.1073/pnas.102176599. [DOI] [PMC free article] [PubMed] [Google Scholar]
- 48.Vásquez A, Forsgren E, Fries I, Paxton RJ, Flaberg E, Szekely L, Olofsson TC. 2012. Symbionts as major modulators of insect health: lactic acid bacteria and honeybees. PLoS One 7:e33188. 10.1371/journal.pone.0033188. [DOI] [PMC free article] [PubMed] [Google Scholar]
Associated Data
This section collects any data citations, data availability statements, or supplementary materials included in this article.