

Abstract
In this study, global intra- and extracellular metabolic profiles were exploited to investigate the impact of antibiotic compounds with different cellular targets on the metabolome of Staphylococcus aureus HG001. Primary metabolism was largely covered, yet uncommon staphylococcal metabolites were detected in the cytosol of S. aureus, including sedoheptulose-1,7-bisphosphate and the UDP-MurNAc-pentapeptide with an alanine-seryl residue. By comparing the metabolic profiles of unstressed and stressed staphylococcal cells in a time-dependent manner, we found far-ranging effects within the metabolome. For each antibiotic compound, accumulation as well as depletion of metabolites was detected, often comprising whole biosynthetic pathways, such as central carbon and amino acid metabolism and peptidoglycan, purine, and pyrimidine synthesis. Ciprofloxacin altered the pool of (deoxy)nucleotides as well as peptidoglycan precursors, thus linking stalled DNA and cell wall synthesis. Erythromycin tended to increase the amounts of intermediates of the pentose phosphate pathway and lysine. Fosfomycin inhibited the first enzymatic step of peptidoglycan synthesis, which was followed by decreased levels of peptidoglycan precursors but enhanced levels of substrates such as UDP-GlcNAc and alanine-alanine. In contrast, vancomycin and ampicillin inhibited the last stage of peptidoglycan construction on the outer cell surface. As a result, the amounts of UDP-MurNAc-peptides drastically increased, resulting in morphological alterations in the septal region and in an overall decrease in central metabolite levels. Moreover, each antibiotic affected intracellular levels of tricarboxylic acid cycle intermediates.
INTRODUCTION
As a facultative pathogenic bacterium, Staphylococcus aureus can cause various infectious diseases, ranging from skin and soft tissue infections up to systemic infections. Resistance genes against nearly all antibiotic agents can be found widespread in clinical isolates, complicating therapeutic treatment of infections caused by this bacterium. Moreover, multiresistant isolates drastically impede the medical control of such life-threatening infections. Thus, the demand for new antibacterial compounds is urgent, and more effort needs to be made toward finding promising natural products with antimicrobial activity (1, 2).
On the other hand, basic cellular processes and adaptive mechanisms within the bacterial metabolism need to be elucidated in more detail. Several transcriptomic and proteomic studies have been carried out to monitor the implications of antibiotics for staphylococcal physiology (3–9). However, the understanding of many bacterial responses and regulatory processes still remains incomplete. Alterations within the metabolic pool represent the definite physiological status of the bacterium as the result of the adaptive cascades comprising both the transcriptome and proteome levels. Moreover, metabolites with regulatory and signaling functions act as important links between the metabolome, gene transcription, and protein biosynthesis. Thus, studying the global metabolic response of the bacterium to a given antibiotic stress should contribute to a better understanding of staphylococcal physiology. So far, no extensive and comparative metabolomic study has been carried out to tackle the impacts of various antibiotic compounds on the metabolite pool of S. aureus. In this study, we used an established workflow to analyze the alterations of intracellular and extracellular metabolites of S. aureus HG001 after exposure to different antibacterial compounds. To cover a broad range of metabolic responses, S. aureus was exposed to five commonly used antimicrobials with distinct but typical target structures within the bacterial metabolism.
The fluoroquinolone ciprofloxacin traps the DNA gyrase and topoisomerase IV, thereby blocking the replication fork, inhibiting DNA replication and transcription, and leading to DNA double-strand breaks (10). In S. aureus, the enzyme topoisomerase IV is more sensitive than gyrase to fluoroquinolones (11).
Erythromycin is a macrolide binding to the 23S rRNA of the large subunit of bacterial ribosomes. When bound to the ribosome, erythromycin sterically blocks the entrance to the tunnel at the entry site through which nascent peptide chains exit the ribosome, leading to the dissociation of peptidyl-tRNAs from the ribosome (12, 13). Erythromycin is able to inhibit protein synthesis at the early stage of nascent peptide chains when peptides have not grown beyond a critical length (12–14). As a consequence, elongating polysomes have only a low affinity for this antibiotic compound (12, 14).
Peptidoglycan (PG) is a major constituent of the bacterial cell wall and the most important target for antibiotic compounds. Fosfomycin inhibits the initial cytoplasmic step of cell wall synthesis. As a substrate analogue of phosphoenolpyruvate, fosfomycin irreversibly binds to the catalytic site of the UDP-N-acetylglucosamine-3-enolpyruvyl-transferase (MurA and homologues) (15). The drug enters the bacterial cell via the glycerophosphate transport system GlpT, the inducible hexose-phosphate uptake system Uhp, and a transporter that is so far unknown (15). Vancomycin and ampicillin both target the latest stage of peptidoglycan synthesis, which involves the polymerization and incorporation of the newly synthesized PG building block into the growing cell wall polymer on the extracellular side of bacterial cells. After flipping of lipid II to the outside of the bacterial membrane, penicillin-binding proteins (PBPs) catalyze transglycosylation reactions of the disaccharide units MurNAc-GlcNAc. Afterwards, PBPs with transpeptidase function cross-link PG strands by forming interpeptide bridges between the d-Ala-d-Ala residues of peptide chains and the pentaglycine residues (for a review, see reference 16). In S. aureus, de novo cell wall synthesis occurs mainly at the cell division site (septal region) (17). The glycopeptide vancomycin binds to d-Ala-d-Ala residues of lipid II or PG molecules, thereby sterically hindering PBPs and leading to inhibition of transglycosylation and transpeptidation reactions (18, 19). The beta-lactam antibiotic ampicillin binds to the transpeptidase active domain of PBPs by mimicking the d-Ala-d-Ala residue of the PG pentapeptide (for a review, see reference 20). As a result, transpeptidation of PG molecules is inhibited, but transglycosylation can still proceed as shown for Escherichia coli (21). Since the targets for both antibiotics are localized outside bacterial cells, the compounds do not have to cross the cytoplasmic membrane to take effect.
The aim of the present study was to explore the impacts of these different antibiotic compounds on the metabolome of S. aureus. To this end, we classified altered metabolite amounts into metabolic pathways, and we searched for overlapping and unique metabolic responses to the different antibiotic compounds.
MATERIALS AND METHODS
Bacterial strain and growth conditions.
S. aureus HG001 (22) was grown in RPMI 1640 R7509 medium (Sigma-Aldrich) with vigorous agitation at 37°C as previously described (23). This chemically defined medium is suitable for exometabolome analysis and enables reproducible growth of S. aureus HG001 (23). The main culture was inoculated with an exponentially growing overnight culture at an initial optical density at 500 nm (OD500) of 0.06. At an OD of 0.5, bacterial cells were treated with either 1.0 mg/liter (4× MIC) ciprofloxacin (Fluka), 5.0 mg/liter (2× MIC) erythromycin (Sigma-Aldrich), 60.0 mg/liter (2× MIC) fosfomycin (Sigma), 0.15 mg/liter (1× MIC) ampicillin (Sigma), or 8.2 mg/liter (4× MIC) vancomycin (Sigma), causing an enduring reduction in growth. For the control, bacterial cells were cultivated without antibiotics. For extra- and intracellular metabolome analyses, samples were taken directly after antibiotic treatment (t0) and 10, 20, 30, 60, and 120 min later. The OD was measured at every sampling time point. Cultivation was carried out in quintuplicate to obtain 5 independent biological replicates. The MIC of each antibiotic compound was determined for S. aureus HG001 cultivated in RPMI medium by the broth dilution technique according to the recommendations of the CLSI (24).
Preparation of extracellular metabolites.
At every sampling time point, 2 ml cell suspension was filtered on ice, using a 0.45-μm-pore-size filter (Sarstedt AG), to obtain sterile extracellular metabolite samples of the bacterial culture. All filtrates were stored at −20°C before measurement.
1H-NMR spectroscopic analysis of extracellular metabolites.
1H nuclear magnetic resonance (1H-NMR) analysis was done as previously described (23). Briefly, 400 μl culture supernatant was mixed with 200 μl buffer solution containing the internal standard TSP (3-trimethylsilyl-[2,2,3,3-D4]-1-propionic acid) (Sigma-Aldrich). All NMR spectra were obtained at 600.27 MHz at a temperature of 310 K, using a Bruker Avance-II 600 NMR spectrometer operated by TOPSPIN 2.1 software (Bruker Biospin GmbH). Spectral referencing was done relative to the TSP signal. Data analysis (identification and quantification) was done using AMIX v3.9.11 software (Bruker Biospin GmbH) as previously described (23).
Preparation of intracellular metabolite extracts.
At every sampling time point, 15 OD units, equivalent to 2.4 mg cell dry weight (CDW), of bacterial culture was sampled by using the vacuum-dependent fast-filtration approach modified according to the method of Meyer et al. (25). Briefly, 15 OD units of the cell culture broth was separated from the supernatant by fast filtration and washed with 50 ml ice-cold isotonic NaCl solution. The filter holding the bacterial cells was immediately transferred to a tube filled with 5 ml ice-cold extraction solution (60% ethanol [wt/vol]) and quick-frozen in liquid nitrogen. Completely frozen samples were stored at −80°C. Every following step was carried out on ice. For mechanical cell disruption, bacterial cells were washed off the filter by using the extraction solution and vortexing. Resuspended cells were transferred into a 50-ml tube containing glass beads with a 0.10- to 0.11-mm diameter (Sartorius AG). After adding the internal standards for liquid chromatography-mass spectrometry (LC-MS) analysis (5 nmol camphorsulfonic acid) and gas chromatography-MS (GC-MS) analysis (40 nmol each of ribitol, norvaline, N,N-dimethyl-phenylalanine, and p-chloro-phenylalanine-hydroxide), cell disruption was performed by using a FastPrep-24 instrument (MP Biomedicals, LLC) twice for 40 s each at 6.0 m/s. Ethanolic cell extracts were transferred to 15-ml tubes. Cell debris was washed with 5 ml ultrapure water as a second extraction step. Aqueous and ethanolic cell extracts were combined. After centrifugation for 5 min at 4°C and 10,015 × g, the supernatant was split into two tubes for subsequent analyses of intracellular metabolites via GC-MS and LC-MS and stored at −80°C for lyophilization. Four blank samples were obtained by using the same protocol, starting with the washing step, on a blank filter without adding bacterial cells.
GC-MS analysis of intracellular metabolites.
Lyophilized extracts and blank samples were derivatized first with 40 μl methoxyamine (20 mg/ml pyridine) for 90 min at 37°C and second with 80 μl N-methyl-N-trimethylsilyltrifluoroacetamide (Chromatographie-Service GmbH) for 30 min at 37°C. Samples were centrifuged for 5 min at 25°C and 17,900 × g before injection. GC-MS analysis was performed by using an Agilent 6890N GC system with an autosampler (model G2614A), an injector (model G2613A), and a coupled mass selective detector (model 5973N MSD) (Agilent). GC-MS parameters were used as follows: the 2-μl injection volume was split 1:10 at 250°C, using helium as the carrier gas, with an inlet split flow of 10 ml/min and a pressure of 8.8 lb/in2. Chromatographic separation on a 30-m DB5-ms column (Agilent Technologies) with a 0.25-mm inner diameter and a 2.5-μm film thickness was performed with a constant gas flow of 1 ml/min. The oven program started with an initial temperature hold at 70°C for 1 min and continued with a heating rate of 1.5°C/min up to 76°C, 5°C/min up to 220°C, and 20°C/min up to 330°C, with a hold for 3 min. Analytes were transferred to the mass selective detector via the transfer line at 280°C and ionized by electron impact ionization at 230°C. After a solvent delay of 6 min, mass spectra were acquired within a mass range of 50 to 500 atomic mass units, using a quadrupole temperature of 150°C and scan acquisition mode.
GC-MS data analysis.
Metabolite identification was verified by matching the retention times and fragmentation patterns of detected peaks to those of analytical standard compounds measured within the same batch. By using AMDIS v2.69 (NIST), MATLAB R2012b (8.0.0.783) (MathWorks, Inc.), and the MatLab script GAVIN (26), the area of the quantifier ion (uniquely for each metabolite at the specific retention time) of each metabolite was integrated and normalized to the area of the quantifier ion of the internal standard. This ratio represents the relative metabolite amount per 7.5 OD units (equivalent to the relative metabolite amount per 1.2 mg CDW). Metabolites detected in blank samples were excluded from the data analysis of biological samples.
LC-MS analysis of intracellular metabolites.
Lyophilized extracts and blank samples were dissolved in 100 μl ultrapure water and centrifuged for 5 min at 4°C and 17,900 × g. Ion-pairing high-pressure liquid chromatography-MS (HPLC-MS) analysis was performed by using an Agilent 1100 series liquid chromatographic system, consisting of a degasser, a quaternary pump, and a manual injector coupled to a micro-time of flight (microTOF) mass spectrometer (Bruker Daltonics). A 25-μl sample was injected for chromatographic separation on a SecurityGuard cartridge C18 precolumn (3.0 × 4 mm) (Phenomenex) attached to a SymmetryShield RP18 column (4.6 mm × 150 mm × 3.5 μm) (Waters). Mobile phases were A (95% H2O, 10 mM tributylamine as the ion-pairing reagent, 15 mM acetic acid, 5% methanol, pH 4.9) and B (100% methanol). With a flow rate of 0.4 ml/min and the LC system conditioned to 100% A, the elution gradient started with 0 to 31% B in 2 min and continued with 31 to 50% B in 18.5 min, 50 to 60% B in 2.5 min, 60 to 100% B in 1 min, 100% B for 7 min, 0 to 100% A in 1 min, and 100% A for 10 min. MS analysis was performed using electrospray ionization and negative-ion polarity. Full scan mode was used over the mass range of 50 to 3,000 m/z. MS calibration was done by using 16 different masses, ranging from 112.98 to 1,132.79 m/z, from a sodium formate solution (49.4% H2O, 49.4% isopropanol, 0.2% formic acid, and 10 mM NaOH) as the tune mix. Additionally, the internal calibration tune mix was injected at the beginning of each chromatographic run.
LC-MS data analysis.
Metabolite identification was verified by matching the retention times and m/z values of detected peaks to those of analytical standard compounds measured within the same batch. If no standard compound was available, identification was done by database alignment of the calculated exact mass. The area of m/z of [M − H]− or [M − 2H]2− of each metabolite was integrated and normalized to the integral of the area of m/z of [M − H]− of the internal standard by using QuantAnalysis v1.8 (Bruker Daltonik GmbH), resulting in the relative metabolite amount per 7.5 OD units (equivalent to the relative metabolite amount per 1.2 mg CDW). For absolute quantification, the ratio (area for metabolite/area for internal standard) was plugged into the calibration equation for the respective metabolite. Calibration curves were calculated for each metabolite separately, ranging from 0.001 to 0.5 mM, based on 11 calibration points, with 1/x weighting using a quadratic calibration mode. Masses detected in blank samples were excluded from the data analysis of biological samples.
Calculation of AEC.
Absolute concentrations (nmol/mg CDW) of AMP, ADP, and ATP were used to calculate the adenylate energy charge (AEC) of each biological sample according to the method of Atkinson (27).
Visualization and statistical analysis.
For visualization of the exometabolome data, the difference in concentration of each metabolite relative to that at t0 was calculated and normalized to the OD of the bacterial suspension at the respective sampling time. The statistical significance of the mean value for 5 biological replicates was calculated by the unpaired t test, with P values of ≤0.01 indicating significance, by using VANTED v2.01 (28). For exclusion of growth phase-related intracellular metabolite changes, fold changes (FC) of all relative metabolite amounts at every sampling time point (t10, t20, t30, t60, and t120) divided by the corresponding metabolite amount at time point zero were calculated for untreated and stressed cells. Statistically significant differences in metabolite FC between stressed and untreated cells for 5 biological replicates were calculated by the unpaired t test, with P values of ≤0.01 indicating significance, by using Microsoft Excel 2007 and VANTED v2.01 (28). For FC calculation, missing values were replaced with half the value of the minimum positive values in the original data, assumed to be the detection limit. Color-coded heat maps of metabolite FC for stressed cells divided by the corresponding metabolite FC for untreated cells were created using MeV v4.8.1 (29).
Transmission electron microscopy.
Cell preparation of S. aureus for transmission electron microscopy was modeled after the method of Hammerschmidt et al. (30). Briefly, cells were fixed first with 2.5% glutaraldehyde and 2% paraformaldehyde in cacodylate buffer (0.1 M cacodylate, 10 mM CaCl2, 10 mM MgCl2, 0.09 M sucrose, 25 mM NaN3; pH 7.0) containing 0.075% ruthenium red and 0.075 M lysine-acetate for 20 min on ice. After washing steps with cacodylate buffer containing 0.075% ruthenium red, cells were fixed a second time with 2.5% glutaraldehyde and 2% paraformaldehyde in cacodylate buffer with 0.075% ruthenium red at 4°C overnight. Subsequent to being embedded in low-gelling agarose, cells were postfixed in 2% osmium tetroxide in cacodylate buffer with 0.075% ruthenium red for 2 h at 4°C. After dehydration in a graded series of ethanol (20%, 30%, and 50% for 10 min each step; 70% ethanol with 0.5% uranyl acetate for 30 min; and then 90%, 96%, and 100% ethanol), the material was embedded in Agar 100 resin. Sections were cut on an ultramicrotome (Reichert Ultracut; Leica UK Ltd., Milton Keynes, United Kingdom), stained with 4% aqueous uranyl acetate for 5 min followed by lead citrate for 1 min, and analyzed with a Leo 906 transmission electron microscope (Zeiss, Oberkochen, Germany).
RESULTS AND DISCUSSION
Extra- and intracellular metabolic profiles of Staphylococcus aureus.
For the analysis of the metabolic responses of S. aureus HG001 to different antibiotics, bacterial cells were exposed to drugs during exponential growth phase (OD of 0.5). Within a time frame of 2 h after exposure to antibiotics, samples for the extra- and intracellular metabolome analyses were taken. To observe fast and time-resolved alterations in the metabolic pool, sampling started directly (t0) and continued 10, 20, 30, 60, and 120 min after addition of antibiotics. For the control, untreated cells were sampled at the same time points, starting with t0, at an OD of 0.5 (see Fig. S1 in the supplemental material).
By using 1H-NMR spectroscopy, 38 extracellular metabolites were detected, among which 34 metabolites were identified and absolutely quantified (see Table S1 in the supplemental material). For the analysis of intracellular metabolites, LC-MS and GC-MS analyses were performed to cover a broad range of the chemically diverse metabolic compounds of bacterial cells. By combining the results of both techniques, 176 metabolites were analyzed (see Table S2). Identification of 118 metabolites was verified by use of analytical standard compounds. Twenty-one metabolites were identified by database alignment of the measured masses, and 37 metabolites are still unidentifiable (see Tables S3 to S5). Potential functions of several unknown metabolites are described in detail in the supplemental material. Altogether, the 139 identified intracellular compounds cover many metabolic pathways, including glycolysis/gluconeogenesis, the tricarboxylic acid cycle (TCC), the pentose phosphate pathway (PPP), amino acid metabolism, purine metabolism, pyrimidine metabolism, amino sugar and nucleotide sugar metabolism, cell wall synthesis, including peptidoglycan (PG) and teichoic acid (TA) synthesis, fatty acid biosynthesis, and cofactor metabolism, providing a global view of the metabolic profile of S. aureus.
Additionally, at the sampling time point t120, control and stressed cells were examined by transmission electron microscopy. Thus, morphological variations of staphylococcal cells exposed to certain antibiotics were observed which may be linked to alterations within the metabolome.
Adenylate energy charge.
The adenylate energy charge (AEC) was calculated for each biological sample. For intact metabolizing cells, the AEC is kept within the physiological range of >0.85 (31). In this study, the AEC was higher than 0.9 for staphylococcal cells under control conditions during the whole experiment (Fig. 1). This was also true for cells stressed with ciprofloxacin, erythromycin, fosfomycin, and ampicillin. A drastic drop in the AEC was detected for cells exposed to vancomycin. Within the first 30 min, the AEC was still above 0.85. After 60 and 120 min, the AEC was between 0.5 and 0.8 (Fig. 1). Within this range, bacterial cells are still viable (31), as confirmed by dynamic changes of intra- and extracellular metabolites which were still detectable 120 min after vancomycin treatment. However, since many intracellular metabolites were drastically decreased or were even absent after 60 and 120 min of vancomycin stress, only metabolic changes within the first 30 min after vancomycin treatment were taken into account for data interpretation.
FIG 1.

Adenylate energy charges of untreated cells (black) and cells exposed to ciprofloxacin (cip; red), erythromycin (ery; green), fosfomycin (fos; purple), vancomycin (van; blue), and ampicillin (amp; orange). The AEC was calculated using the intracellular amounts of ATP, ADP, and AMP (nmol/mg cell dry weight). Data are shown as mean values ± standard deviations (SD) for quintuplicate samples.
Impact of antibiotics on the metabolome of S. aureus HG001.
In general, within the time frame of 120 min, dynamic changes of intracellular metabolites were also detected under control conditions. Thus, two kinds of metabolic changes were observable: (i) growth phase-dependent metabolic alterations (similar to those in control cells) and (ii) antibiotic stress-dependent alterations. To exclude growth phase-related intracellular metabolite changes, fold changes (FC) were calculated by dividing all relative metabolite concentrations at all sampling time points (t10, t20, t30, t60, and t120) by the corresponding relative metabolite concentrations at time point zero, separately for untreated and treated cells. Next, the FC of every metabolite of stressed cells was referred to the respective FC of untreated cells (see Table S2 in the supplemental material). By doing so, differences in the intracellular metabolic profiles solely induced by the antibiotic stress were taken into account. In Fig. 2, the sums of all significantly (P ≤ 0.01) increased and decreased metabolites are displayed according to their metabolic pathway under each antibiotic stress.
FIG 2.

(A) Table showing numbers of intracellular metabolites with significantly (P ≤ 0.01) enhanced and decreased fold changes (FC stress compared to FC control) within 120 min of antibiotic treatment and within 30 min of vancomycin treatment. Data are based on mean values for quintuplicate samples. (B) Bar chart displaying significantly altered metabolite numbers from panel A sorted by the respective metabolic pathways. Columns are colored according to the antibiotic stress: red, ciprofloxacin; green, erythromycin; purple, fosfomycin; blue, vancomycin; and orange, ampicillin. PPP, pentose phosphate pathway; TCC, tricarboxylic acid cycle, (N-/UDP-) sugars, amino sugars/UDP-activated sugars; CW, cell wall.
Due to various growth rates of the stressed staphylococcal cells, alterations in the exometabolome were determined by calculating the difference in quantities for each time point relative to t0, followed by a normalization to the optical density measured at the respective sampling time (see Table S1 in the supplemental material).
Hereby, global metabolic profiles of S. aureus were obtained, showing that the staphylococcal response to each antibiotic stress is widely spread over the metabolome. Antibiotic compounds with different modes of action affected metabolic pathways in an overlapping manner. Moreover, single metabolites either uniquely altered in amount by a specific drug or affected by every antibiotic were detected. In the following sections, only significant (P ≤ 0.01) changes of intra- and extracellular metabolite abundances are discussed; otherwise, the respective P value is quoted.
Ciprofloxacin-dependent metabolic alterations.
After exposure to ciprofloxacin, the levels of 56 intracellular metabolites were significantly altered compared to those under control conditions. These included 52 increased and 4 decreased metabolite abundances; thereby, ciprofloxacin induced the largest number of enhanced metabolite abundances compared to the other antibiotic stresses (Fig. 2A). Considering the central carbon metabolism, significantly enhanced levels of the TCC metabolites citrate, isocitrate, and 2-oxoglutarate were determined. In contrast, the amount of the glycolytic intermediate 1,3-bisphosphoglycerate significantly decreased (Fig. 3). Intracellular amounts of many amino acids were enhanced 60 min after ciprofloxacin treatment (Fig. 4A). Among them, the levels of methionine, glutamine, N-acetylglutamine, and glutamate were significantly increased. Under ciprofloxacin stress, both purine and pyrimidine metabolic pathways were the most affected pathways. In total, 20 (deoxy)nucleotides, their corresponding nucleosides, and precursors such as CAIR and XMP were detected in significantly enhanced amounts (Fig. 4C). Several metabolites were detectable solely under this stress: dGMP, dCMP, 2-deoxycytidine, and thymidine. GlcN-P/GalN-P was also detectable only in cells stressed with ciprofloxacin (see Table S2 in the supplemental material). The soluble PG precursors, starting with UDP-MurNAc, were strongly increased in quantity, as well as the soluble TA precursors CDP-ribitol and CDP-glycerol (Fig. 4B). The latter showed the highest abundances under ciprofloxacin treatment compared to other antibiotic treatments. In line with this finding, the amount of ribulose-5-P as a precursor of CDP-ribitol increased (P = 0.024). The level of the redox equivalent NADP+ was increased after 120 min (see Table S2). Moreover, we detected 14 unknown metabolites whose abundances were significantly altered in cells exposed to ciprofloxacin. Among them, the most drastic effects were detected for unknown2_LCMS and unknown15_LCMS, and unknown2_LCMS was solely detected in cells treated with ciprofloxacin (see Fig. S2).
FIG 3.

Central carbon metabolism, including glycolysis, the pentose phosphate pathway, and the tricarboxylic acid cycle. Significantly enhanced or decreased FC of intracellular metabolite amounts are marked with up or down arrows (P ≤ 0.01). Alterations within 120 min after antibiotic treatment with ciprofloxacin, erythromycin, fosfomycin, and ampicillin and within 30 min of vancomycin treatment were taken into account. Data are based on mean values for quintuplicate samples. The arrows are colored according to the antibiotic stress: red, ciprofloxacin; green, erythromycin; blue, vancomycin; orange, ampicillin; and purple, fosfomycin. Metabolite abbreviations: glc, glucose; frc, fructose; sed, sedoheptulose; ery, erythrose; pg, phosphoglycerate; dhap, dihydroxyacetone phosphate; ga-3p, glyceraldehyde 3-phosphate; 1,3-bpg, 1,3-bisphosphoglycerate; pep, phosphoenolpyruvate; pyr, pyruvate; ac-CoA, acetyl-coenzyme A; cit, citrate; acn, aconitate; isocit, isocitrate; 2-og, 2-oxoglutarate; succ-CoA, succinyl-coenzyme A; succ, succinate; fum, fumarate; mal, malate; gl-6p, 6-phosphogluconate; ru-5p, ribulose 5-phosphate; r-5p, ribose 5-phosphate; xu-5p, xylulose 5-phosphate; prpp, phosphoribosylpyrophosphate; r-1,5bp, ribose 1,5-bisphosphate.
FIG 4.

Color-coded heat maps displaying FC of intracellular metabolite amounts in antibiotic-stressed S. aureus cells relative to the FC of metabolite amounts of control cells, calculated for every sampling point after exposure to the antibiotic stress. For vancomycin-stressed cells, only metabolite changes within 30 min after treatment are displayed. Lowered metabolite levels in stressed cells compared to control cells are indicated by blue areas. Raised metabolite levels in stressed cells compared to control cells are indicated by orange areas. Similar metabolite levels in stressed and control cells are indicated in black, indicating an FC of 1. Data are shown as mean values for quintuplicate samples. (A) FC of amino acids; (B) FC of cell wall precursors; (C) FC of intermediates of purine and pyrimidine metabolism. Names of metabolites are written out in full in Table S7 in the supplemental material.
In studying the extracellular metabolic profile of staphylococcal cells exposed to ciprofloxacin, differences from control conditions were detected only for glutamate and isovalerate, which accumulated in significantly smaller amounts (Fig. 5).
FIG 5.

Uptake and accumulation of selected extracellular metabolites at t30 and t120 under control conditions and after addition of antibiotic compounds. The values displayed are the differences in concentrations of each metabolite relative to those at t0 and normalized to the OD of the bacterial suspension at the respective sampling time. Columns are colored according to the antibiotic stress, as follows: gray, control; red, ciprofloxacin; green, erythromycin; purple, fosfomycin; blue, vancomycin; and orange, ampicillin. Data are shown as mean values ± SD for quintuplicate samples. Statistical differences between control and stress conditions were considered significant (*) for P values of ≤0.01.
Ciprofloxacin is known to induce the bacterial SOS response (32), which functions as a DNA repair mechanism. Cirz and coworkers investigated the general and SOS responses of S. aureus NCTC8325 to ciprofloxacin on the transcriptomic level (5). They observed a downregulation of metabolism, including purine and pyrimidine biosynthesis. In contrast, transcription of TCC enzymes was upregulated, as well as transcription of ribonucleotide reductases and genes involved in DNA repair mechanisms. This fits well with the metabolic alterations detected in this study, as enhanced transcription of ribonucleotide reductases in combination with RecA and LexA activities and DNA repair mechanisms induced by ciprofloxacin results in an overall increase of nucleotides and nucleosides, except for adenosine nucleotides. The accumulation of the deoxyribonucleosides 2-deoxycytidine, 2-deoxyuridine, and thymidine points to a stop in further degradation. This is also in line with the decreased gene expression of purine nucleoside phosphorylase under ciprofloxacin stress (5), since this enzyme is responsible for the degradation of nucleosides. A higher level of the alarmone ppGpp was detected, pointing to induced stringent control under ciprofloxacin stress. But since ppGpp was also detected in untreated cells, the stringent response was more likely induced by a growth phase-specific event that is discussed in more detail in the supplemental material. Increased levels of amino acids, such as glutamine, glutamate, and methionine, and of the redox equivalent NADP+ may also result from the downregulation of the main parts of metabolism. The nitrogen donors glutamine and glutamate are less important if biosynthesis of purines and pyrimidines is stalled. Increased amounts of NADP+ may be due to a downregulated PPP, which provides NADPH. Methionine is involved in many anabolic reactions, such as protein biosynthesis, N-formylmethionine formation, and S-adenosylmethionine synthesis. Several TCC intermediates showed increased amounts, most probably due to low TCC activity. Although Cirz and coworkers found induced TCC gene expression under ciprofloxacin stress (5), in our study extracellular glucose was still present in large amounts (>5 mM) after 120 min of antibiotic treatment. Thus, expression of TCC genes was probably repressed by CcpA (33). Interestingly, in this study, precursors of the bacterial cell wall drastically increased in abundance, pointing to a metabolic signature induced by ciprofloxacin stress. A similar connection was observed for Streptococcus faecalis, in which the cell division process is supposed to be related to DNA synthesis, leading to a block in septum formation and a more thickened cell wall when DNA and RNA synthesis is inhibited (34). However, no morphological changes of the cell wall or septum formation of ciprofloxacin-stressed staphylococcal cells was detected in this study (data not shown).
Erythromycin-dependent metabolic alterations.
After exposure to erythromycin, the levels of 38 intracellular metabolites were significantly altered compared to those under control conditions. These included 23 increased and 15 decreased metabolite abundances (Fig. 2A). Significantly enhanced amounts were detected for 2-oxoglutarate and intermediates of the PPP, such as glucose-6-P, 6-phosphogluconate, sedoheptulose-1,7-bisphosphate, and 5-phosphoribosyl 1-pyrophosphate (PRPP) (Fig. 3). The uncommon metabolite sedoheptulose-1,7-bisphosphate is described in detail in the supplemental material. A significant increase in the amount of lysine was detected which was solely observed for cells exposed to erythromycin. Other amino acids, such as homoserine, aspartate, and d-isoleucine, were detected in significantly decreased amounts (Fig. 4A). Intracellular levels of intermediates of purine synthesis, such as ribosylamine-5-P, SAICAR, and AICAR, were significantly increased. Regarding pyrimidine metabolism, dUMP and 2-deoxyuridine were significantly more abundant, as well as CTP (P = 0.018) (Fig. 4C). PG synthesis was also affected, since the intracellular level of UDP-MurNAc was significantly enhanced, whereas the amounts of all subsequent UDP-MurNAc-peptides and alanine-alanine were significantly smaller (Fig. 4B). The intracellular levels of several unknown metabolites were also affected by erythromycin, including unknown24_LCMS and unknown26_LCMS (see Fig. S2 in the supplemental material).
To characterize the extracellular metabolic profile, significantly less glucose was taken up, followed by smaller amounts of secreted acetate and acetoin (P = 0.014). In contrast, larger amounts of 2-oxoglutarate and fumarate were secreted. Among the amino acids present in the cultivation medium, valine, leucine (P = 0.037), isoleucine, methionine, phenylalanine, and tyrosine were taken up in significantly smaller amounts by the bacterial cells exposed to erythromycin. This was accompanied by less secreted isovalerate (Fig. 5).
Blocked protein biosynthesis by erythromycin resulted in less uptake of amino acids from the medium, including that of branched-chain amino acids, which represent, with lysine, the most abundant amino acids in proteins of S. aureus HG001. Reduced uptake of isoleucine was accompanied by smaller amounts of d-isoleucine in the cytosol. Although the uptake of lysine was not enhanced, its intracellular amount significantly increased, and this was detected uniquely for this antibiotic stress. The intracellular amount of threonine was also enhanced (P = 0.047). Either lysine or threonine can be synthesized from the precursors aspartate and homoserine. Interestingly, the amounts of both metabolites significantly decreased. A strong accumulation of lysine was also detected in glucose-starved S. aureus COL cells (35).
In this study, lysine accumulation could be associated with altered amounts of PG precursors, for which lysine is needed as a part of the peptide chain. Interestingly, the enzyme MurE (UDP-N-acetylmuramoyl-l-alanyl-d-glutamate-l-lysine ligase) is less specific for lysine, therefore requiring higher concentrations of this amino acid in the cytosol (36). Moreover, Lys-tRNA is used to modify phosphatidylglycerol to lysyl-phosphatidylglycerol in the bacterial membrane, thus introducing positive charges to the anionic phospholipids of the outer membrane layer (for a review, see reference 37). Thus, staphylococcal cells may tend to alter their surface properties. Interestingly, the uptake of aminoglycosides requires the proton motive force (PMF) (for a review, see reference 38), which also deals with the cytoplasmic membrane. In persister cells of Escherichia coli, the uptake of aminoglycosides was facilitated, and thus aminoglycoside activity was potentiated, by metabolites whose catabolism contributes to the PMF, as carried out by NADH-generating enzymes such as pyruvate dehydrogenase (39). Therefore, as a response to erythromycin, S. aureus cells might channel more glucose into the PPP instead of primarily oxidizing it via glycolysis. Thus, less NADH is generated, circumventing the stimulation of antibiotic uptake by respiratory chain-dependent oxidation of NADH involving the PMF (39). This assumption was strengthened by the reduced glucose uptake, lowered accumulation of overflow metabolites, and raised abundances of intracellular PPP intermediates as monitored in this study. The enhanced accumulation of TCC intermediates inside and outside staphylococcal cells points to a lowered TCC activity, as well as answering the purpose of reduced NADH generation. Besides the PPP, erythromycin also affected purine metabolism. This is reasonable, since the PPP provides PRPP as a precursor for purine synthesis. In support of this, the synthesis of several proteins, such as YqiI (putative 6-phosphogluconate dehydrogenase) and PurC (phosphoribosyl-aminoimidazole-succinocarboxamide synthase), was found to be induced in Bacillus subtilis under erythromycin stress (40).
Fosfomycin-dependent metabolic alterations.
After exposure to fosfomycin, the levels of 20 intracellular metabolites were significantly altered compared to those under control conditions. These included 8 increased and 12 decreased metabolite abundances (Fig. 2A). Regarding the central carbon metabolism, the TCC was affected by fosfomycin, since the amounts of citrate and isocitrate were significantly increased (Fig. 3). The pool of amino acids remained stable, except for the level of alanine, which was significantly lowered (Fig. 4A). Cell wall biosynthesis was the most affected pathway in staphylococcal cells exposed to fosfomycin. The precursors Glc-P/Gal-P/ManNAc-P, UDP-GlcNAc/UDP-GalNAc, and alanine-alanine were significantly increased. In contrast, all levels of PG intermediates, starting from UDP-GlcNAc-enolpyruvate, were significantly decreased. CTP and CDP-ribitol were also detected in significantly enhanced amounts (Fig. 4B and C). In fosfomycin-treated cells, the strongest increase in the level of GlcNAc-malate was detected compared to the case with other antibiotic stresses (see Table S2 in the supplemental material).
Considering the extracellular metabolic profile, larger amounts of glucose (P = 0.050), valine, and cystine were taken up, and more acetate was secreted, by S. aureus after exposure to fosfomycin (Fig. 5).
On the metabolic level, we detected an overall decrease of PG precursors, confirming that irreversible inhibition of the homologues MurA and MurZ by fosfomycin leads to a lowering of all subsequent products of this pathway. This is an interesting outcome, since in fosfomycin-treated staphylococcal cells, induced expression of the murZ, murD, mraY, pbp1, and pbp2 genes belonging to PG synthesis was observed (6), as well as rising abundances of MurZ (41). The accumulation of metabolic precursors of the PG intermediates, such as UDP-GlcNAc and alanine-alanine, was a further reasonable effect of inhibited PG synthesis. The formation of alanine-alanine most likely caused the lowered alanine level. No alteration in the amount of phosphoenolpyruvate as another substrate of MurA and MurZ was detected, which contradicts earlier assumptions for fosfomycin-exposed cells (6). TA synthesis was also affected by fosfomycin, since enhanced levels of CDP-ribitol were detected, in line with induced expression of the tagBDHX genes (6). The detected increases in the amounts of citrate and isocitrate may have been due to the downregulation of several TCC genes, such as citB, odhAB, and sucCD, as observed in another study (6).
The low-molecular-weight (LMW) thiol glutathione (GSH) is known to protect cells against toxins (for a review, see reference 42), and it can be taken up by S. aureus (43). While GSH biosynthesis is absent in S. aureus (44), GSH is a component of the RPMI medium used in this study. However, neither GSH nor glutathione disulfide was detected in the cytoplasm of S. aureus. In the culture supernatant, an initial glutathione concentration of 3.25 μM was faced by 330 μM fosfomycin, confirming that GSH was not able to inactivate fosfomycin in this study. Moreover, the multicopy nature of MurA and MurZ requires a higher concentration of fosfomycin, causing a higher MIC (41). Bacillithiol (BSH) is also an LMW thiol contributing to the detoxification of fosfomycin (45, 46), but the HG001 strain used here is a derivative of the NCTC8325 strain, which lacks BSH due to a disruption in the bshC gene, encoding a cysteine-adding enzyme responsible for the last step in BSH synthesis (47, 48). In this study, the biosynthetic intermediates of BSH, GlcNAc-malate and GlcN-malate, were detected in the cytoplasm of HG001 (see Table S2 in the supplemental material), which is in line with findings for strain NCTC8325-4 (48). Interestingly, the amount of GlcNAc-malate significantly increased in fosfomycin-treated cells simultaneously with increasing levels of UDP-GlcNAc, which serves as a precursor for all PG, TA, and also BSH biosyntheses. Considering that BSH is lacking in HG001, other LMW thiols of S. aureus, such as cysteine and coenzyme A (CoA), showed no altered amounts under fosfomycin stress.
Vancomycin-dependent metabolic alterations.
After 30 min of exposure to vancomycin, the levels of 92 intracellular metabolites were significantly altered compared to those under control conditions. These included 34 increased and 58 decreased metabolite abundances (Fig. 2A). Regarding the intermediates of glycolysis and PPP, most of them were significantly decreased in quantity, except for pyruvate, whose amount significantly increased immediately after vancomycin treatment (see Table S2 in the supplemental material). TCC metabolites, such as citrate and 2-oxoglutarate, were also detected in significantly enhanced amounts (Fig. 3). Within 20 min after vancomycin exposure, the levels of glycine, homoserine, glutamine, N-acetylglutamine, and 4-hydroxyproline were significantly raised. After 30 min of antibiotic treatment, many amino acids, such as threonine, glutamate, and cysteine, had decreased in quantity. In contrast, the amount of cystine drastically increased (Fig. 4A). All precursors of purine biosynthesis were significantly lowered, as well as cyclic di-AMP (c-di-AMP) and several pyrimidine derivatives. In contrast, the level of ATP was significantly raised directly after vancomycin stress, and the amounts of adenosine, GMP, CMP, and 2-deoxyribose-5-P were still enhanced 30 min after vancomycin stress (Fig. 4C). The most drastic accumulation was detected for the intermediates of PG and TA biosynthesis. Abundances of all UDP-MurNAc-peptides were altered, with FC of >10-fold (Fig. 4B). The level of malonyl-CoA significantly decreased. The unknown metabolite unknown33_LCMS was solely found in vancomycin-stressed cells, raising drastically in amount, as did further unknown metabolites, such as unknown25_LCMS, unknown32_LCMS, unknown5_GCMS, and unknown6_GCMS (see Fig. S2 in the supplemental material).
To characterize the extracellular metabolic profile for up to 30 min after vancomycin treatment, significantly higher levels of secreted pyruvate were detected. The uptake of glycine (P = 0.017), serine, and glutamine (P = 0.032) was reduced compared to that under control conditions. The proline concentration started to increase (P = 0.043) 20 min after vancomycin treatment (Fig. 5).
Vancomycin induced the fastest and greatest alterations in the metabolic pool compared to the other antibiotics used in this study. Since the target site of vancomycin is on the surface of bacterial cells, this may contribute to its fast impact on staphylococcal metabolism. Besides the declining adenylate energy charge after 20 min of antibiotic treatment (as discussed above), the intracellular c-di-AMP level also significantly decreased. This is reasonable, since this second messenger is thought to be essential for S. aureus (49), and a very low c-di-AMP level is assumed to be involved in a reduced growth rate (50). Interestingly, no significant alteration in the c-di-AMP level was detected under any other antibiotic stress, although this metabolite is assumed to be involved in sensing envelope stress (49). Exposure to cell wall-active antibiotics is known to induce cell wall stress controlled by the two-component system VraSR; thereby, transcription of cell wall-related genes, such as murZ, murI, pbp2, and sgtB, is induced (3, 4), and increasing amounts of the proteins Ddl, FemA, Cap5M, and MurZ were confirmed (9, 41). Regarding the strongly enhanced MurZ level, an unrestricted flux of PG precursors from UDP-GlcNAc-enolpyruvate to UPD-MurNAc-pentapeptide is assumed (41, 51), promoting PG biosynthesis to circumvent cell wall damage. In this study, the boosted PG synthesis led to a drastic accumulation of soluble PG precursors that was accompanied by a complete rearrangement of the metabolome. Within 10 min after exposure to the drug, clear increases in the intracellular amounts of pyruvate, 2-oxoglutarate, glycine, proline, and ATP were detected, providing the building blocks for PG (ATP, nucleotide-activated precursors, and amino acids). Alanine, as an important constituent, had to be synthesized de novo, since it was not available in the culture medium. PG with the altered pentapeptide residue alanine-serine may have an affinity for vancomycin that is different from that for the common alanine-alanine residue, since both were detected in the cytosol of S. aureus in this study. Although both UDP-MurNAc-pentapeptides showed increases in their levels, the precursor containing the alanine-alanine residue clearly dominated. PG precursors may have accumulated in the cytoplasm not only due to increased synthesis. Since vancomycin already inhibits the transglycosylation of nascent peptidoglycan, it may be that all carrier molecules were still loaded with lipid II on the outer cell membrane. In accordance with this, we detected stalled growth of vancomycin-stressed cells (see Fig. S1 in the supplemental material). Moreover, the septum formation necessary for cell division was found to be impaired, whereas no thickened cell wall was observable (Fig. 6). This may also explain the lowered uptake of important metabolites, such as glycine, serine, and glutamine, and the enhanced secretion of pyruvate, which may be needed for alanine synthesis, all of which are used for PG synthesis.
FIG 6.
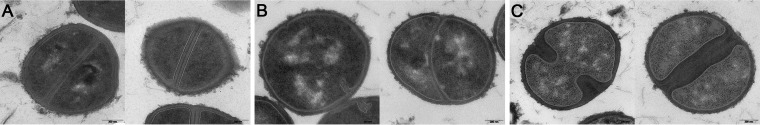
Transmission electron micrographs of S. aureus HG001 cells grown in RPMI medium. Staphylococcal cells were grown without any stress for 120 min after an OD of 0.5 was reached (A), or staphylococcal cells were exposed to vancomycin (B) or ampicillin (C) for 120 min. Bars, 200 nm.
Notably, cystine drastically increased in amount, whereas the amount of cysteine decreased concurrently with the strong accumulation of cell wall precursors. Since cysteine acts as an LMW thiol protecting cells against oxidative stress (52), accumulation of the disulfide cystine may point to an altered redox status of vancomycin-stressed cells. An insignificant increase in the NADPH amount was also detected, supporting the idea of an imbalance in the reducing capacity of the cells. In general, in shifting the metabolism toward such a massive production of cell wall material, an exhaustion of the bacterial cells seemed to be unavoidable, finally leading to decreased levels of a large set of metabolites, such as amino acids, intermediates of the carbon metabolism, and nucleotides.
Ampicillin-dependent metabolic alterations.
After exposure to ampicillin, the levels of 72 intracellular metabolites were significantly altered compared to those under control conditions. These included 18 increased and 54 decreased metabolite abundances (Fig. 2A). Within 60 min after exposure to ampicillin, intracellular levels of succinate, pyruvate (P = 0.029), and 2-oxoglutarate (P = 0.013) increased (Fig. 3). After 120 min of ampicillin treatment, many intermediates of the central carbon metabolism decreased in amount, such as fructose-6-P, glyceraldehyde-3-P (P = 0.014), 1,3-bisphosphoglycerate (P = 0.013), ribose, ribulose-5-P, sedoheptulose-1,7-bis-P, 2-oxoglutarate (P = 0.016), malonyl-CoA, and NADH (P = 0.024) (Fig. 3; see Table S2 in the supplemental material). Concurrently, the amounts of nearly all amino acids and also alanine-alanine significantly decreased (Fig. 4A). Regarding nucleotide metabolism, the amounts of several precursors, nucleotides, and deoxynucleotides significantly decreased (Fig. 4C). Interestingly, a significant increase in the level of GMP, but no changes in the GDP and GTP levels, was detected. The most drastic fold changes compared to control conditions were seen for intermediates of PG synthesis. Starting at UDP-GlcNAc-enolpyruvate, all subsequently synthesized UDP-MurNAc derivatives showed significantly increased quantities (Fig. 4B). For comparison, the significant increase in the level of CDP-ribitol was lower than those in vancomycin- and ciprofloxacin-stressed cells. Furthermore, strong alterations in the levels of unknown metabolites, such as unknown3_LCMS, unknown25_LCMS, unknown32_LCMS, and unknown6_GCMS, were detected that were similar to those induced by vancomycin (see Fig. S2 in the supplemental material).
After exposure to ampicillin, the staphylococcal metabolic footprint differed largely from that of control cells. Glucose was taken up in larger amounts and was accompanied by the accumulation of more acetate, pyruvate, acetoin, and 2,3-butanediol (Fig. 5). Asparagine, glutamine (P = 0.042), valine, leucine (P = 0.021), isoleucine, and tyrosine (P = 0.016) were taken up in larger amounts. Concurrently, aspartate, glutamate, isobutyrate (P = 0.018), isovalerate, 2-methylbutyrate, and the unidentified metabolite named unknown_s_1.26 were secreted in significantly larger amounts. Interestingly, the extracellular concentration of proline started to increase 60 min after antibiotic treatment. For control cells, no increase in the extracellular concentrations of aspartate and proline was detected within 120 min of sampling.
Although the target of ampicillin is also located outside bacterial cells, the metabolic response was more delayed than that after vancomycin stress. However, for both stresses, similar alterations within the metabolome were detected. Since ampicillin is also an inducer of cell wall stress (3), a strong accumulation of PG precursors was detected, similar to the case with vancomycin stress. After concentrations of several intermediates of central pathways, such as pyruvate and succinate, increased within 60 min after ampicillin treatment, an overall decrease of amino acids, intermediates of the PPP, and nucleotides was detected, similar to the effects found in vancomycin-treated cells. The intracellular cystine level was considered a potential indicator of redox imbalance, and it increased insignificantly within 60 min of ampicillin stress. The morphological alteration of ampicillin-treated staphylococcal cells differed drastically from that effected by vancomycin, as the septal region was severely thickened (Fig. 6). This observation points to enhanced PG synthesis providing enough cell wall material to enable thickened septum formation. The higher uptake rate of glucose and the higher secretion rate of overflow metabolites probably supplied the cells with more energy that was necessary for enhanced anabolic reactions. In parallel, larger amounts of amino acids were taken up, pointing to an increased demand for nitrogen donors, such as asparagine or branched-chain amino acids, as presumed for S. aureus grown in RPMI medium (23). For instance, enhanced PG synthesis results in a higher throughput of bactoprenol-bound PG precursors, in which the d-glutamate in the stem peptide is amidated via the GatD-MurT enzyme complex, using glutamine as a nitrogen donor (53). Accordingly, larger amounts of less-amidated amino acids, such as aspartate and glutamate, accumulated in the culture medium. Interestingly, stressing staphylococcal cells with either ampicillin or vancomycin tends to lead to an increased uptake of proline from the culture supernatant. The reason for this is still unknown.
Conclusions.
The present study comprehensively monitored metabolic changes in the cytosol and also in the extracellular space of S. aureus cells triggered by different kinds of antibiotic compounds. Thus, this global approach provides further insights into staphylococcal physiology, since the metabolites are important players in the bacterial stress response, influencing the transcriptome and also the proteome. None of the studied antibiotics led to only a single alteration of a specific metabolite within bacterial cells, but rather the intracellular metabolome was widely affected. Thus, no biomarker metabolite was identified for any antibiotic stress, but often intermediates of whole pathways were affected in abundance. The prominent pathways affected were the peptidoglycan pathway and purine and pyrimidine metabolism. Note that every antibiotic used in this study had an impact on the level of TCC intermediates, supporting the important role of this pathway in staphylococcal stress responses. Besides several metabolites solely detectable under ciprofloxacin or vancomycin stress, we also monitored cells for metabolites showing increased abundances with nearly every antibiotic treatment, such as dUMP and GlcNAc-malate. Some unknown metabolites had significantly altered amounts under a certain stress but are still unidentifiable despite the existence of freely available online metabolite databases, such as ECMDB (54), HMDB (55), and METLIN (56). Thus, identifying the unknowns is still a challenging task in metabolite research that will probably reveal several surprising organic compounds in the future.
Taken together, the data show that inhibition of the extracellular steps of PG biosynthesis most widely affected the staphylococcal metabolome, followed by stalled DNA and RNA synthesis. Moreover, cell wall biosynthesis was affected by each antibiotic compound, due to its essential role in S. aureus and almost all bacteria. Therefore, antibiotics targeting this pathway or enzymatic reactions necessary for providing precursors for cell wall components still represent the most promising candidates for fighting bacterial infections. Considering the urgent need for new antibacterial compounds, this metabolomic approach is a promising complement to transcriptomic and proteomic approaches for unraveling the modes of action of new antibiotics.
Supplementary Material
ACKNOWLEDGMENTS
We thank Michael Hecker, Falko Hochgräfe, and Baltic Analytics GmbH for sharing laboratory facilities. We are grateful to Hans-Georg Sahl for providing UDP-MurNAc-peptides and to Patrick Bednarski for editing the manuscript as a native English speaker.
This work was funded by a grant from the Deutsche Forschungsgemeinschaft (DFG) within the SFB/TRR34 and GRK1870 programs.
Footnotes
Published ahead of print 15 September 2014
Supplemental material for this article may be found at http://dx.doi.org/10.1128/AAC.03104-14.
REFERENCES
- 1.Stubbings W, Labischinski H. 2009. New antibiotics for antibiotic-resistant bacteria. F1000 Biol. Rep. 1:40. 10.3410/B1-40. [DOI] [PMC free article] [PubMed] [Google Scholar]
- 2.Brown DG, Lister T, May-Dracka TL. 2014. New natural products as new leads for antibacterial drug discovery. Bioorg. Med. Chem. Lett. 24:413–418. 10.1016/j.bmcl.2013.12.059. [DOI] [PubMed] [Google Scholar]
- 3.Kuroda M, Kuroda H, Oshima T, Takeuchi F, Mori H, Hiramatsu K. 2003. Two-component system VraSR positively modulates the regulation of cell-wall biosynthesis pathway in Staphylococcus aureus. Mol. Microbiol. 49:807–821. 10.1046/j.1365-2958.2003.03599.x. [DOI] [PubMed] [Google Scholar]
- 4.Utaida S, Dunman PM, Macapagal D, Murphy E, Projan SJ, Singh VK, Jayaswal RK, Wilkinson BJ. 2003. Genome-wide transcriptional profiling of the response of Staphylococcus aureus to cell-wall-active antibiotics reveals a cell-wall-stress stimulon. Microbiology 149:2719–2732. 10.1099/mic.0.26426-0. [DOI] [PubMed] [Google Scholar]
- 5.Cirz RT, Jones MB, Gingles NA, Minogue TD, Jarrahi B, Peterson SN, Romesberg FE. 2007. Complete and SOS-mediated response of Staphylococcus aureus to the antibiotic ciprofloxacin. J. Bacteriol. 189:531–539. 10.1128/JB.01464-06. [DOI] [PMC free article] [PubMed] [Google Scholar]
- 6.Petek M, Baebler S, Kuzman D, Rotter A, Podlesek Z, Gruden K, Ravnikar M, Urleb U. 2010. Revealing fosfomycin primary effect on Staphylococcus aureus transcriptome: modulation of cell envelope biosynthesis and phosphoenolpyruvate induced starvation. BMC Microbiol. 10:159. 10.1186/1471-2180-10-159. [DOI] [PMC free article] [PubMed] [Google Scholar]
- 7.Reiss S, Pané-Farré J, Fuchs S, Francois P, Liebeke M, Schrenzel J, Lindequist U, Lalk M, Wolz C, Hecker M, Engelmann S. 2012. Global analysis of the Staphylococcus aureus response to mupirocin. Antimicrob. Agents Chemother. 56:787–804. 10.1128/AAC.05363-11. [DOI] [PMC free article] [PubMed] [Google Scholar]
- 8.Fuchs S, Zühlke D, Pané-Farré J, Kusch H, Wolf C, Reiss S, Binh le TN, Albrecht D, Riedel K, Hecker M, Engelmann S. 2013. Aureolib—a proteome signature library: towards an understanding of Staphylococcus aureus pathophysiology. PLoS One 8:e70669. 10.1371/journal.pone.0070669. [DOI] [PMC free article] [PubMed] [Google Scholar]
- 9.Hessling B, Bonn F, Otto A, Herbst FA, Rappen GM, Bernhardt J, Hecker M, Becher D. 2013. Global proteome analysis of vancomycin stress in Staphylococcus aureus. Int. J. Med. Microbiol. 303:624–634. 10.1016/j.ijmm.2013.08.014. [DOI] [PubMed] [Google Scholar]
- 10.Hooper DC. 2000. Mechanisms of action and resistance of older and newer fluoroquinolones. Clin. Infect. Dis. 31(Suppl 2):S24–S28. 10.1086/314056. [DOI] [PubMed] [Google Scholar]
- 11.Blanche F, Cameron B, Bernard FX, Maton L, Manse B, Ferrero L, Ratet N, Lecoq C, Goniot A, Bisch D, Crouzet J. 1996. Differential behaviors of Staphylococcus aureus and Escherichia coli type II DNA topoisomerases. Antimicrob. Agents Chemother. 40:2714–2720. [DOI] [PMC free article] [PubMed] [Google Scholar]
- 12.Contreras A, Vazquez D. 1977. Cooperative and antagonistic interactions of peptidyl-tRNA and antibiotics with bacterial ribosomes. Eur. J. Biochem. 74:539–547. 10.1111/j.1432-1033.1977.tb11422.x. [DOI] [PubMed] [Google Scholar]
- 13.Tenson T, Lovmar M, Ehrenberg M. 2003. The mechanism of action of macrolides, lincosamides and streptogramin B reveals the nascent peptide exit path in the ribosome. J. Mol. Biol. 330:1005–1014. 10.1016/S0022-2836(03)00662-4. [DOI] [PubMed] [Google Scholar]
- 14.Tai PC, Wallace BJ, Davis BD. 1974. Selective action of erythromycin on initiating ribosomes. Biochemistry 13:4653–4659. 10.1021/bi00719a029. [DOI] [PubMed] [Google Scholar]
- 15.Kahan FM, Kahan JS, Cassidy PJ, Kropp H. 1974. The mechanism of action of fosfomycin (phosphonomycin). Ann. N. Y. Acad. Sci. 235:364–386. 10.1111/j.1749-6632.1974.tb43277.x. [DOI] [PubMed] [Google Scholar]
- 16.Scheffers DJ, Pinho MG. 2005. Bacterial cell wall synthesis: new insights from localization studies. Microbiol. Mol. Biol. Rev. 69:585–607. 10.1128/MMBR.69.4.585-607.2005. [DOI] [PMC free article] [PubMed] [Google Scholar]
- 17.Pinho MG, Errington J. 2003. Dispersed mode of Staphylococcus aureus cell wall synthesis in the absence of the division machinery. Mol. Microbiol. 50:871–881. 10.1046/j.1365-2958.2003.03719.x. [DOI] [PubMed] [Google Scholar]
- 18.Reynolds PE. 1961. Studies on the mode of action of vancomycin. Biochim. Biophys. Acta 52:403–405. 10.1016/0006-3002(61)90698-9. [DOI] [PubMed] [Google Scholar]
- 19.Perkins HR. 1969. Specificity of combination between mucopeptide precursors and vancomycin or ristocetin. Biochem. J. 111:195–205. [DOI] [PMC free article] [PubMed] [Google Scholar]
- 20.Schneider T, Sahl HG. 2010. An oldie but a goodie—cell wall biosynthesis as antibiotic target pathway. Int. J. Med. Microbiol. 300:161–169. 10.1016/j.ijmm.2009.10.005. [DOI] [PubMed] [Google Scholar]
- 21.Born P, Breukink E, Vollmer W. 2006. In vitro synthesis of cross-linked murein and its attachment to sacculi by PBP1A from Escherichia coli. J. Biol. Chem. 281:26985–26993. 10.1074/jbc.M604083200. [DOI] [PubMed] [Google Scholar]
- 22.Herbert S, Ziebandt AK, Ohlsen K, Schäfer T, Hecker M, Albrecht D, Novick R, Götz F. 2010. Repair of global regulators in Staphylococcus aureus 8325 and comparative analysis with other clinical isolates. Infect. Immun. 78:2877–2889. 10.1128/IAI.00088-10. [DOI] [PMC free article] [PubMed] [Google Scholar]
- 23.Dörries K, Lalk M. 2013. Metabolic footprint analysis uncovers strain specific overflow metabolism and d-isoleucine production of Staphylococcus aureus COL and HG001. PLoS One 8:e81500. 10.1371/journal.pone.0081500. [DOI] [PMC free article] [PubMed] [Google Scholar]
- 24.Qaiyumi S. 2007. Macro- and microdilution methods of antimicrobial susceptibility testing, p 75–79 In Schwalbe R, Steele-Moore L, Goodwin AC. (ed), Antimicrobial susceptibility testing protocols. CRC Press Taylor & Francis Group, Boca Raton, FL. [Google Scholar]
- 25.Meyer H, Liebeke M, Lalk M. 2010. A protocol for the investigation of the intracellular Staphylococcus aureus metabolome. Anal. Biochem. 401:250–259. 10.1016/j.ab.2010.03.003. [DOI] [PubMed] [Google Scholar]
- 26.Behrends V, Tredwell GD, Bundy JG. 2011. A software complement to AMDIS for processing GC-MS metabolomic data. Anal. Biochem. 415:206–208. 10.1016/j.ab.2011.04.009. [DOI] [PubMed] [Google Scholar]
- 27.Atkinson DE. 1968. Energy charge of adenylate pool as a regulatory parameter. Interaction with feedback modifiers. Biochemistry 7:4030–4034. [DOI] [PubMed] [Google Scholar]
- 28.Klukas C, Schreiber F. 2010. Integration of -omics data and networks for biomedical research with VANTED. J. Integr. Bioinform. 7:112. 10.2390/biecoll-jib-2010-112. [DOI] [PubMed] [Google Scholar]
- 29.Saeed AI, Sharov V, White J, Li J, Liang W, Bhagabati N, Braisted J, Klapa M, Currier T, Thiagarajan M, Sturn A, Snuffin M, Rezantsev A, Popov D, Ryltsov A, Kostukovich E, Borisovsky I, Liu Z, Vinsavich A, Trush V, Quackenbush J. 2003. TM4: a free, open-source system for microarray data management and analysis. Biotechniques 34:374–378. [DOI] [PubMed] [Google Scholar]
- 30.Hammerschmidt S, Wolff S, Hocke A, Rosseau S, Müller E, Rohde M. 2005. Illustration of pneumococcal polysaccharide capsule during adherence and invasion of epithelial cells. Infect. Immun. 73:4653–4667. 10.1128/IAI.73.8.4653-4667.2005. [DOI] [PMC free article] [PubMed] [Google Scholar]
- 31.Chapman AG, Fall L, Atkinson DE. 1971. Adenylate energy charge in Escherichia coli during growth and starvation. J. Bacteriol. 108:1072–1086. [DOI] [PMC free article] [PubMed] [Google Scholar]
- 32.Power EG, Phillips I. 1992. Induction of the SOS gene (umuC) by 4-quinolone antibacterial drugs. J. Med. Microbiol. 36:78–82. 10.1099/00222615-36-2-78. [DOI] [PubMed] [Google Scholar]
- 33.Seidl K, Müller S, Francois P, Kriebitzsch C, Schrenzel J, Engelmann S, Bischoff M, Berger-Bächi B. 2009. Effect of a glucose impulse on the CcpA regulon in Staphylococcus aureus. BMC Microbiol. 9:95. 10.1186/1471-2180-9-95. [DOI] [PMC free article] [PubMed] [Google Scholar]
- 34.Higgins ML, Daneo-Moore L, Boothby D, Shockman GD. 1974. Effect of inhibition of deoxyribonucleic acid and protein synthesis on the direction of cell wall growth in Streptococcus faecalis. J. Bacteriol. 118:681–692. [DOI] [PMC free article] [PubMed] [Google Scholar]
- 35.Liebeke M, Dörries K, Zühlke D, Bernhardt J, Fuchs S, Pané-Farré J, Engelmann S, Völker U, Bode R, Dandekar T, Lindequist U, Hecker M, Lalk M. 2011. A metabolomics and proteomics study of the adaptation of Staphylococcus aureus to glucose starvation. Mol. Biosyst. 7:1241–1253. 10.1039/c0mb00315h. [DOI] [PubMed] [Google Scholar]
- 36.Ruane KM, Lloyd AJ, Fülöp V, Dowson CG, Barreteau H, Boniface A, Dementin S, Blanot D, Mengin-Lecreulx D, Gobec S, Dessen A, Roper DI. 2013. Specificity determinants for lysine incorporation in Staphylococcus aureus peptidoglycan as revealed by the structure of a MurE enzyme ternary complex. J. Biol. Chem. 288:33439–33448. 10.1074/jbc.M113.508135. [DOI] [PMC free article] [PubMed] [Google Scholar]
- 37.Ernst CM, Peschel A. 2011. Broad-spectrum antimicrobial peptide resistance by MprF-mediated aminoacylation and flipping of phospholipids. Mol. Microbiol. 80:290–299. 10.1111/j.1365-2958.2011.07576.x. [DOI] [PubMed] [Google Scholar]
- 38.Taber HW, Mueller JP, Miller PF, Arrow AS. 1987. Bacterial uptake of aminoglycoside antibiotics. Microbiol. Rev. 51:439–457. [DOI] [PMC free article] [PubMed] [Google Scholar]
- 39.Allison KR, Brynildsen MP, Collins JJ. 2011. Metabolite-enabled eradication of bacterial persisters by aminoglycosides. Nature 473:216–220. 10.1038/nature10069. [DOI] [PMC free article] [PubMed] [Google Scholar]
- 40.Bandow JE, Brötz H, Leichert LI, Labischinski H, Hecker M. 2003. Proteomic approach to understanding antibiotic action. Antimicrob. Agents Chemother. 47:948–955. 10.1128/AAC.47.3.948-955.2003. [DOI] [PMC free article] [PubMed] [Google Scholar]
- 41.Blake KL, O'Neill AJ, Mengin-Lecreulx D, Henderson PJ, Bostock JM, Dunsmore CJ, Simmons KJ, Fishwick CW, Leeds JA, Chopra I. 2009. The nature of Staphylococcus aureus MurA and MurZ and approaches for detection of peptidoglycan biosynthesis inhibitors. Mol. Microbiol. 72:335–343. 10.1111/j.1365-2958.2009.06648.x. [DOI] [PubMed] [Google Scholar]
- 42.Townsend DM, Tew KD. 2003. The role of glutathione-S-transferase in anti-cancer drug resistance. Oncogene 22:7369–7375. 10.1038/sj.onc.1206940. [DOI] [PMC free article] [PubMed] [Google Scholar]
- 43.Pöther DC, Gierok P, Harms M, Mostertz J, Hochgräfe F, Antelmann H, Hamilton CJ, Borovok I, Lalk M, Aharonowitz Y, Hecker M. 2013. Distribution and infection-related functions of bacillithiol in Staphylococcus aureus. Int. J. Med. Microbiol. 303:114–123. 10.1016/j.ijmm.2013.01.003. [DOI] [PubMed] [Google Scholar]
- 44.Fahey RC, Newton GL, Arrick B, Overdank-Bogart T, Aley SB. 1984. Entamoeba histolytica: a eukaryote without glutathione metabolism. Science 224:70–72. 10.1126/science.6322306. [DOI] [PubMed] [Google Scholar]
- 45.Lamers AP, Keithly ME, Kim K, Cook PD, Stec DF, Hines KM, Sulikowski GA, Armstrong RN. 2012. Synthesis of bacillithiol and the catalytic selectivity of FosB-type fosfomycin resistance proteins. Org. Lett. 14:5207–5209. 10.1021/ol302327t. [DOI] [PMC free article] [PubMed] [Google Scholar]
- 46.Roberts AA, Sharma SV, Strankman AW, Duran SR, Rawat M, Hamilton CJ. 2013. Mechanistic studies of FosB: a divalent-metal-dependent bacillithiol-S-transferase that mediates fosfomycin resistance in Staphylococcus aureus. Biochem. J. 451:69–79. 10.1042/BJ20121541. [DOI] [PMC free article] [PubMed] [Google Scholar]
- 47.Gaballa A, Newton GL, Antelmann H, Parsonage D, Upton H, Rawat M, Claiborne A, Fahey RC, Helmann JD. 2010. Biosynthesis and functions of bacillithiol, a major low-molecular-weight thiol in bacilli. Proc. Natl. Acad. Sci. U. S. A. 107:6482–6486. 10.1073/pnas.1000928107. [DOI] [PMC free article] [PubMed] [Google Scholar]
- 48.Newton GL, Fahey RC, Rawat M. 2012. Detoxification of toxins by bacillithiol in Staphylococcus aureus. Microbiology 158:1117–1126. 10.1099/mic.0.055715-0. [DOI] [PMC free article] [PubMed] [Google Scholar]
- 49.Corrigan RM, Abbott JC, Burhenne H, Kaever V, Gründling A. 2011. c-di-AMP is a new second messenger in Staphylococcus aureus with a role in controlling cell size and envelope stress. PLoS Pathog. 7:e1002217. 10.1371/journal.ppat.1002217. [DOI] [PMC free article] [PubMed] [Google Scholar]
- 50.Dengler V, McCallum N, Kiefer P, Christen P, Patrignani A, Vorholt JA, Berger-Bächi B, Senn MM. 2013. Mutation in the c-di-AMP cyclase dacA affects fitness and resistance of methicillin resistant Staphylococcus aureus. PLoS One 8:e73512. 10.1371/journal.pone.0073512. [DOI] [PMC free article] [PubMed] [Google Scholar]
- 51.O'Neill AJ, Lindsay JA, Gould K, Hinds J, Chopra I. 2009. Transcriptional signature following inhibition of early-stage cell wall biosynthesis in Staphylococcus aureus. Antimicrob. Agents Chemother. 53:1701–1704. 10.1128/AAC.01309-08. [DOI] [PMC free article] [PubMed] [Google Scholar]
- 52.Lithgow JK, Hayhurst EJ, Cohen G, Aharonowitz Y, Foster SJ. 2004. Role of a cysteine synthase in Staphylococcus aureus. J. Bacteriol. 186:1579–1590. 10.1128/JB.186.6.1579-1590.2004. [DOI] [PMC free article] [PubMed] [Google Scholar]
- 53.Münch D, Roemer T, Lee SH, Engeser M, Sahl HG, Schneider T. 2012. Identification and in vitro analysis of the GatD/MurT enzyme-complex catalyzing lipid II amidation in Staphylococcus aureus. PLoS Pathog. 8:e1002509. 10.1371/journal.ppat.1002509. [DOI] [PMC free article] [PubMed] [Google Scholar]
- 54.Guo AC, Jewison T, Wilson M, Liu Y, Knox C, Djoumbou Y, Lo P, Mandal R, Krishnamurthy R, Wishart DS. 2013. ECMDB: the E. coli Metabolome Database. Nucleic Acids Res. 41:D625–D630. 10.1093/nar/gks992. [DOI] [PMC free article] [PubMed] [Google Scholar]
- 55.Wishart DS, Jewison T, Guo AC, Wilson M, Knox C, Liu Y, Djoumbou Y, Mandal R, Aziat F, Dong E, Bouatra S, Sinelnikov I, Arndt D, Xia J, Liu P, Yallou F, Bjorndahl T, Perez-Pineiro R, Eisner R, Allen F, Neveu V, Greiner R, Scalbert A. 2013. HMDB 3.0—the Human Metabolome Database in 2013. Nucleic Acids Res. 41:D801–D807. 10.1093/nar/gks1065. [DOI] [PMC free article] [PubMed] [Google Scholar]
- 56.Smith CA, O'Maille G, Want EJ, Qin C, Trauger SA, Brandon TR, Custodio DE, Abagyan R, Siuzdak G. 2005. METLIN: a metabolite mass spectral database. Ther. Drug Monit. 27:747–751. 10.1097/01.ftd.0000179845.53213.39. [DOI] [PubMed] [Google Scholar]
Associated Data
This section collects any data citations, data availability statements, or supplementary materials included in this article.