Abstract
BACKGROUND
Fatigue is a common side effect of cancer (CA) treatment. We used a novel analytical method to identify and validate a specific gene cluster that is predictive of fatigue risk in prostate cancer patients (PCP) treated with radiotherapy (RT).
METHODS
A total of 44 PCP were categorized into high-fatigue (HF) and low-fatigue (LF) cohorts based on fatigue score change from baseline to RT completion. Fold-change differential and Fisher’s linear discriminant analyses (LDA) from 27 subjects with gene expression data at baseline and RT completion generated a reduced base of most discriminatory genes (learning phase). A nearest-neighbor risk (k-NN) prediction model was developed based on small-scale prognostic signatures. The predictive model validity was tested in another 17 subjects using baseline gene expression data (validation phase).
RESULT
The model generated in the learning phase predicted HF classification at RT completion in the validation phase with 76.5% accuracy.
CONCLUSION
The results suggest that a novel analytical algorithm that incorporates fold-change differential analysis, LDA, and a k-NN may have applicability in predicting regimen-related toxicity in cancer patients with high reliability, if we take into account these results and the limited amount of data that we had at disposal. It is expected that the accuracy will be improved by increasing data sampling in the learning phase.
Keywords: cancer-related fatigue, radiation therapy, prostate cancer, Fisher’s linear discriminant analysis (LDA), k-NN backward recursive feature elimination
Introduction
Fatigue is the most common, troublesome, and costly side effect of many cancer (CA) treatment regimens. Not only does it impact patients directly, but it also has significant repercussions on both direct and indirect health economic outcomes.1 CA treatment-related fatigue (CTRF) is defined as a “subjective sense of tiredness” that persists over time, interferes with activities of daily living, and is not relieved by adequate rest.2,3 The majority of CTRF studies are associated with chemotherapy regimens; however, fatigue during and after external beam radiation therapy (RT) is common, increasing in severity during treatment and persisting after RT has been completed.4 CTRF has been reported to be the most distressing symptom reported by patients with non-metastatic prostate CA who receive RT with the greatest negative impact on daily activity, physical well-being/function, and relationships with significant others.5 The trajectory of CTRF is still being defined. During RT, fatigue intensification peaks at midpoint, declines after completion of RT,6 and becomes chronic in a subpopulation of patients. The pathobiology of CTRF, like other toxicities, is complex and is probably attributable to a cascade of events resulting in radiation-induced pro-inflammatory cytokine production, hypothalamic–pituitary–adrenal (HPA) activation dysfunction, and neuromuscular function abnormalities.7,8
CTRF, like other regimen-related toxicities, does not occur in every patient, but rather in a subpopulation of at-risk individuals. In the context of individualizing care, the ability to predict CTRF risk has the potential to help guide treatment choices for patients and providers. There have been a number of attempts to predict CTRF. For example, one study reported that elevated pre-treatment fatigue, anxiety, and a specific breast cancer diagnosis (eg, ductal carcinoma in situ, invasive lobular carcinoma) predicted CTRF during RT in early stage breast cancer.9 Another study found dyspnea, pain, lack of appetite, feeling drowsy, feeling sad, and feeling irritable to be forecasters of CTRF among hematology–oncology patients.10
However, as it becomes increasingly clear that CTRF is strongly related to a series of underlying genetically controlled biological events, the utility of identifying a group of genes that impact patients’ risk of the condition seems compelling. We hypothesized that radiation-associated fatigue risk, like other regimen-related toxicities, is determined not by a single gene, but rather a synergistically functioning group of genes. This theory is supported by the finding that clusters of SNPs, discovered by Bayesian network analysis, have been reported to be associated with CTRF risk in patients being treated with cycled chemotherapy for breast and colorectal cancers.11,12 In the current study, we evaluated an alternative analytical method in which genes were identified using a series of hierarchical filters and nearest-neighbor (NN) analysis to identify a group of genes that predicted CTRF in men being irradiated for prostate cancer. This proof-of-concept investigation not only demonstrated the utility of the analysis, but also confirmed the observation that focal radiation therapy is capable of inducing gene expression changes in peripheral white blood cell RNA.13
Methods
Patients
This study (NCT00852111) was approved by the Institutional Review Board of the National Institutes of Health (NIH), Bethesda, Maryland, USA. The study involving human participants is in compliance with the Declaration of Helsinki. Men who were 18 years or older, diagnosed with non-metastatic prostate cancer with or without a history of prostatectomy, and scheduled to receive EBRT with or without concurrent androgen deprivation therapy (ADT), were enrolled. Men with progressive disease causing significant fatigue, those with psychiatric disease within the past five years, uncorrected hypothyroidism and anemia, taking sedatives, steroids, and non-steroidal anti-inflammatory agents, and those with second malignancies, were excluded. Patients were recruited at the Magnuson Clinical Research Center, NIH, between May 2009 and September 2011. Subjects signed written informed consents prior to study participation.
Fatigue assessment instruments
Clinical and demographic data (eg, age, race, stage of prostate cancer, EBRT dose, type of EBRT technique used, and laboratory values) were obtained from chart review. Questionnaires were completed at baseline (prior to RT) and at completion of RT (day 38–42 after EBRT initiation). To avoid extraneous influences on their responses, subjects completed the questionnaires in an outpatient setting before clinical procedures were provided.
The 13-item Functional Assessment of Cancer Therapy–Fatigue (FACT-F), a frequently used, validated, reliable, stand-alone measure of fatigue in cancer therapy with coefficient alphas in the mid-90s, was used.14 FACT-F is scored from 0–52, the higher the score, the lower the fatigue symptoms. A greater than three-point decrease in the FACT-F score is considered to be a minimally important change that is clinically relevant.15 To optimize the phenotypic characterization of the study participants, subjects were categorized into high-fatigue (HF) or low-fatigue (LF) groups based on their change in FACT-F scores from baseline to completion of EBRT. HF subjects had a decrease of three or more points in FACT-F scores, and those who had less than a three-point decrease in FACT-F scores between both time points were categorized in the LF group. Depressive symptoms were also assessed using the 21-item Hamilton Depression Rating Scale (HAM-D), a clinician-administered questionnaire with good psychometric properties.16
Biological sample collection, RNA extraction, and microarray experiments
Peripheral blood (2.5 mL) was collected at baseline and on the last day of RT, immediately after FACT-F was administered, from each subject using PAXgene™ Blood RNA tubes (Qiagen, Frederick, Maryland, USA) containing red blood cell lysis buffer and a RNA-stabilizing solution and stored at −80 °C until RNA extraction. Total RNA was extracted using the PAXgene™ Blood RNA system (Qiagen, Frederick, Maryland, USA) according to manufacturer’s instructions. The quantity of total RNA was measured by a spectrophotometer at an optical density of 260 nm. RNA quality was assessed using the RNA 6000 Nano LabChip® on a Bioanalyzer Agilent 2100 (Agilent Technologies, Palo Alto, CA, USA). RNA purification, cDNA and cRNA synthesis, amplification, hybridization, scanning, and data analyses were conducted by one laboratory technician following standard protocols as previously described.17 Affymetrix microarray chips (HG-U133 Plus 2.0, Santa Clara, California, USA) were used for gene expression analysis. The Affymetrix HG-U133 Plus 2.0 microarray chip is comprised of 47,000 transcripts, including 38,000 well-characterized human genes. Affymetrix GeneChip Command Console (AGCC, 3.0 V) was used to scan the images for data acquisition. Affymetrix raw data were acquired using comparison expression analysis of GCOS Software to yield CHP files according to the user instructions. Peripheral blood has been previously utilized to describe gene expression signature that predicted radiation-related toxicities.18
Ingenuity Pathway analysis (Ingenuity® Systems, www.ingenuity.com, Redwood City, California, USA) identified the functional networks of the differentially expressed probe sets from Ingenuity’s Knowledge Base. Right-tailed Fisher’s exact test was used to calculate the P-values determining the probability that each biological function and/or disease assigned to these networks is due to chance alone. The one-tailed analysis was used to reduce the random chances of over-representation of focused genes in the relevant pathways.19
Statistical rationale
Descriptive analyses were used to assess the demographic characteristics of the sample. Paired t-tests were used to compare fatigue scores and clinical variables between time points. To facilitate the identification of a group of synergistically functioning genes that were associated with CTRF risk, we used an approach that optimized an initial supervised component with a subsequent statistically driven hierarchical ranking. Using microarray data from the training set of patients for which the presence or absence of CRTF was known, we identified the genes that most discriminated between individuals who developed CTRF from those who did not. Those genes were then ranked according to their discriminatory value (as defined by their Fisher’s ratio [FR]), in which the predictive accuracy of the different-ordered reduced sets was determined using a backward recursive feature elimination algorithm (see flow diagram in Fig. 1 below). This procedure serves to eliminate redundant or irrelevant genes (features) to yield the most precise set of genes with the greatest predictive accuracy.
Figure 1.
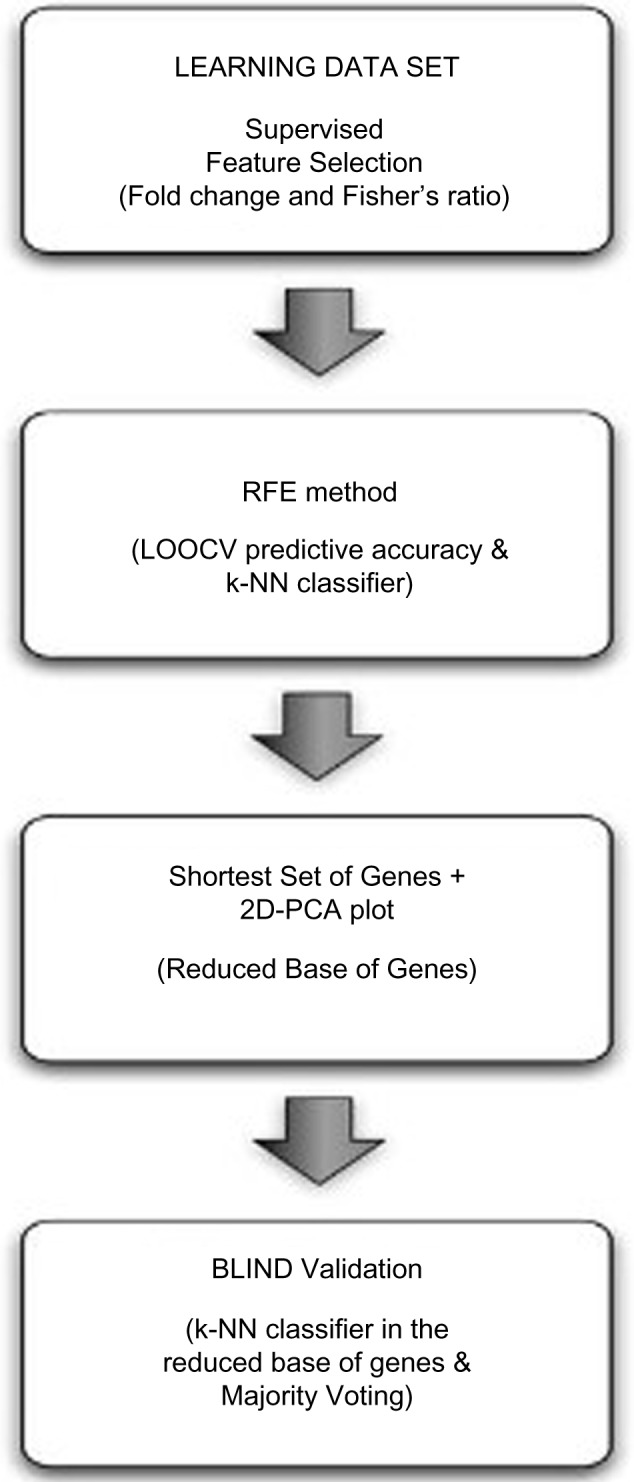
Flow diagram for the radiation-related fatigue prediction model. The methodology is composed of 4 steps: feature selection, backward recursive feature elimination, small-scale separability analysis and blind validation.
Feature selection (gene ranking)
Feature selection identified genes with the highest fold change,20,32 fcj(c1,c2), and FR,21FRj(c1,c2), using the phenotype information. The fold change and the FR for probe j in a binary classification problem are defined as follows:
| (1) |
| (2) |
where μj1,μj2 are measures of the center of the distribution (means) of gene j in classes 1 and 2, and , are measures of the dispersion (variance) within these classes.
The following relationship holds:
| (3) |
that is,
| (4) |
where is the distance between the centers of the classes, and is the total variance of the gene j in both classes.
The above relationship means that the centers of the distribution are further apart the distance, . Also, taking into account that , then
| (5) |
This last relationship implies that given a gene characterized by its FR, FRj, and fold-change value, fcj, only the most discriminatory genes with means μj1, μj2 and dispersions σj1,σj2 in both classes are selected by this procedure.
Identification/selection of the smallest and most precise set of CTRF-associated genes
We used the following algorithm to select the smallest and most precise set of discriminatory genes for the LF/HF phenotype:
Genes identified by feature selection (see above) were ranked in decreasing order according to their FR value.
The predictive accuracy of the different sets was iteratively calculated after the sequential elimination of the genes with lowest FR. We termed this novel algorithm, a modification of the technique described by Guyon et al (2002),22 “backward recursive feature elimination.” It served to determine the number of helper genes (genes with the lowest FR) needed to maximize the Leave-One-Out-Cross-Validation (LOOCV) predictive accuracy,23 in a procedure similar to the Fourier decomposition of a signal into a sum of harmonics of increasing frequency.24 Genes with lower FR provide high frequency details for the discrimination. This procedure yielded the shortest gene set that predicted fatigue risk association with optimum accuracy (most precise). Other sets with similar and lower accuracy were also determined by this procedure and were of value, because these sets were also considered as noise buffers; as the classifier with the highest learning accuracy might not be the one that generalizes (predicts correctly unseen samples) better. This approach is appropriate and is especially helpful in designing small-scale signatures that were able to predict HF/LF with a high degree of accuracy.
The linear separability of the phenotype in the reduced set of genes that is determined in step 2 was checked by performing principal component analysis (PCA) of the learning dataset expressed in this small-scale signature and projecting these samples in the corresponding 2D PCA space. Then, the LF/HF phenotype becomes linearly separable by reducing the dimension to the list of most discriminatory genes, if both populations (HF and LF) can be linearly separated by a given hyper-plane.
The accuracy estimation was based on the LOOCV method, using the average Euclidean distance on the reduced set of features to each training class set. The goal of cross-validation was to estimate how accurately a predictive model (classifier) will perform in practice. This procedure, applied to the training dataset, is supervised because the phenotype information of the patients was needed to establish the predictive accuracy of each gene list. LOOCV implies using a single sample from the original dataset as the validation data (sample test), and the remaining samples as training data. This was repeated such that each sample in the dataset was used once, as a sample test. Each sample was characterized by a vector whose dimension was the number of genes that belonged to the reduced base that differentiated between HF and LF. The class with the minimum Euclidean distance was assigned to the sample test (NN classifier),25 and the average accuracy was calculated by iterating over all the samples. For that purpose, all the samples were normalized according to their gene variability (each attribute or gene separately). In this way, all the genes had the same importance in the distance criterion. The distance between a sample and a phenotype class could have been defined in several ways, but the most robust one was using the median distance between the sample test and all the samples in the corresponding class.
The legitimacy of the predictive accuracy based on the training set was then tested with the validation set, using the above-mentioned predictive model. It is important to remark that the application of the prediction model, designed in steps 1 to 3, to the validation set was unsupervised. The final decision was made by consensus (majority voting) of the predictions made using the lists of most discriminatory genes.
Results
Demographic and clinical characteristics
A total of 44 men with non-metastatic prostate cancer were studied. Subjects were primarily Caucasian (67%), had a mean age of 65.2 ± 6.7 years and were not depressed based on Hamilton Depression Scale (1.1 ± 2.2) criteria. All subjects received a cumulative radiation dose of at least 68.4 Gy and more than 90% received a total dose of 75.6 Gy. Most (64%) of the subjects had a Gleason score of 7–8, and 71% had clinical T-stage below T3. The Gleason scoring and clinical staging are unique systems to classify the extent of the prostatic carcinoma.26,27 There was no difference between the clinical and demographic features of subjects in the training and validation sets. In general, CTRF as indicated by a significant decrease in FACT-F scores from baseline (45.4 ± 7.2) to completion of EBRT (39.4 ± 10.0, P < 0.05) was found. The characteristics of both study sets are shown in Table 1.
Table 1.
Demographic characteristics of the sample.
| TRAINING | VALIDATION | |||||||||||
|---|---|---|---|---|---|---|---|---|---|---|---|---|
| HIGH FATIGUE (N = 18) | LOW FATIGUE (N = 9) | HIGH FATIGUE (N = 7) | LOW FATIGUE (N = 10) | |||||||||
| MEAN (SD) | RANGE | N (%) | MEAN (SD) | RANGE | N (%) | MEAN (SD) | RANGE | N (%) | MEAN (SD) | RANGE | N (%) | |
| Age in Years | 64.6 (5.7) | 53–73 | 65.2 (7.0) | 55–74 | 66.7 (5.3) | 58–73 | 6 6.5(7.0) | 53–74 | ||||
| Ethnicity n(%) | ||||||||||||
| Caucasian | 18 (100) | 7 (78) | 2 (29) | 5 (50) | ||||||||
| African-American | 2 (22) | 4 (57) | 4 (40) | |||||||||
| Other | 1 (14) | 1 (10) | ||||||||||
| Clinical T stage | ||||||||||||
| T1 (a–c) | 4 (22) | 2 (22) | 2 (29) | 2 (20) | ||||||||
| T2 (a–c) | 10 (56) | 7 (78) | 3 (43) | 7 (70) | ||||||||
| T3 (a–c) | 4 (22) | 2 (29) | 1 (10) | |||||||||
| BMI | 30.3 (4.5) | 22–37 | 30.4 (2.7) | 26–34 | 30.4 (6.3) | 24–42 | 31.5 (5.5) | 25–40 | ||||
| FACT-F score | ||||||||||||
| Baseline | 43.6 (8.4) | 28–52 | 47.0 (5.6) | 36–52 | 48.9 (5.8) | 36–52 | 42.3 (7.7) | 32–51 | ||||
| Endpoint (day 42) | 32.5 (8.1) | 20–46 | 47.4 (4.4) | 41 – 51 | 39.6 (8.0) | 26–48 | 43.1 (8.1) | 31–52 | ||||
| HAM-D score | ||||||||||||
| Baseline | 1.1 (2.2) | 0–7 | 0.6 (0.9) | 0–2 | 0.1 (0.4) | 0–1 | 1.0 (1.3) | 0–4 | ||||
| Endpoint (day 42) | 1.8 (2.2) | 0–7 | 0.8 (0.7) | 0–2 | 1.6 (2.2) | 0–6 | 1.6 (1.4) | 0–5 | ||||
Abbreviations: SD, standard deviation; BMI, body mass index; FACT-F, Functional Assessment of Cancer Therapy – Fatigue subscale; HAM-D, Hamilton - Depression.
Training model development
The training model was developed from the array outputs of 27 subjects; 18 were HF (mean FACT-F change = −11.8 ± 6.8) and 9 were LF (mean FACT-F change = 0.8 ± 3.3). Each patient sample contained 604,258 different probes. The minimum and maximum gene expressions were 21 and 62,088, respectively.
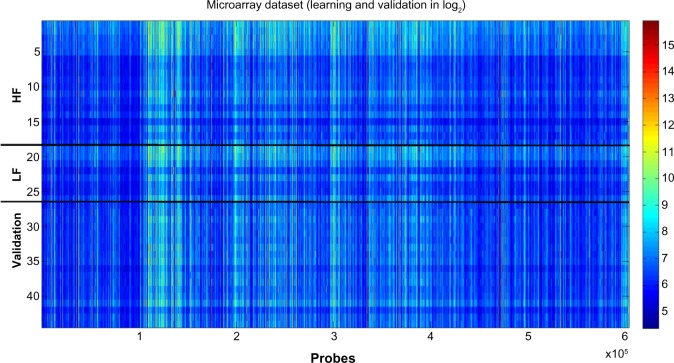
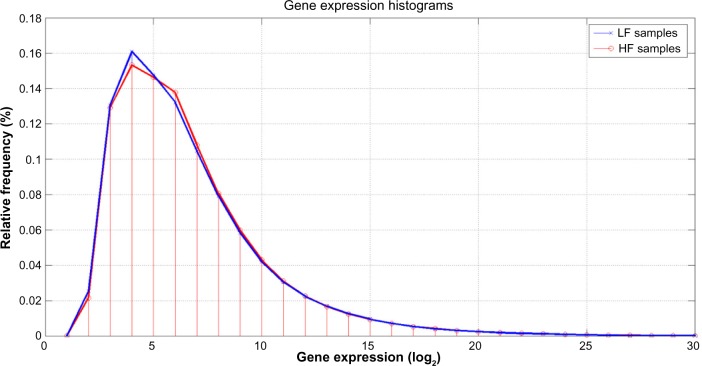
As shown in Figure 2, it was impossible to visually distinguish HF and LF microarray outputs in heat map format using decibels as units of measure (log2 of gene expression). The similarities between the HF and LF groups in the learning dataset were confirmed by further histogram analysis of gene expression. Figure 3 shows that the corresponding statistical distributions of gene expressions in both groups were close to lognormal, with the main differences between both phenotypes occurring around the mode of both histograms (expressions around 24 and 26).
Figure 2.
Data visualization in decibels (log2 of the expression). HF is composed of 18 samples, LF 9 samples and Validation 17 samples. The phenotype of the validation samples is not used for learning purposes. The expression varies from 21 to 62.088, that is, a fold change of 11, 53. No filtering is performed in the expression data, since the feature selection methods that are used are robust to the presence of outliers. Also, the gene selection is not only based on differential expression that might be affected by the presence of noise.
Figure 3.
Gene expression histograms in log2 scale for the Low Fatigue and High Fatigue subjects. Slight difference can be observed between them around the modes of the histograms (24 to 25).
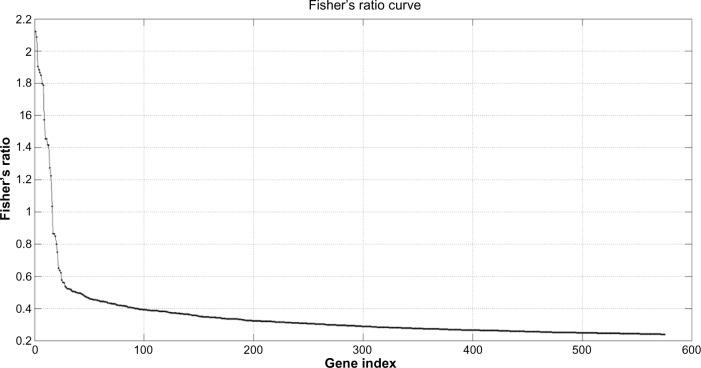
A final list of 575 highly discriminatory genes according to expression was noted and defined by the intersection between those genes that were differentially expressed (located in the 0.05% and 99.5% tails of the fold-change ratio cumulative distribution) and which had a FR higher than 0.25 (Fig. 4).
Figure 4.
Fisher’s ratio curve for the Low Fatigue-High Fatigue phenotype discrimination. Genes with the highest Fisher’s ratio were the most important biological eigenvectors for the phenotype discrimination, as it happens, for the Fourier analysis of a digital signal and its decomposition into different harmonics. In this case, the Fisher’s ratio curve decreases very steeply, in such that only with the first set of genes (14 to 35 genes in this case) can the highest discriminative accuracy of the learning data set, can be achieved. Adding genes with lowest discriminatory power indiscriminately does not improve the LOOCV predictive accuracy. The backward RFE method is used to determine the amount of details that is needed.
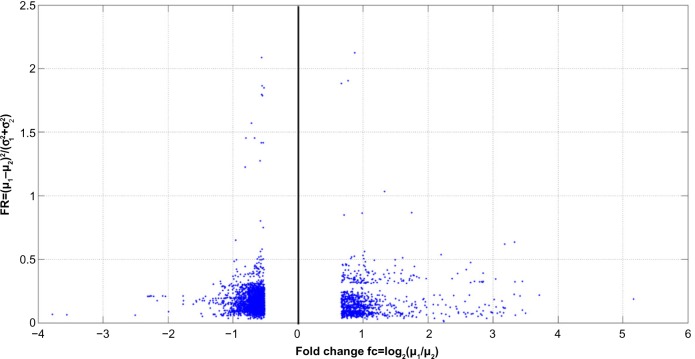
Additionally, Figure 5 shows the fold change–FR plot for genes in the learning dataset with fold change lower than −0.52 and higher than 0.67. These values (of gene under- and over-expression) corresponded, respectively, to the 0.05% and 99.5% tails of the fold-change distribution. It can be observed that the highest FR was 2.12, and that genes with the highest fold change did not coincide with those exhibiting the highest FR.
Figure 5.
Fold change-Fisher’s ratio plot of genes in the learning dataset with absolute fold change greater than 0.52 that corresponds to the 0.005 and 99.5% tails of the fold change distribution. In this case the Fisher’s ratio plays a similar role than −log(P value) for the volcano plot analysis.30
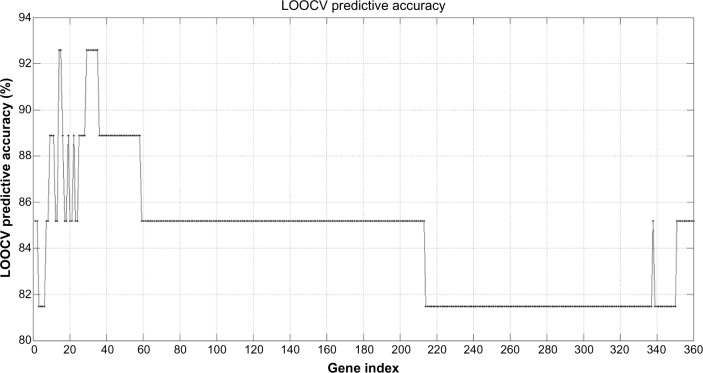
Figure 6 shows the predictive accuracy curve of the different gene lists, established using the backward feature elimination algorithm. The shortest list with the highest accuracy (92.6%) was composed by the first 14 genes with the highest FR. The lists with the first 15, and 29 to 35 most discriminatory genes also provide the same maximum accuracy. As the data suggest, continuously adding genes with lower discriminatory power as defined by their FR failed to increase the accuracy of discrimination.
Figure 6.
Leave-One-Out-Cross-Validation (LOOCV) learning predictive accuracy of the first 360 gene sets with the highest discriminatory power. The shortest list with the highest accuracy (92.6%) contains only the first 14 genes. Other sets with similar accuracy adding additional helper genes also exist.
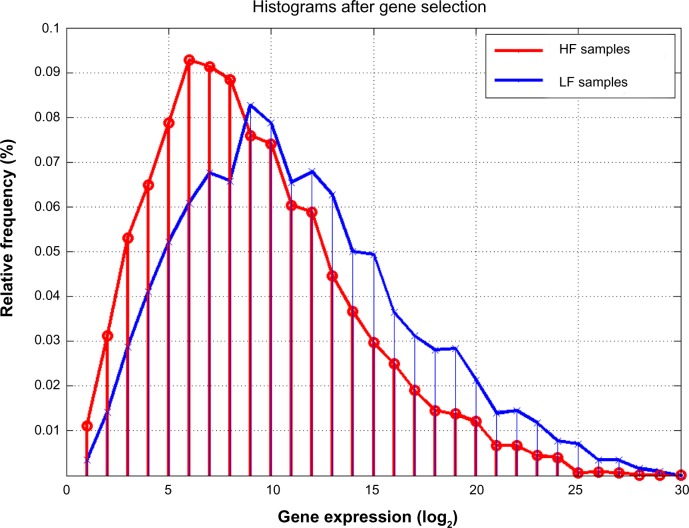
When a histogram was used to assess the first 360 most discriminatory genes found by our analysis, we noted a shift of the mode of distribution for the LF patients to higher expressions (29–210) with respect to the HF case (26–27), suggesting that HF patients show mostly lower expressions of these genes that we hypothesized were responsible for this phenotypic discrimination (Fig. 7).
Figure 7.
Histograms (in log2 scale) for the Low Fatigue (LF) and High Fatigue (HF) patients, of the first 360 most discriminatory genes. Compared to Figure 3, a higher discrimination in the modes of the LF/HF phenotypes can be observed: the mode of HF samples is shifted to lowest values (approximately 64 instead of 512).
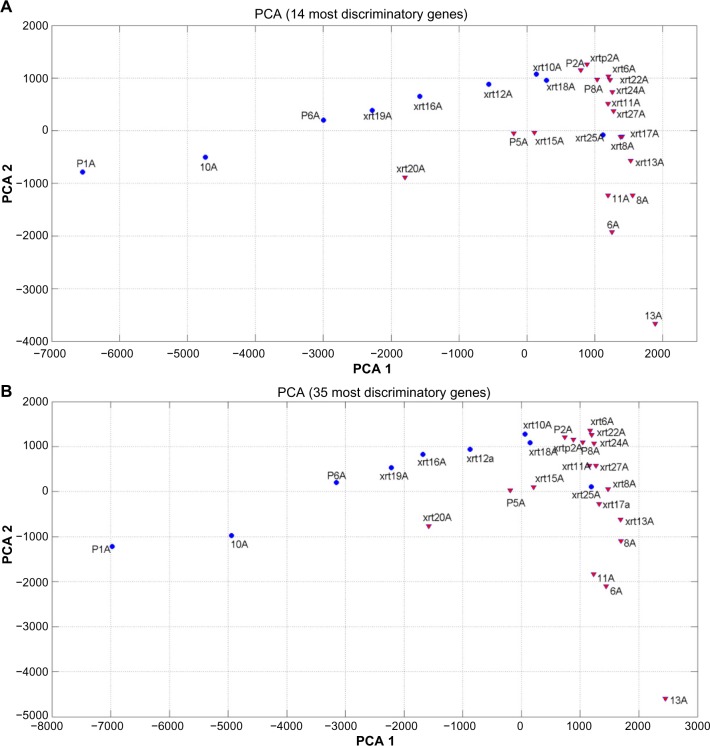
Figure 8 shows the PCA plots (unsupervised method) of the learning dataset expressed in the base of the most 14 (Fig. 8A) and 35 (Fig. 8B) discriminatory genes having the highest predictive accuracy. The following can be observed:
-
The LF/HF phenotype discrimination became linearly separable in these reduced sets of genes, confirming the fact that the classification problem simplifies when reducing the dimension to the most discriminatory set of genes. Both plots have a similar structure.
The LF samples lie between samples P1A and xrt28A, which is genetically close to the region of the HF samples.
Also, sample xrt25A, which belongs to the LF category, is surrounded by HF samples. This sample might be a biological or behavioral outlier.
The HF samples lie between samples xrtp2A and 13A. Sample xrt20A also seems to mark a transition between LF and HF samples toward the west of the plot.
Figure 8.
(A) PCA plot for the learning set in the reduced base of the 14 most discriminatory genes. (b) PCA plot for the learning set in the reduced base of the 35 most discriminatory genes. A linear separability with a similar structure can be observed in both cases. Low Fatigue samples lie between P1A and xrt18A. Xrt25A might be a biological or behavioral outlier. High Fatigue (HF) samples lie between 13A and xrtp2A. Xrt20A marks the HF limit towards the west of the plot. Additional data are needed to perfectly delineate this PCA plot.
Interpretative phenomenological analysis
Interpretative phenomenological analysis (IPA) revealed that the 575 highly discriminatory genes were associated with the following canonical pathways: B cell development, autoimmune thyroid disease signaling, allograft rejection signaling, graft-versus-host disease signaling, and Nur77 signaling in T lymphocytes. Further, the differentially expressed genes were associated with the following functional networks: cancer and neurological disease. Additional IPA was performed on the 360 most predictive genes (having a learning predictive accuracy higher than 81%), a part of the 575 highly discriminatory genes, and it revealed concordance of pathway attributions observed in the initial IPA. The top canonical pathways of the 360 most predictive genes remained to be related to B cell development, but it also revealed other focused pathways related to T helper cell differentiation and interferon signaling. The top functional networks of the 360 genes remained to be related to cancer, followed by neurological disease and psychological disorders, suggesting that the most predictive genes are related to behavior experienced by cancer patients.
Validation
Seventeen subjects, independent of the training set, were used to assess the validity of the learned predictive model. Seven were classified as HF (mean FACT-F change = −10.6 ± 6.9) and 10 were LF (mean FACT-F change = 0.8 ± 2.2) subjects.
The prediction was based on majority voting, as follows:
We first considered the most predictive gene cluster, a group consisting of the 14 most discriminatory genes deduced from the learning set, and the values of the expressions of these genes on both classes (LF and HF) represented in the training dataset. The samples of the training set expressed in the reduced base and their phenotype information were used to define the distance of the NN classifier used in this paper.
Second, the values of these discriminatory genes in the validation samples were read from the validation dataset. For each sample of the validation set, its predicted class was established using the k-NN algorithm, using the 14 different most discriminatory reduced sets of genes that were defined by the learning dataset. For instance, given the base composed by three first genes of the 14-size reduced set of genes, the k-NN algorithm calculated the distance defined in three-dimensional space between each validation sample and the samples of the training dataset belonging to each phenotype class. The class with the minimum distance was then predicted for the validation sample. This was repeated for the 14 different reduced bases, which yielded 14 different class predictions for each sample in the validation set.
The final estimated class was then made by consensus or majority voting classifiers.28 A posterior probability was given to the class prediction, defined as the ratio of the number of votes assigned to the predicted class and the total number of voters. For example, if a validation sample has 12 predictions in the LF class (and two in the HF class), the posterior probability to belong to LF will be 12/14.
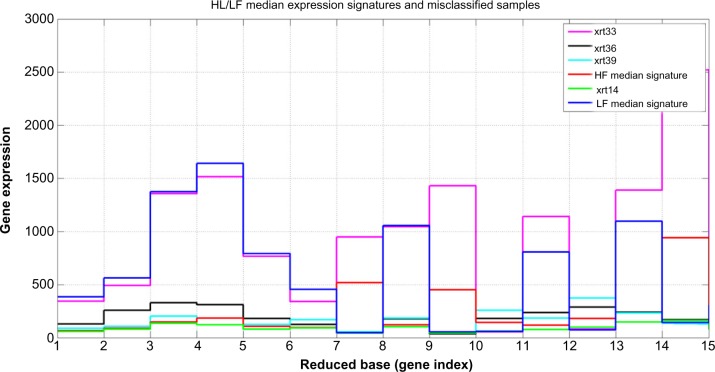
The application of this algorithm provided 13 successes out of 17 validation samples. Three of the four misclassified samples belonged to the LF group (false positives, patients were predicted to be HF) and one to the HF (false negative, patient predicted to be LF). These samples are outliers with respect to this classifier, because their expressions in the reduced base of genes are closer to the HF and LF groups, respectively (Tables 2, 3, and Fig. 9). Interestingly, the 14 different predictions for these misclassified samples coincide, that is, the probability of these samples belonging to their predicted class according to the consensus criterion is 1. This fact also strengthens the argument that these samples are biological or behavioral outliers, that is, their class assignment based on the change in their FACT-F scores was ambiguous.
Table 2.
Mean values for the 14 most discriminatory genes.
| HF IN LEARNING | LF IN LEARNING | HF IN VALIDATION | LF IN VALIDATION |
|---|---|---|---|
| 114 | 388 | 117 | 401 |
| 152 | 644 | 143 | 546 |
| 302 | 1455 | 326 | 1569 |
| 343 | 1659 | 364 | 1535 |
| 185 | 861 | 196 | 841 |
| 149 | 611 | 127 | 460 |
| 585 | 128 | 381 | 194 |
| 243 | 1182 | 252 | 1049 |
| 689 | 111 | 536 | 235 |
| 160 | 65 | 75 | 126 |
| 247 | 1225 | 275 | 1187 |
| 223 | 80 | 73 | 171 |
| 269 | 1329 | 331 | 1573 |
| 1200 | 281 | 1083 | 485 |
Notes: Mean values of the 14 most discriminatory genes in the High Fatigue/Low Fatigue groups in the learning and the validation phases. Observe the coherence in values in both phases. Bold values indicate the highest mean expression values in the learning and validation datasets for HF and LF classes.
Table 3.
Misclassified samples.
| S1 (XRT14) | S2 (XRT36) | S3 (XRT39) | S4 (XRT33) |
|---|---|---|---|
| 57 | 129 | 87 | 342 |
| 78 | 257 | 105 | 492 |
| 136 | 327 | 201 | 1354 |
| 122 | 309 | 183 | 1514 |
| 79 | 180 | 125 | 765 |
| 92 | 126 | 168 | 3 41 |
| 42 | 44 | 54 | 946 |
| 103 | 175 | 184 | 1045 |
| 41 | 34 | 49 | 1430 |
| 62 | 178 | 258 | 52 |
| 77 | 234 | 183 | 1142 |
| 97 | 286 | 374 | 82 |
| 146 | 239 | 232 | 1388 |
| 162 | 167 | 137 | 2518 |
Notes: Misclassified samples. Expressions for the 14 most discriminatory probes. Samples S1, S2 and S3 were predicted to be High Fatigue and S4 to be Low Fatigue. The expression values for S1, S2 and S3 were closer to the mean expression of the High Fatigue group in the learning phase. Conversely, the expression values for S4 is closer to the Low Fatigue group. S1, S2 and S3 might define a new group of Low Fatigue with very small expressions (lower than the corresponding expressions observed among High Fatigue subjects) in this reduced base of 14 genes.
Figure 9.
High Fatigue (HF)/Low Fatigue (LF) median expression signatures and misclassified samples at validation. It can be observed that sample xrt33 is closer to LF median signature, while xrt14, xrt36 and xrt39 are closer to the HF median signature (values for the expressions are given in tables 2 and 3).
Discussion
We have described a novel analytical algorithm to predict radiation-related fatigue. RT is a highly utilized treatment option for many forms of cancer. While it is efficacious in many cases, its toxicity profile is significant and common, but not ubiquitous. Consequently, the ability to predict toxicities of RT has long been of interest. With better understanding of the pathobiology of radiation injury, using genomics as the basis for toxicity risk prediction has been the focus of active research.29 In contrast to the toxicity presented in this paper, the primary toxicity phenotypes studied have been tissue-centric injuries such as mucositis, dermatitis, and pneumonitis and fibrosis.30 And the primary approaches used to try to identify predictive relationships between genes or SNPs and toxicities have primarily relied on candidate gene or genome-wide association analyses. In both cases, the majority of investigations have sought to identify one or two genes or SNPs associated with the phenotype of interest. The resulting lack of consistency of results has been disappointing.31
Our approach differed in that we proposed that the risk of a complex disease, such as CTRF, could well be more easily defined by identifying groups of simultaneously expressed, synergistically functioning genes. While this hypothesis is supported by studies in which Bayesian network development was used to identify SNP clusters predictive of chemotherapy-related side effects,11–13 we sought to accelerate and simplify the analytical process through the use of a novel method in which we used a sequence of supervised and learned (unsupervised) “filters” to identify the most predictive cluster of genes for CTRF. Our finding that the gene cluster so identified was then able to predict CTRF risk with an accuracy of >75% suggests that the approach has validity.
The process of selecting the most predictive cluster of genes revealed informative considerations. For example, the genes with the highest fold change did not coincide with those exhibiting the highest FR because the means of both distributions were different, hence their tails did not overlap. So, in this method we concluded that FR was a better feature selection method than fold change. While, in the case of fold-change analysis, noisy genes are typically penalized by the FR selection method because of an increase of their variance; the noise might be amplified by the fold-change ratio. Genes with the highest FR and fold change have the biggest discriminatory power and are assumed to be involved in the genesis of fatigue.
Interestingly, the histogram analysis of the first 360 genes that most discriminated between HF and LF subjects was informative in that the shift of the mode of distribution showed lower expressions of these genes among HF subjects. It seems possible that it is this distributional shift that ultimately is responsible for discriminating the fatigue phenotype in this population.
We were unable to correctly predict four samples, based on our phenotypic approach, since the consensus provides the opposite class in all the cases. These classified samples were close to the border of separation between both fatigue classes (Fig. 8). There are three possibilities: (1) these samples are behavioral outliers, (2) the phenotypic approach needs further review and improvement, especially dealing with samples that are bordering the cut-off scores set for fatigue grouping, and (3) possible use of more sophisticated algorithms (black box neural networks) to classify the samples may be needed, which could run the risk of losing the clarity in the interpretation.
We recognize that this study was limited by its small sample size. Nonetheless, the fact that the analysis was successful in predicting LF/HF in an unrelated population with reasonable accuracy suggests that increasing the number of subjects in the training population would likely improve the predictive model’s ability. Nevertheless, this analysis confirms that it is possible to separate both classes of the LF/HF phenotype by reducing the dimension to the most discriminatory genes, provided by their FR.
The importance of predicting toxicity or adverse event risk associated with cancer treatment regimens cannot be understated as the clinical implications in personalizing cancer therapy and prospectively attenuating toxicity risk are significant. Furthermore, this type of information provides patients and their care-givers more specific knowledge upon which to make treatment decisions.
Conclusion
A novel analytical algorithm introduced in this study that incorporates fold-change differential analysis, linear discriminant analysis, and a k-NN can predict radiation-related fatigue in men with non-metastatic prostate cancer. Applicability of this novel algorithm to detect other treatment-related toxicities in other cancer populations would be worthwhile to pursue.
Footnotes
Author Contributions
Conceived and designed the experiments: LS, SS. Analyzed the data: LS, JLFM, EdG, SS. Wrote the first draft of the manuscript: LS, JLFM. Contributed to the writing of the manuscript: LS, JLFM, EdG, SS. Agree with manuscript results and conclusions: LS, JLFM, EdG, SS. Jointly developed the structure and arguments for the paper: LS, JLFM, EdG, SS. Made critical revisions and approved final version: LS, JLFM, EdG, SS. All authors reviewed and approved of the final manuscript.
ACADEMIC EDITOR: JT Efird, Editor in Chief
FUNDING: This study was supported by the Division of Intramural Research of the National Institute of Nursing Research of the NIH, Bethesda, Maryland, and Biomodels, LLC, Watertown, MA. The authors confirm that the funder had no influence over the study design, content of the article, or selection of this journal.
COMPETING INTERESTS: Authors disclose no potential conflicts of interest.
Paper subject to independent expert blind peer review by minimum of two reviewers. All editorial decisions made by independent academic editor. Upon submission manuscript was subject to anti-plagiarism scanning. Prior to publication all authors have given signed confirmation of agreement to article publication and compliance with all applicable ethical and legal requirements, including the accuracy of author and contributor information, disclosure of competing interests and funding sources, compliance with ethical requirements relating to human and animal study participants, and compliance with any copyright requirements of third parties. This journal is a member of the Committee on Publication Ethics (COPE).
REFERENCES
- 1.Carlotto AA, Hoqsett VL, Maiorini EM, Razulis JG, Sonis ST. The economic burden of toxicities associated with cancer treatment: review of the literature and analysis of nausea and vomiting, diarrhea, oral mucositis and fatigue. Pharmacoeconomics. 2013;31:753–66. doi: 10.1007/s40273-013-0081-2. [DOI] [PubMed] [Google Scholar]
- 2.Minton O, Richardson A, Sharpe M, Hotopf M, Stone P. A systematic review and meta-analysis of the pharmacological treatment of cancer-related fatigue. J Natl Cancer Inst. 2008;100:1155–66. doi: 10.1093/jnci/djn250. [DOI] [PubMed] [Google Scholar]
- 3.Mock V. Clinical excellence through evidence-based practice: fatigue management as a model. Oncol Nurs Forum. 2003;30:787–96. doi: 10.1188/03.onf.787-795. [DOI] [PubMed] [Google Scholar]
- 4.Fransson P. Fatigue in prostate cancer patients treated with external beam radiotherapy: a prospective 5-year long-term patient-reported evaluation. J Cancer Res Ther. 2010;6:516–20. doi: 10.4103/0973-1482.77076. [DOI] [PubMed] [Google Scholar]
- 5.Hofman M, Ryan JL, Figueroa-Moseley CD, Jean-Pierre P, Morrow GR. Cancer-related fatigue: the scale of the problem. Oncologist. 2007;12:4–10. doi: 10.1634/theoncologist.12-S1-4. [DOI] [PubMed] [Google Scholar]
- 6.Miaskowski C, Paul SM, Cooper BA, et al. Trajectories of fatigue in men with prostate cancer before, during, and after radiation therapy. J Pain Symptom Manage. 2008;35(6):632–43. doi: 10.1016/j.jpainsymman.2007.07.007. [DOI] [PMC free article] [PubMed] [Google Scholar]
- 7.Bower JE, Ganz PA, Tao ML, et al. Inflammatory biomarkers and fatigue during radiation therapy for breast and prostate cancer. Clin Cancer Res. 2009;15:5534–40. doi: 10.1158/1078-0432.CCR-08-2584. [DOI] [PMC free article] [PubMed] [Google Scholar]
- 8.Ryan JL, Carroll JK, Ryan EP, et al. Mechanisms of cancer-related fatigue. Oncologist. 2007;12:22–34. doi: 10.1634/theoncologist.12-S1-22. [DOI] [PubMed] [Google Scholar]
- 9.Courtier N, Gambling T, Enright S, Barrett-Lee P, Abraham J, Mason MD. A prognostic tool to predict fatigue in women with early-stage breast cancer undergoing radiotherapy. Breast. 2013;22:504–9. doi: 10.1016/j.breast.2012.10.002. [DOI] [PubMed] [Google Scholar]
- 10.Hwang SS, Chang VT, Rue M, Kasimis B. Multidimensional independent predictor of cancer-related fatigue. J Pain Symptom Manage. 2003;26:604–14. doi: 10.1016/s0885-3924(03)00218-5. [DOI] [PubMed] [Google Scholar]
- 11.Schwartzberg LS, Sonis ST, Walter MS, et al. Single nucleotide polymorphism Bayesian networks predict risk of chemotherapy-induced side effects in patients with breast cancer receiving dose dense doxorubicin/cyclophosphamide plus paclitaxel (AC+T) Cancer Res. 2012;72(suppl):1–15–12. [Google Scholar]
- 12.Sonis ST, Schwartberg LS, Walker MS, et al. Predicting risk of chemotherapy-induced side effects in patients with colon cancer with single-nucleotide polymorphisms (SMP) Bayesian networks. J Clin Oncol. 2013;(Suppl 4) abstr 344. [Google Scholar]
- 13.Sonis S, Haddad R, Posner M, et al. Gene expression changes in peripheral blood cells provide insight into the biological mechanisms associated with regimen-related toxicities in patients being treated for head and neck cancers. Oral Oncol. 2007;43(3):289–300. doi: 10.1016/j.oraloncology.2006.03.014. [DOI] [PubMed] [Google Scholar]
- 14.Yellen SB, Cella DF, Webster K, Blendowski C, Kaplan E. Measuring fatigue and other anemia-related symptoms with the Functional Assessment of Cancer Therapy (FACT) measurement system. J Pain Symptom Manage. 1997;13:63–74. doi: 10.1016/s0885-3924(96)00274-6. [DOI] [PubMed] [Google Scholar]
- 15.Yost KJ, Eton DT, Garcia SF, Cella D. Minimally important differences were estimated for six patient-reported outcomes measurement information system-cancer scales in advanced-stage cancer patients. J Clin Epidemiol. 2011;64(5):507–16. doi: 10.1016/j.jclinepi.2010.11.018. [DOI] [PMC free article] [PubMed] [Google Scholar]
- 16.Moberg PJ, Lazarus LW, Mesholam RI, et al. Comparison of the standard and structured interview guide for the Hamilton Depression Rating Scale in depressed geriatric inpatients. Am J Geriatr Psychiatry. 2001;9(1):35–40. [PubMed] [Google Scholar]
- 17.Hsiao CP, Wang D, Kaushal A, Chen MK, Saligan L. Differential expression of genes related to mitochondrial biogenesis and bioenergetics in fatigued prostate cancer men receiving external beam radiation therapy. J Pain Symptom Manage. 2014 doi: 10.1016/j.jpainsymman.2014.03.010. Epub ahead of print. [DOI] [PMC free article] [PubMed] [Google Scholar]
- 18.Mayer C, Popanda O, Greve B, et al. A radiation-induced gene expression signature as a tool to predict acute radiotherapy-induced side effects. Cancer Lett. 2011;302:20–8. doi: 10.1016/j.canlet.2010.12.006. [DOI] [PubMed] [Google Scholar]
- 19.Qiagen Ingenuity pathway analysis: calculating and interpreting the p-values for functions, pathways and lists in IPA. Retrieved from http://www.qiagen.com/ingenuity.
- 20.Tusher VG, Tibshirani R, Chu G. Significance analysis of microarrays applied to the ionizing radiation response. Proc Natl Acad Sci USA. 2001;98(18):5116–21. doi: 10.1073/pnas.091062498. [DOI] [PMC free article] [PubMed] [Google Scholar]
- 21.Fisher RA. Has Mendel’s work been rediscovered? Ann Sci. 1936;1:115–37. [Google Scholar]
- 22.Guyon I, Weston J, Barnhill S, Vapnik V. Gene selection for cancer classification using support vector machines. Mach Learn. 2002;46(1–3):389–422. [Google Scholar]
- 23.Kohavi R. A study of cross-validation and bootstrap for accuracy estimation and model selection. Proc Fourteenth Int Joint Conf Artif Intell. 1995;2(12):1137–43. [Google Scholar]
- 24.Prestini E. The Evolution of Applied Harmonic Analysis: Models of the Real World. New York, NY: Springer; 2004. [Google Scholar]
- 25.Cover TM, Hart PE. Nearest neighbor pattern classification. IEEE Trans Inform Theory. 1967;13(1):21–7. [Google Scholar]
- 26.Epstein JI, Allsbrook WC, Jr, Amin MB, Egevad LL. ISUP Grading Committee: the 2005 International Society of Urological Pathology (ISUP) Consensus Conference on Gleason Grading of Prostatic Carcinoma. Am J Surg Pathol. 2005;29:1228–42. doi: 10.1097/01.pas.0000173646.99337.b1. [DOI] [PubMed] [Google Scholar]
- 27.Campbell T, Blasko J, Crawford ED, et al. Clinical staging of prostate cancer: reproducibility and clarification of issues. Int J Cancer. 2001;96:198–209. doi: 10.1002/ijc.1017. [DOI] [PubMed] [Google Scholar]
- 28.Gareth J. Majority Vote Classifiers: Theory and Applications [PhD dissertation] Stanford University; 1998. [Google Scholar]
- 29.Andreassen CN, Alsner J. Genetic variants and normal tissue toxicity after radiotherapy: a systematic review. Radiother Oncol. 2009;92:299–309. doi: 10.1016/j.radonc.2009.06.015. [DOI] [PubMed] [Google Scholar]
- 30.West CM, Barnett GC. Genetics and genomics of radiotherapy toxicity: towards prediction. Genome Med. 2011;3:52–67. doi: 10.1186/gm268. [DOI] [PMC free article] [PubMed] [Google Scholar]
- 31.Andreassen CN. The biological basis for differences in normal tissue response to radiation therapy and strategies to establish predictive assays for individual complication risk. In: Sonis S, Keefe DM, editors. Pathobiology of Cancer Regimen-Related Toxicities. New York, NY, USA: Springer; 2013. pp. 19–33. [Google Scholar]
- 32.Cui X, Churchill GA. Statistical tests for differential expression in cDNA microarray experiments. Genome Biol. 2003;4(4):210. doi: 10.1186/gb-2003-4-4-210. [DOI] [PMC free article] [PubMed] [Google Scholar]


