

Abstract
The intestinal microbes residing in the red palm weevil (RPW, Rhynchophorus ferrugineus) larva consume tender interior fibrous tissues of date palm trunks. The understanding of such microbiota at molecular level provides vital clues for the biological control of this devastating pest. Using pyrosequencing and shotgun strategy, we first study taxonomic profiles of the microbiota sampled at different months (March, July and November), and then confirm the impact of high-temperature stress on the microbial populations based on data from 16S rRNA amplicons using both field and laboratory samples. We further identify Klebsiella pneumoniae in November and Lactococcus lactis in July as the dominant species of the microbiota. We find that the RPW gut microbiota degrades polysaccharides and sucrose with hydrolases and that different active bacterial species in November and July are responsible for the symbiotic relationship between the microbiota and the host. Our results provide vital information for pest control and cellulolytic bacterial species characterization.
Introduction
The red palm weevil (RPW, Rhynchophorus ferrugineus) is an extremely devastating pest for many palm species, including the top three palm crops: date palm (DP, Phoenix dactylifera L.), oil palm (Murphy and Briscoe, 1999) and coconut (Faleiro, 2006). R. ferrugineus undergoes complete metamorphosis and has a life cycle going through egg, larva, pupa and adult stages, most of which occur inside palm tree trunks. It has optimal growth temperatures ranging from 25°C to 32°C but is able to tolerate higher temperatures even above 50°C in the summer and lower temperatures less than 10°C in the winter (Augstburger et al., 2002). Rhynchophorus ferrugineus feeds on tender tissues in palm trunks, which contain mostly lignocellulose and tree sap, alters the health of palm trees by leaving large tunnels, hollows and enormous brownish waste inside and eventually kills the trees.
There have been a few studies on biodiversity of the RPW gut microbiota. One study has reported the identification of aerobes and facultative anaerobes (Bacillus sp., Salonella sp., Enterococcus sp. and Xanthomonas sp.) and suggests that these microbes are potential contributors to the weevil's digestive system and nutrient absorption (Khiyami and Alyamani, 2008). Since R. ferrugineus often hides inside palm trunks except for mating and egg laying, it is usually difficult to find both adults and larvae, let alone trying to eliminate them with chemical insecticides. Obviously, biocontrol strategy becomes a priority and understanding of the microbial community residing in the weevil gut certainly helps in identifying potential insect pathogens; some of them have been identified, including Bacillus sphaericus, Bacillus megaterium, Bacillus laterosporus (Salama et al., 2004), and Pseudomonas aeruginosa (Banerjee and Dangar, 1995).
It has been known that ruminants primarily consume herbaceous plants and that xylophagous insects (e.g. termites) are adapted to feeding on wood (Watanabe and Tokuda, 2010). Therefore, lignocellulose degradation is expected to be vital for survival. However, most animals cannot utilize cellulose, and to date, only 27 insects have been reported to seize cellulase genes encoding glycoside hydrolase (GH) family 9 (Watanabe and Tokuda, 2010). In this particular case, symbiotic microbiotas are suggested to play a key role in the complex processes of lignocellulose degradation and conversion. It has been reported that the bacterial community residing in the intestine of termites possesses genes for cellulose and xylan hydrolysis based on a metagenomic analysis since termites are one of the typical wood-degrading organisms (Warnecke et al., 2007). Neverthelss, R. ferrugineus may provide an alternative model for the study of biomass-degrading microbes although it only consumes the fresh and tender part of palm trees.
A previous study on the RPW gut microbiota has conducted a 16S rRNA-based survey for aerobic and facultative anaerobic bacteria, focusing on larvae reared in the laboratory (Khiyami and Alyamani, 2008). However, more metagenomic studies have been performed on other animals by using the next-generation sequencing platforms (Harkins and Jarvie, 2007; Warnecke et al., 2007; Qin et al., 2010; Hess et al., 2011); high-coverage shotgun sequencing and longer read length are both necessary for sufficient identification of the RPW gut metagenomes. In this study, using pyrosequencing, we have first generated metagenomic data sets from three larval and one adult beetle samples from the field at different seasonal time points and then validated the results using amplified 16S rRNAs on laboratory-reared larvae at the corresponding temperatures. We have also analysed our data using the CAZyme gene clustering tool and identified the responsible bacterial species involved in plant material degradation. All raw data have been submitted to the Short Read Archive [SRA, National Center for Biotechnology Information (NCBI)] under the accession number of SRA048230.2 and the sequences of 16S rRNA amplicon, and annotated open reading frames (ORFs) of glycoside hydrolases have been deposited in GenBank under accession numbers of KF114898-KF128735.
Results
Data acquisition
We acquired 1.8-Gb (approximately 5.3 million reads) pyrosequencing data from four field samples (larva: March, July and November; adult: Adult), and this data set represents the first large-scale metagenomic survey for the RPW gut metagenome (Table 1, Figs S1 and S2). To evaluate sample quality, we estimated that there were ∼ 50% bacterial content in July and November, and the content was reduced to less than half in March and Adult due to worse genomic DNA contaminations from both R. ferrugineus and P. dactylifera. After removing the DNA contaminants based on the genomic contigs of both R. ferrugineus (Ibrahim S. Al-Mssallem and Jun Yu, personal communication) and P. dactylifera (GenBank with BioProject ID PRJNA83433), we had 1.3-Gb (approximately 3.2 million reads) sequences remained for further annotation and analysis. We submitted the data set to the public database (Short Read Archive, SRA048230.2) and placed the filtered shotgun reads on our web site (http://www.kacst.edu.sa/en/depts/jcg/researchwork/Pages/default.aspx).
Table 1.
A summary of data from shotgun sequencing
| March | July | November | Adult | |
|---|---|---|---|---|
| Number of reads | 1 090 571 | 1 588 008 | 1 580 516 | 1 019 288 |
| Accumulative raw data (Mb) | 376.3 | 569.5 | 565.1 | 292.5 |
| Reads after filteringa | 278 372 | 1 359 301 | 1 324 344 | 213 357 |
| Accumulative data after filteringa (Mb) | 119.7 | 580.2 | 556.5 | 76.1 |
| Bacterial reads (%)b | 17.2% | 49.2% | 50.6% | 4.3% |
| RPW reads (%)b | 47.7% | 2.6% | 5.4% | 47.6% |
| DP reads (%)b | 12.9% | 2.7% | 4.7% | 15.3% |
Filtering was done by running BLASTN against the RPW and DP genomes (contigs) with a cut-off E-value 1e-3.
The fraction of matched reads of bacterial, RPW and DP sequences is calculated based on the number of reads matched their genome sequences over the sum of all reads. Data of bacterial genomes were downloaded from NCBI.
Taxonomic analysis of the RPW gut microbiota
We classified most of the bacterial sequences of the larval samples at the kingdom level by aligning (BLAST) them against the NCBI nucleotide (nt) database and assigning them to Bacteria, Archaea, Eukaryota and Viruses in megan version 4.50.5 (Huson et al., 2011). We made two observations here. First, the adult library has the greatest Eukaryota content (84.52%), which is likely due to the unavoidable contamination of the insect host cells since the adult RPW gut is very thin and fragile. Second, archaeal species are only identified in November and July, whereas viruses are more abundantly detected in March and Adult (Table 2).
Table 2.
Kingdom-level annotations based on pyrosequencing data
| March | July | November | Adult | |
|---|---|---|---|---|
| Bacteria | 72.69% | 97.06% | 94.86% | 15.18% |
| Archaea | 0 | 0.04% | 0.05% | 0 |
| Eukaryota | 27.11% | 2.89% | 5.08% | 84.52% |
| Viruses | 0.20% | 0.02% | 0.01% | 0.30% |
The ratio (%) is calculated based on the assigned reads for each kingdom over all assigned reads.
We further classified the sequences at the lower taxonomic levels. At the phylum level, Proteobacteria dominate the metagenomes. Phylogenetic clustering reveals that March and November are grouped into a single branch with more Tenericutes (11.17% and 14.51% respectively), whereas July is grouped into a separate clade with more Firmicutes (20.66%) (Fig. 1, Table S1). Adult shows an intermediate profile at this level, likely due to the fact that this sample contains gut samples pooled from a number of beetles collected either in March or May. Our analysis further confirms the speculation (Fig. S3): the profile of November appeared closer to March (R2 = 0.975) as compared to July (R2 = 0.691) and Adult (R2 = 0.825). The phylum-level profiles suggest strong seasonal dynamics of RPW gut microbiota. Further examination of the relationship between R. ferrugineus (individual variation) and its gut microbiota, we were able to exclude individual difference since a pool of individual weevils was used for each library. In addition, R. ferrugineus and its larva inhabit an enclosed environment inside a palm tree trunk, and abiotic factors may have very little influence on its lifestyle, especially that of larvae. However, there are still several factors to be considered; one of them is temperature. The atmospheric temperatures in March and November are relatively cool in Saudi Arabia but become extremely hot in July (Fig. S2). The temperature change (i.e. July vs. March and November in this study) appeared to have significant influence on the RPW gut microbiota.
Figure 1.
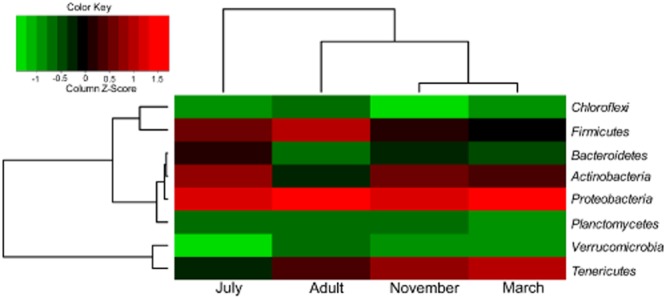
Hierarchical clustering of the four shotgun samples according to relative bacterial abundance at the phylum level. Phyla with relative abundance of more than 0.01 are used for the analysis and represent the major bacterial structure: 99.9%, 99.79%, 99.99% and 100% for November, July, March and Adult respectively. A double hierarchical dendrogram based on correlation distance and complete linkage method in hclust package of R software shows the relative abundance of phylum designations according to BLASTN alignment to the nt database with an E-value cut-off 1e-10 (MEGAN). The heat map represents Z-score, and the column Z-Score means that the rows are centred and scaled by subtracting the mean of the column from every value and further divided by standard deviation of the column.
Verification of temperature effect based on 16S rRNA amplicon survey
To confirm the temperature effect, we acquired comparative 16S rRNA amplicon results that were generated by using pyrosequencing and bar coded primers (Table S2); the samples contained both larvae collected in the field and reared in the laboratory for the comparative purpose. We divided the field samples – larvae collected in November – into two groups and continuously reared them in the laboratory in parallel under either low (Cold) or high (Hot) temperatures (Table S3). First, our 16S rRNA amplicon analysis yielded almost identical profiles to samples collected from the field at the phylum level (Fig. 2, Table S4); the two major groups correspond to the relative temperatures: low (Cold, March and November) and high (Hot, May and July) temperatures, when we used Adult as an out-group. Second, this grouping scheme was also confirmed by the dendrogram trees that show similarity in operational taxonomic unit (OTU) structure among the six larval amplicon datasets (Fig. S4, Table S5). Data from Cold formed a sister clade to those of November and March under the OTU distance cut-offs of 0.03, 0.05 and 0.1. It is obvious that the Hot-associated microbial profile becomes similar to those of July and May (much hotter than March and November), whereas the Cold-associated microbial profile remains similar to that of November. This result also supports the conclusion that Tenericute and Firmicute dominances are characteristic for the low temperature and high temperature groups respectively. The binned representative reads in the seven amplicon samples (Adult, Cold, Hot, July, March, May and November) were deposited in GenBank (KF114898-KF116096). All processed 16S rRNA amplicon reads can be retrieved from our web site (http://www.kacst.edu.sa/en/depts/jcg/researchwork/Pages/default.aspx), and the related raw data can also be found in the public database (Short Read Archive, SRA048230.2).
Figure 2.
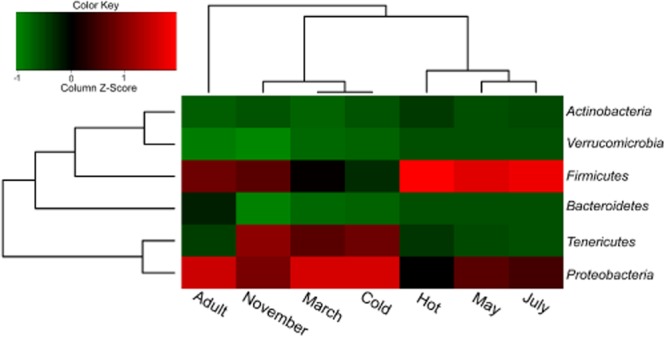
Hierarchical clustering of the seven amplicon samples based on bacterial phylum abundance. Phyla with relative abundance of more than 0.01 within five field samples and two laboratory samples are used for the clustering analysis on the major bacterial structure: March, 100%; May, 99.59%; July, 99.79%; November, 99.68%; Hot, 99.79%; Cold, 99.84% and Adult, 99.96%. The relative abundance at phylum level is calculated based on taxonomy assignment by using the RDP classifier software. The heat map is drawn in a similar way as in Fig. 1.
The major bacterial groups in the RPW gut
The diverse bacterial community in the RPW gut consisted of 50 common species, accounted for > 80% of the total species present (Table S6). The most abundant species are Klebsiella pneumoniae in November and March and Lactococcus lactis in July and Adult. The species profile of November is closer to that of March (R2 = 0.906), but is very different from those of July (R2 = 0.012) and Adult (R2 = 0.015); the result is consistent with that of the phylum clustering. A total of 23.3% species of the November microbial community have been shown to play roles in cellulolytic digestion, which include K. pneumoniae in Bombyx mori (Anand et al., 2010), Enterobacter cloacae in termites (Warnecke et al., 2007) and Pantoea sp. At-9b in the fungal gardens of leaf-cutter ants (Suen et al., 2010). Some dominant Proteobacteria have been known to have cellulolytic ability, such as Klebsiella, Enterobacter and Pantoea, and have also been identified in other insect microbiotas, such as those of the leaf-cutter ant and sugarcane weevil (Suen et al., 2010; Rinke et al., 2011). In contrast, lactic acid bacteria (LAB), including L. lactis, Bifidobacterium bifidum and Bifidobacterium longum (Kailasapathy and Chin, 2000), are well represented, 32.3% of the total species in July. In addition, we found some bacterial species specifically abundant in Adult, such as, Acinetobacter baumannii, Acidovorax avenae, Buchnera aphidicola, Pseudomonas mendocina and Pseudomonas aeruginosa.
Taxonomic analysis of archaea, fungi and viruses
We also classified archaea, viruses and fungi in our shotgun data sets. In general, there were very few archaeal species, but more Halobacteria and Methanobacteria found in November as well as more Methanomicrobia species in July (Table S7). The most abundant archaeal species in November, Halalkalicoccus jeotgali, is thought to be involved in fermented seafood (Roh et al., 2009). Moreover, the primary archaeal species in July, Methanosarcina barkeri, is able to convert lactate and acetate into methane (Mountfort et al., 1982).
Fungi constitute a minor part of the gut metagenome in July, representing only 0.24% of all the assigned reads (Table S8), but we observed an obvious increase of yeast sequences in November (2.29%). Yeast are known to play roles in fermentation of the infested date palm trunk and can improve its nutritional quality (Abe et al., 2010). Candida tropicalis appeared to be the most abundant yeast in November and July (1.46% and 0.05% of all the assigned reads respectively) and followed by Saccharomyces cerevisiae (0.25% and 0.02% respectively). We found that methanogens, including Methanobacteria and Methanomicrobia, are more prevalent in July but with less yeast, as compared to that in November (Tables S7 and S8). The result should be useful for understanding the interaction between methanogen microorganisms and various yeast in the gut (Chaucheyras-Durand et al., 2008).
Because some of our samples are suspected to be contaminated to different extents by the host cells prior to DNA extraction, such as March and Adult, we identified more host-borne viruses in these samples (Table S9), such as the insect bracovirus Cotesia sesamiae. Compared to the viral sequences of November, we identified much fewer viruses in July (0.0299% vs. 0.0072%). Interestingly, in November we also found bacteriophages that infect diverse bacterial species and are anti-bacterial candidates for controlling the gut microbiota.
Recruitment analysis
We further mapped our data sets to the 34 most relevant bacterial genomes, and confirmed the two dominant species, L. lactis in July and K. pneumoniae in November (Table S10), and that the best-covered genome is L. lactis subsp. The sequence of lactis Il1403 has a mapping rate of 81.94% (10.4x genome coverage). The second best mapped species is K. pneumoniae NTUH-K2044, with 74.79% of its genome covered (6.87x). We identified several subspecies of K. pneumoniae and L. lactis, although we were not able to de novo assemble the full genome(s) within the data sets. Our results show that L. lactis in our sample is closer phylogenetically to the subsp. lactis than the subsp. cremoris (Table S11), and we believe that a much higher coverage of the microbiota is of essence for a complete assembly (Luo et al., 2011). We also integrated our analysis results, including the GC content, gene distribution, SNP (single nucleotide polymorphism), and mapped reads, into one recruitment plot (Fig. S5). As a result, we identified certain over-covered intergenic and unmapped regions; the former are composed of largely high GC content sequences, and the latter, which are associated with low GC content sequences, are heterogeneous, homopolymeric and thus poorly mapped. In addition, the presence of numerous SNPs in heavily covered genome regions suggests potential population diversity and is useful for future genetic diversity studies.
Functional classification of the datasets
We used public databases, such as SEED (https://cabig.nci.nih.gov/community/tools/SEED) and KEGG integrated in megan, for our annotation efforts. Similar proportions of the SEED subsystem classification were found between November and July with only minor differences (R2 = 0.975) (Fig. S6) albeit possessing different microbial profiles. The major or essential functions, such as the metabolism of carbohydrates/proteins/DNA and their derivatives, appeared to be similar (Table S12). Most reads for larval samples were assigned to carbohydrates. However, respiration, protein metabolism and RNA metabolism were statistically enriched in Adult in comparison to November (R2 = 0.795). The functional similarities between November, July and March (November vs. July, R2 = 0.968; November vs. March, R2 = 0.992) were also confirmed based on KEGG classification (Table S13).
We assembled the quality processed reads into 46 318 contigs: 2925 in March, 25 920 in July, 16 653 in November and 820 in Adult (Table S14). Two of the libraries, July and November, have longer contigs (maximum of 145 kb and 120 kb respectively) and more singletons (0.5 and 0.4 million respectively). The assembled contigs show increased bacterial contents (∼ 60%) for the larval samples. We combined our de novo assembled contigs and singletons and submitted them to the RAMMCAP annotation pipeline, yielding 524 121 and 636 135 ORFs for November and July respectively, and 193 190 and 268 687 ORFs that have Clusters of Orthologous Groups (COG) hits after cd-hit clustering. The general functional prediction shows that transport and metabolism of amino acids and carbohydrates are top ranking for the three larval metagenomic samples (Table S15).
Glycoside hydrolases and their bacterial origins
For better knowledge on carbohydrate metabolism and the association of genes to major bacterial species, we used ORFs predicted from the shotgun reads (1 638 122, 1 679 690, and 566 082 ORFs for November, July and Adult respectively) for further analysis. The reasons for not using the contigs are twofold. First, we expected to find function-associated bacteria rather than complete protein sequences. Second, correct consensus sequences from de novo assembly are difficult to build due to lower sequence coverage and higher sequence diversity, which may lead to mistakes in identifying bacterial origins. Using the CAZymes Analysis Toolkit (CAT) web service, we screened these read-derived ORFs for candidate proteins that have sequences homologous to carbohydrate metabolic enzymes. We began with more than 30 000 ORFs in July and November and obtained significant matches to at least one relevant glycoside hydrolase (GH). We subsequently determined their bacterial origins based on BLAST results against bacterial genome databases (Table S16).
Since carbohydrate metabolism is very important for studying the R. ferrugineus gut microbiome, we tries to identify ORFs of the related enzymes. First, we identified the catalytic domains for cellulose hydrolysis and found: cellulases (GH8 and GH16), endoglucanases (GH51 and GH5), β-glucosidases (GH1, GH3 and GH30), cellobiose (GH94) and other rare endoglucanases. Among them, GH8, GH3 and GH1 were found in the major bacterial species K. pneumoniae. In contrast, only a few reads of GH8 and GH1 were assigned to L. lactis in July, whereas GH51 is likely specific to B. longum and Bacteroides thetaiotaomicron. This result differs from the previous report that identified GH5, GH51 and GH94 inside the termite gut, which have been assigned to different species (Warnecke et al., 2007). Second, we identified the catalytic domains of xylanase (hemicellulose degradation): GH43, GH8 and GH5, as well as a diverse collection of pentosidase and hemicellulose-debranching enzymes that include GH1, GH2, GH3, GH35, GH36, GH39, GH42, GH53 and many more. Notably, α-mannosidases (GH38 and GH47), most important for mannoside degradation, was found in Adult. Third, the starch hydrolases (α-amylase and oligo-1,6-glucosidase, GH13) were found to be shared by most of the bacteria in tremendous abundance in November and July (also confirmed in Adult despite a different CAZyme profile). In addition, invertase (GH32) and trehalase (GH37) were identified as contributing to hydrolization of sucrose and trehalose respectively. Finally, other CAZyme families were also characterized, such as carbohydrate esterase, pectate lyase and carbohydrate-binding modules (Table S17).
Based on the glycoside hydrolase analysis, we were able to determine the major microbial populations responsible for nutritional metabolism (Fig. 3). First, our results agree with the previous observation where the in vitro fermentation of palm tree sap involves three microbial groups of the endogenous microflora: acetic acid bacteria (AAB), lactic acid bacteria (LAB) and yeast (Stringini et al., 2009). Second, we also found other interesting related enzymes. For instance, K. pneumoniae, an AAB that is the dominant species in November and March, is known to produce acetate as the main end-product under anaerobic conditions (Kästner et al., 2002). Another example is Mesoplasma florum, one of the major species in November and the one that possesses the only ability to degrade sucrose. This species was found to have a limited metabolic ability due to its small genome and special requirement for sugars (M. florum sequencing project, Broad Institute, http://www.broad.mit.edu). In contrast, L. lactis, a LAB that dominated in July, preferentially feeding on galactose, xylose, maltose, gluconate, ribose and lactose is capable of converting carbohydrates into lactic acid or lactate (Bolotin et al., 2001). The representative reads with annotated ORFs of glycoside hydrolases for bacterial species have been deposited in GenBank (KF116097-KF128735), and all predicted ORFs (and their corresponding sequencing reads) of glycoside hydrolases can be retrieved from our web site (http://www.kacst.edu.sa/en/depts/jcg/researchwork/Pages/default.aspx).
Figure 3.
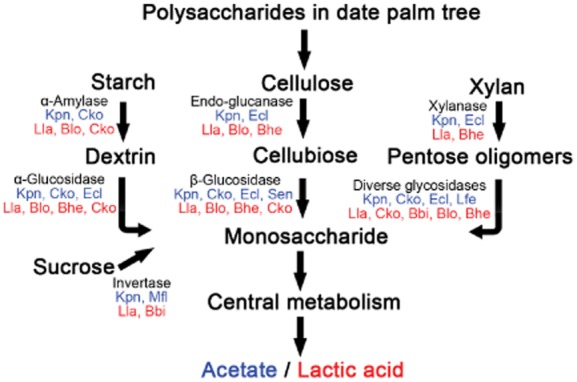
An overview of the nutrient metabolism by the gut microbial populations of the RPW larva. We show the dominant species that digest polysaccharides and sucrose (November in blue and July in red). We determine the dominant bacteria by finding overlaps between the top 10 bacteria in Table S6 and the top 3 in Table S16. The species are ranked based on their abundances. Bbi, B. bifidum; Bhe, Bacteroides helcogenes; Blo, B. longum; Cko, Citrobacter koseri; Ecl, E.cloacae; Kpn, K. pneumonia; Lfe, Lactobacillus fermentum; Lla, L. lactis; Mfl, M. florum; and Sen, Salmonella enterica.
Discussion
Factors underlying changes in gut microbial community
We observed dynamic changes in microbial profiles of the R. ferrugineus gut and confirmed the predominant control factor – temperature. Heat stress is obvious during the summer in the tropical and semiarid regions, imposing the most abiotic pressure on R. ferrugineus and its intestinal microbiota. However, there should be some other factors underlying the microbial population dynamics other than temperature. Recently, ruminal bacterial population structures have been reported to change with environment (Fernando et al., 2010), and an increase in lactate production has been observed because of readily available carbohydrates (Nocek, 1997). Sugars (mainly sucrose) are very abundant in date palm sap (Thabet et al., 2007), and sugar-enriched environment, supported by active photosynthesis during fruiting in the summer of Saudi Arabia, favours lactate fermentation. Another influential factor should be pH. The fermentation of carbohydrates in human colon leads to a low pH of approximately 4.8. Continuous-culture studies on colonic bacteria, which examine a pH range from 7 to 5, have shown that there are dramatic population changes resulting from pH alterations, as clostridia typically survive better at pH 7 and only lactobacilli and bifidobacteria are generally recovered at pH 5 (Lowe et al., 1993). The potential impact of pH on RPW gut microbiota is supported by several observations. First, cellulolytic ruminal bacteria are susceptible to the low pH in bovine rumen, as they are not able to metabolize cellobiose at low pH (Russell and Wilson, 1996). In this study, the growth of certain bacteria in November, such as K. pneumoniae, may be inhibited when the local pH is reduced. Second, in July the primary residential bacteria (L. lactis) is acid-tolerant and known to be involved in the production of fermented dairy products including lactic acid (Bolotin et al., 2001). More importantly, probiotic bacteria are dominant in July, and these organisms are beneficial to a healthy gut and inhibit the growth of pathogens by producing lactic acid and lowering the pH (Kailasapathy and Chin, 2000). Third, yeast have long been isolated from the rumen, as normal inhabitants (Clarke and DiMenna, 1961; Lund, 1974), and it seemed that they are non-functional, and enter the rumen just with the feed, as xylose can be fermented into ethanol only under aerobic conditions by Candida tropicalis (Jeffries, 1981). However, yeasts have probiotic effects in the rumen: favouring microbiota establishment, controlling rumen pH, preventing acidosis and stimulating growth and activity of fibre-degrading bacteria (Chaucheyras-Durand et al., 2008). S. cerevisiae can stimulate in vitro mixed ruminal microorganism fermentation with decreased lactate, and the result suggests its effects on pH (Lila et al., 2004). Our observation that there are more AAB in November (including many fibre-degrading bacteria) and LAB in July is in accordance with the fact that there are also more yeast species in November and less in July (Table S8).
Biological control of R. ferrugineus
Although there have been alternative strategies for insect biocontrol, the use of bacterial pathogens remains a viable choice. Therefore, efforts to understand the R. ferrugineus gut microbiota and the search for candidate pathogens should be proven worthwhile. Various pathogens, including bacteria and viruses, have been reported to affect R. ferrugineus at different stages of its life cycle. Bacterial pathogens, such as P. aeruginosa, B. sphaericus, B. megaterium, and B. laterosporus, are known to cause mortality in R. ferrugineus larvae (Banerjee and Dangar, 1995; Salama et al., 2004). In addition, a highly potent cytoplasmic polyhedrosis virus (CPV) is shown to infect R. ferrugineus at all stages of its life cycle, and the infection at the late larval stage can produce malformed adult weevil (Gopinadhan et al., 1990). In our study, we found that a bracovirus C. sesamiae is insect-infectious. In addition, several bacteriophages were also discovered in the R. ferrugineus gut microbiota, and although they are bacterial pathogens rather than insect pathogens, bacteriophages have the ability to devastate the balance of microbial populations. Dominant bacteria carry the potential to be genetically modified via the insertion of toxin-encoding genes, such as from plasmid pBtoxis (Fang et al., 2011), which may result in approaches to eradicate R. ferrugineus and its larva from inside of palm trunks. Moreover, other bacterial species, even those identified in low abundance in our study, may be useful for studying gut indigestion against probiotics. Overall, the large pool of microbes characterized in this study provide ample resources for further identification and understanding of candidate pathogens for effective R. ferrugineus biocontrol.
Experimental procedures
Sample collection
Red palm weevil larvae and adults were collected from date palm farms in Al-Hssa Oasis, Saudi Arabia (25.4′N, 49.6′E). The samples were frozen in liquid nitrogen and transported on dry ice within the same day to the JCGR-KACST laboratory in Riyadh and stored at −80°C until use. Larval samples were collected on 17 March, 1 May, 28 July and 5 November, 2010, and the average temperatures for these days were 24.3°C, 32.8°C, 38.6°C and 22.7°C respectively (Figs S1 and S2, Table S3). Adult samples were collected in the field on 17 March and 1 May, 2010. Larvae were reared in a water bath with closed cover at 20°C/32°C (Cold/Hot) for more than two weeks. Tender date palm tissues cut from young trunks were used as routine feeds, which were obtained from the farms where the RPW samples were collected.
Sample processing prior to DNA extraction
After thawing tens of individual larvae per sample, we removed the hindgut contents from the major portion of the intestines by washing with sterile saline solution and pooled the liquid into a 50-ml plastic centrifuge tube. The suspension was laid over a Nycodenz density gradient centrifugation solution as described previously (Courtois et al., 2001). The cell pellet was collected in a 1.5-ml tube. Since adult gut is thin, fragile and has very limited liquid content so that we had to combine all March and May samples into spring sample, named as Adult, to extract enough DNA for shotgun library construction. The Adult gut was excised and vortexed in sterile saline solution for suspension collection.
DNA extraction
We extracted genomic DNA using a Mini-Beadbeater (BioSpec, USA) according to previously published protocol (Yu and Morrison, 2004), followed with Qiagen Blood and Tissue DNA Extraction kit (Qiagen, Germany) according to the standard protocol. DNA concentration was determined using Qubit Fluorometer (Life Technology, USA), Nanodrop 8000 spectrophotometer (Thermo Scientific, USA) and electrophoresis.
Polymerase chain reaction (PCR) amplification of 16S rRNAs
We designed polymerase chain reaction (PCR) amplicons using bar coded primers for pyrosequencing seven samples (Table S2). The 16S universal bacterial primers F530L (barcoded) and R1100L, originally designed for the Bacterial Tag-Encoded FLX Amplicon Pyrosequencing (bTEFAP) approach (Dowd et al., 2008), were ligated to 454 sequencing adaptors (600 bp in length). The following cycling conditions were used: initial denaturation at 94°C for 2 min and 25 cycles of 94°C for 30 s, 55°C for 30 s and 72°C for 1.5 min. All PCR products were purified by using the MinElute PCR Purification kit (Qiagen, Germany).
Pyrosequencing and data analysis
We used the Roche/454 GS FLX platform (Roche Applied Science, USA) for both shotgun and amplicon sequencing. For shotgun data analysis, we filtered the raw data against the genome contigs of the RPW and DP genome assemblies (BLASTN, cut-off E-value of 1e-3). The filtered reads were further processed as follows. First, they were annotated against the nt (non-redundant nucleotide) and nr (non-redundant protein) databases from NCBI (BLASTN and BLASTX with cut-off E-value of 1e-10). The BLAST results were imported into megan version 4.50.5 for taxonomic assignment and functional analysis (Huson et al., 2011). Second, the data were statistically analysed according to the bacterial taxonomy and functional categories from megan by using stamp 2.0.0 for pairwise comparisons (Parks and Beiko, 2010). The reads were submitted to MG-RAST (Accession numbers 4 464 190.3, 4 464 191.3, 4 464 192.3 and 4 464 189.3 for March, July, November and Adult respectively) (Glass et al., 2010). Third, after predicting the ORFs using MetaGene implemented in CAMERA (Seshadri et al., 2007), we identified the glycoside hydrolase and other carbohydrate active enzyme orthologs by submitting the ORF sequences to the web site server of the CAT (Park et al., 2010). CAZymes Analysis Toolkit provides BLAST hits with a cut-off E-value of 1e-2 against the complete, non-redundant sequences of the CAZy database (Cantarel et al., 2009). Fourth, these filtered reads were mapped to bacterial genomes by using Roche/454 GS Reference Mapper version 2.6 for recruitment analysis. Finally, we assembled all the filtered reads using the Roche/454 Newbler version 2.6 and processed the contigs and singletons according to RAMMCAP for functional annotations (Li, 2009).
For 16S rRNA amplicon analysis, we partitioned the multi-FASTA file into sample-specific files according to the barcodes and trimmed the low quality data using the ribosomal database project (RDP) pipeline (Cole et al., 2007). And definite chimeras were removed by using the B2C2 software (Gontcharova et al., 2010). We also performed taxonomic assignments by filtering our tags against the RDP-II 16S rRNA database and classifying them on the RDP classifier (Wang et al., 2007). A heat map was generated for microbial abundance by using the R package heatmap.2 (Andy Liaw, original; R. Gentleman, M. Maechler, W. Huber, G. Warnes, revisions). All filtered tags were processed by using the Mothur software tool for diversity and OTU analysis (Schloss et al., 2009).
Acknowledgments
This study was supported by a grant (428-29) from KACST, Riyadh, Saudi Arabia. All works were done in JCGR, KACST as a part of the Sino-Saudi Date Palm Genome Project. We thank Dr Khalid Al-Hudeeb of King Faisal University in Hofuf for help in identifying the infested date palm groove and collecting samples in Alhssa and Dr Yongjun Fang for help in sequencing and data analysis.
Supporting Information
Additional Supporting Information may be found in the online version of this article:
Fig. S1. The intestine of the RPW larva (left) and adult (right). The larva gut has a large segment full of brownish liquid content; the lower thin portion is not shown here. The adult gut is short and has less liquid content.
Fig. S2. Temperature distribution of 2010 in Al-Hssa Oasis, Saudi Arabia. The highest, average, and lowest temperatures are calculated based on the mean values in one month according to the record. In a single day, the highest is under the daylight, whereas the lowest is at night. The highest is in July and the lowest is at the beginning and the end of a year. The four samples were collected in March, May, July, and November.
Fig. S3. Pairwise comparison of taxonomic compositions between November and the other three samples. The phylum abundances were determined by using MEGAN. Pairwise comparison was performed and Fisher exact tests were used with the Benjamin-Hochberg FDR multiple test correction to generate a list of significantly different phyla (STAMP v2.0.0). Solid colored circles closer to the x-axis represent more abundant phyla in November and those closer to the y-axis are more abundant in other gut metagenomes (A, November vs. July; B, November vs. March; C, November vs. Adult). Solid colored circles lying on or near the dotted line have equal or very similar abundances in both samples.
Fig. S4. A phylogenetic tree of shared OTUs for six amplified larval samples. The similarity distance between samples was calculated with the calculator of thetaYC in the command ‘tree.shared’ of Mothur and the tree was constructed by using UPGMA. The three trees show the clustered samples with OTUs at thresholds of (A) 0.03, (B) 0.05, and (C) 0.10.
Fig. S5. Recruitment plot for K. pneumoniae and L. lactis. All reads were mapped onto the genomes of seven subspecies with default parameters by using GS Reference Mapper version 2.6. The outer black circle indicates genome size (Mb). Circle a, the regions with or without mapped reads are colored blue or white, respectively. Similarly, Circle b, genes or intergenic regions are colored green or red, respectively, which were annotated according to infromation in GenBank. Circles c, d, e, and f: the distribution of mapped read, GC content of the mapped reads, GC content of the references, and SNPs distribution. The window size in Circles c, d, e, and f is 1 kb.
Fig. S6. Pairwise comparison of functional compositions. The functional categories in SEED subsystems were determined by using MEGAN. Pairwise comparison was performed and Fisher exact tests were used with the Benjamin-Hochberg FDR multiple test correction to generate a list of significantly different SEED subsystems with STAMP (v2.0.0). Solid color circles closer to the x-axis represent more abundant functions in November and those closer to the y-axis are more abundant in other gut metagenomes (A, November vs. July; B, November vs. Adult). Solid color circles lying on or near the dotted line have equal or very similar abundances within both sample types.
Table S1. Phylum identification in the four shotgun samples.
Table S2. Barcoding primers for amplicon library construction.
Table S3. Summary for the 7 amplicon samples.
Table S4. Phylum identification in the 7 amplicon samples.
Table S5. OTUs and diversity summary for the amplicon data.
Table S6. The top 50 bacterial species in the four shotgun samples.
Table S7. Phylogenetic classification of archaea in November and July.
Table S8. Comparison of fungal species between November and July.
Table S9. Viral identification in the four shotgun samples.
Table S10. Mapping results of 34 bacterial genomes within the four shotgun samples.
Table S11. Mapping summary for subspecies of K. pneumoniae and L. lactis.
Table S12. SEED subsystem functions in shotgun samples.
Table S13. KEGG pathway classifications.
Table S14. Annotation of predicted ORFs based on RAMMCAP.
Table S15. COG annotation for clustered ORFs of the assembled contigs.
Table S16. Glycoside hydrolases in the metagenomes of November, July, and Adult.
Table S17. The CAZY families of CBM, CE, and PL in November, July, and Adult.
Table S18. A list of full species names for the abbreviated bacteria.
References
- Abe F, Ohkusu M, Kubo T, Kawamoto S, Sone K. Hata K. Isolation of yeasts from palm tissues damaged by the red palm weevil and their possible effect on the weevil overwintering. Mycoscience. 2010;51:215–223. [Google Scholar]
- Anand AAP, Vennison SJ, Sankar SG, Prabhu DIG, Vasan PT, Raghuraman T, et al. Isolation and characterization of bacteria from the gut of Bombyx mori that degrade cellulose, xylan, pectin and starch and their impact on digestion. J Insect Sci. 2010;10:1–20. doi: 10.1673/031.010.10701. [DOI] [PMC free article] [PubMed] [Google Scholar]
- Augstburger F, Berger J, Censkowsky U, Heid P, Milz J. Streit C. Organic Farming in the Tropics and Subtropics: Date Palm. Grafelfing, Germany: Naturland e. V; 2002. [Google Scholar]
- Banerjee A. Dangar TK. Pseudomonas aeruginosa, a facultative pathogen of red palm weevil, Rhynchophorus ferrugineus. World J Microbiol Biotechnol. 1995;11:618–620. doi: 10.1007/BF00361002. [DOI] [PubMed] [Google Scholar]
- Bolotin A, Wincker P, Mauger S, Jaillon O, Malarme K, Weissenbach J, et al. The complete genome sequence of the lactic acid bacterium Lactococcus lactis ssp. lactis IL1403. Genome Res. 2001;11:731–753. doi: 10.1101/gr.169701. [DOI] [PMC free article] [PubMed] [Google Scholar]
- Cantarel BL, Coutinho PM, Rancurel C, Bernard T, Lombard V. Henrissat B. The Carbohydrate-Active EnZymes database (CAZy): an expert resource for glycogenomics. Nucleic Acids Res. 2009;37:D233–D238. doi: 10.1093/nar/gkn663. [DOI] [PMC free article] [PubMed] [Google Scholar]
- Chaucheyras-Durand F, Walker ND. Bach A. Effects of active dry yeasts on the rumen microbial ecosystem: past, present and future. Anim Feed Sci Technol. 2008;145:5–26. [Google Scholar]
- Clarke RTJ. DiMenna ME. Yeasts from the bovine rumen. J Gen Microbiol. 1961;25:113–117. doi: 10.1099/00221287-25-1-113. [DOI] [PubMed] [Google Scholar]
- Cole JR, Chai B, Farris RJ, Wang Q, Kulam-Syed-Mohideen AS, McGarrell DM, et al. The ribosomal database project (RDP-II): introducing myRDP space and quality controlled public data. Nucleic Acids Res. 2007;35:D169–D172. doi: 10.1093/nar/gkl889. [DOI] [PMC free article] [PubMed] [Google Scholar]
- Courtois S, Frostegard A, Göransson P, Depret G, Jeannin P. Simonet P. Quantification of bacterial subgroups in soil: comparison of DNA extracted directly from soil or from cells previously released by density gradient centrifugation. Environ Microbiol. 2001;3:431–439. doi: 10.1046/j.1462-2920.2001.00208.x. [DOI] [PubMed] [Google Scholar]
- Dowd SE, Wolcott RD, Sun Y, McKeehan T, Smith E. Rhoads D. Polymicrobial nature of chronic diabetic foot ulcer biofilm infections determined using bacterial tag encoded FLX amplicon pyrosequencing (bTEFAP) PLoS ONE. 2008;3:e3326. doi: 10.1371/journal.pone.0003326. [DOI] [PMC free article] [PubMed] [Google Scholar]
- Faleiro JR. A review of the issues and management of the red palm weevil Rhynchophorus ferrugineus (Coleoptera: Rhynchophoridae) in coconut and date palm during the last one hundred years. Int J Trop Insect Sci. 2006;26:135–154. [Google Scholar]
- Fang Y, Li Z, Liu J, Shu C, Wang X, Zhang X, et al. A pangenomic study of Bacillus thuringiensis. J Genet Genomics. 2011;38:567–576. doi: 10.1016/j.jgg.2011.11.001. [DOI] [PubMed] [Google Scholar]
- Fernando SC, Purvis HT, II, Najar FZ, Sukharnikov LO, Krehbiel CR, Nagaraja TG, et al. Rumen microbial population dynamics during adaptation to a high-grain diet. Appl Environ Microbiol. 2010;76:7482–7490. doi: 10.1128/AEM.00388-10. [DOI] [PMC free article] [PubMed] [Google Scholar]
- Glass EM, Wilkening J, Wilke A, Antonopoulos D. Meyer F. Using the metagenomics RAST server (MG-RAST) for analyzing shotgun metagenomes. Cold Spring Harb Protoc. 2010;2010 doi: 10.1101/pdb.prot5368. and : pdb prot5368. [DOI] [PubMed] [Google Scholar]
- Gontcharova V, Youn E, Wolcott RD, Hollister EB, Gentry TJ. Dowd SE. Black box chimera check (B2C2): a windows-based software for batch depletion of chimeras from bacterial 16S rRNA gene datasets. Open Microbiol J. 2010;4:47–52. doi: 10.2174/1874285801004010047. [DOI] [PMC free article] [PubMed] [Google Scholar]
- Gopinadhan P, Mohandas N. Nari K. Cytoplasmic polyhedrosis virus infecting red palm weevil of coconut. Curr Sci. 1990;59:577–580. [Google Scholar]
- Harkins T. Jarvie T. Metagenomics analysis using the Genome Sequencer(tm) FLX system. Nat Methods. 2007;4:iii–iiv. [Google Scholar]
- Hess M, Sczyrba A, Egan R, Kim TW, Chokhawala H, Schroth G, et al. Metagenomic discovery of biomass-degrading genes and genomes from cow rumen. Science. 2011;331:463–467. doi: 10.1126/science.1200387. [DOI] [PubMed] [Google Scholar]
- Huson DH, Mitra S, Ruscheweyh HJ, Weber N. Schuster SC. Integrative analysis of environmental sequences using MEGAN4. Genome Res. 2011;21:1552–1560. doi: 10.1101/gr.120618.111. [DOI] [PMC free article] [PubMed] [Google Scholar]
- Jeffries TW. Conversion of xylose to ethanol under aerobic conditions by Candida tropicalis. Biotechnol Lett. 1981;3:213–218. [Google Scholar]
- Kailasapathy K. Chin J. Survival and therapeutic potential of probiotic organisms with reference to Lactobacillus acidophilus and Bifidobacterium spp. Immunol Cell Biol. 2000;78:80–88. doi: 10.1046/j.1440-1711.2000.00886.x. [DOI] [PubMed] [Google Scholar]
- Kästner CN, Schneider K, Dimroth P. Pos KM. Characterization of the citrate/acetate antiporter CitW of Klebsiella pneumoniae. Arch Microbiol. 2002;177:500–506. doi: 10.1007/s00203-002-0420-8. [DOI] [PubMed] [Google Scholar]
- Khiyami M. Alyamani E. Aerobic and facultative anaerobic bacteria from gut of red palm weevil (Rhynchophorus ferrugineus. Afr J Biotechnol. 2008;7:1432–1437. [Google Scholar]
- Li W. Analysis and comparison of very large metagenomes with fast clustering and functional annotation. BMC Bioinformatics. 2009;10:359. doi: 10.1186/1471-2105-10-359. [DOI] [PMC free article] [PubMed] [Google Scholar]
- Lila ZA, Mohammed N, Yasui T, Kurokawa Y, Kanda S. Itabashi H. Effects of a twin strain of Saccharomyces cerevisiae live cells on mixed ruminal microorganism fermentation in vitro. J Anim Sci. 2004;82:1847–1854. doi: 10.2527/2004.8261847x. [DOI] [PubMed] [Google Scholar]
- Lowe SE, Jain MK. Zeikus JG. Biology, ecology, and biotechnological applications of anaerobic bacteria adapted to environmental stresses in temperature, pH, salinity, or substrates. Microbiol Rev. 1993;57:451–509. doi: 10.1128/mr.57.2.451-509.1993. [DOI] [PMC free article] [PubMed] [Google Scholar]
- Lund A. Yeasts and moulds in the bovine rumen. J Gen Microbiol. 1974;81:453–462. doi: 10.1099/00221287-81-2-453. [DOI] [PubMed] [Google Scholar]
- Luo C, Tsementzi D, Kyrpides NC. Konstantinidis KT. Individual genome assembly from complex community short-read metagenomic datasets. ISME J. 2011;6:898–901. doi: 10.1038/ismej.2011.147. [DOI] [PMC free article] [PubMed] [Google Scholar]
- Mountfort DO, Asher RA. Bauchop T. Fermentation of cellulose to methane and carbon dioxide by a rumen anaerobic fungus in a triculture with Methanobrevibacter sp. strain RA1 and Methanosarcina barkeri. Appl Environ Microbiol. 1982;44:128–134. doi: 10.1128/aem.44.1.128-134.1982. [DOI] [PMC free article] [PubMed] [Google Scholar]
- Murphy ST. Briscoe BR. The red palm weevil as an alien invasive: biology and the prospects for biological control as a component of IPM. Biocontrol News Inf. 1999;20:35–46. [Google Scholar]
- Nocek JE. Bovine acidosis: implications on laminitis. J Dairy Sci. 1997;80:1005–1028. doi: 10.3168/jds.S0022-0302(97)76026-0. [DOI] [PubMed] [Google Scholar]
- Park BH, Karpinets TV, Syed MH, Leuze MR. Uberbacher EC. CAZymes Analysis Toolkit (CAT): Web service for searching and analyzing carbohydrate-active enzymes in a newly sequenced organism using CAZy database. Glycobiology. 2010;20:1574–1584. doi: 10.1093/glycob/cwq106. [DOI] [PubMed] [Google Scholar]
- Parks DH. Beiko RG. Identifying biologically relevant differences between metagenomic communities. Bioinformatics. 2010;26:715–721. doi: 10.1093/bioinformatics/btq041. [DOI] [PubMed] [Google Scholar]
- Qin J, Li R, Raes J, Arumugam M, Burgdorf KS, Manichanh C, et al. A human gut microbial gene catalogue established by metagenomic sequencing. Nature. 2010;464:59–65. doi: 10.1038/nature08821. [DOI] [PMC free article] [PubMed] [Google Scholar]
- Rinke R, Costa A, Fonseca F, Almeida L, Júnior ID. Henrique-Silva F. Microbial diversity in the larval gut of field and laboratory populations of the sugarcane weevil Sphenophorus levis (Coleoptera, Curculionidae) Genet Mol Res. 2011;10:2679–2691. doi: 10.4238/2011.November.1.1. [DOI] [PubMed] [Google Scholar]
- Roh SW, Kim KH, Nam YD, Chang HW, Park EJ. Bae JW. Investigation of archaeal and bacterial diversity in fermented seafood using barcoded pyrosequencing. ISME J. 2009;4:1–16. doi: 10.1038/ismej.2009.83. [DOI] [PubMed] [Google Scholar]
- Russell JB. Wilson DB. Why are ruminal cellulolytic bacteria unable to digest cellulose at low pH? J Dairy Sci. 1996;79:1503–1509. doi: 10.3168/jds.S0022-0302(96)76510-4. [DOI] [PubMed] [Google Scholar]
- Salama HS, Foda MS, El-Bendary MA. Abdel-Razek A. Infection of red palm weevil, Rhynchophorus ferrugineus, by spore-forming bacilli indigenous to its natural habitat in Egypt. J Pest Sci. 2004;77:27–31. [Google Scholar]
- Schloss PD, Westcott SL, Ryabin T, Hall JR, Hartmann M, Hollister EB, et al. Introducing mothur: open-source, platform-independent, community-supported software for describing and comparing microbial communities. Appl Environ Microbiol. 2009;75:7537–7541. doi: 10.1128/AEM.01541-09. [DOI] [PMC free article] [PubMed] [Google Scholar]
- Seshadri R, Kravitz SA, Smarr L, Gilna P. Frazier M. CAMERA: a community resource for metagenomics. PLoS Biol. 2007;5:e75. doi: 10.1371/journal.pbio.0050075. [DOI] [PMC free article] [PubMed] [Google Scholar]
- Stringini M, Comitini F, Taccari M. Ciani M. Yeast diversity during tapping and fermentation of palm wine from Cameroon. Food Microbiol. 2009;26:415–420. doi: 10.1016/j.fm.2009.02.006. [DOI] [PubMed] [Google Scholar]
- Suen G, Scott JJ, Aylward FO, Adams SM, Tringe SG, Pinto-Tomás AA, et al. An insect herbivore microbiome with high plant biomass-degrading capacity. PLoS Genet. 2010;6:e1001129. doi: 10.1371/journal.pgen.1001129. [DOI] [PMC free article] [PubMed] [Google Scholar]
- Thabet IB, Attia H, Besbes S, Deroanne C, Francis F, Drira NE. Blecker C. Physicochemical and functional properties of typical tunisian drink: date palm sap (Phoenix dactylifera L.) Food Biophys. 2007;2:76–82. [Google Scholar]
- Wang Q, Garrity GM, Tiedje JM. Cole JR. Naive Bayesian classifier for rapid assignment of rRNA sequences into the new bacterial taxonomy. Appl Environ Microbiol. 2007;73:5261–5267. doi: 10.1128/AEM.00062-07. [DOI] [PMC free article] [PubMed] [Google Scholar]
- Warnecke F, Luginbuhl P, Ivanova N, Ghassemian M, Richardson TH, Stege JT, et al. Metagenomic and functional analysis of hindgut microbiota of a wood-feeding higher termite. Nature. 2007;450:560–565. doi: 10.1038/nature06269. [DOI] [PubMed] [Google Scholar]
- Watanabe H. Tokuda G. Cellulolytic systems in insects. Annu Rev Entomol. 2010;55:609–632. doi: 10.1146/annurev-ento-112408-085319. [DOI] [PubMed] [Google Scholar]
- Yu Z. Morrison M. Improved extraction of PCR-quality community DNA from digesta and fecal samples. Biotechniques. 2004;36:808–813. doi: 10.2144/04365ST04. [DOI] [PubMed] [Google Scholar]
Associated Data
This section collects any data citations, data availability statements, or supplementary materials included in this article.
Supplementary Materials
Fig. S1. The intestine of the RPW larva (left) and adult (right). The larva gut has a large segment full of brownish liquid content; the lower thin portion is not shown here. The adult gut is short and has less liquid content.
Fig. S2. Temperature distribution of 2010 in Al-Hssa Oasis, Saudi Arabia. The highest, average, and lowest temperatures are calculated based on the mean values in one month according to the record. In a single day, the highest is under the daylight, whereas the lowest is at night. The highest is in July and the lowest is at the beginning and the end of a year. The four samples were collected in March, May, July, and November.
Fig. S3. Pairwise comparison of taxonomic compositions between November and the other three samples. The phylum abundances were determined by using MEGAN. Pairwise comparison was performed and Fisher exact tests were used with the Benjamin-Hochberg FDR multiple test correction to generate a list of significantly different phyla (STAMP v2.0.0). Solid colored circles closer to the x-axis represent more abundant phyla in November and those closer to the y-axis are more abundant in other gut metagenomes (A, November vs. July; B, November vs. March; C, November vs. Adult). Solid colored circles lying on or near the dotted line have equal or very similar abundances in both samples.
Fig. S4. A phylogenetic tree of shared OTUs for six amplified larval samples. The similarity distance between samples was calculated with the calculator of thetaYC in the command ‘tree.shared’ of Mothur and the tree was constructed by using UPGMA. The three trees show the clustered samples with OTUs at thresholds of (A) 0.03, (B) 0.05, and (C) 0.10.
Fig. S5. Recruitment plot for K. pneumoniae and L. lactis. All reads were mapped onto the genomes of seven subspecies with default parameters by using GS Reference Mapper version 2.6. The outer black circle indicates genome size (Mb). Circle a, the regions with or without mapped reads are colored blue or white, respectively. Similarly, Circle b, genes or intergenic regions are colored green or red, respectively, which were annotated according to infromation in GenBank. Circles c, d, e, and f: the distribution of mapped read, GC content of the mapped reads, GC content of the references, and SNPs distribution. The window size in Circles c, d, e, and f is 1 kb.
Fig. S6. Pairwise comparison of functional compositions. The functional categories in SEED subsystems were determined by using MEGAN. Pairwise comparison was performed and Fisher exact tests were used with the Benjamin-Hochberg FDR multiple test correction to generate a list of significantly different SEED subsystems with STAMP (v2.0.0). Solid color circles closer to the x-axis represent more abundant functions in November and those closer to the y-axis are more abundant in other gut metagenomes (A, November vs. July; B, November vs. Adult). Solid color circles lying on or near the dotted line have equal or very similar abundances within both sample types.
Table S1. Phylum identification in the four shotgun samples.
Table S2. Barcoding primers for amplicon library construction.
Table S3. Summary for the 7 amplicon samples.
Table S4. Phylum identification in the 7 amplicon samples.
Table S5. OTUs and diversity summary for the amplicon data.
Table S6. The top 50 bacterial species in the four shotgun samples.
Table S7. Phylogenetic classification of archaea in November and July.
Table S8. Comparison of fungal species between November and July.
Table S9. Viral identification in the four shotgun samples.
Table S10. Mapping results of 34 bacterial genomes within the four shotgun samples.
Table S11. Mapping summary for subspecies of K. pneumoniae and L. lactis.
Table S12. SEED subsystem functions in shotgun samples.
Table S13. KEGG pathway classifications.
Table S14. Annotation of predicted ORFs based on RAMMCAP.
Table S15. COG annotation for clustered ORFs of the assembled contigs.
Table S16. Glycoside hydrolases in the metagenomes of November, July, and Adult.
Table S17. The CAZY families of CBM, CE, and PL in November, July, and Adult.
Table S18. A list of full species names for the abbreviated bacteria.