

Abstract
The proximal tubule Na+/H+ exchanger 3 (NHE3), located in the apical dense microvilli (brush border), plays a major role in the reabsorption of NaCl and water in the renal proximal tubule. In response to a rise in blood pressure NHE3 redistributes in the plane of the plasma membrane to the base of the brush border, where NHE3 activity is reduced. This NHE3 redistribution is assumed to provoke pressure natriuresis; however, it is unclear how NHE3 redistribution per se reduces NHE3 activity. To investigate if the distribution of NHE3 in the brush border can change the reabsorption rate, we constructed a spatiotemporal mathematical model of NHE3-mediated Na+ reabsorption across a proximal tubule cell and compared the model results with in vivo experiments in rats. The model predicts that when NHE3 is localized exclusively at the base of the brush border, it creates local pH microdomains that reduce NHE3 activity by >30%. We tested the model's prediction experimentally: the rat kidney cortex was loaded with the pH-sensitive fluorescent dye BCECF, and cells of the proximal tubule were imaged in vivo using confocal fluorescence microscopy before and after an increase of blood pressure by ∼50 mmHg. The experimental results supported the model by demonstrating that a rise of blood pressure induces the development of pH microdomains near the bottom of the brush border. These local changes in pH reduce NHE3 activity, which may explain the pressure natriuresis response to NHE3 redistribution.
Keywords: intravital confocal microscopy, Na+/H+ exchanger 3, pressure natriuresis, proximal tubule, spatiotemporal mathematical model
renal na+ excretion and arterial blood pressure control are tightly connected. The arterial pressure provides the driving force for the glomerular ultrafiltration of plasma that takes place in the kidney. Most of the ultrafiltrate is reabsorbed as the fluid passes along the renal tubules, with the major part of the reabsorption taking place in the proximal tubule (PT), and only a small fraction (∼1%) reaches the end of the collecting duct, where it emerges as the final urine. The balance between glomerular filtration and tubular reabsorption is controlled by a variety of neuroendocrine mechanisms and is central to the kidney's ability to maintain Na+ and water homeostasis. An acute increase in blood pressure of <50 mmHg triggers an increase in renal salt and water excretion, a response known as pressure natriuresis (9, 24, 35). Since the filtration rate stays constant due to the process of renal autoregulation (1), increased excretion must be due to decreased tubular reabsorption of salt and water (9, 10, 35). By acutely increasing the excretion of salt and water, pressure natriuresis causes a decrease in the extracellular fluid volume, which contributes to restoration of arterial blood pressure (9, 10, 35). Pressure natriuresis is currently accepted to be of central importance for the long-term control of arterial blood pressure (19).
Pressure natriuresis is partly due to reduced reabsorption of NaCl and water in the PT (9, 10, 35), but many questions remain as to the exact molecular mechanisms that underlie the reduction in water and salt reabsorption. Specific molecular transporters in the membranes of the cells lining the PT actively reabsorb Na+, Cl−, and HCO3− across the tubular epithelium. The reabsorption of solutes establishes a small but effective osmotic gradient across the epithelium driving secondary reabsorption of water (43). The PT has a very high transport capacity, facilitated by a characteristic apical brush border. The brush border is a compact microvillar structure that increases the surface area of the cells, thereby contributing to their large reabsorptive capacity. One of the major membrane proteins that transports Na+ across the apical membrane in the PT is Na+/H+ exchanger isoform 3 (NHE3), which exchanges one luminal Na+ for one cytosolic H+. Under normal resting conditions, NHE3 is uniformly distributed in the brush border membrane, but during pressure natriuresis, NHE3 is translocated to the base of the brush border. This translocation is believed to be central for the reduced tubular salt and water reabsorption (42, 55) and is associated with decreased Na+ reabsorption in the PT (57). However, NHE3 transport activity measured in brush border membrane vesicles isolated after an acute increase in blood pressure was unchanged (42, 55). Immunoelectron microscopy and biochemical studies have provided convincing evidence that NHE3 is not internalized during acute hypertension in vivo. Rather, NHE3 remains at the base of the microvilli, in lipid raft domains of the plasma membrane that do not enter the intermicrovillar cleft region (42, 55). Hence, it is unclear if and how translocation of NHE3 to the base of the brush border are associated with the reduced tubular salt and water reabsorption.
PT reabsorption has been modeled exhaustively, and the models include detailed kinetic expressions for NHE3 activity (51, 52). One of the central parameters regulating NHE3 activity is intra- and extracellular pH, as H+ is a substrate for the transporter and NHE3 activity is pH sensitive (51). In the lumen of the PT, the main pH buffer is the bicarbonate system. In the cytosol of PT cells, the bicarbonate system is also an important pH buffer together with various other buffers, especially intracellular proteins (15, 21). Models of the PT (51, 52) have focused on the uptake of different ions, and the brush border has been considered with respect to mechanical stress and flow near and in the brush border. An important conclusion from model simulations is that there is almost no flow in and near the brush border, which has also been demonstrated experimentally (4, 18). However, the effect of redistributing NHE3 within the brush border on Na+ reabsorption has not yet been addressed.
The main hypothesis of the present study is that local pH microdomains that develop after redistribution of NHE3 during acute hypertension can explain, at least in part, the reduction in tubular salt and water reabsorption during pressure natriuresis. To test this, we made a spatiotemporal model of NHE3-mediated Na+ reabsorption in the PT that includes the brush border microvilli and used this model to simulate the effects of redistribution of NHE3 within the brush border. The model has been constructed to address this specific problem. Consequently, aspects of tubular reabsorption that are not relevant for assessing the effect of NHE3 redistribution have not been included. Specifically, we did not include mechanisms that have not been described in the context of pressure natriuresis. The model predicts that when NHE3 is redistributed to the lower part of the brush border, it creates local changes in pH, both in the lumen and in the cytosol, that reduce NHE3 activity. To test the model experimentally, we determined the changes in cytosolic pH in PT cells in rats in vivo before and after an acute increase in blood pressure. The results support the findings of the model, namely, that an acute increase in blood pressure gives rise to the development of a pH microdomain at the base of the brush border.
MATERIALS AND METHODS
The model.
The PT cell is polarized with a basolateral membrane facing the interstitial side and an apical microvillar membrane facing the tubular lumen. The present model focused specifically on NHE3-mediated transepithelial Na+ transport in the early part (S1/S2) of the PT and on the possible effects on this transport of the redistribution of NHE3 within the membrane of the microvillus. For simplicity, we assumed that the microvilli are uniform in size and distribution. To further simplify the model, we considered only a single microvillus together with the underlying part of the cell. This is, obviously, a crude approximation, but it is useful for the particular problem that we addressed. Consequently, the domain of the model consists of a cylinder (see Fig. 1), where the top part represents the microvillus together with the surrounding tubular fluid and the lower part represents the cell cytoplasm beneath the microvillus, bounded at the bottom by the basolateral cell membrane. It was further assumed that the cytosol below the microvilli in the cell body is homogeneous throughout the cell. We neglected the influence of the cell edges, cell nucleus, and other nonuniformly distributed organelles.
Fig. 1.

Mathematical model of Na+/H+ exchanger isoform 3 (NHE3) redistribution in the proximal tubule (PT) brush border in response to an acute increase in blood pressure. A: the model included basolateral Na+-K+-ATPases and Na+-HCO3− cotransporters and apical NHE3. After an acute increase in blood pressure, NHE3 is redistributed to the base of the microvilli. In the model, the height of the microvilli is 3 μm and the height of the cell body is 7 μm. B: we assumed that the brush border structure is homogeneous and only modeled one of the microvilli and the corresponding cell body below. The structure of the model included the cell body and microvilli (in blue) and part of the lumen (in red). NHE3 was assumed initially to be distributed uniformly in the microvilli of the brush border excluding the lowest (50 nm) curved part of microvilli, as marked with the green bar. C: after redistribution, NHE3 was located to the lowest (50 nm) part just above the curved part, as marked with the green bar.
Because of the axiosymmetry of the cylinder, the three-dimensional (3-D) problem can be reduced to a two-dimensional (2-D) problem. The axiosymmetry implies that the full 3-D model can be obtained by rotating the corresponding 2-D model about its z-axis. Here, the z-axis is orientated in the centre of a microvillus, and the model is a cross section of one microvillus and the cell body below. The limitation of the approach is that it is impossible to model the whole cell. However, it is an efficient method to model objects that have axial symmetry, because the computations are done in a 2-D geometry instead of in a 3-D geometry. That is computationally more efficient.
NHE3 is a nonelectrogenic transporter. As one Na+ is exchanged for one H+, the net charge transfer is zero. Accordingly, transepithelial and membrane potentials in the PT are insensitive to amiloride (16, 27). We are unaware of studies showing that pressure natriuresis is accompanied by changes in transepithelial or membrane potentials in the PT. We have, therefore, assumed that plasma membrane potential and transepithelial potential are constant. Finally, we assume that the concentrations of ions and other constituents in the extracellular compartment at the basolateral side and in the bulk lumen (>0.5 μm from the tip of the microvilli) remain constant.
The structure of the cylinder is shown in Fig. 1. The cytosol compartment is colored blue (Fig. 1C) and the lumen is red (Fig. 1C). The model includes the tubular lumen between the microvilli and a thin layer 0.5 μm of tubular fluid off the tip of the microvilli. At the upper edge, we assumed constant concentrations of the various ions, which reflects physiological values in the early part of the tubular lumen. At the bottom, the cylinder is bounded by the basolateral membrane, and again we assumed constant concentrations of ions in the extracellular fluid facing this edge. The model includes the transport and diffusion of the relevant ions and molecules across both the apical and basolateral membranes and within the cytosolic compartment. In the apical membrane, we implemented a model of NHE3 and diffusion of CO2 and NH3 over the membrane. In the basolateral membrane, we included a model of the Na+/K+ pump and the Na+-HCO3− cotransporter. The model was implemented in COMSOL 4.1 (10a) and solved using the finite-element method.
Transport of molecules and ions were modeled in the cytosol and/or lumen. Since fluid flow near the brush border is very low (∼0.25% of the average tubular flow) and further reduced inside the brush border itself (4, 18), convective transport can be ignored. Consequently, diffusion is assumed to be the only mechanism for the transport of ions and molecules within the luminal and cytosolic compartments. Ions can only move between the lumen and cytosol by defined transmembrane fluxes (see below). Finally, a given ion or molecule may be added to or removed from the luminal or cytosolic compartment by a chemical reaction, e.g., by being bound to a buffer. Diffusion and chemical reactions were modeled using the following diffusion-reaction equation:
where c is the concentration of the diffusible ions or molecules, t is time, ∇ is the differential operator, Dc is a diagonal matrix where the elements in the diagonal are the diffusion coefficients for c in the x and z directions, and R expresses chemical reactions including buffer reactions. Below, in the individual reactions, D refers to the diffusion coefficient of the ion or molecule in that equation.
Geometry of the model.
Microvilli in the S1 to S2 segments of the PT are ∼3 μm long, have a radius of ∼45 nm at the base, and are localized on the apical side of the cell, ∼7 μm away from the basolateral membrane (12, 33, 53, 54). We implemented those geometries in the model (Fig. 1).
In the model, the microvillus has a radius of 45 nm at the base, whereas the total model (microvillus plus surrounding fluid) has a radius of 82 nm. That corresponds to a distance of 74 nm between neighboring microvilli. Depending on the tubular flow, the distance between neighboring microvilli in the S2 segment has been reported to be between 62 and 90 nm (33). The cytosol volume is 2.6 times the volume of the lumen in this model. The microvillus curves, so it ends in a rounded point. In this model, the microvilli increases the apical surface area with a factor of 26, and the microvilli density is 37 microvilli/μm2, which is in close agreement with previous models of the PT brush border (25).
The mesh, which is used by the finite-element method, was generated using triangles together with a boundary layer at the surface of the brush border. The size of the mesh was maximum 5 nm and minimum 2 pm, and the maximum element growth rate was 1.1.
Fluxes across membranes.
The purpose of the model was to examine the effects of NHE3 redistribution in the microvilli on NHE3-mediated tubular Na+ reabsorption. We therefore focused on the transport mechanisms that are relevant in this setting. The model includes fluxes of Na+, CO2, NH3, NH4+, and H+ across the apical membrane. All fluxes are shown in Table 1, the rates are shown in Table 2, and the parameters are shown in Table 3. At the apical side, NHE3 transports Na+ into the cell in exchange for H+ and, to a minor degree, in exchange for NH4+. The kinetics of NHE3, including parametric values, are based on previous published models by Weinstein et al. (51, 52). CO2 is assumed to diffuse freely across plasma membranes, as in other models of Na+ reabsorption in the PT (52). NH3 is also allowed to diffuse freely across the apical cell membrane (52). Because we focused the model on the effect of NHE3 redistribution, we did not include K+ and Cl− in the model. If Na+ forms large concentration gradients inside the same compartment, it would be necessary to model the other major ions. We checked the assumption of equal Na+ distribution, and, indeed, the model predicted that variations in Na+ would be around one in one thousands.
Table 1.
Fluxes and transports
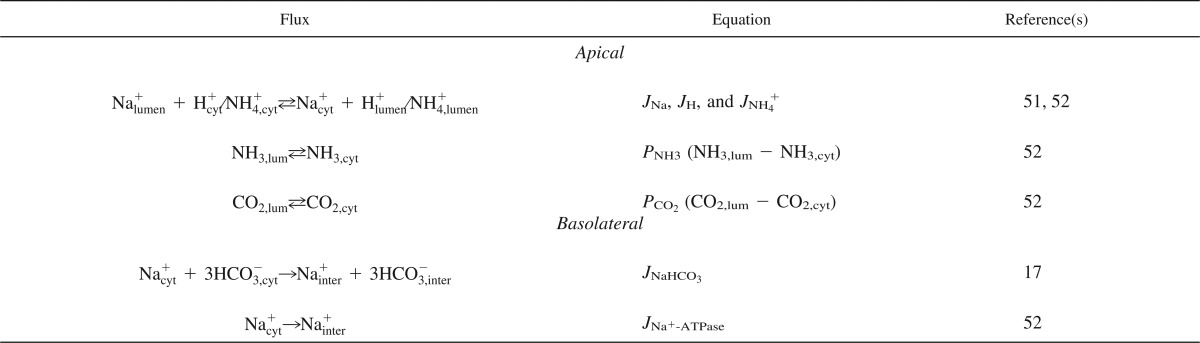
Table 2.
Equations for active fluxes
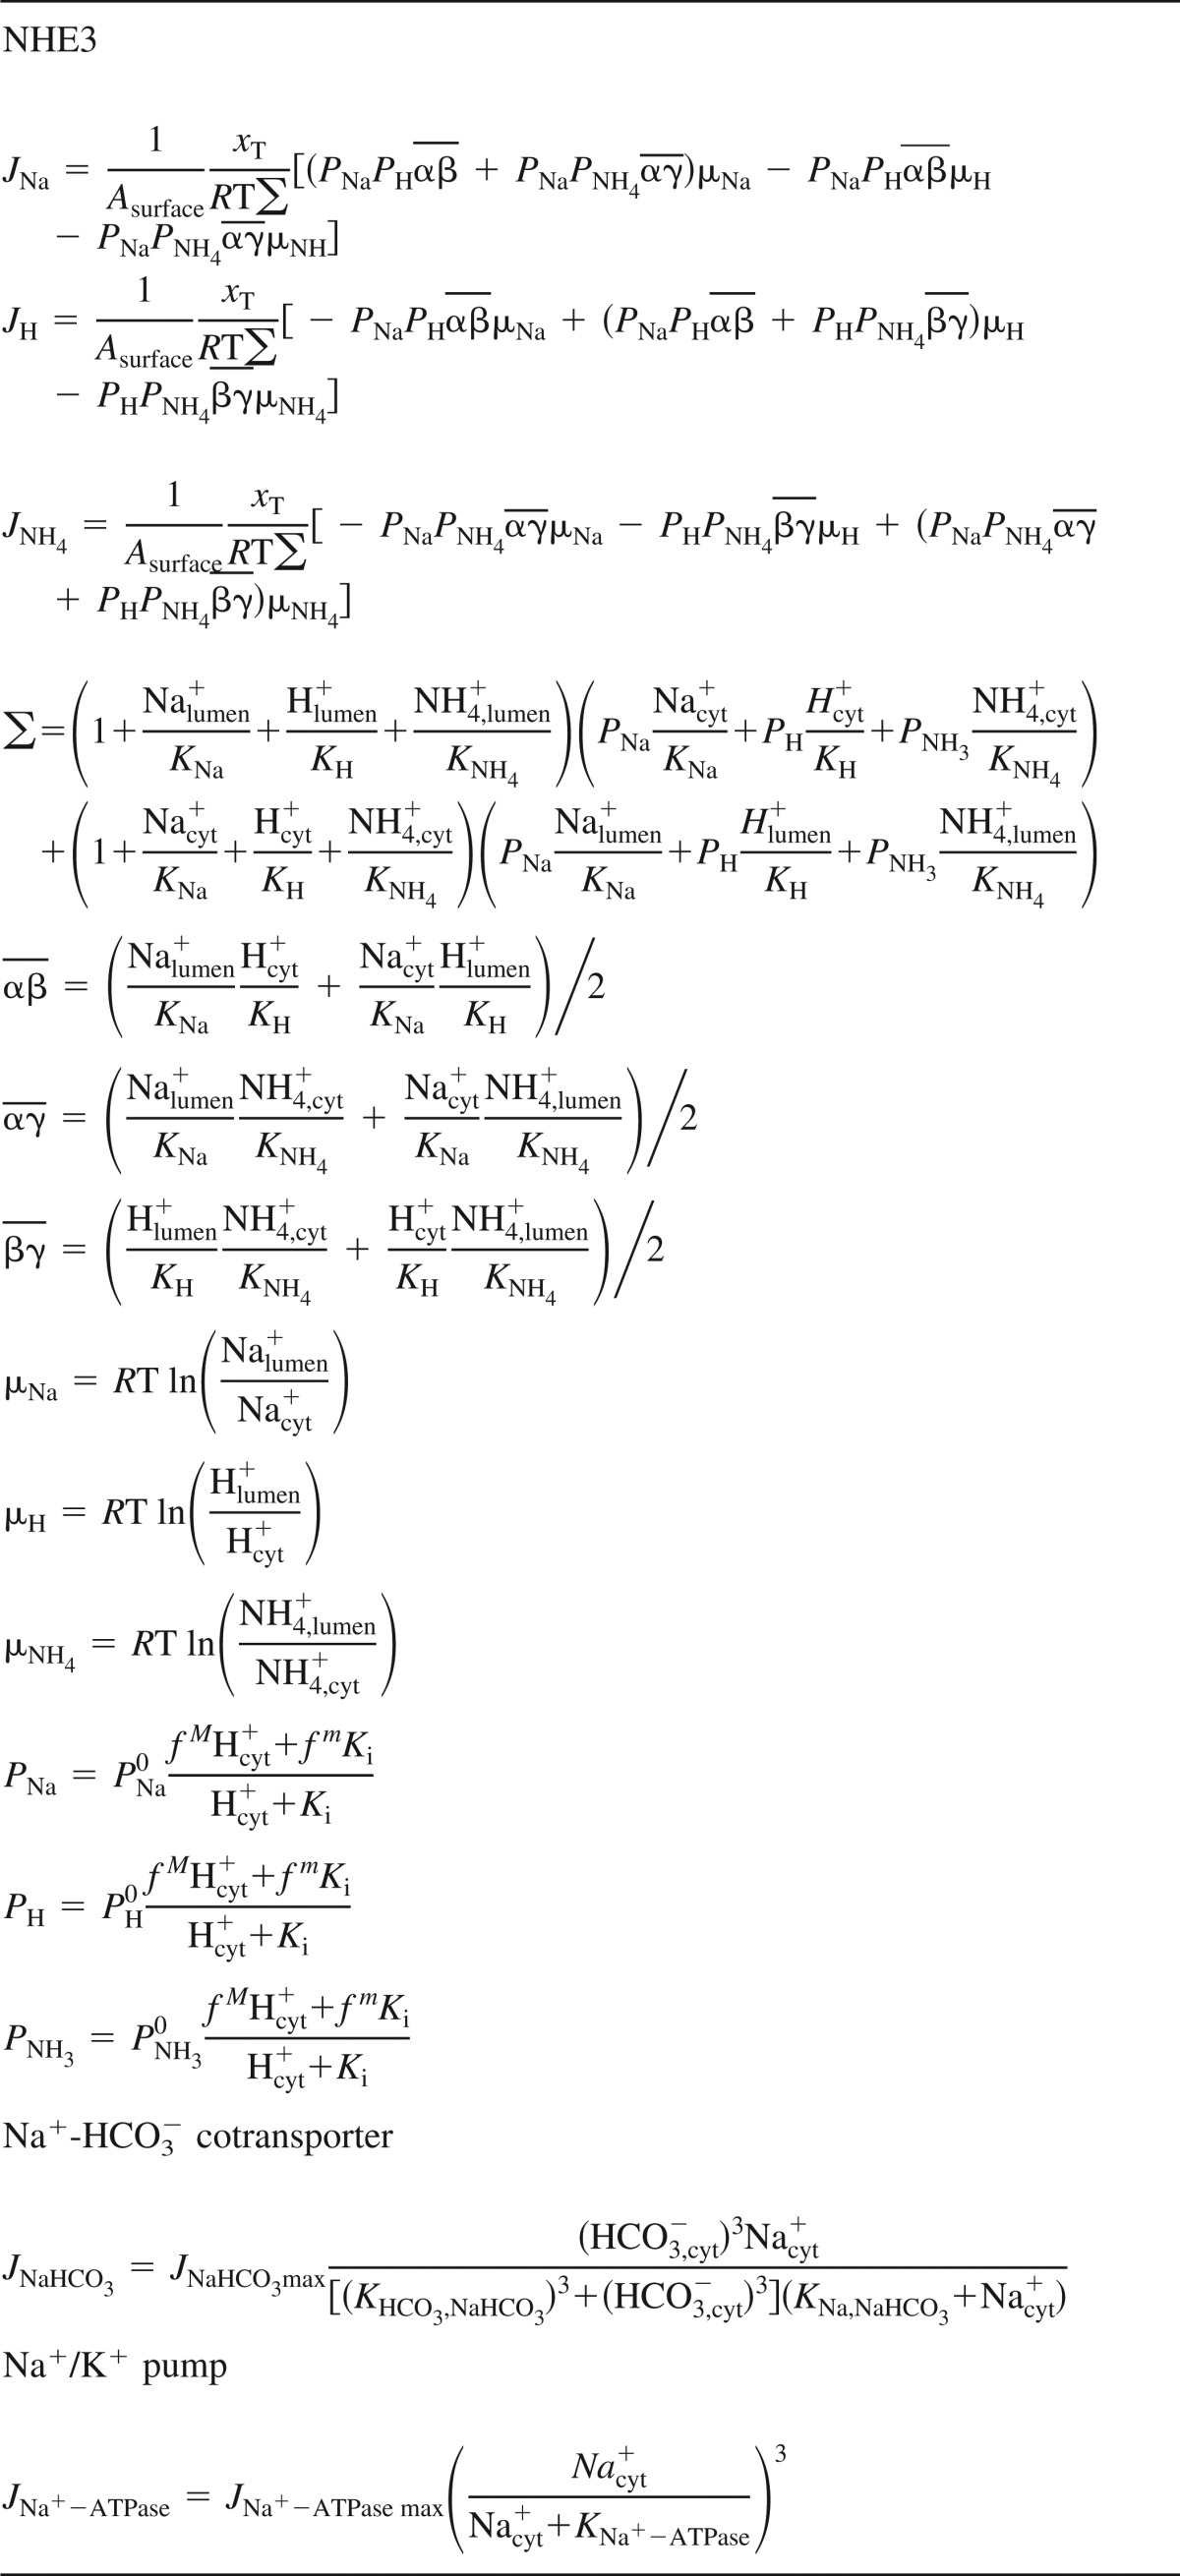
NHE3, Na+/H+ exchanger isoform 3.
Table 3.
Flux parameters
| Parameter | Value | Definition | Reference(s) |
|---|---|---|---|
| Asurface | |||
| Normal | 6.63 × 10⁻⁹ cm2 | Effective area that NHE3 is distributed in | Fitted |
| Pressure natriuresis | 1.13 × 10⁻¹⁰ cm2 | Effective area that NHE3 is distributed in | Fitted |
| xT | 495 nM | Amount of NHE3 | 51, 52 |
| R | 8.31 J·mol−1·K−1 | Gas constant | 51, 52 |
| T | 310 K | Temperature | |
| KNa | 30 mM | NHE3 Na+ affinity | 51, 52 |
| KH | 72 nM | NHE3 H+ affinity | (51, 52 |
| KNH4+ | 0.2 mM | NHE3 NH4+ affinity | 51, 52 |
| PNa0 | 1.6 × 10⁻³ cm/s | NHE3 Na+ permeability | 51, 52 |
| PH0 | 0.48 × 10⁻³ cm/s | NHE3 H+ permeability | 51, 52 |
| PNH4+0 | 1.6 × 10⁻³ cm/s | NHE3 NH4+ permeability | 51, 52 |
| fM | 2 | NHE3 pH modifier | 51, 52 |
| fm | 0 | NHE3 pH modifier | 51, 52 |
| KI | 1 μM | NHE3 pH modifier | 51, 52 |
| JNa+-ATPase,max | 2.1091 × 10⁻⁹ mol·cm−2·s−1 | Na+-ATPase maximum flux | 51, fitted |
| KNa+-ATPase | 3.31 mM | Na+-ATPase Na+ affinity | 51 |
| JNaHCO3,max | 7.088 × 10⁻¹⁰ mol·cm−2·s−1 | Na+-HCO3− cotransporter maximum flux | 17, fitted |
| KHCO3−,NaHCO3 | 19 mM | Na+-HCO3− cotransporter HCO3− affinity | 17 |
| KNa,NaHCO3 | 14 mM | Na+-HCO3− cotransporter Na+ affinity | 17 |
| PNH4+ | 3.06 × 10⁻² cm/s | Membrane NH4+ permeability | 51 |
| PCO2 | 0.5 cm/s | Membrane CO2 permeability | 51 |
| Dproton | 12 × 10−5 cm2/s | Diffusion coefficient of protons | 44, 45 |
| DNa | 1.334 × 10⁻⁵ cm2/s | Diffusion coefficient of Na+ | 44, 45 |
| Dbuffer | 33 × 10−7 cm2/s | Diffusion coefficient of pH buffer | 44, 45 |
| DNH3 | 1.27 × 10⁻⁵ cm2/s | Diffusion coefficient of NH3 | 44, 45 |
| DNH4+ | 1.27 × 10⁻⁵ cm2/s | Diffusion coefficient of NH4+ | 44, 45 |
| DCHCO3 | 1.3 × 10⁻⁵ cm2/s | Diffusion coefficient of CHCO3 | 44, 45 |
| DCO2 | 1.105 × 10⁻⁵ cm2/s | Diffusion coefficient of CO2 | 44, 45 |
At the basolateral side, Na+ is transported out of the cell by either the Na+/K+ pump or the Na+-HCO3− cotransporter. The Na+/K+ pump model is from Weinstein et al. (52) and was implemented assuming a constant intracellular concentration of K+ and constant extracellular concentrations of Na+ and K+. The model of the Na+-HCO3− cotransporter was adapted from Gross et al. (17), and it does not take external Na+ and HCO3− into account. We adjusted the maximum fluxes of the basolateral Na+-HCO3− cotransporter and Na+/K+ pump to set the initial cytosolic Na+ and HCO3− concentrations at physiological levels. We assumed that external Na+, K+, and HCO3− concentrations are constant at the basolateral side. We also tested an alternative model of the Na+-HCO3− cotransporter in which we assumed linear kinetics, and the model gave the same results.
Reactions.
The reactions between the protons and buffer systems were implemented explicitly. Thus, it is possible to change the diffusion coefficient of each solute directly. All the details of the reactions are shown in Table 4. Below, the subscripts “cyt” and “lum” indicate whether the reaction takes place in the cytosol or lumen, respectively.
Table 4.
Reactions
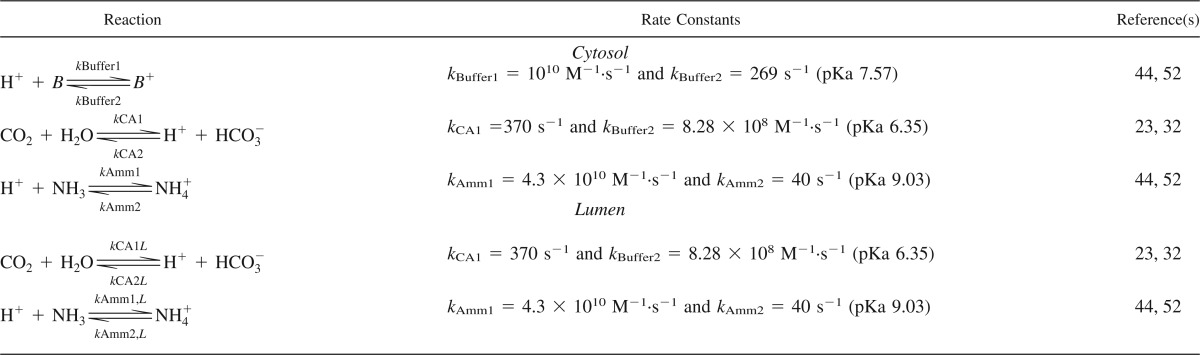
Cytosolic pH is buffered by various molecules (B), and we lumped all the reactions into the following general buffer reaction:
that we modeled with the following rate equation:
The description of the diffusion and reactions of the cytosolic buffer becomes:
where D is the diffusion coefficient for the endogenous pH buffer in the cytosol.
We also included the buffer reaction between NH3 and NH4+ (44, 45, 52), with the following rate equation:
where subscript “Amm” indicates ammonia. The corresponding equations for reaction and diffusion in the cytosol become:
With the equations for the lumen:
In both the lumen and cytosol, we explicitly modeled the bicarbonate buffer system as follows:
where the first reaction is catalyzed by carbonic anhydrase (CA). Because of the efficient catalysis by CA and high rate of the second reaction, it is, under most conditions, sufficient to consider only the net reaction (6, 49):
We assumed that the activity of water is constant; thus, the corresponding rate equation becomes:
where subscript “Bicar” indicates bicarbonate. The corresponding equations for reaction and diffusion in the cytosol become:
With the equations for the lumen:
CAII is present in the cytosol of PT cells, whereas membrane-associated isoforms CAIV and CAXII are exposed to the lumen. In addition, CAXIV is also present in the lumen in rodents (41). CA is one of the enzymes with the highest turnover number, but the maximum turnover is difficult to estimate, especially in the lumen. We assumed that CA is uniformly distributed in both the lumen and cytosol. In a noncatalyzed system, kCA1 is 0.037 s−1 (23), and in the kidney the rate is assumed to be 10,000 times higher due to CA (32). Ninety-five percent of total CA in the PT is the cytosolic isoform CAII, and the remaining 5% is the membrane-attached isoforms (41). CAII has a turnover number that is 30–230% higher than the isoforms exposed to the lumen, and the efficiency coefficient (kcat/Km) is 200–300% higher for CAII (20, 39). Hence, the major part of CA is present in the cytosol, with only a minor part (5%) is exposed to the lumen, and, with respect to the absolute activity, that number is even smaller.
Because of the uncertainty with regard to the size of luminal CA activity, simulations were performed for a range of luminal CA activities relative to cytosolic CA activity.
We assumed that proton mobility can be described as simple diffusion, as is also the case with the other ions and molecules in the model. The diffusion coefficients were obtained from in vitro studies in cardiomyocytes (44, 45). The corresponding equations for reaction and diffusion of protons in the cytosol and lumen become:
The diffusion equations for Na+ are as follows:
Boundary and initial conditions.
The initial conditions are shown in Table 5. Initially, all ions and molecules were distributed homogeneously in the cytosol and/or lumen. We assumed that 0.5 μm from the tip of the microvilli the luminal concentrations of CO2, NH4+, H+, and Na+ are constant and that the concentrations on the interstitial side of the basolateral membrane remain constant.
Table 5.
Boundary and initial conditions
| Variable | Value | Reference(s) |
|---|---|---|
| Boundary in the lumen and initial condition | ||
| CO2 | 1.5 mM | 52 |
| H+ | 4.9431 × 10⁻⁵ mM | 52 |
| Na+ | 140 mM | 52 |
| NH4+ | 0.2 mM | 52 |
| Initial condition in the lumen | ||
| HCO3− | 13.55 mM | 52 |
| NH3 | 4.775 μM | 52 |
| Initial condition in the cytosol | ||
| CO2 | 1.4995 mM | 52 |
| H+ | 4.67 × 10⁻⁵ mM | 52 |
| Na+ | 20.9 mM | 52 |
| NH4+ | 0.14 mM | 52 |
| HCO3− | 14.265 mM | 52 |
| NH3 | 2.8 μM | 52 |
| B+ | 16.494 mM | 15, 21 |
| B | 9.5062 mM | 15, 21 |
Axial symmetry is applied along the z-axis. On the other vertical boundary of the lumen and cell cytosol, we applied no flux conditions, that is, no transport across these boundaries. On the boundaries that correspond to the cell membrane, the boundary conditions are given by the fluxes across the membrane (Table 1).
Activation.
In the model, the microvillus is 3 μm long, and it is assumed that NHE3 is initially uniformly distributed in the membrane, except for the curved inner part of the wrinkle (Fig. 1B). To model the redistribution of NHE3, the flux carried by NHE3 is compressed to a 40-nm band at the base (Fig. 1C) (55). During control conditions, NHE3-mediated flux is distributed evenly across the plasma membrane of the microvillus (Fig. 1B, green bar). To simulate pressure natriuresis where NHE3 is redistributed to the base of the microvillus, we rescaled NHE3 activity (Table 3, Asurface) and localized it to a thin band near the base of the microvillus (Fig. 1C, green bar). Total maximum NHE3 activity is, therefore, the same before and after activation.
Description of experiments.
All experiments were performed on male Sprague-Dawley rats (200–250 g body wt) that were kept under diurnal light conditions and had free access to food and water. Rats were obtained from Charles River Breeding Lab (Wilmington, MA) and were kept under specific pathogen-free conditions. All experimental protocols were approved by the Animal Care and Use Committee of the University of Southern California. Rats were anesthetized with Inactin (100 mg/kg ip, Sigma), and nonsurviving surgery was carried out on a temperature-controlled rat operating pad (Vestavia Scientific, Birmingham, AL). The trachea was cannulated to facilitate breathing, and a catheter was inserted into the carotid artery for continuous blood pressure measurements by a pressure transducer using a BP-1 Blood Pressure Monitor (World Precision Instruments, Sarasota, FL). Albumin (1% BSA)-containing saline and 5-(N-ethyl-N-isopropyl) amiloride (EIPA; 1.5 mg/kg, Sigma) injections were administered via a catheter inserted into the right jugular vein. Blood pressure was increased acutely by constriction of the superior mesenteric and celiac arteries as well as the abdominal aorta below the renal arteries with silk ligatures, as previously described (55–57). The rat was temporarily removed from the microscope stage when the arteries were constricted.
In vivo imaging of the PT was achieved using modifications of previously described methods (22, 40). The left kidney was located by palpation and exteriorized via a left flank incision. The pH-sensitive dye BCECF AM (50 μg, Invitrogen) was dissolved in 2 μl DMSO, diluted with 0.9% saline to 50 μl, and injected into the subcapsular space. The rat was transferred to the microscope stage and maintained at 37°C with a homeothermic blanket. Intravital fluorescence microscopy was performed using a Leica TCS SP5 confocal imaging system (Leica Microsystems, Heidelberg, Germany) with a HCx PL HPO CS ×63 (1.3 numberical aperture) glycerol immersion objective. The PT was identified by the apical brush border structure, basolateral nucleus BCECF was excited with a 496- and 458-nm argon laser, and emission was detected at 500–600 nm. BCECF (496/458-nm excitation) ratio images were generated using Leica LAS imaging software.
RESULTS
NHE3 redistribution decreases Na+ reabsorption.
Under resting conditions, NHE3 is distributed uniformly along the microvilli of the brush border, but during pressure natriuresis, NHE3 redistributes to the base of the brush border (42, 55). In the model, we implemented this redistribution with a step function that changes from 1 to 0 within 10 s (Fig. 2A), where 1 indicates uniform NHE3 distribution and 0 indicates that NHE3 is at the base. After redistribution, the model predicted a decrease in average cytosolic Na+ concentration (Fig. 2B) and a transient decrease in average cytosolic pH (Fig. 2C). Note that the transient decrease in average cytosolic pH coincides with the drop in Na+ concentration. In addition, the model predicted a reduction (32%) in NHE3-mediated Na+ reabsorption, which is quantified as Na+ flux across the basolateral side (Fig. 2D). In these simulations, luminal and cytosolic CA activity were identical. The effect in the model was completely reversible, and normal Na+ reabsorption was restored when NHE3 was redistributed to the entire brush border surface (not shown).
Fig. 2.

Simulation of redistribution of NHE3. A: redistribution of NHE3 in the brush border was modeled using a step function where its location was changed from being uniformly distributed to being located only at the base of the microvilli at time = 5,000 s. AU, arbitrary units. B and C: redistribution of NHE3 in the model was associated with a decrease in the average cytosolic Na+ concentration and a transient drop in cytosolic pH. D: Na+ reabsorption decreased rapidly and remained constantly low even after pH had partly normalized. Luminal carbonic anhydrase (CA) activity was the same as cytosolic CA activity.
Reduced Na+-K+-ATPase activity.
The model predicted that there is a drop in cytosolic Na+ concentration after redistribution of NHE3 (Fig. 2). The activity of Na+-K+-ATPase is also reduced during pressure natriuresis by 25–50% (58, 59). We implemented that in the model to address the decrease in cytosolic Na+ concentration. Figuer 3 shows simulations where we gradually decreased the activity of the Na+ pump at the basolateral side by up to 50%. Otherwise, the parameters were as shown in Table 3. As expected, lowering the activity of Na+-K+-ATPase increased the cytosolic Na+ concentration (Fig. 3A) and lowered the reabsorption, secondary to a reduced, inward directed Na+ gradient (Fig. 3C). The reduced reabsorption led to a slight cytosolic acidification (Fig. 3B), which is due to reduced NHE3 activity and an increase in Na+-HCO3− cotransporter activity.
Fig. 3.

A decrease in Na+-K+-ATPase activity decreases Na+ reabsorption both before and after NHE3 redistribution. The mathematical model was simulated for various values of basolateral Na+-K+-ATPase activity. The activity of Na+-K+-ATPase was reduced relative to the value previously used (see Table 3) from 1 (cyan), 0.8 (pink), 0.7 (blue), 0.65 (yellow), 0.635 (green), 0.6 (red), to 0.5 (black). A: reducing Na+-K+-ATPase activity increased the cytosolic bulk concentration of Na+. B: simulations showed that decreasing the Na+-K+-ATPase level decreased average cytosolic pH. C: reduced Na+-K+-ATPase activity would also reduce Na+ reabsorption. Luminal CA activity was 10% of cytosolic CA activity in all simulations.
When the activity of Na+-K+-ATPase was kept constant, the change in Na+ absorption due to redistribution of NHE3 resulted in decreased cytosolic Na+ concentration (Fig. 3A). If we assume that cytosolic Na+ should remain unchanged during pressure natriuresis, Na+-K+-ATPase activity should be decreased to ∼63.5% of the initial activity after the redistribution of NHE3 (Fig. 3A), which is within the experimentally observed range. This decrease in Na+-K+-ATPase activity offsets the decrease in cytosolic Na+ due to the reduced uptake of Na+ via NHE3. The combined decrease in Na+-K+-ATPase and NHE3 activity results in a decrease in Na+ reabsorption of 37%, in contrast to the 32% decrease when only NHE3 activity decreased (see above).
CA activity.
NHE3 is sensitive to both cytosolic and luminal pH (51); thus, the activity of CA is important, since it determines the apparent availability of the bicarbonate buffer system. However, there is uncertainty regarding the level of luminal CA activity. The activity of luminal CA was initially modeled as equivalent to the activity in the cytosol despite the possibility that the activity in the lumen could be 10- to 100-fold lower. We explored how the activity of luminal CA affects reabsorption (Fig. 4). Reducing the activity of luminal CA below that of the cytosolic activity decreased the average cytosolic Na+ concentration and reabsorption of Na+, but cytosolic pH remained almost unaffected. The reduction in cytosolic Na+ concentration, which the model predicted at luminal CA levels that were 10-fold lower, could be adjusted by decreasing Na+-K+-ATPase activity by 38.6%.
Fig. 4.

Luminal CA activity controls Na+ reabsorption. The activity of luminal CA activity was changed relative to cytosolic CA activity from 1 (blue), 0.3 (yellow), 0.1 (green), 0.05 (red), to 0.01 (black), and the impact was tested on Na+ reabsorption before and after NHE3 redistribution. A: decreasing luminal CA activity decreased cytosolic bulk Na+ concentration slightly. B: cytosolic pH was hardly affected. C: reabsorption of Na+ was also decreased when luminal CA activity was decreased, and the relative difference in reabsorption after redistribution of NHE3 was increased when luminal CA activity was decreased.
Figure 5 shows model predictions of pH in the cytosol and lumen before and 5,000 s after the redistribution of NHE3. The model reached a steady state in both of these situations. Before perturbation, there was no pH gradient in the cytosol or in the lumen, whereas at 5,000 s, when NHE3 activity was localized to the base of the microvilli, pH gradients appeared. It is interesting to note that the cytosolic pH domain is smaller compared with the luminal pH domain (Fig. 5). The cytosolic pH domain is localized in the vicinity of the NHE3 cluster. In contrast, the luminal pH domain extends over a larger area, occupying the lower part of brush border structure. Notice that there are gradients both along and between the villi. The pH domain in the intervillous space is larger, because the buffer capacity is lower in the lumen compared with the cytosol.
Fig. 5.

Local pH domains. The illustration shows pH in the cytosol (left) and in the lumen (right) before NHE3 is redistributed to the base of the microvilli (top). Note that each image has its own pH scale. During control conditions, there are no pH gradients in the cytosol or in the lumen. Modeling acute hypertension by redistributing NHE3 to the base of the microvilli (bottom) shows that redistribution of NHE3 can give rise to the development of pH microdomains near the base of the microvilli. Luminal CA activity was the same as cytosolic CA activity.
In the cytosol, pH initially decreased transiently on a global scale (Fig. 2C), whereas pH gradually increased near the clustered NHE3 and a higher pH level was established (Fig. 5). During the same time, pH decreased locally in the lumen. Thus, the redistribution of NHE3 provokes the emergence of local, transmembrane acidification/alkalinization because NHE3 exchanges Na+ for H+. Because NHE3 is inhibited by increasing cytosolic pH (i.e., by decreasing cytosolic H+ concentration) (51), the model predicts that total activity of NHE3 will decrease after redistribution to the base of the brush border. However, the model did not predict Na+ domains of any significance. The model did not suggest that there would be local variations in the concentration of Na+ of >0.05 mM in the lumen and 0.07 mM in the cytosol. In contrast to the situation for protons, the concentration of Na+ is relatively high in both the lumen and cytosol, the mobility is high, and there are no Na+-buffering effects. Together, these three factors act against the development of Na+ microdomains in this model.
Diffusion and concentration of mobile buffer.
The model contains a mobile pH buffer that models the effect of proteins and other molecules that buffer cytosolic pH. The diffusion coefficient of the buffer has been estimated (33 × 10−7 cm2/s) from studies and models of cardiomyocytes (44). Hence, we modeled the impact of changing the diffusion coefficient of the buffer (mobile) from 0.33 to 330 × 10−7 cm2/s. However, changes in the diffusion coefficient over this large range changed reabsorption by <5%.
The concentration of buffer was approximated from studies in PT cell lines where the total buffer capacity was reported to be between 20 and 45 mM/pH unit (15, 21). In the model, the concentration of the endogenous buffer was set at 26 mM (pKa 7.57), and the bicarbonate concentration was set at 14 mM (pKa 6.35). We explored the effect of changing the buffer capacity, i.e., the concentration of the intracellular H+ buffer. We simulated the model for concentrations of endogenous buffer that are a factor of 10 higher or lower than in previous simulations. Before redistribution of NHE3, changes in the H+ buffer concentration did not affect the Na+ concentration, pH, or reabsorption rate. However, after the redistribution of NHE3, the changes in the endogenous H+ buffer concentration had a modest impact on average cytosolic Na+ concentration and reabsorption, but only little effect on average cytosolic pH, except for the transient drop. If Na+-K+-ATPase activity was modified so cytosolic Na+ concentration was constant, the model predicted that, when the pH buffer was reduced with a factor of 10, the NHE3 redistribution would reduce Na+ reabsorption by 50%. When the pH buffer concentration was increased with a factor of 10, NHE3-mediated Na+ reabsorption was reduced with 25%. This is in contrast to the 37% reduction in NHE3-mediated Na+ reabsorption the model predicted for a “normal” buffer level. These effects can be ascribed to a higher pH in the cytoplasmic microdomain for the low buffer concentrations and less dominant pH domains in the case of the the higher buffer concentration (results not shown).
Location of NHE3.
Both biochemical and image analyses have indicated that NHE3 is translocated to the very base of the microvilli (42, 55), which we implemented in the model. The results indicate that the reduction of Na+ reabsorption is based on local changes in pH inside the cell (i.e., in the cytosol) as well as outside the cell (i.e., in the lumen) when NHE3 is concentrated in local areas. To address how the area of NHE3 redistribution correlates with the reduction in reabsorption, we simulated several scenarios where the area of the NHE3 redistribution site was changed (Fig. 6). In Fig. 6, the dashed lines correspond to simulations with unchanged Na+-K+-ATPase activity, whereas the solid lines correspond to a decrease in Na+-K+-ATPase activity to 63.5% of initial activity. The reabsorption of Na+ and cytosolic Na+ concentration remained unchanged as long as the area to which NHE3 was redistributed was above 20–30% of the initial area, and the changes were pronounced only when the area was below 5–10% of the initial area. In the previous simulations, the ratio of the area before and after redistribution was 2%.
Fig. 6.

Relative distribution of NHE3 in the brush border structure and the reabsorption rate. NHE3 was redistributed in the microvilli, and the average cytosolic Na+ concentration (A) and reabsorption after redistribution (B) are shown. All parameters were as shown in Table 3. Luminal CA activity was 10% of cytosolic CA activity in all simulations. The position of NHE3 was changed so it was moved away from the tip and concentrated toward the base. The x-axis shows to which degree it was concentrated. A value of 1 indicates that the area NHE3 is distributed in before and after redistribution is the same, i.e., no change. A value of 0.2 indicates that the area of distribution of NHE3 after translocation is 20% of the initial area. The dashed curves show the situations where basolateral Na+-K+-ATPase has unchanged activity, and the solid curves show when the activity has been reduced to 63.5% of the baseline value (Table 3).
Mixing of the fluid in the luminal part of the brush border.
Experimental and theoretical studies have suggested that there is little or no flow in the brush border region (4, 18). If there is a flow in the brush border, it would mix the luminal fluids better and hence reduce the extracellular luminal pH domain. To test the possible consequences of the no-flow assumption, we simulated the situation where the extracellular region of the brush border is well mixed, i.e., where no local extracellular gradients can appear. We did this by allowing NHE3 to remain evenly distributed in the microvilli on the luminal side, whereas cytosolic NHE3 was still redistributed to the base of the microvilli. In this case, the model suggests that NHE3-mediated Na+ reabsorption will be reduced by 31%, which is slightly lower than 37% predicted by the model when the lumen is acidified locally.
Experimental support.
The model predicted that translocation of NHE3 to the base of the brush border induces local pH domains. To test this prediction experimentally, we measured cytosolic pH changes in optical sections of the PT in vivo in rats using confocal fluorescence microscopy both before and after an increase in blood pressure (by ∼50 mmHg). After BCECF loading, tubules were open, indicating that there was flow through the tubule and that the kidney was not damaged. Initially, the ratio of BCECF fluorescence was uniform throughout the cells except for a slightly higher intensity in the nucleus (Fig. 7, A and C). This is in accordance with a previous investigation (50) that also found that BCECF accumulates in the nucleus.
Fig. 7.
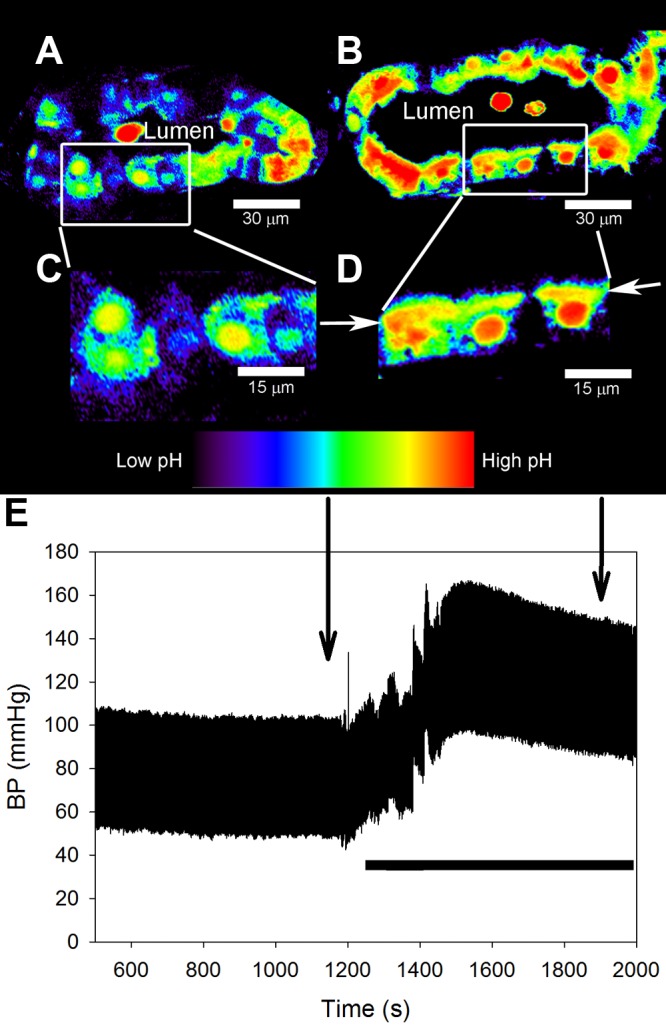
Acute hypertension in rats induces the development of local pH microdomains in the PT. A: intravital confocal fluorescence images showing that before an increase in blood pressure, the signal from BCECF was uniform in PT cells. Pseudocolor images are shown based on the ratio of BCECF fluorescence intensities at 496/458-nm excitation, reflecting regional differences in pH. The lumen of the PT is indicated. B: after an increase in blood pressure, the BCECF fluorescence ratio (local pH) increased near the base of the apical (brush border) membrane structure. Selected areas from A and B are magnified in C and D, respectively, as shown. D: arrows point at the base of the brush border. Small subapical vesicles are visible near the brush border, indicating that the increase in BCECF fluorescence ratio occurs near the base of the brush border. E: blood pressure was recorded continuously throughout the experiment, and the images in A–D were acquired at the indicated time points. Blood pressure was increased by ligating the lower aorta and mesenteric and celiac arteries, as indicated by the solid horizontal bar.
After an elevation of blood pressure (Fig. 7E), we observed an isolated increase in the BCECF fluorescence ratio near the base of the apical brush border, indicating alkalization of the cytosol in that microdomain (Fig. 7, B and D, arrows), as predicted by the models. Specifically, the band of red/yellow in Fig. 7D was more intense than the band of yellow in Fig. 7C. The rat was temporarily removed from the microscope stage during constriction of the arteries, so the tubule shown in Fig. 7A is not the same as that shown in Fig. 7B. The band persisted for at least 10 min. After 10 min, the experiment was terminated, and the rat was removed from the microscope.
The increase in the BCECF fluorescence ratio near the base of the brush border was observed in several different PT segments and cells, as shown in the low-power image (Fig. 8A). To test the hypothesis that local alkalization near the brush border in PT cells (Fig. 8) was due to the redistribution of NHE3, we injected EIPA (1.5 mg/kg) intravenously after the increase in blood pressure. EIPA is an inhibitor of NHEs, including NHE3 (46). EIPA caused a moderate decrease in the BCECF fluorescence ratio throughout the cells, corresponding to a reduction in cytosolic pH (Fig. 8). Specifically, the band of yellow in Fig. 8E was slightly less intense than the band of yellow in Fig. 8D. Importantly, EIPA administration diminished the local pH gradient near the base of the brush border in response to elevated blood pressure (Fig. 8, D and E, arrows).
Fig. 8.
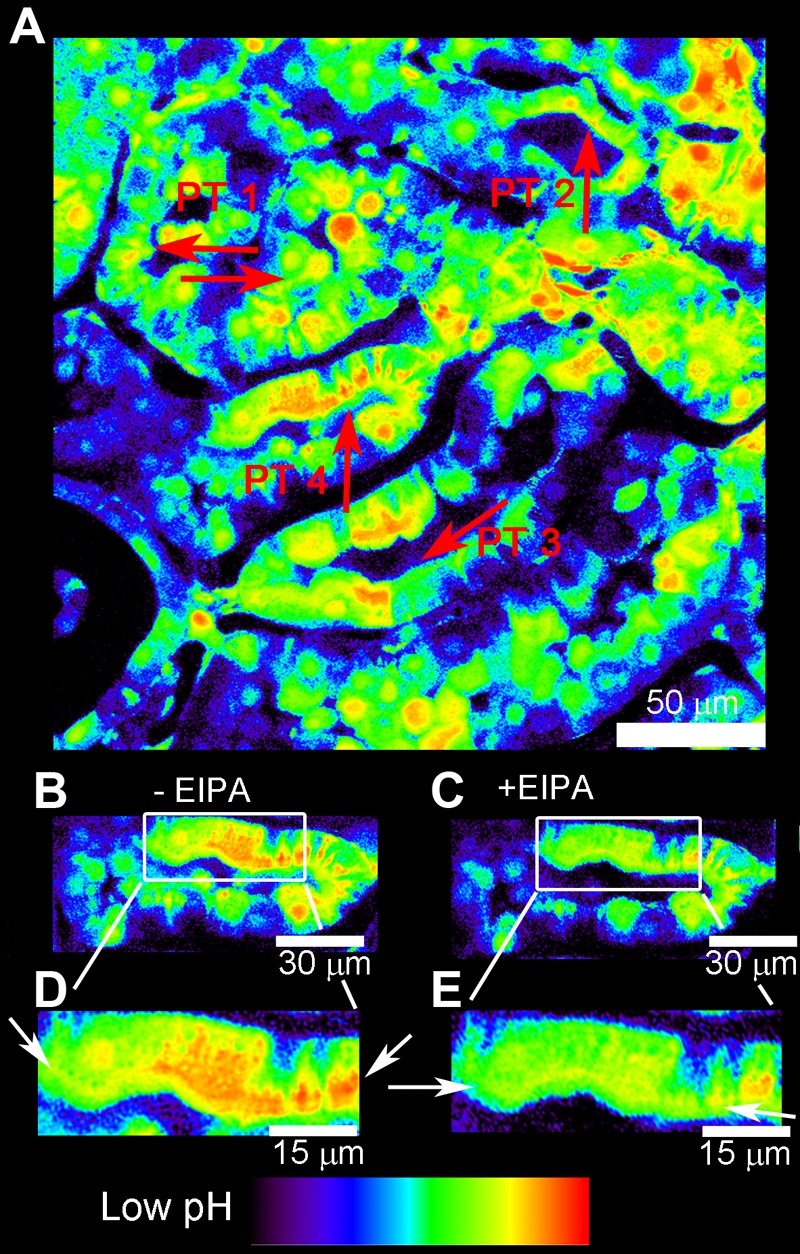
pH microdomains are sensitive to NHE inhibition with 5-(N-ethyl-N-isopropyl) amiloride (EIPA). The left kidney was loaded with BCECF, and blood pressure was measured as described in Fig. 7. A: low-power BCECF ratio image of a larger renal cortical area taken after blood pressure elevation. Four adjacent PTs (PT 1–PT 4 in the lumen) are shown. Arrows point to the high BCECEF fluorescence microdomains at the base of the brush border in each PT. B: after an increase in blood pressure, we observed that the BCECF fluorescence ratio (local pH) was increased near the base of the apical brush border of the PT (arrows). C: in the same PT tubule segment, the administration of EIPA (1.5 mg/kg iv via the jugular vein) caused a reduction of pH gradients (arrows). The same selected areas from B, before EIPA, and C, after EIPA, are highlighted in D and E, respectively.
DISCUSSION
In the present study, we used a multidisciplinary approach to investigate the effect of NHE3 redistribution within the brush border of the S1/S2 segments of the PT and tested whether redistribution could contribute to the reduced Na+ reabsorption after an acute increase in blood pressure. We constructed a spatiotemporal model of NHE3-mediated PT Na+ reabsorption, which predicted that redistribution of NHE3 to the base of the brush border leads to the development of local pH domains near the base of the brush border on both cytosolic and luminal sides. The local changes in pH reduced NHE3 activity because NHE3 is pH sensitive and because H+ is a substrate for NHE3. To validate the predictions of the model, we measured the changes in cytosolic pH in the PT in vivo. We found that an acute increase in blood pressure, which is known to induce redistribution of NHE3 to the base of the brush border, resulted in the development of a microdomain of high pH in the area.
The model was constructed to address the specific question of whether redistribution of NHE3 in the brush border by itself can reduce Na+ reabsorption. The model is based on conservative assumptions regarding parameter values of which we have only limited prior knowledge. We tested the effect of varying the values of some of the central parameters in the model. We found that for a conservative set of parameters, the model can explain a decrease in NHE3-mediated Na+ reabsorption of ∼30% after the onset of pressure natriuresis.
The model was sensitive to luminal CA activity (Fig. 4). We did not include other diffusible buffer systems in the tubular lumen, e.g., phosphate. Phosphate does not play a significant role as a buffer at higher levels of CA activity but may become quantitatively important at the lowest levels due to the less efficient buffering by bicarbonate. Very low levels of luminal CA activity are most likely not physiologically relevant, but the omission of the luminal phosphate buffer could lead to an overestimation of the effects of NHE3 redistribution on Na+ reabsorption at the lowest levels of luminal CA activity. In this connection, it should be noticed that it is not known whether part of luminal CA is also redistributed during pressure natriuresis.
The model predicted that redistribution of NHE3 to the base of the brush border, by itself, would reduce PT NHE3 Na+ reabsorption by at least 32%. NHE3 is the dominant Na+ transporter in the apical membrane in the PT, and studies (1, 52) have suggested that it may be responsible for up to 50% of Na+ reabsorption in the PT. In accordance with this, a PT-specific NHE3 knockout mouse model showed a 27% reduction in volume reabsorption compared with wild-type mice (28). Previous experimental studies in rats have found reductions of PT total Na+ reabsorption of up to 40% during pressure natriuresis (9, 10, 57). The predictions of the model are close to the experimental observations. However, the gap between the predictions of the model suggests that factors other than the simple redistribution of NHE3 also contribute to the reduction in PT reabsorption.
A reduction in NHE3 activity will automatically reduce bicarbonate reabsorption. In the first part of the PT, the concentration of Cl− increases due to the preferential reabsorption of bicarbonate together with Na+. This differential reabsorption of HCO3− over Cl− creates an electrochemical transepithelial gradient that mediates reabsorption of Cl− in the latter part of the PT. The reabsorption of Cl− will drive additional Na+ reabsorption. Hence, reduced NHE3 activity in the early part of the PT reduces Na+ reabsorption in both the early and late part of the PT. Hence, the reduction in Na+ reabsorption of 32–36%, due to the redistribution of NHE3 in the brush border, could be amplified by such secondary consequences.
We did not include transepithelial potential or membrane potential in the model and the literature does not, to the best of our knowledge, support that transepithelial potential or membrane potential should change in the PT during pressure natriuresis. Reabsorption of Na+ by NHE3 is not electrogenic and does not contribute to membrane potential. Experiments have shown that neither membrane potential of epithelial cells in PTs from rabbits (27) or transepithelial potential in PTs of rats (16) are affected by amiloride. When flow in the PT is increased from 5 to 19 nl/min, the rate of PT reabsorption increases ∼100%, but transepithelial potential remains constant (13, 14). The flow-induced reabsorption is mediated by NHE3 and proton pumps (13, 14). Therefore, we find it unlikely that a reduction in NHE3 activity will give rise to a significant change in transepithelial potential or membrane potentials, which otherwise could have secondary effects on SGLT2 activity and paracellular transport.
Experimentally, we measured cytosolic pH in the PT before and after acute blood pressure elevations by intravital confocal microscopy after subcapsular injection of a pH-sensitive dye. pH-sensitive dyes are, in principle, pH buffers, and the additional buffer capacity has the potential to obscure the results. Initially, 50 μg BCECF-AM was dissolved in 50 μl, which corresponds to a concentration of 1.7 mM. After the subcapsular injection of the dye, we observed that most of the dye was localized to a small area with a radius of 2–3 mm. Measurements were only collected in areas with low to moderate loading. Assuming a modest intracellular accumulation of the dye, we estimate an intracellular dye concentration of 1–5 mM in the areas where measurements were made. The cytosolic pH buffer capacity is between 20 and 45 mM/pH unit (15, 21), so an additional 1–5 mM will, at the most, increase the buffer capacity by 25%. In myocytes, 0.4 mM of the pH-sensitive dye SNARF-1 has only a marginal effect on cytosolic pH and is sufficient to measure pH and gradient formation (48). In the renal PT, an increase in pH buffer concentration of 0.4 mM would correspond to a change in buffer capacity of only 1%. We tested the effect of increasing intracellular buffer capacity with the model and found that increasing the endogenous buffer concentration by a factor of 10 had only a marginal effect on changes in the reabsorption rate after redistribution of NHE3 (not shown).
Reabsorption of Na+ and pH regulation have been modeled extensively in the PT (25, 26, 51, 52). Those models paid careful attention to correct stoichiometric reabsorption between all the different ions and other molecules involved in these complex processes. In the present study, we focused on the effect of changing the position of NHE3 in the brush border. The model used in the present study is not a general model of Na+ reabsorption in the PT, but a specific model of NHE3-mediated Na+ reabsorption across a PT cell. Because the activity of NHE3 is pH dependent, we included the essential reactions that determine local pH. We simplified the model by only including bicarbonate, ammonium, and an unspecified mobile cytosolic buffer. Additional buffers in the PT include phosphate and formate (1, 25, 52). Phosphate is reabsorbed together with Na+ at the luminal membrane by the Na+-phosphate cotransporter, which is endocytosed during pressure natriuresis (35). In this model, we focused only on the effect of NHE3 redistribution while keeping all other possible variables constant. Adding endocytosis of the Na+-phosphate cotransporter would have amplified the effect of pressure natriuresis on tubular reabsorption but would have resulted in a more complex model. The Na+-phosphate cotransporter accounts for <2% of PT Na+ reabsorption (52); nonetheless, a change in phosphate metabolism could also alter Na+ reabsorption indirectly through effects on the pH. Phosphate has a pKa of 7.21 (29), so if the concentration is reduced, pH would increase (cytosolic pH is ∼7.3) and inhibit NHE3 activity further. Formate is secreted by the Cl−/formate exchanger (1), and the cytosolic concentration of formate is low (<1 mM) compared with bicarbonate (∼25 mM), although their pKa values are similar (25, 26, 52). Hence, including tubular formate in the model would not change the conclusion of the present study.
The present model focused on the effect of NHE3 redistribution on tubular Na+ reabsorption. Consequently, we did not include other transport mechanisms that mediate apical Na+ transport, primarily Na+-coupled cotransporters. It could be argued that upregulation of the activity of other transporters, like Na+-glucose (SGLT1 and SGLT2) and Na+-amino acid cotransporters, could attenuate the effect of NHE3 redistribution. Although we cannot exclude this possibility, it has to be considered that, because of the relatively small concentrations of glucose and amino acids in the filtrate, these transporters are only responsible for a minor fraction of PT Na+ reabsorption. Thus, mice deficient in SGLT2, the isoform located in the PT, have an unimpaired tubular reabsorption of Na+, K+, and Cl− (47). Furthermore, increased PT Na+ reabsorption by these cotransporters would require additional amounts of the relevant solutes. Since there is no change in glomerular filtration rate during pressure natriuresis, it is difficult to see how this could occur. We therefore find it unlikely that compensatory increases in the activity of these cotransporters lead to a major attenuation of the effect of NHE3 redistribution on tubular Na+ reabsorption.
Based on experimental and theoretical studies (4, 18), we assumed that there is no flow in the luminal part of the brush border. Flow in the brush border will mix the contents of the luminal fluids and, hence, reduce local gradients in the extracellular luminal pH domain. To test the effect of a more “well-mixed” fluid in the luminal brush border region, we assumed that NHE3 remains evenly distributed in the microvilli on the luminal side, whereas NHE3 on the cytosolic side is still redistributed to the base. This is clearly an artificial situation, but it allows us, in a simple way, to model a situation where there is no local pH gradients on the luminal side. With this assumption, the decrease in NHE3-mediated reabsorption was only 31%, which is slightly lower than the 37% predicted by the model when the lumen is allowed to acidify locally. The slightly reduced effect is not surprising since NHE3 activity increases when luminal pH increases from 6 to 8 (51). The effect of the mixing prevents the development of local acidification in the tubular lumen and prevents part of the drop in NHE3 activity. It is, however, also evident that the major effect of the redistribution of NHE3 is due not to the localized extracellular acidification but rather to intracellullar alkalinization.
In addition to NHE3, the apical membrane of the PT also contains Cl−/formate and Cl−/HCO3− exchangers (1). The spatial distribution of Cl−/formate and Cl−/HCO3− exchangers in the microvilli during pressure natriuresis is, to the best of our knowledge, not known. Both of the transporters exchange one cytosolic formate or HCO3− for one luminal Cl− (1), which counteracts the pH effect of NHE3. Hence, if the two exchangers were to be redistributed together with NHE3 to the base of the brush border, this would reduce the effect of the redistribution of NHE3. However, since the total flux of these two exchangers is ∼25% of total NHE3 flux (52), the pH effect due to NHE3 redistribution would still be present.
Previous models of Na+ reabsorption in the PT have modeled the entire PT, including the brush border, and, for computational reasons, the microvilli were described as one-dimensional, i.e., infinitely thin (25, 52). In contrast, in the present study, we modeled the full geometry of a single microvillus. On the other hand, our model lacks some of the detail of the previous models by Weinstein et al. (25, 52). In the present study, we focused on NHE3-mediated Na+ reabsorption and on the local effects when NHE3 is redistributed within the microvillar membrane during pressure natriuresis. In previous models that included formate metabolism and CA activity in the PT, the authors did not report local pH changes in the brush border (25, 26), nor did we observe pH changes in the unperturbed state with evenly distributed NHE3 (Fig. 5). After NHE3 redistribution, our model predicted the development of pH domains that extend both longitudinally and perpendicular to the microvillar membrane. Clearly, such an effect is only detectable in a 2-D model. For computational reasons, it would not be feasible to model the entire PT in this fashion. Thus, different problems require different models and assumptions.
Numeric analysis of alterations in the BCECF fluorescence ratio was not performed because intravital calibration of BCECF fluorescence to pH values was not feasible. Nevertheless, the acute hypertension-induced development of local pH gradients at the base of the apical brush border was directly visualized (Figs. 7 and 8) and provided an experimental proof of concept for our main hypothesis. The pH domain that we observed in vivo appears spatially larger than those predicted by the mathematical model. We speculate that at least two factors could contribute to this difference. First, the intact convoluted PT has a complex 3-D structure. Optical sectioning may not always cut cells perfectly along their apicobasilar axis. Depending on the position and angle of the confocal optical section (plane) through the cell body, more or less of the apical microdomains will be present in the image. This may lead to the overestimation of the thickness of the pH microdomain. A second possibility for the discrepancy between the mathematical model and the in vivo imaging could be that we have overestimated the pH buffer capacity in the model, that is, when we reduce the amount of pH buffer in the mathematical model, the pH domain becomes wider.
Microdomains have been recognized for a long time. Ca2+ microdomains are known to play an important role in regulation of cell signaling: Ca2+ microdomains near the mouth of Ca2+ channels (36, 38), in synapses (30, 31), submembrane Ca2+ microdomains between the endoplasmic/sarcoplasmic reticulum and the plasma membrane (34), or in wrinkled membrane spaces (7, 8, 11, 37). The regulation of Ca2+ microdomains appears to be closely connected to the tight buffering of free cytosolic Ca2+ (38). Ca2+ microdomains are usually only observed in the vicinity of Ca2+ channels or in larger volumes when that volume is partly isolated from the rest of the cell, e.g., the synapses (5). Ca2+ microdomains occur when a large influx of Ca2+ exceeds the diffusion capacity of Ca2+ together with an exhaustion of the Ca2+ buffer capacity. In the present study, we did not observe a complete exhaustion of the H+ buffer capacity, but we did observe a high localized influx. However, the model did not take into account the fact that there are numerous vesicles at the base of the brush border structure and that NHE3 is actually translocated to the vicinity of these vesicles after redistribution (12, 55). Hence, translocation is predicted to create a restricted space in which pH could increase even more than suggested by the model, analogous to the Ca2+ microdomains that exist between the endoplasmic/sarcoplasmic reticulum and plasma membrane (34).
The concept of inhomogeneous cellular pH has been previously described. It is widely accepted that different organelles, e.g., mitochondria, have pH values that are different from cytosolic pH. In PT cells, where the mitochondria are located close to the basolateral membrane (3, 12), it has been reported that average cytosolic pH is more alkaline than the regions close to mitochondria (3), and the gradient has been attributed to the H+ pumping by the mitochondria (i.e., F1F0-ATPase). However, the same study also showed that the gradient between the apical and basolateral side was, in part, due to NHE3 activity at the apical side and Na+-HCO3− cotransporter activity at the basolateral side (3). Interestingly, the authors speculated that cytosolic pH gradients could have regulatory effects (3).
In summary, we established a mathematical model of the effects of NHE3 redistribution in the renal PT. The model predicts the development of a pH microdomain near the base of the apical brush border membrane when NHE3 redistributes to the base of the microvill. The model also suggests that this pH microdomain has regulatory effects on Na+ reabsorption in the PT. In addition, experimental support for the model was obtained by visualizing changes in cytosolic pH in response to elevated blood pressure in cells of the PT in vivo using confocal fluorescence microscopy. This local pH microdomain may, via a reduction in NHE3 activity, play a role in pressure natriuresis, an important physiological mechanism for blood pressure control and the maintenance of body fluid and electrolyte homeostasis.
GRANTS
This work was supported by Danish Council for Independent Research, Medical Sciences, Grant 10-082148. A. A. McDonough was supported by National Institute of Diabetes and Digestive and Kidney Diseases (NIDDK) Grant DK-083785. J. Peti-Peterdi was supported by NIDDK Grant DK-64324. N. H. Holstein-Rathlou was supported by Danish Council for Independent Research, Medical Sciences, Grant 12-126956.
DISCLOSURES
No conflicts of interest, financial or otherwise, are declared by the author(s).
AUTHOR CONTRIBUTIONS
Author contributions: J.C.B., J.L.B., A.A.M., N.-H.H.-R., and J.P.-P. conception and design of research; J.C.B. and J.L.B. performed experiments; J.C.B., N.-H.H.-R., and J.P.-P. analyzed data; J.C.B., A.A.M., N.-H.H.-R., and J.P.-P. interpreted results of experiments; J.C.B. and J.P.-P. prepared figures; J.C.B. drafted manuscript; J.C.B., A.A.M., N.-H.H.-R., and J.P.-P. edited and revised manuscript; J.C.B., J.L.B., A.A.M., N.-H.H.-R., and J.P.-P. approved final version of manuscript.
REFERENCES
- 1.Alpern RJ, Herbert SC, Seldin DW, Giebisch GH. Seldin and Giebisch's The Kidney: Physiology and Pathophysiology (4th ed.). New York: Academic, 2008. [Google Scholar]
- 3.Aw TY, Jones DP. Heterogeneity of pH in the aqueous cytoplasm of renal proximal tubule cells. FASEB J 3: 52–58, 1989. [DOI] [PubMed] [Google Scholar]
- 4.Basmadjian D, Dykes DS, Baines AD. Flow through brushborders and similar protuberant wall structures. J Membr Biol 56: 183–190, 1980. [DOI] [PubMed] [Google Scholar]
- 5.Berridge MJ. Calcium microdomains: organization and function. Cell Calcium 40: 405–412, 2006. [DOI] [PubMed] [Google Scholar]
- 6.Boron WF. Evaluating the role of carbonic anhydrases in the transport of HCO3−-related species. Biochim Biophys Acta 1804: 410–421, 2010. [DOI] [PMC free article] [PubMed] [Google Scholar]
- 7.Brasen JC, Jacobsen JC, Holstein-Rathlou NH. The nanostructure of myoendothelial junctions contributes to signal rectification between endothelial and vascular smooth muscle cells. PLOS ONE 7: e33632, 2012. [DOI] [PMC free article] [PubMed] [Google Scholar]
- 8.Brasen JC, Olsen LF, Hallett MB. Cell surface topology creates high Ca2+ signalling microdomains. Cell Calcium 47: 339–349, 2010. [DOI] [PMC free article] [PubMed] [Google Scholar]
- 9.Chou CL, Marsh DJ. Role of proximal convoluted tubule in pressure diuresis in the rat. Am J Physiol Renal Fluid Electrolyte Physiol 251: F283–F289, 1986. [DOI] [PubMed] [Google Scholar]
- 10.Chou CL, Marsh DJ. Time course of proximal tubule response to acute arterial hypertension in the rat. Am J Physiol Renal Fluid Electrolyte Physiol 254: F601–F607, 1988. [DOI] [PubMed] [Google Scholar]
- 10a.Comsol. Comsol Multiphysics 4.1 (online). http://www.comsol.com/comsol-multiphysics [14 October 2014]. [Google Scholar]
- 11.Davies EV, Hallett MB. A novel pathway for Ca2+ signalling in neutrophils by immune complexes. Immunology 85: 538–543, 1995. [PMC free article] [PubMed] [Google Scholar]
- 12.Dorup J, Maunsbach AB. Three-dimensional organization and segmental ultrastructure of rat proximal tubules. Exp Nephrol 5: 305–317, 1997. [PubMed] [Google Scholar]
- 13.Du Z, Duan Y, Yan Q, Weinstein AM, Weinbaum S, Wang T. Mechanosensory function of microvilli of the kidney proximal tubule. Proc Natl Acad Sci USA 101: 13068–13073, 2004. [DOI] [PMC free article] [PubMed] [Google Scholar]
- 14.Du Z, Yan Q, Duan Y, Weinbaum S, Weinstein AM, Wang T. Axial flow modulates proximal tubule NHE3 and H-ATPase activities by changing microvillus bending moments. Am J Physiol Renal Physiol 290: F289–F296, 2006. [DOI] [PubMed] [Google Scholar]
- 15.Ekblad H, Aperia A, Larsson SH. Intracellular pH regulation in cultured renal proximal tubule cells in different stages of maturation. Am J Physiol Renal Fluid Electrolyte Physiol 263: F716–F721, 1992. [DOI] [PubMed] [Google Scholar]
- 16.Fromter E. The effect of inhibitors and diuretics on active transport potentials in rat kidney proximal tubule. Curr Probl Clin Biochem 4: 119–125, 1975. [PubMed] [Google Scholar]
- 17.Gross E, Hopfer U. Voltage and cosubstrate dependence of the Na-HCO3 cotransporter kinetics in renal proximal tubule cells. Biophys J 75: 810–824, 1998. [DOI] [PMC free article] [PubMed] [Google Scholar]
- 18.Guo P, Weinstein AM, Weinbaum S. A hydrodynamic mechanosensory hypothesis for brush border microvilli. Am J Physiol Renal Physiol 279: F698–F712, 2000. [DOI] [PubMed] [Google Scholar]
- 19.Hall JE, Guyton AC, Brands MW. Pressure-volume regulation in hypertension. Kidney Int Suppl 55: S35–S41, 1996. [PubMed] [Google Scholar]
- 20.Hilvo M, Innocenti A, Monti SM, De SG, Supuran CT, Parkkila S. Recent advances in research on the most novel carbonic anhydrases, CA XIII and XV. Curr Pharm Des 14: 672–678, 2008. [DOI] [PubMed] [Google Scholar]
- 21.Horie S, Moe O, Tejedor A, Alpern RJ. Preincubation in acid medium increases Na/H antiporter activity in cultured renal proximal tubule cells. Proc Natl Acad Sci USA 87: 4742–4745, 1990. [DOI] [PMC free article] [PubMed] [Google Scholar]
- 22.Kang JJ, Toma I, Sipos A, McCulloch F, Peti-Peterdi J. Quantitative imaging of basic functions in renal (patho)physiology. Am J Physiol Renal Physiol 291: F495–F502, 2006. [DOI] [PubMed] [Google Scholar]
- 23.Khalifah RG. The carbon dioxide hydration activity of carbonic anhydrase. I. Stop-flow kinetic studies on the native human isoenzymes B and C. J Biol Chem 246: 2561–2573, 1971. [PubMed] [Google Scholar]
- 24.Kinoshita Y, Knox FG. Response of superficial proximal convoluted tubule to decreased and increased renal perfusion pressure. In vivo microperfusion study in rats. Circ Res 66: 1184–1189, 1990. [DOI] [PubMed] [Google Scholar]
- 25.Krahn TA, Aronson PS, Weinstein AM. Weak acid permeability of a villous membrane: formic acid transport across rat proximal tubule. Bull Math Biol 56: 459–490, 1994. [DOI] [PubMed] [Google Scholar]
- 26.Krahn TA, Weinstein AM. Acid/base transport in a model of the proximal tubule brush border: impact of carbonic anhydrase. Am J Physiol Renal Fluid Electrolyte Physiol 270: F344–F355, 1996. [DOI] [PubMed] [Google Scholar]
- 27.Kuwahara M, Ishibashi K, Krapf R, Rector FC, Jr., Berry CA. Effect of lumen pH on cell pH and cell potential in rabbit proximal tubules. Am J Physiol Renal Fluid Electrolyte Physiol 256: F1075–F1083, 1989. [DOI] [PubMed] [Google Scholar]
- 28.Li HC, Du Z, Barone S, Rubera I, McDonough AA, Tauc M, Zahedi K, Wang T, Soleimani M. Proximal tubule specific knockout of the Na+/H+ exchanger NHE3: effects on bicarbonate absorption and ammonium excretion. J Mol Med 91: 951–963, 2013. [DOI] [PMC free article] [PubMed] [Google Scholar]
- 29.Lide DR, Frederikse HP; Chemical Rubber Company. CRC Handbook of Chemistry and Physics: a Ready-Reference Book of Chemical and Physical Data. Boca Raton, FL: CRC, 1995. [Google Scholar]
- 30.Llinas R, Sugimori M, Silver RB. Microdomains of high calcium concentration in a presynaptic terminal. Science 256: 677–679, 1992. [DOI] [PubMed] [Google Scholar]
- 31.Llinas R, Sugimori M, Silver RB. The concept of calcium concentration microdomains in synaptic transmission. Neuropharmacology 34: 1443–1451, 1995. [DOI] [PubMed] [Google Scholar]
- 32.Maren TH. Carbonic anhydrase: chemistry, physiology, and inhibition. Physiol Rev 47: 595–781, 1967. [DOI] [PubMed] [Google Scholar]
- 33.Maunsbach AB, Giebisch GH, Stanton BA. Effects of flow rate on proximal tubule ultrastructure. Am J Physiol Renal Fluid Electrolyte Physiol 253: F582–F587, 1987. [DOI] [PubMed] [Google Scholar]
- 34.McCarron JG, Chalmers S, Bradley KN, MacMillan D, Muir TC. Ca2+ microdomains in smooth muscle. Cell Calcium 40: 461–493, 2006. [DOI] [PubMed] [Google Scholar]
- 35.McDonough AA. Mechanisms of proximal tubule sodium transport regulation that link extracellular fluid volume and blood pressure. Am J Physiol Regul Integr Comp Physiol 298: R851–R861, 2010. [DOI] [PMC free article] [PubMed] [Google Scholar]
- 36.Naraghi M, Neher E. Linearized buffered Ca2+ diffusion in microdomains and its implications for calculation of [Ca2+] at the mouth of a calcium channel. J Neurosci 17: 6961–6973, 1997. [DOI] [PMC free article] [PubMed] [Google Scholar]
- 37.Nausch LW, Bonev AD, Heppner TJ, Tallini Y, Kotlikoff MI, Nelson MT. Sympathetic nerve stimulation induces local endothelial Ca2+ signals to oppose vasoconstriction of mouse mesenteric arteries. Am J Physiol Heart Circ Physiol 302: H594–H602, 2012. [DOI] [PMC free article] [PubMed] [Google Scholar]
- 38.Neher E. Vesicle pools and Ca2+ microdomains: new tools for understanding their roles in neurotransmitter release. Neuron 20: 389–399, 1998. [DOI] [PubMed] [Google Scholar]
- 39.Nishimori I, Innocenti A, Vullo D, Scozzafava A, Supuran CT. Carbonic anhydrase inhibitors. Inhibition studies of the human secretory isoform VI with anions. Bioorg Med Chem Lett 17: 1037–1042, 2007. [DOI] [PubMed] [Google Scholar]
- 40.Peti-Peterdi J, Burford JL, Hackl MJ. The first decade of using multiphoton microscopy for high-power kidney imaging. Am J Physiol Renal Physiol 302: F227–F233, 2012. [DOI] [PMC free article] [PubMed] [Google Scholar]
- 41.Purkerson JM, Schwartz GJ. The role of carbonic anhydrases in renal physiology. Kidney Int 71: 103–115, 2007. [DOI] [PubMed] [Google Scholar]
- 42.Riquier AD, Lee DH, McDonough AA. Renal NHE3 and NaPi2 partition into distinct membrane domains. Am J Physiol Cell Physiol 296: C900–C910, 2009. [DOI] [PMC free article] [PubMed] [Google Scholar]
- 43.Schafer JA, Patlak CS, Troutman SL, Andreoli TE. Volume absorption in the pars recta. II. Hydraulic conductivity coefficient. Am J Physiol Renal Fluid Electrolyte Physiol 234: F340–F348, 1978. [DOI] [PubMed] [Google Scholar]
- 44.Swietach P, Leem CH, Spitzer KW, Vaughan-Jones RD. Experimental generation and computational modeling of intracellular pH gradients in cardiac myocytes. Biophys J 88: 3018–3037, 2005. [DOI] [PMC free article] [PubMed] [Google Scholar]
- 45.Swietach P, Zaniboni M, Stewart AK, Rossini A, Spitzer KW, Vaughan-Jones RD. Modelling intracellular H+ ion diffusion. Prog Biophys Mol Biol 83: 69–100, 2003. [DOI] [PubMed] [Google Scholar]
- 46.Tse CM, Levine SA, Yun CH, Brant SR, Pouyssegur J, Montrose MH, Donowitz M. Functional characteristics of a cloned epithelial Na+/H+ exchanger (NHE3): resistance to amiloride and inhibition by protein kinase C. Proc Natl Acad Sci USA 90: 9110–9114, 1993. [DOI] [PMC free article] [PubMed] [Google Scholar]
- 47.Vallon V, Platt KA, Cunard R, Schroth J, Whaley J, Thomson SC, Koepsell H, Rieg T. SGLT2 mediates glucose reabsorption in the early proximal tubule. J Am Soc Nephrol 22: 104–112, 2011. [DOI] [PMC free article] [PubMed] [Google Scholar]
- 48.Vaughan-Jones RD, Peercy BE, Keener JP, Spitzer KW. Intrinsic H+ ion mobility in the rabbit ventricular myocyte. J Physiol 541: 139–158, 2002. [DOI] [PMC free article] [PubMed] [Google Scholar]
- 49.Wang KW, Deen WM. Chemical kinetic and diffusional limitations on bicarbonate reabsorption by the proximal tubule. Biophys J 31: 161–182, 1980. [DOI] [PMC free article] [PubMed] [Google Scholar]
- 50.Weinlich M, Theiss C, Lin CT, Kinne RK. BCECF in single cultured cells: inhomogeneous distribution but homogeneous response. J Exp Biol 201: 57–62, 1998. [DOI] [PubMed] [Google Scholar]
- 51.Weinstein AM. A kinetically defined Na+/H+ antiporter within a mathematical model of the rat proximal tubule. J Gen Physiol 105: 617–641, 1995. [DOI] [PMC free article] [PubMed] [Google Scholar]
- 52.Weinstein AM, Weinbaum S, Duan Y, Du Z, Yan Q, Wang T. Flow-dependent transport in a mathematical model of rat proximal tubule. Am J Physiol Renal Physiol 292: F1164–F1181, 2007. [DOI] [PubMed] [Google Scholar]
- 53.Welling LW, Welling DJ. Relationship between structure and function in renal proximal tubule. J Electron Microsc Tech 9: 171–185, 1988. [DOI] [PubMed] [Google Scholar]
- 54.Welling LW, Welling DJ, Holsapple JW, Evan AP. Morphometric analysis of distinct microanatomy near the base of proximal tubule cells. Am J Physiol Renal Fluid Electrolyte Physiol 253: F126–F140, 1987. [DOI] [PubMed] [Google Scholar]
- 55.Yang LE, Maunsbach AB, Leong PK, McDonough AA. Differential traffic of proximal tubule Na+ transporters during hypertension or PTH: NHE3 to base of microvilli vs. NaPi2 to endosomes. Am J Physiol Renal Physiol 287: F896–F906, 2004. [DOI] [PubMed] [Google Scholar]
- 56.Yip KP, Holstein-Rathlou NH, Marsh DJ. Mechanisms of temporal variation in single-nephron blood flow in rats. Am J Physiol Renal Fluid Electrolyte Physiol 264: F427–F434, 1993. [DOI] [PubMed] [Google Scholar]
- 57.Yip KP, Wagner AJ, Marsh DJ. Detection of apical Na+/H+ exchanger activity inhibition in proximal tubules induced by acute hypertension. Am J Physiol Regul Integr Comp Physiol 279: R1412–R1418, 2000. [DOI] [PubMed] [Google Scholar]
- 58.Zhang Y, Magyar CE, Norian JM, Holstein-Rathlou NH, Mircheff AK, McDonough AA. Reversible effects of acute hypertension on proximal tubule sodium transporters. Am J Physiol Cell Physiol 274: C1090–C1100, 1998. [DOI] [PubMed] [Google Scholar]
- 59.Zhang Y, Mircheff AK, Hensley CB, Magyar CE, Warnock DG, Chambrey R, Yip KP, Marsh DJ, Holstein-Rathlou NH, McDonough AA. Rapid redistribution and inhibition of renal sodium transporters during acute pressure natriuresis. Am J Physiol Renal Fluid Electrolyte Physiol 270: F1004–F1014, 1996. [DOI] [PubMed] [Google Scholar]