

Abstract
The fatal neurodegenerative disorders amyotrophic lateral sclerosis and spinal muscular atrophy are, respectively, the most common motoneuron disease and genetic cause of infant death. Various in vitro model systems have been established to investigate motoneuron disease mechanisms, in particular immortalized cell lines and primary neurons. Using quantitative mass-spectrometry-based proteomics, we compared the proteomes of primary motoneurons to motoneuron-like cell lines NSC-34 and N2a, as well as to non-neuronal control cells, at a depth of 10,000 proteins. We used this resource to evaluate the suitability of murine in vitro model systems for cell biological and biochemical analysis of motoneuron disease mechanisms. Individual protein and pathway analysis indicated substantial differences between motoneuron-like cell lines and primary motoneurons, especially for proteins involved in differentiation, cytoskeleton, and receptor signaling, whereas common metabolic pathways were more similar. The proteins associated with amyotrophic lateral sclerosis also showed distinct differences between cell lines and primary motoneurons, providing a molecular basis for understanding fundamental alterations between cell lines and neurons with respect to neuronal pathways with relevance for disease mechanisms. Our study provides a proteomics resource for motoneuron research and presents a paradigm of how mass-spectrometry-based proteomics can be used to evaluate disease model systems.
Motoneurons are extremely extended neurons that mediate the control of all muscle types by the central nervous system. Therefore, diseases involving progressive motoneuron degeneration such as amyotrophic lateral sclerosis (ALS)1 (OMIM: 105400) or spinal muscle atrophy (OMIM: 253300) are particularly devastating and generally fatal disorders. Today, ALS is believed to form a phenotypic continuum with the disease entity frontotemporal lobe degeneration (OMIM: 600274) (1, 2). About 10% of ALS cases are known to be inherited, but the vast majority are considered sporadic. The number of inherited cases might be underestimated because of incomplete family histories, non-paternity, early death of family members, or incomplete penetrance (3).
Mutations in several genes have been reported for the familial form, including in Sod1 (4), Als2 (5), Setx (6), Vapb (7), Tardbp (8, 9), Fus/Tls (10, 11), Vcp (12), Pfn1 (13), and several others (reviewed in Ref. 14). The most frequent genetic cause of inherited ALS was recently shown to be a hexanucleotide repeat expansion in an intron of a gene of unknown function called C9orf72 (15–17). Based on the spectrum of known mutations, several disease mechanisms for ALS have been proposed, including dysfunction of protein folding, axonal transport, RNA splicing, and metabolism (reviewed in Refs. 14, 18, and 19). Despite intensive research, it is still unclear whether a main common molecular pathway or mechanism underlies motoneuron degeneration in ALS and frontotemporal lobe degeneration. Spinal muscle atrophy is caused by homozygous mutations or deletions in the survival of motor neuron gene (Smn1) that presumably impair the RNA metabolism through diminished functionality of the Smn1 gene product (20). Over recent decades several model systems have been established to investigate ALS (21). These include transgenic animal models such as mouse (22), drosophila (23), and zebrafish (24). In cell-based studies, primary motoneurons cultured from rodent embryos (25) or motoneuron-like cell lines are employed. Primary cells are considered to more closely mimic the in vivo situation, but they are more challenging to establish and maintain. In contrast, the degree of functional relevance of cell lines can be difficult to establish, but they can be propagated without limitation and are well suited for high-throughput analysis. In particular, the spinal cord neuron–neuroblastoma hybrid cell line NSC-34 (26) and the mouse neuroblastoma cell line N2a (27) are widely used not only to assess motoneuron function, but also to study disease mechanisms in motoneurons (28, 29).
As proteins are the functional actors in cells, proteomics should be able to make important contributions to the characterization and evaluation of cellular models. In particular, by identifying and quantifying the expressed proteins and bioinformatically interpreting the results, one can obtain enough information to infer functional differences. Our laboratory has previously shown proof of concept of such an approach by comparing the expression levels of about 4,000 proteins between primary hepatocytes and a hepatoma cell line (30). Very recently, mass-spectrometry-based proteomics has achieved sufficient depth and accuracy to quantify almost the entire proteome of mammalian cell lines (31–33). Furthermore, new instrumentation and algorithms now make it possible to perform label-free quantification between multiple cellular systems and with an accuracy previously associated only with stable isotope labeling techniques (34, 35).
To evaluate the suitability of motoneuron-like cell lines as cellular model systems for research on ALS and related disorders, we characterized the proteomes of two widely used cell lines, NSC-34 and N2a, and compared them with the proteomes of mouse primary motoneurons and non-neuronal control cell lines. To generate primary motoneurons, we employed a recently described culturing system that makes it possible to isolate highly enriched motoneuron populations in less than 8 h (25). We identified more than 10,000 proteins and investigated differences in quantitative levels of individual neuron-associated proteins and pathways related to motoneuron function and disease mechanisms.
EXPERIMENTAL PROCEDURES
Cell Culture
N2a (CCL-131, American Type Culture Collection), NSC-34 (CED-CLU140, Biozol, Eching, Germany), mouse embryonic fibroblasts (MEFs) (American Type Culture Collection), and mouse hepatoma (liver cancer; Hepa1–6) (CRL-1830, American Type Culture Collection) cell lines were grown in high-glucose Dulbecco's modified Eagle's medium with l-glutamine (PAA/GE, Freiburg, Germany), 10% FCS (PAA), 1% penicillin/streptomycin (PAA). NSC-34 cells were directly ordered from the supplier and kept in culture for up to six passages. All other non-neuronal cell lines are maintained in cryostocks in our laboratory. Cells were harvested with cold PBS. Washed pellets were flash-frozen in liquid nitrogen for storage.
Primary Motoneurons
CD1 wild-type mice were directly purchased from Charles River (Sulzfeld, Germany). Primary spinal cord motoneurons from mice were cultured essentially as described previously (25). Briefly, spinal cords of E12.5 mouse embryos were dissected and collected in 1.5-ml tubes containing Hank's Balanced Salt Solution, Life Technologies GmbH, Darmstadt Germany After trypsin treatment and trituration, the suspension was enriched for p75NTR-positive cells via an antibody-panning procedure (25). After washing and depolarization to remove the cells from the panning dish, the cells were collected via centrifugation at 400g for 5 min and resuspended in full medium (Neurobasal (Invitrogen), 1× GlutaMax (Invitrogen), supplemented with 1× B27 (Invitrogen), 2% horse serum (Linaris, Dossenheim, Germany)). After counting with a hemocytometer, 7 × 10⁵ cells were plated on poly-ornithine- (Sigma) and laminin-coated (Invitrogen) dishes (six-well format, Delta surface, Nunc/ Thermo Fisher Scientific Inc., Waltham, MA) and fed with full medium supplemented with 5 ng/ml BDNF. 40% of the medium was replaced after 24 h and every second day after that. In total, cells from ∼140 CD1 wild-type embryos were used in three experiments. After 7 days in culture, cells were washed three times with PBS and harvested in 0.5 ml of lysis buffer (4% SDS, 0.1 m DTT, 10 mm Hepes, pH 8.0) per well.
Sample Preparation for MS Analysis
Cell lysis was performed at room temperature in lysis buffer (4% SDS, 10 mm Hepes, pH 8.0) with 15 min of sonication (level 5, Bioruptor, Diagenode, Seraing (Ougrée) - Belgium). Proteins in the lysate were reduced with 10 mm DTT for 30 min and then subjected to 45 min of alkylation with 55 mm iodoacetamide. The protein concentration was determined with fluorescence at 350 nm and compared with a bovine serum albumin standard.
To remove the detergent, we performed acetone precipitation. Acetone (−20 °C) was added to 100 μg of proteins to a final concentration of 80% v/v, and proteins were precipitated for at least 2 h at −20 °C. The supernatant was removed after 15 min of centrifugation (4 °C, 16,000g) followed by washing with 80% acetone (−20 °C). The protein pellet was dissolved in 50 μl of 6 m urea/2 m thiourea, 10 mm Hepes, pH 8.0. After the addition of 1 μg of LysC, digestion was carried out for 3 h at room temperature. We diluted with 4 volumes of 50 mm ammonium bicarbonate and further digested the mixture with 1 μg of trypsin overnight at room temperature. The resulting peptide mixtures were either analyzed directly via a single-shot strategy (36) or separated into six strong anion exchange fractionations as described elsewhere (37). We desalted peptides on C18 StageTips (38).
LC-MS/MS
We separated peptides on a Thermo Scientific EASY-nLC 1000 HPLC system (Thermo Fisher Scientific, Odense, Denmark). Columns (75-μm inner diameter, 50-cm length) were in-house packed with 1.9-μm C18 particles (Dr. Maisch GmbH, Ammerbuch-Entringen, Germany). Peptides were loaded in buffer A (0.5% formic acid) and separated with a gradient from 7% to 60% buffer B (80% acetonitrile, 0.5% formic acid) within 3.5 h at 200 nl/min. The column temperature was set to 40 °C. A quadrupole Orbitrap mass spectrometer (34) (Q Exactive, Thermo Fisher Scientific) was directly coupled to the liquid chromatograph via a nano-electrospray source. The Q Exactive was operated in a data-dependent mode. The survey scan range was set to 300 to 1,650 m/z, with a resolution of 70,000 at m/z 200. Up to the 10 most abundant isotope patterns with a charge of ≥2 were subjected to Higher-energy collisional dissociation (39) with a normalized collision energy of 25, an isolation window of 2 Th, and a resolution of 17,500 at m/z 200. To limit repeated sequencing, dynamic exclusion of sequenced peptides was set to 30 s. Thresholds for ion injection time and ion target value were set to 20 ms and 3 × 10⁶ for the survey scans and to 60 ms and 106 for the MS/MS scans. Data were acquired using Xcalibur software (Thermo Scientific).
Data Analysis and Statistics
To process MS raw files, we employed MaxQuant software (v. 1.3.10.18) (40). We used Andromeda (41), which is integrated into MaxQuant, to search MS/MS spectra against the UniProtKB FASTA database (59,345 forward entries; version from June 2012). Enzyme specificity was set to trypsin allowing cleavage N-terminal to proline and up to two miscleavages. Peptides had to have a minimum length of seven amino acids to be considered for identification. Carbamidomethylation was set as a fixed modification, and acetylation (N terminus) and methionine oxidation were set as variable modifications. A false discovery rate (FDR) cutoff of 1% was applied at the peptide and protein levels. Initial precursor mass deviation of up to 4.5 ppm and fragment mass deviation up to 20 ppm were allowed. Precursor ion mass accuracy was improved by time-dependent recalibration algorithms in MaxQuant. The cutoff score (delta score) for accepting individual MS/MS spectra was 17.
Nonlinear retention time alignment of all measured samples was performed in MaxQuant. “Match between runs,” which allows the transfer of peptide identifications in the absence of sequencing, was enabled with a maximum retention time window of 1 min. As a library for “match between runs” in MaxQuant, we employed additional sets of NSC-34, technical duplicates of E12.5 spinal cord, and technical duplicates of strong anion exchange fractionated peptides from motoneurons in addition to the biological samples analyzed here (biological triplicates of NSC-34, N2a, MEF, Hepa 1–6, motoneurons, and E12.5 spinal cord) (supplemental Table S6). Added individual peptide intensities are a rough proxy of each protein's abundance. In order to ensure improved quantification, we applied further normalization algorithms built into MaxQuant before making quantitative comparisons of the cellular systems. Furthermore, we stringently filtered our data by requiring a minimum peptide ratio count of 2 in MaxLFQ (42). Protein identification required at least one razor peptide (40). Proteins that could not be discriminated on the basis of unique peptides were grouped into protein groups. Furthermore, proteins were filtered for common contaminants (n = 247 (41)) to which laminin sequences were added to avoid bias resulting from the laminin-coating of plates in the case of the primary motoneuron culture. Proteins identified only by site modification were excluded from further analysis. Furthermore, we required a minimum of two valid MaxLFQ quantifications in at least one group of triplicates. A flowchart describing the individual steps of the data processing and filtering is presented in supplemental Table S5.
To quantify fold changes of proteins across samples, we used MaxLFQ. To visualize these fold changes in the context of individual protein abundances in the proteome, we projected them onto the summed peptide intensities normalized by the number of theoretically observable peptides (43).
Specifically, to compare relative protein abundances between and within samples, the following transformations to the MaxQuant output data were performed. First log 2 MaxLFQ differences to the mean log 2 MaxLFQ intensity of each protein group for each sample were calculated, resulting in intensity-independent log 2 MaxLFQ differences. Then protein length normalized log 2 protein intensities (termed iBAQ values in MaxQuant) were added to the MaxLFQ differences. The first transformation provides highly accurate information about the protein differences between samples, and the second allows one to compare the abundances of different protein groups.
For statistical and bioinformatic analysis, as well as for visualization, we used the open PERSEUS environment, which is part of MaxQuant. For several calculations and plots we also used the R framework (44). Pearson correlation was performed on filtered MaxLFQ intensities omitting missing values (NaN). To identify the most discriminating proteins in groupwise comparisons, first we performed imputation of missing values with a normal distribution (width = 0.3; shift = 1.8) as described elsewhere (45). Then, we applied the built-in analysis-of-variance functions in PERSEUS using an FDR of 1% and S0 of 4 (the S0 parameter sets a threshold for minimum fold change (46)). For pairwise comparison of proteomes and determination of significant differences in protein abundances, t test statistics were applied with a permutation-based FDR of 2% and S0 of 4 (46). The resulting significant outliers for each of the sample pairs were analyzed for annotation enrichments.
We used outlier populations derived by means of t test statistics in order to determine Gene Ontology (GO) (47), KEGG (48), and UniProt Keyword (49) enrichment of categorical annotations with an intersection size of at least 8. In Fig. 3 this was done by testing categorical annotations in individual outlier populations for enrichments compared with the complete dataset via Fisher's exact test with a Benjamini–Hochberg corrected FDR of 2% (Fig. 3C). In Fig. 4, no FDR cutoff was used, but the FDR values are reported (supplemental Table S3). In cases of identical annotation in both outlier populations, only the enrichment with highest p value was depicted.
Fig. 3.
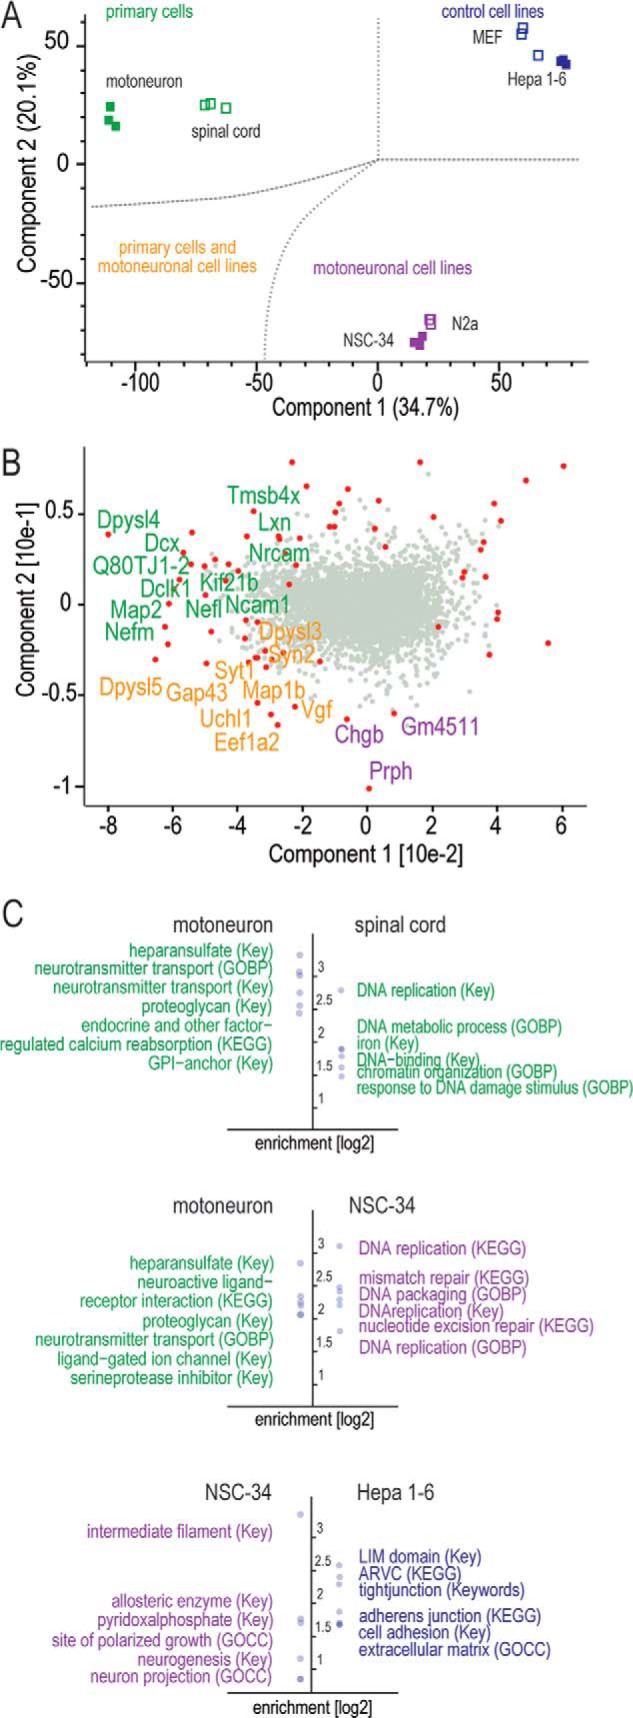
Global proteomic comparison of motoneuron-like cell lines, embryonic spinal cord, unrelated cell lines, and primary motoneurons. A, PCA of protein expression values of the different systems. Component 1 and component 2 account for 54.8% of the data variation. B, significant outliers from analysis of variance (FDR cutoff = 1%, S0 fold-change cutoff = 4) are depicted in red in the PCA loading distribution (gray dots). Proteins driving the separation are colored according to the PCA plot in A. C, analyses of enriched annotation (Fisher's exact test) for t test significant (FDR cutoff = 2%, S0 fold-change cutoff = 4) outlier populations. The six most enriched (log 2) annotations from UniProt Keywords (Key), GO biological process (GOBP), GO cellular compartment (GOCC), and KEGG are depicted.
Fig. 4.
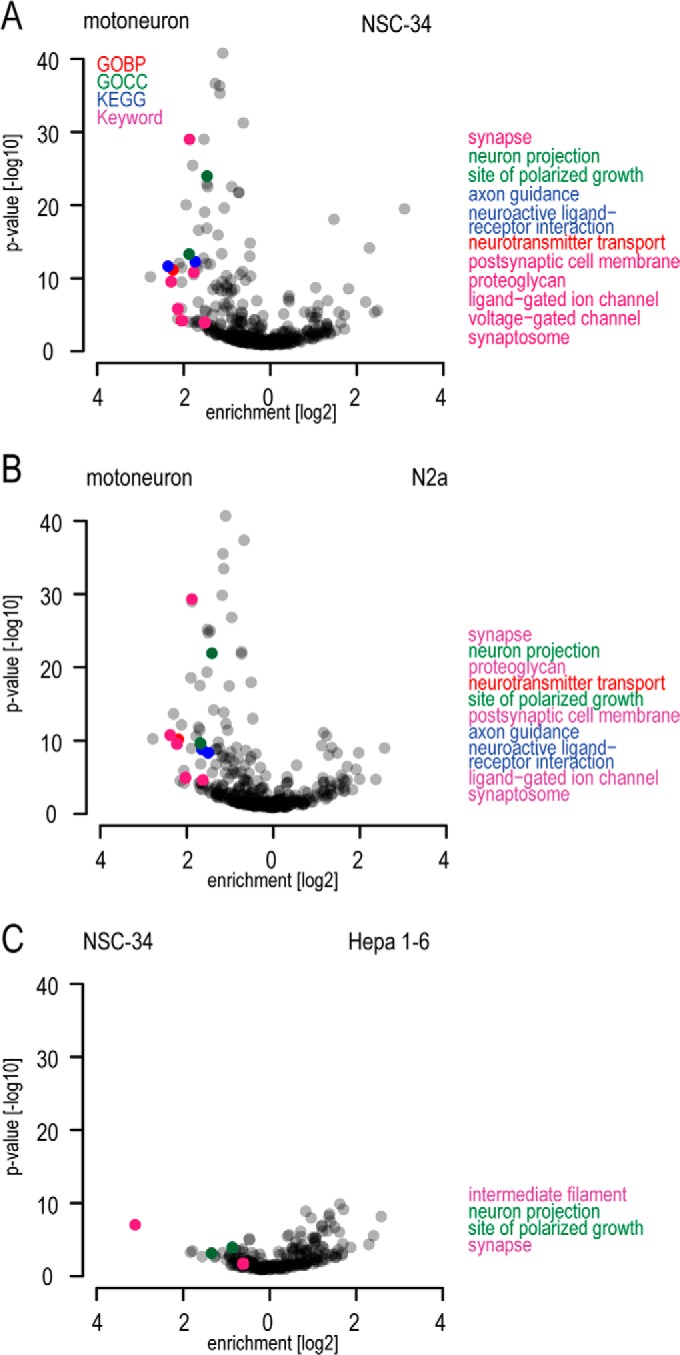
Evaluation of neuronal pathway enrichments and neuron-specific protein abundances. A–C, pairwise comparison of enriched annotations in different cellular model systems. Annotations are depicted by their enrichment factor and statistical significance, similar to volcano plots for protein populations.
For comparison of the motoneuronal proteome to published transcriptome data (50), we used normalized and filtered log 2 Affymetrix intensities provided by the authors for transcripts and protein intensities from MaxQuant, which were normalized by protein sequence length. Transcriptome data were matched in PERSEUS to proteome data on the basis of gene names, and the median of replicates was used for comparison.
RESULTS
Deep Proteome Analysis of Motoneuronal Model Systems
We set out to characterize the proteomes of different cellular model systems employed in the study of motoneuron disease mechanisms. Primary motoneurons were isolated from 12.5-day-old mouse embryos, enriched and differentiated using a recently developed protocol (25), and compared with two commonly used motoneuron-like cell lines (NSC-34 and N2a) and spinal cord from 12.5-day-old mouse embryos. As non-neuronal control cells, we employed mouse hepatoma cells (Hepa 1–6) and MEF cells. To ensure optimal recovery of membrane proteins such as receptors, which are crucial for neuronal function, we extracted proteins from cells via lysis in SDS followed by acetone precipitation. After enzymatic digestion, tryptic peptides were separated by means of reverse phase liquid chromatography in 4 h gradients and analyzed on a quadrupole Orbitrap mass spectrometer in single shots (Fig. 1A). Label-free quantification between biological replicates was highly reproducible, as evidenced by a Pearson correlation of more than 0.93 (Fig. 1B). Overall we quantified more than 10,000 proteins and 7,000 to 8,100 proteins in the individual cellular systems (Fig. 1C, supplemental Tables S1 and S2).
Fig. 1.
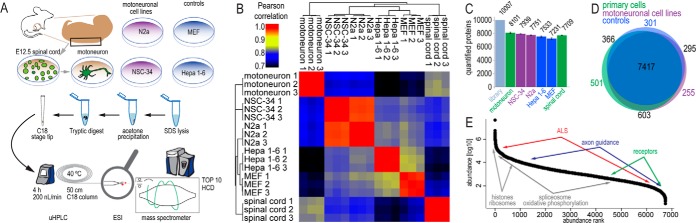
Deep proteome analysis of motoneuronal model systems. A, spinal cord from E12.5 mouse embryo was dissected, and cells were isolated. P75NTR-positive cells were enriched in an antibody-panning step and grown in culture for 7 days. Motoneuron-like cell lines (N2a, NSC-34) and control cell lines (MEF, Hepa 1–6) were grown under standard culture conditions. All investigated cellular systems were analyzed via liquid chromatography coupled to high-resolution mass spectrometry following a single-shot strategy. B, Pearson correlation for MS-determined protein abundances (MaxLFQ intensities) from single-shot MS measurements. All replicate correlation values were greater than 0.93, and Pearson correlation between different cellular systems was at least 0.7. C, total number of quantified proteins (summed peptide intensities) in all measurements, including additional replicates of cell lines and spinal cord (“library”) and in individual systems. Between 7,000 and 8,100 proteins were quantified in the individual cellular systems. D, Venn diagram of the distribution of quantified proteins in the investigated cellular systems, grouped by primary cells, motoneuron-like cell lines, and non-neuronal cell lines. E, ranked MaxLFQ normalized protein abundances for motoneurons. Indicated are approximated abundance ranges for proteins involved in neuron-specific and general metabolic processes and in ALS pathology.
About 75% of all quantified proteins were present in all analyzed cellular systems (primary cells, motoneuronal cell lines, and non-neuronal controls). We observed the most pairwise overlap of detected proteins between primary neuronal cells and motoneuronal cell lines (Fig. 1D). However, on a quantitative level, motoneuronal cell lines correlated more tightly to the non-neuronal controls than to the primary cells. This unexpected observation highlights the value of quantitative data (Fig. 1B). Measured protein abundance values (summed, normalized intensities of the peptides identifying each protein) covered over 6 orders of magnitude (Fig. 1E). In all cell systems, some of the most abundant proteins were histones and ribosomal proteins, in accordance with previous studies (43, 51, 52). Proteins of housekeeping metabolic processes such as spliceosomes or oxidative phosphorylation were also generally highly abundant. In contrast, neuronal proteins involved in receptor signaling or axonal guidance were relatively low abundant. Because ALS-associated proteins are involved in a variety of cellular processes, they span almost the entire dynamic range (supplemental Table S2).
For selected gene products—Dctn1, Vcp, Fus, Syp, and Sox2—we performed Western blot analysis on motoneuron primary culture, NSC-34, and Hepa 1–6 cell lines. Although Western blot staining was less easy to interpret than the MS signals, trends in protein abundance were the same (supplemental Figs. S1A–S1C). We also compared our motoneuronal dataset to a published transcriptome of murine motoneurons that were differentiated from stem cells with retinoic acid and sonic hedgehog for 5 days (50) (supplemental Fig. S1E, supplemental Table S4). We observed a moderate and highly significant correlation (Pearson correlation, 0.49; Pearson p value, 10e-15) between transcriptome and proteome; however, many proteins differed strongly between the two datasets (supplemental Table S4).
Global Comparison of the Proteomes of Primary Motoneurons, Cell Lines, and Mouse Spinal Cord
After stringent filtering as described in “Experimental Procedures” and supplemental Table S5, we quantitatively compared 7,950 proteins between the model systems on the level of individual protein expression as well as annotation levels (supplemental Table S2). The mean standard deviation within biological replicates was less than 2-fold for 95% of the quantified proteins, demonstrating the quantitative robustness of our measurements (Fig. 2A). Even for the least abundant proteins, the mean standard deviation was less than 2-fold for more than 99.5% of these proteins (Fig. 2B). As an example, for spinal cord tissue, the variation between one biological sample measured twice (technical replicate) was moderately but significantly smaller than the variation between biological replicates (Fig. 2C).
Fig. 2.
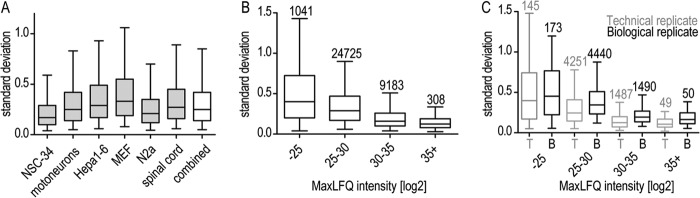
Standard deviation of MaxLFQ quantifications in protein groups within replicates. A, standard deviation of MaxLFQ quantifications in protein groups for triplicates. B, intensity dependence of MaxLFQ standard deviations for all triplicates. The number of data points contributing to each bin is depicted above the bins. C, comparison of standard deviations from technical duplicates and biological triplicates of spinal cord throughout the whole abundance range. Differences between technical and biological replicates are significant (p < 0.0001) for protein intensities of bins 25–30, 30–35, and 35+. The number of protein groups for which standard deviations were calculated is depicted above the bins. Data are plotted as median with 5%–95% percentile.
We applied principal component analysis (PCA) to evaluate similarities and dissimilarities on a global scale. Biological replicates clustered tightly in the PCA space, indicating high quantitative reproducibility of the experimental setup and the label-free quantification (Fig. 3A). Motoneurons, spinal cord, Hepa 1–6, MEFs, and motoneuronal cell lines were clearly separated in the first two components of PCA. NSC-34 and N2a together formed a close pair of clusters that was approximately equidistant from the primary cells and the control cell lines. Although derived from completely different tissues, the latter are co-located and widely separated from the other systems. As the difference between them is not profound, we focused on Hepa 1–6 as a non-neuronal cell line control for further analysis. Interestingly, the motoneuron primary culture and the E12.5 spinal cord tissue, although clearly separated, clustered much closer to each other than to the neuronal and non-neuronal cell lines.
To assess individual, discriminating proteins in motoneurons, spinal cord, N2a, NSC-34, and Hepa 1–6 cells, we plotted the “loadings” of the PCA (loadings are the proteins driving, or responsible for, the separation of the proteomes). In Fig. 3B, those loadings that also passed a stringent analysis of variance and fold change (“Experimental Procedures”) are colored. Within this selection we can distinguish groups of proteins on the basis of neuronal properties. Proteins that function in neurite growth, such as Gap43 and Syn2, or in vesicle release, such as the neuro-secretory protein Vgf, were shared outliers for both neuron-like cell lines and motoneurons/spinal cord (orange population in Fig. 3B). In contrast, another group of proteins—such as medium and light chains of neurofilaments (Nefm and Nefl)—proved to be distinctive for motoneuronal systems relative to all other systems (green population in Fig. 3B).
We employed PERSEUS to bioinformatically determine major physiological differences among the cellular model systems via enriched annotations (GO, UniProt Keyword, and KEGG) (Fig. 3C, supplemental Fig. S3, supplemental Table S3). E12.5 spinal cord consists of a mixed population of undifferentiated cells. Consistent with this, annotation enrichments for primary motoneurons demonstrated a stronger neuronal character relative to spinal cord (supplemental Fig. S3). NSC-34 and N2a cells differed even more from primary motoneurons with respect to neuron-specific proteins. For instance, neuron-associated annotations such as GO biological process “neurotransmitter transport” were enriched more than four times in motoneurons relative to NSC-34 and N2a (Fig. 3C). Functions that were enriched for these neuronal cell lines were mainly related to DNA metabolism, presumably as a consequence of the fact that they are proliferating whereas the primary motoneurons are terminally differentiated.
Although they are derived from neuroblastoma, the overall neuronal characteristics of NSC-34 and N2a are not profound. Nevertheless, comparison of NSC-34 and N2a cells to non-neuronal cell lines revealed some patterns that are characteristic for neurons—for instance, enrichment of proteins involved in neuron projection and the neuronal cytoskeleton. These observations based on proteomic quantification highlight fundamental differences between neuronal cell lines and primary motoneurons with respect to their protein repertoire for neuronal differentiation and function.
To characterize differences in protein patterns among primary motoneurons, motoneuronal cell lines, and non-neuronal cell lines in more detail, we computed enrichment values and p values for annotation categories for binary comparisons of the cellular systems (Fig. 4, supplemental Table S3). Comparison of primary motoneurons to NSC-34 and N2a cells revealed striking differences for neuronal categories, with a large overrepresentation in the motoneurons.
Evaluation of Axon Growth, Guidance, and Polarity
Impaired establishment and maintenance of neuronal morphology is a central pathological aspect in neurodegenerative disorders (53). We had observed the corresponding annotations such as neuron projection (GO cellular component) and axon guidance (KEGG) to be de-enriched in the motoneuronal cell lines, and we next wished to extract the expression level of key factors in these processes (Fig. 5A). Illustrating the use of the dataset as a resource, we observed that proteins important for axonal outgrowth like Slits/Robos, Semaphorins, Netrins, or Ephrins or proteins involved in morphological maintenance such as Mapt were either missing or underrepresented in NSC-34 and N2a.
Fig. 5.
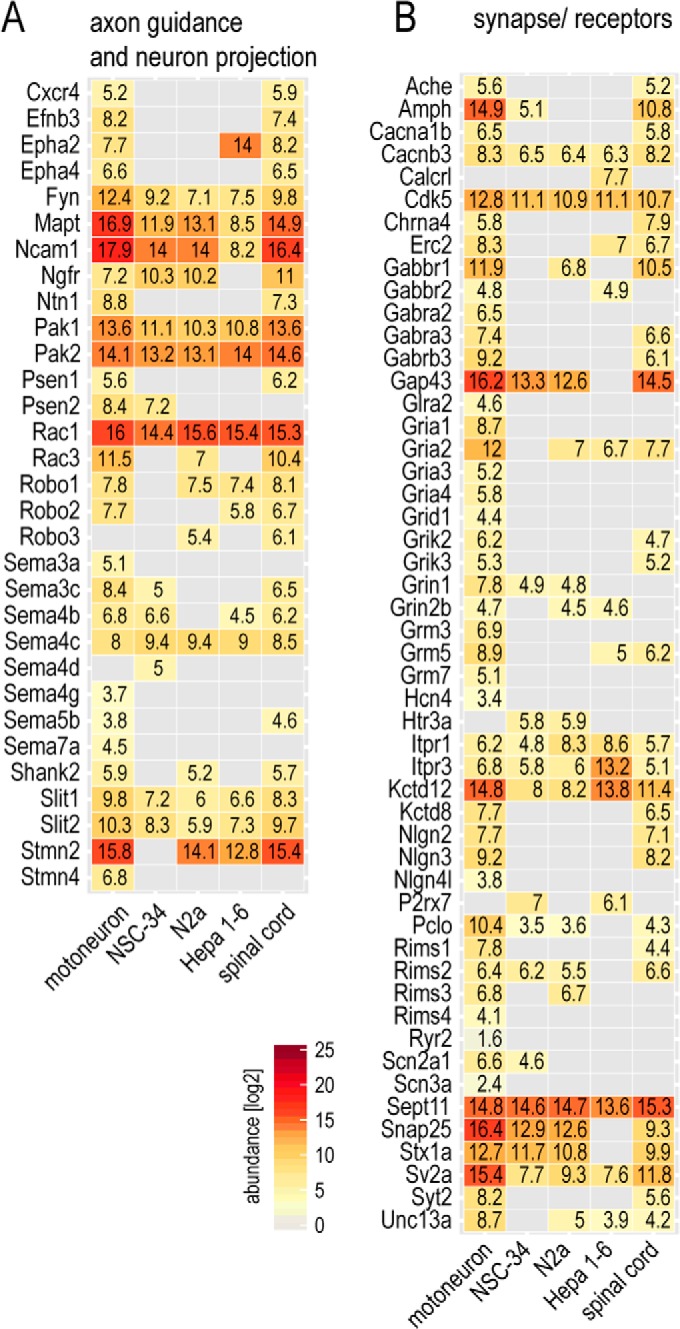
Evaluation of neuron-specific protein abundances. A, B, abundances of selected proteins that are members of the neuronal annotation classes in Fig. 3. The normalized MS-derived abundance values allow comparisons within and between cellular systems.
Evaluation of Excitability and Synaptic Function
Neurotransmitter-receptor signaling and excitability are main features of neuronal cell types that differ according to cellular functionality. We assessed the abundance of proteins involved in receptor signaling (KEGG “neuroactive receptor-ligand interaction,” voltage-gated channel (UniProt Keyword), and ligand-gated ion channel (UniProt Keyword); Fig. 5). Strikingly, many receptors were underrepresented or even not detected in the NSC-34 and N2a cells. In particular, glutamate receptors were present almost exclusively in isolated motoneurons, and to a lesser extent in spinal cord, but not in the neuronal cell lines. The serotonin receptor functions in fast depolarization of neurons and is not expected to be present in motoneurons. Accordingly, we did not detect it in motoneurons. It was, however, identified in NSC-34 and N2a cells, suggesting that they do not faithfully represent motoneuronal characteristics in this respect. Overall, slightly more receptor proteins were present in N2a than in NSC-34 cells. Despite the striking differences of both neuronal cell lines relative to primary motoneurons, their protein abundance patterns clearly indicated a neuronal inheritance compared with Hepa 1–6.
Evaluation of ALS-associated Proteins
As mentioned above, ALS-associated proteins span a wide range of cellular functions and are not generally neuron specific. The presence and abundance of these ALS-associated proteins are important aspects for studying disease mechanisms and therefore for evaluating the suitability of disease models. We found that most ALS-associated proteins were indeed present in the proteomes of NSC-34 and N2a cell lines (Fig. 6). Compared with neuronal proteins, the differences between the cellular systems were smaller but still distinct. For example, whereas we observed major expression-level differences for ALS-associated neuron-specific proteins such as the Eph4 receptor, the neurofilament protein Nefl, and the microtubule-associated Mapt, levels were similar for proteins that are not neuron specific, such as Sod1.
Fig. 6.

Evaluation of ALS-associated protein abundances. A, ranked abundances of ALS-associated proteins in the context of the entire proteome. B, normalized MS-derived expression values of the same proteins as in A, depicted as a heat map for motoneurons, NSC-34, N2a, Hepa 1–6, and E12.5 spinal cord.
DISCUSSION
Motoneuron diseases such as ALS or spinal muscle atrophy are incurable, and no effective symptomatic treatments are available. Researchers make use of a variety of different cell culture model systems to unravel disease pathways and to understand pathological mechanisms (19, 21, 54). However, the proteomics properties of these systems have never been assessed on a global level. Here we provide a large-scale and quantitative analysis comparing the proteomes of primary motoneurons to the neuroblastoma cell lines NSC-34 and N2a, as well as to unrelated cell lines. The quantitative inventory of expressed proteins in these systems should serve as a valuable resource for the community. We have made these data easily accessible in the MaxQB database (55). Users can query the expression rank order of proteins of interest, sequence coverage, high-resolution MS/MS spectra of peptides, and many other features of the proteome. Moreover, our study presents a generic approach with which to evaluate model systems using high-resolution quantitative mass-spectrometry-based proteomics.
Unexpectedly, our proteomics results at both global and individual protein levels only place the neuronal cell line models halfway between the actual target tissue (in vivo motoneurons) and completely unrelated cell lines derived from mouse liver cancer or mouse embryos. We found proteins with high relevance for neuronal function, in particular neurotransmitter receptors and proteins involved in neuronal excitability and neurotransmitter release, to be strongly underrepresented in NSC-34 and N2a. The abundances of glutamate receptors were considerably lower as well, suggesting nonexistent or at least significantly diminished neuronal excitability. Because disease pathways associated with excitotoxicity, in particular glutamate toxicity, are frequent areas of focus in ALS research (19, 56), this leads us to question the suitability of these cell lines for such studies. The nerve growth factor receptor is highly abundant during development and when neurons are lesioned or degenerating (57–60). In accordance with this, we found nerve growth factor receptor to be highly abundant in E12.5 spinal cord, whereas it was down-regulated in primary motoneurons, which are terminally differentiated. This receptor also showed relatively high abundance in NSC-34 and N2a cell lines, further suggesting differences relative to motoneurons.
Mechanisms that destabilize axons are a major focus of research in neurodegeneration (53). In this regard it is important to take the observed differences for cytoskeleton-associated proteins—for instance, for Mapt and Nefl, which were much lower in N2a and NSC-34 cells than in primary motoneurons—into account. In addition, various members of the axon guidance family such as Slits/Robos, Semaphorins, Netrins, or Ephrins showed altered abundance patterns in NSC-34 and N2a. Together, these observations raise the question of whether N2a and NSC-34 cells are reliable models regarding motoneuronal structure, in particular axon growth and maintenance. Although both cell lines certainly exhibit aspects of neuronal morphology, at the proteomics level, neuronal features mainly become apparent in comparison to unrelated, non-neuronal cell lines. Our data thus indicate that the morphological tendency toward motoneurons does not correspond directly to the protein level. This also suggests that morphological comparisons can usefully be complemented by quantitative proteomic data.
In contrast to these motoneuron-specific pathways, universal metabolic and housekeeping pathways were less altered between cell lines and primary cells. The main difference highlighted by bioinformatic analysis of the proteomic data was an up-regulation of DNA metabolism (Fig. 3). This is because cell culture favors rapidly dividing cells, and any non-essential metabolic pathways are counter-selected. The same reasoning might also explain the down-regulation of pathways such as receptor signaling and of proteins important for the maintenance of complex cellular morphologies noted above.
We further found differences in the expression levels of some, but not all, ALS-associated proteins in the analyzed cellular systems. For many of them, such as mutant Sod1 or wild-type Tdp-43 (61), even relatively small expression levels (2-fold overexpression relative to wild-type levels, for instance (62)) are known to have severe effects on the pathogenic cascade and the onset of symptoms (63). Furthermore, motoneuron diseases are highly cell-type specific, suggesting a narrow physiological niche for manifestation of a pathological phenotype. Therefore, in addition to the fact that moderate differences in ALS protein abundances may be very important, the general motoneuronal characteristics as evidenced by quantitative proteomics need to be taken into account. Thus neuroblastoma cell lines are limited in terms of their suitability to serve as model systems for motoneurons for the study of ALS-relevant functional mechanisms, as they neither reconstitute global motoneuronal properties nor faithfully mimic motoneurons on the individual protein level. However, they still retain neuronal character in comparison to other cell lines, rendering them a valid choice for some biological investigations and high-throughput screens.
In conclusion, we here present a resource for motoneuron disease research. Because of the high protein coverage in cell lines and primary motoneurons, our data highlight important cellular pathways unique to or enriched in neurons and functionally relevant in motoneurons. Our study exemplifies how quantitative proteomics can be used to critically evaluate the suitability of model systems in general. Depending on the intended experiments, the best cellular model system can be chosen according to the presence or abundance of the involved receptors or neuronal pathways (such as ALS or signaling studies). In the current context, for instance, it would be interesting to compare the proteome of primary motoneurons to in vitro differentiated motoneurons derived from induced patient-derived pluripotent stem cells with a view to evaluate these exciting and promising new model systems.
Supplementary Material
Acknowledgments
We thank Steven Dewitz and Martin Dodel for talented laboratory support; Zuzana Fouskova and Rajeeve Sivadasan for help in cell culture; Dr. Robert Blum, Tar Viturawong, and Jan Rieckmann for inspiring discussions and project feedback; Dr. Sibylle Jablonka, Institute for Clinical Neurobiology, University of Wuerzburg, for critical comments on the data; and Milena Duerrbaum, Marco Hein, and Juergen Cox for feedback on data analysis.
The mass spectrometry proteomics data have been deposited to the ProteomeXchange Consortium (www.proteomexchange.org) via the PRIDE partner repository with the dataset identifier PXD000666 and to the MaxQB database (http://maxqb.biochem.mpg.de/mxdb/project/show/P003).
Footnotes
Author contributions: D.H., F.B., F.M., and M.M. designed research; D.H. and C.D. performed research; D.H. and C.D. contributed new reagents or analytic tools; D.H., C.D., F.M., M.S., and M.M. analyzed data; D.H., C.D., F.M., M.S., and M.M. wrote the paper.
* The research leading to these results received funding from the European Community's Health Seventh Framework Programme (FP7/2007–2013) under grant agreement no. 259867.
 This article contains supplemental material.
1 The abbreviations used are:
- ALS
- amyotrophic lateral sclerosis
- FDR
- false discovery rate
- GO
- Gene Ontology
- Hepa 1–6
- mouse hepatoma cells
- MaxLFQ
- MaxQuant label-free quantification
- MEF
- mouse embryonic fibroblast
- MS
- mass spectrometry
- N2a
- mouse neuroblastoma cell line
- NSC-34
- spinal cord neuron-neuroblastoma hybrid cell line
- PCA
- principal component analysis.
REFERENCES
- 1. Lillo P., Hodges J. R. (2009) Frontotemporal dementia and motor neurone disease: overlapping clinic-pathological disorders. J. Clin. Neurosci. 16, 1131–1135 [DOI] [PubMed] [Google Scholar]
- 2. Mackenzie I. R., Rademakers R., Neumann M. (2010) TDP-43 and FUS in amyotrophic lateral sclerosis and frontotemporal dementia. Lancet Neurol. 9, 995–1007 [DOI] [PubMed] [Google Scholar]
- 3. Al-Chalabi A., Fang F., Hanby M. F., Leigh P. N., Shaw C. E., Ye W., Rijsdijk F. (2010) An estimate of amyotrophic lateral sclerosis heritability using twin data. J. Neurol. Neurosurg. 81, 1324–1326 [DOI] [PMC free article] [PubMed] [Google Scholar]
- 4. Rosen D. R. (1993) Mutations in Cu/Zn superoxide dismutase gene are associated with familial amyotrophic lateral sclerosis. Nature 364, 362. [DOI] [PubMed] [Google Scholar]
- 5. Hadano S., Hand C. K., Osuga H., Yanagisawa Y., Otomo A., Devon R. S., Miyamoto N., Showguchi-Miyata J., Okada Y., Singaraja R., Figlewicz D. A., Kwiatkowski T., Hosler B. A., Sagie T., Skaug J., Nasir J., Brown R. H., Scherer S. W., Rouleau G. A., Hayden M. R., Ikeda J. E. (2001) A gene encoding a putative GTPase regulator is mutated in familial amyotrophic lateral sclerosis 2. Nat. Genet. 29, 166–173 [DOI] [PubMed] [Google Scholar]
- 6. Chen Y. Z., Bennett C. L., Huynh H. M., Blair I. P., Puls I., Irobi J., Dierick I., Abel A., Kennerson M. L., Rabin B. A., Nicholson G. A., Auer-Grumbach M., Wagner K., De Jonghe P., Griffin J. W., Fischbeck K. H., Timmerman V., Cornblath D. R., Chance P. F. (2004) DNA/RNA helicase gene mutations in a form of juvenile amyotrophic lateral sclerosis (ALS4). Am. J. Hum. Genet. 74, 1128–1135 [DOI] [PMC free article] [PubMed] [Google Scholar]
- 7. Nishimura A. L., Mitne-Neto M., Silva H. C., Richieri-Costa A., Middleton S., Cascio D., Kok F., Oliveira J. R., Gillingwater T., Webb J., Skehel P., Zatz M. (2004) A mutation in the vesicle-trafficking protein VAPB causes late-onset spinal muscular atrophy and amyotrophic lateral sclerosis. Am. J. Hum. Genet. 75, 822–831 [DOI] [PMC free article] [PubMed] [Google Scholar]
- 8. Neumann M., Sampathu D. M., Kwong L. K., Truax A. C., Micsenyi M. C., Chou T. T., Bruce J., Schuck T., Grossman M., Clark C. M., McCluskey L. F., Miller B. L., Masliah E., Mackenzie I. R., Feldman H., Feiden W., Kretzschmar H. A., Trojanowski J. Q., Lee V. M. (2006) Ubiquitinated TDP-43 in frontotemporal lobar degeneration and amyotrophic lateral sclerosis. Science 314, 130–133 [DOI] [PubMed] [Google Scholar]
- 9. Sreedharan J., Blair I. P., Tripathi V. B., Hu X., Vance C., Rogelj B., Ackerley S., Durnall J. C., Williams K. L., Buratti E., Baralle F., de Belleroche J., Mitchell J. D., Leigh P. N., Al-Chalabi A., Miller C. C., Nicholson G., Shaw C. E. (2008) TDP-43 mutations in familial and sporadic amyotrophic lateral sclerosis. Science 319, 1668–1672 [DOI] [PMC free article] [PubMed] [Google Scholar]
- 10. Vance C., Rogelj B., Hortobagyi T., De Vos K. J., Nishimura A. L., Sreedharan J., Hu X., Smith B., Ruddy D., Wright P., Ganesalingam J., Williams K. L., Tripathi V., Al-Saraj S., Al-Chalabi A., Leigh P. N., Blair I. P., Nicholson G., de Belleroche J., Gallo J. M., Miller C. C., Shaw C. E. (2009) Mutations in FUS, an RNA processing protein, cause familial amyotrophic lateral sclerosis type 6. Science 323, 1208–1211 [DOI] [PMC free article] [PubMed] [Google Scholar]
- 11. Kwiatkowski T. J., Jr., Bosco D. A., Leclerc A. L., Tamrazian E., Vanderburg C. R., Russ C., Davis A., Gilchrist J., Kasarskis E. J., Munsat T., Valdmanis P., Rouleau G. A., Hosler B. A., Cortelli P., de Jong P. J., Yoshinaga Y., Haines J. L., Pericak-Vance M. A., Yan J., Ticozzi N., Siddique T., McKenna-Yasek D., Sapp P. C., Horvitz H. R., Landers J. E., Brown R. H., Jr. (2009) Mutations in the FUS/TLS gene on chromosome 16 cause familial amyotrophic lateral sclerosis. Science 323, 1205–1208 [DOI] [PubMed] [Google Scholar]
- 12. Johnson J. O., Mandrioli J., Benatar M., Abramzon Y., Van Deerlin V. M., Trojanowski J. Q., Gibbs J. R., Brunetti M., Gronka S., Wuu J., Ding J. H., McCluskey L., Martinez-Lage M., Falcone D., Hernandez D. G., Arepalli S., Chong S., Schymick J. C., Rothstein J., Landi F., Wang Y. D., Calvo A., Mora G., Sabatelli M., Monsurro M. R., Battistini S., Salvi F., Spataro R., Sola P., Borghero G., Galassi G., Scholz S. W., Taylor J. P., Restagno G., Chio A., Traynor B. J., Consortium I. (2010) Exome sequencing reveals VCP mutations as a cause of familial ALS. Neuron 68, 857–864 [DOI] [PMC free article] [PubMed] [Google Scholar]
- 13. Wu C. H., Fallini C., Ticozzi N., Keagle P. J., Sapp P. C., Piotrowska K., Lowe P., Koppers M., McKenna-Yasek D., Baron D. M., Kost J. E., Gonzalez-Perez P., Fox A. D., Adams J., Taroni F., Tiloca C., Leclerc A. L., Chafe S. C., Mangroo D., Moore M. J., Zitzewitz J. A., Xu Z. S., van den Berg L. H., Glass J. D., Siciliano G., Cirulli E. T., Goldstein D. B., Salachas F., Meininger V., Rossoll W., Ratti A., Gellera C., Bosco D. A., Bassell G. J., Silani V., Drory V. E., Brown R. H., Jr., Landers J. E. (2012) Mutations in the profilin 1 gene cause familial amyotrophic lateral sclerosis. Nature 488, 499–503 [DOI] [PMC free article] [PubMed] [Google Scholar]
- 14. Robberecht W., Philips T. (2013) The changing scene of amyotrophic lateral sclerosis. Nat. Rev. Neurosci. 14, 248–264 [DOI] [PubMed] [Google Scholar]
- 15. Renton A. E., Majounie E., Waite A., Simón-Sánchez J., Rollinson S., Gibbs J. R., Schymick J. C., Laaksovirta H., van Swieten J. C., Myllykangas L., Kalimo H., Paetau A., Abramzon Y., Remes A. M., Kaganovich A., Scholz S. W., Duckworth J., Ding J., Harmer D. W., Hernandez D. G., Johnson J. O., Mok K., Ryten M., Trabzuni D., Guerreiro R. J., Orrell R. W., Neal J., Murray A., Pearson J., Jansen I. E., Sondervan D., Seelaar H., Blake D., Young K., Halliwell N., Callister J. B., Toulson G., Richardson A., Gerhard A., Snowden J., Mann D., Neary D., Nalls M. A., Peuralinna T., Jansson L., Isoviita V.-M., Kaivorinne A.-L., Hölttä-Vuori M., Ikonen E., Sulkava R., Benatar M., Wuu J., Chiò A., Restagno G., Borghero G., Sabatelli M., Heckerman D., Rogaeva E., Zinman L., Rothstein J. D., Sendtner M., Drepper C., Eichler E. E., Alkan C., Abdullaev Z., Pack S. D., Dutra A., Pak E., Hardy J., Singleton A., Williams N. M., Heutink P., Pickering-Brown S., Morris H. R., Tienari P. J., Traynor B. J. (2011) A hexanucleotide repeat expansion in C9ORF72 is the cause of chromosome 9p21-linked ALS-FTD. Neuron 72, 257–268 [DOI] [PMC free article] [PubMed] [Google Scholar]
- 16. DeJesus-Hernandez M., Mackenzie I. R., Boeve B. F., Boxer A. L., Baker M., Rutherford N. J., Nicholson A. M., Finch N. A., Flynn H., Adamson J., Kouri N., Wojtas A., Sengdy P., Hsiung G. Y., Karydas A., Seeley W. W., Josephs K. A., Coppola G., Geschwind D. H., Wszolek Z. K., Feldman H., Knopman D. S., Petersen R. C., Miller B. L., Dickson D. W., Boylan K. B., Graff-Radford N. R., Rademakers R. (2011) Expanded GGGGCC hexanucleotide repeat in noncoding region of C9ORF72 causes chromosome 9p-linked FTD and ALS. Neuron 72, 245–256 [DOI] [PMC free article] [PubMed] [Google Scholar]
- 17. May S., Hornburg D., Schludi M. H., Arzberger T., Rentzsch K., Schwenk B. M., Grasser F. A., Mori K., Kremmer E., Banzhaf-Strathmann J., Mann M., Meissner F., Edbauer D. (2014) C9orf72 FTLD/ALS-associated Gly-Ala dipeptide repeat proteins cause neuronal toxicity and Unc119 sequestration. Acta Neuropathol. 128, 485–503 [DOI] [PMC free article] [PubMed] [Google Scholar]
- 18. Al-Chalabi A., Jones A., Troakes C., King A., Al-Sarraj S., van den Berg L. H. (2012) The genetics and neuropathology of amyotrophic lateral sclerosis. Acta Neuropathol, 124, 339–352 [DOI] [PubMed] [Google Scholar]
- 19. Ferraiuolo L., Kirby J., Grierson A. J., Sendtner M., Shaw P. J. (2011) Molecular pathways of motor neuron injury in amyotrophic lateral sclerosis. Nat. Rev. Neurol. 7, 616–630 [DOI] [PubMed] [Google Scholar]
- 20. Fallini C., Bassell G. J., Rossoll W. (2012) Spinal muscular atrophy: the role of SMN in axonal mRNA regulation. Brain Res. 1462, 81–92 [DOI] [PMC free article] [PubMed] [Google Scholar]
- 21. O'Connor D. M., Boulis N. M. (2012) Cellular and molecular approaches to motor neuron therapy in amyotrophic lateral sclerosis and spinal muscular atrophy. Neurosci. Lett. 527, 78–84 [DOI] [PubMed] [Google Scholar]
- 22. Gurney M. E., Pu H. F., Chiu A. Y., Dalcanto M. C., Polchow C. Y., Alexander D. D., Caliendo J., Hentati A., Kwon Y. W., Deng H. X., Chen W. J., Zhai P., Sufit R. L., Siddique T. (1994) Motor-neuron degeneration in mice that express a human Cu,Zn superoxide-dismutase mutation. Science 264, 1772–1775 [DOI] [PubMed] [Google Scholar]
- 23. Tsuda H., Han S. M., Yang Y. F., Tong C., Lin Y. Q., Mohan K., Haueter C., Zoghbi A., Harati Y., Kwan J., Miller M. A., Bellen H. J. (2008) The amyotrophic lateral sclerosis 8 protein VAPB is cleaved, secreted, and acts as a ligand for Eph receptors. Cell 133, 963–977 [DOI] [PMC free article] [PubMed] [Google Scholar]
- 24. Laird A. S., Van Hoecke A., De Muynck L., Timmers M., Van den Bosch L., Van Damme P., Robberecht W. (2010) Progranulin is neurotrophic in vivo and protects against a mutant TDP-43 induced axonopathy. PLoS One 5, e13368. [DOI] [PMC free article] [PubMed] [Google Scholar]
- 25. Wiese S., Herrmann T., Drepper C., Jablonka S., Funk N., Klausmeyer A., Rogers M. L., Rush R., Sendtner M. (2010) Isolation and enrichment of embryonic mouse motoneurons from the lumbar spinal cord of individual mouse embryos. Nat. Protoc. 5, 31–38 [DOI] [PubMed] [Google Scholar]
- 26. Cashman N. R., Durham H. D., Blusztajn J. K., Oda K., Tabira T., Shaw I. T., Dahrouge S., Antel J. P. (1992) Neuroblastoma x spinal cord (NSC) hybrid cell lines resemble developing motor neurons. Dev. Dyn. 194, 209–221 [DOI] [PubMed] [Google Scholar]
- 27. Oh Y. K., Shin K. S., Yuan J., Kang S. J. (2008) Superoxide dismutase 1 mutants related to amyotrophic lateral sclerosis induce endoplasmic stress in neuro2a cells. J. Neurochem. 104, 993–1005 [DOI] [PubMed] [Google Scholar]
- 28. Matusica D., Fenech M. P., Rogers M. L., Rush R. A. (2008) Characterization and use of the NSC-34 cell line for study of neurotrophin receptor trafficking. J. Neurosci. Res. 86, 553–565 [DOI] [PubMed] [Google Scholar]
- 29. Eggett C. J., Crosier S., Manning P., Cookson M. R., Menzies F. M., McNeil C. J., Shaw P. J. (2000) Development and characterisation of a glutamate-sensitive motor neurone cell line. J. Neurochem. 74, 1895–1902 [DOI] [PubMed] [Google Scholar]
- 30. Pan C., Kumar C., Bohl S., Klingmueller U., Mann M. (2009) Comparative proteomic phenotyping of cell lines and primary cells to assess preservation of cell type-specific functions. Mol. Cell. Proteomics 8, 443–450 [DOI] [PMC free article] [PubMed] [Google Scholar]
- 31. Nagaraj N., Wisniewski J. R., Geiger T., Cox J., Kircher M., Kelso J., Paabo S., Mann M. (2011) Deep proteome and transcriptome mapping of a human cancer cell line. Mol. Syst. Biol. 7, 548. [DOI] [PMC free article] [PubMed] [Google Scholar]
- 32. Beck M., Schmidt A., Malmstroem J., Claassen M., Ori A., Szymborska A., Herzog F., Rinner O., Ellenberg J., Aebersold R. (2011) The quantitative proteome of a human cell line. Mol. Syst. Biol. 7, 549. [DOI] [PMC free article] [PubMed] [Google Scholar]
- 33. Altelaar A. F., Munoz J., Heck A. J. (2013) Next-generation proteomics: towards an integrative view of proteome dynamics. Nat. Rev. Genet. 14, 35–48 [DOI] [PubMed] [Google Scholar]
- 34. Michalski A. D. E., Hauschild J. P., Lange O., Wieghaus A., Makarov A., Nagaraj N., Cox J., Mann M., Horning S. (2011) Mass spectrometry-based proteomics using Q Exactive, a high-performance benchtop quadrupole Orbitrap mass spectrometer. Mol. Cell. Proteomics 10, M111 011015 [DOI] [PMC free article] [PubMed] [Google Scholar]
- 35. Bantscheff M., Lemeer S., Savitski M. M., Kuster B. (2012) Quantitative mass spectrometry in proteomics: critical review update from 2007 to the present. Anal. Bioanal. Chem. 404, 939–965 [DOI] [PubMed] [Google Scholar]
- 36. Nagaraj N., Kulak N. A., Cox J., Neuhauser N., Mayr K., Hoerning O., Vorm O., Mann M. (2012) System-wide perturbation analysis with nearly complete coverage of the yeast proteome by single-shot ultra HPLC runs on a bench top Orbitrap. Mol. Cell. Proteomics 11, M111.013722. [DOI] [PMC free article] [PubMed] [Google Scholar]
- 37. Wisniewski J. R., Zougman A., Mann M. (2009) Combination of FASP and StageTip-based fractionation allows in-depth analysis of the hippocampal membrane proteome. J. Proteome Res. 8, 5674–5678 [DOI] [PubMed] [Google Scholar]
- 38. Rappsilber J., Mann M., Ishihama Y. (2007) Protocol for micro-purification, enrichment, pre-fractionation and storage of peptides for proteomics using StageTips. Nat. Protoc. 2, 1896–1906 [DOI] [PubMed] [Google Scholar]
- 39. Olsen J. V., Macek B., Lange O., Makarov A., Horning S., Mann M. (2007) Higher-energy C-trap dissociation for peptide modification analysis. Nat. Methods 4, 709–712 [DOI] [PubMed] [Google Scholar]
- 40. Cox J., Mann M. (2008) MaxQuant enables high peptide identification rates, individualized p.p.b.-range mass accuracies and proteome-wide protein quantification. Nat. Biotechnol. 26, 1367–1372 [DOI] [PubMed] [Google Scholar]
- 41. Cox J., Neuhauser N., Michalski A., Scheltema R. A., Olsen J. V., Mann M. (2011) Andromeda: a peptide search engine integrated into the MaxQuant environment. J. Proteome Res. 10, 1794–1805 [DOI] [PubMed] [Google Scholar]
- 42. Cox J., Hein M. Y., Luber C. A., Paron I., Nagaraj N., Mann M. (2014) MaxLFQ allows accurate proteome-wide label-free quantification by delayed normalization and maximal peptide ratio extraction. Mol. Cell. Proteomics M113.031591. [DOI] [PMC free article] [PubMed] [Google Scholar]
- 43. Schwanhausser B., Busse D., Li N., Dittmar G., Schuchhardt J., Wolf J., Chen W., Selbach M. (2011) Global quantification of mammalian gene expression control. Nature 473, 337–342 [DOI] [PubMed] [Google Scholar]
- 44. Team R. D. C. (2008) R: A Language and Environment for Statistical Computing, R Foundation for Statistical Computing, Vienna, Austria [Google Scholar]
- 45. Hubner N. C., Bird A. W., Cox J., Splettstoesser B., Bandilla P., Poser I., Hyman A., Mann M. (2010) Quantitative proteomics combined with BAC TransgeneOmics reveals in vivo protein interactions. J. Cell Biol. 189, 739–754 [DOI] [PMC free article] [PubMed] [Google Scholar]
- 46. Tusher V. G., Tibshirani R., Chu G. (2001) Significance analysis of microarrays applied to the ionizing radiation response. Proc. Natl. Acad. Sci. U.S.A. 98, 5116–5121 [DOI] [PMC free article] [PubMed] [Google Scholar]
- 47. Ashburner M., Ball C. A., Blake J. A., Botstein D., Butler H., Cherry J. M., Davis A. P., Dolinski K., Dwight S. S., Eppig J. T., Harris M. A., Hill D. P., Issel-Tarver L., Kasarskis A., Lewis S., Matese J. C., Richardson J. E., Ringwald M., Rubin G. M., Sherlock G. (2000) Gene ontology: tool for the unification of biology. The Gene Ontology Consortium. Nat. Genet. 25, 25–29 [DOI] [PMC free article] [PubMed] [Google Scholar]
- 48. Kanehisa M., Goto S., Sato Y., Furumichi M., Tanabe M. (2012) KEGG for integration and interpretation of large-scale molecular data sets. Nucleic Acids Res. 40, D109–D114 [DOI] [PMC free article] [PubMed] [Google Scholar]
- 49. Magrane M., Consortium U. (2011) UniProt Knowledgebase: a hub of integrated protein data. Database 2011, bar009. [DOI] [PMC free article] [PubMed] [Google Scholar]
- 50. Mazzoni E. O., Mahony S., Closser M., Morrison C. A., Nedelec S., Williams D. J., An D., Gifford D. K., Wichterle H. (2013) Synergistic binding of transcription factors to cell-specific enhancers programs motor neuron identity. Nat. Neurosci. 16, 1219–1227 [DOI] [PMC free article] [PubMed] [Google Scholar]
- 51. Geiger T. W. A., Schaab C., Cox J., Mann M. (2012) Comparative proteomic analysis of eleven common cell lines reveals ubiquitous but varying expression of most proteins. Mol. Cell. Proteomics 11 M111.014050. [DOI] [PMC free article] [PubMed] [Google Scholar]
- 52. Wisniewski J. R., Ostasiewicz P., Dus K., Zielinska D. F., Gnad F., Mann M. (2012) Extensive quantitative remodeling of the proteome between normal colon tissue and adenocarcinoma. Mol. Syst. Biol. 8, 611. [DOI] [PMC free article] [PubMed] [Google Scholar]
- 53. Schmidt E. R., Pasterkamp R. J., van den Berg L. H. (2009) Axon guidance proteins: novel therapeutic targets for ALS? Prog. Neurobiol. 88, 286–301 [DOI] [PubMed] [Google Scholar]
- 54. Philips T., Robberecht W. (2011) Neuroinflammation in amyotrophic lateral sclerosis: role of glial activation in motor neuron disease. Lancet Neurol. 10, 253–263 [DOI] [PubMed] [Google Scholar]
- 55. Schaab C., Geiger T., Stoehr G., Cox J., Mann M. (2012) Analysis of high accuracy, quantitative proteomics data in the MaxQB database. Mol. Cell. Proteomics 11, M111.014068. [DOI] [PMC free article] [PubMed] [Google Scholar]
- 56. Van Den Bosch L., Van Damme P., Bogaert E., Robberecht W. (2006) The role of excitotoxicity in the pathogenesis of amyotrophic lateral sclerosis. Biochim. Biophys. Acta 1762, 1068–1082 [DOI] [PubMed] [Google Scholar]
- 57. Seeburger J. L., Tarras S., Natter H., Springer J. E. (1993) Spinal cord motoneurons express p75NGFR and p145trkB mRNA in amyotrophic lateral sclerosis. Brain Res. 621, 111–115 [DOI] [PubMed] [Google Scholar]
- 58. Wu W. (1996) Potential roles of gene expression change in adult rat spinal motoneurons following axonal injury: a comparison among c-jun, off-affinity nerve growth factor receptor (LNGFR), and nitric oxide synthase (NOS). Exp. Neurol. 141, 190–200 [DOI] [PubMed] [Google Scholar]
- 59. Dupuis L., Pehar M., Cassina P., Rene F., Castellanos R., Rouaux C., Gandelman M., Dimou L., Schwab M. E., Loeffler J. P., Barbeito L., Gonzalez de Aguilar J. L. (2008) Nogo receptor antagonizes p75NTR-dependent motor neuron death. Proc. Natl. Acad. Sci. U.S.A. 105, 740–745 [DOI] [PMC free article] [PubMed] [Google Scholar]
- 60. Lu B., Pang P. T., Woo N. H. (2005) The yin and yang of neurotrophin action. Nat. Rev. Neurosci. 6, 603–614 [DOI] [PubMed] [Google Scholar]
- 61. Ash P. E., Zhang Y. J., Roberts C. M., Saldi T., Hutter H., Buratti E., Petrucelli L., Link C. D. (2010) Neurotoxic effects of TDP-43 overexpression in C. elegans. Hum. Mol. Genet. 19, 3206–3218 [DOI] [PMC free article] [PubMed] [Google Scholar]
- 62. Wils H., Kleinberger G., Janssens J., Pereson S., Joris G., Cuijt I., Smits V., Ceuterick-de Groote C., Van Broeckhoven C., Kumar-Singh S. (2010) TDP-43 transgenic mice develop spastic paralysis and neuronal inclusions characteristic of ALS and frontotemporal lobar degeneration. Proc. Natl. Acad. Sci. U.S.A. 107, 3858–3863 [DOI] [PMC free article] [PubMed] [Google Scholar]
- 63. Jucker M., Walker L. C. (2011) Pathogenic protein seeding in Alzheimer disease and other neurodegenerative disorders. Ann. Neurol. 70, 532–540 [DOI] [PMC free article] [PubMed] [Google Scholar]
Associated Data
This section collects any data citations, data availability statements, or supplementary materials included in this article.