

Abstract
Knowledge of the identity and quantity of expressed proteins of a cell type is a prerequisite for a complete understanding of its molecular functions. Mass-spectrometry-based proteomics has allowed the identification of the entire protein complement of yeast and the close-to-complete set of proteins expressed in mammalian cell lines. Using recent technological advances, we here characterized the proteome of murine platelets, key actors in mediating hemostasis and thrombosis. We accurately measured the absolute protein concentrations of 13 platelet proteins using SILAC-protein epitope signature tags and used them as reference points to estimate the copy numbers of all proteins of the platelet proteome. To distinguish contaminants such as plasma or erythrocyte proteins from true platelet proteins, we monitored protein abundance profiles across multiple purification steps. In total, we absolutely quantified 4,400 platelet proteins, with estimated copy numbers ranging from less than 10 to about a million per cell. Stoichiometries derived from our data correspond well with previous studies. Our study provides a close-to-complete reference map of platelet proteins that will be useful to the community, for instance, for interpreting mouse models of human platelet diseases.
Platelets are cells derived from the cytoplasm of megakaryocytes, which are found in bone marrow and constantly produce and release platelets into the blood. In the blood they circulate and survey the integrity of the vasculature. Upon injury of the endothelium, platelets prevent hemorrhages and uncontrolled blood loss by sealing the vascular lesions. Platelets' ability to form aggregates is important for their hemostatic function; however, pathological platelet activation—for example, during rupture of an atherosclerotic plaque—may reduce blood supply to the heart or brain during vascular occlusion and thereby induce cardiac infarction or stroke. It is therefore important to understand the molecular processes that control platelet activation and aggregation and to develop new therapeutic strategies to block critical platelet proteins involved in these processes (1). A deeper, quantitative understanding of the platelet proteome will facilitate the identification of new drug targets and therefore the development of novel anti-platelet therapies.
With a diameter of only 0.5 to 1 μm in mice and 2 to 5 μm in humans, platelets are the smallest blood cell type and have a very short life span of 3 to 4 days (7 to 10 days in humans). Platelets lack a nucleus, and therefore there is no transcription that could replenish their residual megakaryocyte-derived mRNA. As a consequence, their mRNA levels are very low. Nevertheless, platelets translate mRNA into protein upon activation; however, whether this is important for platelet function is not clear (2). The low mRNA levels make transcriptomics challenging because even a minimal contamination of the platelet sample by nucleated cells could make a substantial contribution to the measured transcriptome. In addition, functional interpretation of the measured transcript levels is complicated by the fact that they may reflect the parental megakaryocyte transcriptome rather than platelet-specific processes (3). Despite these difficulties, several studies have measured mouse and human platelet transcriptomes, leading to the identification of ∼6,500 and 9,500 transcripts, respectively (4). In contrast to transcriptomics, proteomics approaches are intrinsically better suited for studying the cellular functions of platelets, because proteins are the biochemical functional units. Furthermore, they are the drug targets in antithrombotic or antiplatelet therapy (1). Historically, studies of the platelet proteome have utilized two-dimensional gel electrophoresis and typically have quantified up to several dozens of proteins (5). This approach has now been superseded by mass-spectrometry-based proteomics with much higher resolution and mass accuracy. The high peptide sequencing speed of modern instrumentation, combined with other technological advances, enables the mapping of close-to-complete proteomes with high confidence, despite the broad dynamic range of protein quantities expressed (6, 7). Recently, Burkhart et al. employed modern mass spectrometric instrumentation to confidently identify the deepest proteome to date of about 4,000 human platelet proteins (8). Based on the tendency of the shotgun proteomics workflow to identify peptides from more abundant proteins more frequently (spectral counting), the authors were able to derive a quantitative measure of the majority of the identified proteome. These values were then scaled to copies per cell through a literature review of absolute copy number measurements from diverse sources, such as quantitative Western blotting.
We have recently developed a method for absolute protein quantification in which we produce isotope-labeled recombinant protein fragments (PrESTs)1 in Escherichia coli and combine them with stable isotope labeling in cell culture (SILAC) (9, 10). In this SILAC-PrEST method, protein fragments are expressed as fusion proteins with albumin binding protein (ABP) as a solubility tag. Upon purification, their absolute concentrations are determined in relation to a common sample of ultra-pure ABP whose concentration has previously been measured via amino acid analysis. The heavy PrESTs with known concentrations are then spiked into cell lysates, and the SILAC ratios of several peptides enable calculation of the cellular concentrations and copy numbers of their endogenous protein counterparts. Using this approach, we were able to quantify HeLa cell proteins with copy numbers ranging from thousands to several millions per cell (10).
In this study we set out to analyze the murine platelet proteome via the high-resolution, quantitative methods developed in our laboratory (11, 12). Using a quadrupole Orbitrap mass spectrometer (13), we obtained label-free quantification values for more than 4,400 proteins. These values were converted to copy numbers per platelet using PrESTs of 13 proteins for calibration. Furthermore, to distinguish true platelet proteins from contaminants experimentally, we followed their decreasing intensity profile through successive stages of purification. Our accurate and quantitative picture of a mammalian platelet proteome shows that it is much larger than might have been expected from its specialized functions.
EXPERIMENTAL PROCEDURES
Platelet Preparation
Mice (strain C57BL/6) were bled under anesthesia from the retro-orbital plexus, and ∼1 ml of blood was collected using heparin (20 U/ml in TBS) as the anticoagulation reagent. Blood was then centrifuged at 100 × g for 7 min to obtain platelet-rich plasma, which we termed the “crude fraction.” The platelet-rich plasma was centrifuged at 700 × g to concentrate the platelets in the top layer (termed the “purified fraction”). This procedure was repeated once to obtain the “highly purified fraction.” Eventually the platelet pellet was resuspended in 1 ml of Tyrode's buffer containing PGl2 and apyrase, after which it underwent a centrifugation step (Fig. 1A) (“ultra-purified fraction”). For protein correlation profiling, because greater sample amounts are required, we mixed blood from different mice and then performed the extensive purification described above. For each sample 30 × 106 platelets were resuspended in lysis buffer (2% SDS, 100 mm Tris, pH 7.5, 100 mm DTT), boiled at 95 °C, and further processed using the filter-aided sample preparation method (11). In brief, SDS was exchanged to urea on a 30-kDa filter. Peptides were eluted after digestion with trypsin and subjected to a StageTip-based (14) strong anion exchange fractionation (12). Platelet counts were determined using a Hemavet950 analyzer (Drew Scientific, Waterbury, CT).
Fig. 1.

Platelet preparation and protein correlation profiling. A, the platelet preparation workflow. Platelets were purified via the depicted centrifugation and washing steps. For the protein correlation profiling, several mice were pooled, and at each purification step a sample was taken. For the mouse samples only at the ultra-purified fraction a sample was collected (*ultra-purified). B, unsupervised hierarchical clustering of protein abundance profiles of the different stages of purity. C, prototypical abundance profile of contaminating proteins (upper panel) and actual profiles of contaminating proteins at every abundance level.
Absolute Quantification
For absolute protein quantification using the SILAC-PrEST method (10), the synthetic genes of the protein standards were fused to ABP. The murine PrESTs were designed to be optimal for mass spectrometric analysis; specifically, we selected unique regions having many tryptic peptides also allowing us to distinguish isoforms. SILAC standards were produced using an auxotrophic E. coli strain (15) in the presence of heavy arginine (13C615N4) and heavy lysine (13C615N2). The recombinant His-tag-containing proteins were purified via nickel-nitrilotriacetic acid columns and quantified with aliquots of a light ABP preparation on which amino acid analysis had been performed. Next, the 13 protein standards were mixed and spiked into the lysed platelets at approximately endogenous concentration. The sample was further processed using the filter-aided sample preparation method (11).
Mass Spectrometry
The samples were eluted from the stage tip, resuspended in buffer A (2% acetonitrile, 0.1% trifluoroacetic acid), and loaded onto a fresh 50-cm C18 column packed with Reprosil-Pur 1.9-μm resin (Dr. Maisch GmbH, Ammerbuch-Entringen, Germany). The samples were separated on an ultra-high-performance LC system using a 180-min gradient ranging from 5% to 30% buffer B (80% acetonitrile, 0.1% trifluoroacetic acid) at a constant flow rate of 250 nl/min and injected via a nanoelectrospray ion source into the mass spectrometer. We used a quadrupole Orbitrap mass spectrometer (Q Exactive (13), Thermo Fisher Scientific) in a data-dependent fashion, acquiring a full scan (300–1750 m/z; 70,000 resolution at m/z 200; target value, 3e6 ions; maximum fill time, 20 ms) and up to 10 subsequent MS/MS scans (17,500 resolution; target value, 1e5 ions; maximum fill time, 120 ms) using higher energy collision fragmentation for peptide identification (13). Xcalibur software (Thermo Fisher Scientific) was used to acquire data.
Data Analysis
The raw data were analyzed using MaxQuant version 1.4.1.4 (16) with the integrated search engine Andromeda (17). For peptide identification, the fragmentation spectra were searched against the UniProt mouse database (downloaded in May 2013) containing 50,829 entries to which 247 common contaminants were added. A “software lock mass” was used to recalibrate and improve the mass accuracy of the precursor masses (18). During the main search, the maximum allowed initial mass deviation of the precursor ions was set at 4.5 ppm, and the maximum mass deviation of the fragmentation ions was set at 20 ppm. Cysteine carbamidomethylation was set as a fixed modification, and N-terminal acetylation and methionine oxidation were allowed as variable modifications. The “Enzyme” parameter was set as trypsin, for which N-terminal cleavage to proline and two miscleavages were allowed. A minimum of seven amino acids were required for valid peptide identification. In addition to the standard peptide search, the “second peptide” identification and the “match between run” option were enabled in Andromeda. For statistical evaluation of the data, a posterior error probability and a false discovery rate cutoff (determined via target-decoy searching) of 0.01 were used for peptides and proteins. For SILAC quantification, the MaxQuant standard settings were applied requiring at least two ratio counts between SILAC peptide pairs. Bioinformatics analysis was performed with the Perseus tool (version 1.4.1.4) available with the MaxQuant environment. For clustering and subsequent identification of contaminating proteins from other cell types and plasma, we used label-free intensities (19). In this case we replaced missing values using data imputation, which is based on the assumption that missing values are caused by the detection limit of the MS measurement (20). First we determined the Gaussian distribution of the logarithmized data, and next we used a normal distribution with adjusted mean and standard deviation in order to simulate signals of low abundant proteins. We chose parameters (width = 0.3, downshift = 1.8) such that the distribution of the imputed values was placed at the lower end of the distribution of measured values. The mass spectrometry proteomics data have been deposited to the ProteomeXchange Consortium (www.proteomexchange.org) via the PRIDE partner repository (21) with the dataset identifier PXD000747.
RESULTS AND DISCUSSION
Removal of Contaminant Proteins via Protein Correlation Profiling
Platelets are highly abundant in blood and can be prepared in high yields through differential centrifugation, but proteins from lysed erythrocytes and plasma are inevitably present in platelet fractions. To distinguish true platelet proteins from such contaminants, we adapted the protein correlation profiling approach (22, 23). Originally, protein correlation profiling was developed to define organelle proteomes by quantifying the distribution of various organelle marker proteins across different subcellular fractions and subsequently matching proteins with profiles similar to the marker. Here, we instead followed protein abundance profiles across purification fractions to identify the contamination profile. Mouse platelets were separated from erythrocytes and plasma via multiple centrifugation and washing steps (Fig. 1A). Aliquots were taken at each step (crude, purified, highly purified, and ultra-purified fractions; see “Experimental Procedures”) for protein correlation profiling. All samples were measured on a Q Exactive mass spectrometer after filter-aided sample preparation and strong anion exchange fractionation (12). To ensure meaningful profiles, we required at least three quantification values either from three different mice and the highly pure platelet preparation or from three unpurified fractions. After this stringent filtering, 4,585 protein groups remained.
To identify proteins with similar abundance profiles across different purification steps, we first performed unsupervised hierarchical clustering (Fig. 1B) of the label-free intensities (Fig. 1C). From the hierarchical clustering, we observed two major branches of the dendrogram grouped based on the different levels of purity—all the ultra-purified mouse replicates grouped together, separate from the cruder samples (Fig. 1B). Intriguingly, groups of proteins at each abundance level had similar profiles over the different samples (six clusters in total in six abundance ranges). Through cluster analysis and by comparing protein profiles to known plasma proteins, we identified 191 contaminant proteins. Because there was a gradual decline in protein intensities of the contaminations between the highly purified and ultra-purified fractions, we additionally perform a Welch's t test and detected 191 significant outliers at a false discovery rate of 0.05 (Fig. 2A). Interestingly, these outliers covered 90% of the 191 proteins identified via cluster analysis (18 unique proteins each), together amounting to 209 contaminants, of which 55% (115) were “secreted” according to the UniProt keyword annotation (Fig. 2B). These included apolipoproteins, serine protease inhibitors, antibodies, and complement factors, confirming that plasma was the main source of contaminant proteins. However, contaminants also included known erythrocyte markers such as erythrocytic spectrin, erythrocyte membrane protein band 4.2, and carbonic anhydrase 1 and 2, indicating that erythrocytes were another source of contamination (supplemental Table S1).
Fig. 2.

Identification of the contaminations via Welch's t test. A, volcano plot of one-sided Welch's t test; statistically significant (false discovery rate of 0.05) hits are marked in red. B, Venn diagram depicting the overlap between hierarchical clustering and Welch's t test.
However, we note that protein correlation profiling does not solve the problem of contaminating proteins completely. Because of platelets' canalicular system and “sponge-like” surface, as well as their uptake of plasma through vesicles (24), some of these proteins remain bound to or are even taken up by platelets, making them difficult to identify as contaminants.
The Platelet Proteome with Accurate Absolute Protein Quantification
To determine a reference map of the platelet proteome, we performed a second quantitative analysis. In these experiments we performed the same purification strategy but exclusively measured quantitative data on the ultra-purified platelets from three different mice. The different mice provided the range of variation. The final mean copy number values were determined as a combination of these values and the ultra-purified fraction of the combined blood sample to obtain the best possible accuracy. To evaluate and visualize the quality of our measurements, we plotted label-free protein abundance values of different replicates against one another (Fig. 3). This resulted in a Pearson correlation coefficient of r = 0.98, indicating excellent performance of our workflow and of MaxQuant's label-free algorithm, as well as consistency among the inbred mice. Plotting protein abundances of the ultra-purified versus the crude fractions highlighted contaminants previously identified through protein correlation profiling and Welch's t test as outliers from the trend line (depicted in red in Fig. 3). Once we eliminated the contaminant proteins, a final platelet proteome of 4,376 protein groups was obtained (supplemental Table S2).
Fig. 3.

Reproducibility of the proteomic measurements. Scatter plot of the proteins comparing replicates showing reproducibility as indicated by the Pearson correlation coefficients. Contaminant proteins are offset in the semi-purified samples because they are progressively de-enriched.
Next, we wished to determine the copy number of each platelet protein. To this end, we first selected 13 platelet proteins (Table I) that covered a wide abundance range of the platelet proteome. Absolute protein quantification was achieved using the recently developed SILAC-PrEST quantification method (10). Briefly, from each of the 13 proteins we selected ∼150 amino acids of unique sequence containing multiple tryptic peptides. We recombinantly expressed these PrESTs with a purification and a solubility tag and quantified these standards in a SILAC experiment (see “Experimental Procedures”). Next, we mixed the PrESTs of known concentration in appropriate ratios to obtain a master mix (10). This heavy mix was combined with the platelet lysate allowing multiplexed concentration determination of the corresponding endogenous proteins via their SILAC ratios (Fig. 4B). To quantify all other platelet proteins, intensities were normalized and scaled by the number of theoretically observable peptides through the intensity-based absolute quantification (iBAQ) algorithm incorporated in the MaxQuant software, using the PrESTs as the iBAQ standards (25). The copy numbers reported are the mean of three different ultra-purified mice and the ultra-purified fraction from the protein correlation profiling. The coefficient of variation (as a percentage) for each protein copy number was calculated from the four measurements and is reported in supplemental Table S2. The overall median coefficient of variation of the all copy numbers between the different mouse replicates was 20.6%.
Table I. Selected platelet proteins for reference points.
| Gene name | Protein name | Copy number | Coefficient of variation (%) |
|---|---|---|---|
| Akt1 | RAC-α serine/threonine-protein kinase | 500 | 35.6 |
| Akt2 | RAC-β serine/threonine-protein kinase | 700 | 40.9 |
| Akt3 | RAC-γ serine/threonine-protein kinase | 1,600 | 109.0 |
| Fermt3 | Fermitin family homolog 3 | 286,700 | 3.5 |
| Fyn | Tyrosine-protein kinase Fyn | 3,400 | 26.6 |
| Gp6 | Platelet glycoprotein VI | 19,700 | 33.9 |
| Itgb3 | Integrin β-3 | 136,300 | 4.8 |
| Itgb2 | Integrin β-2 | 7,300 | 7.9 |
| P2rx1 | P2X purinoceptor 1 | 5,500 | 24.7 |
| Prkca | Protein kinase C | 24,900 | 16.6 |
| Prkg1 | cGMP-dependent protein kinase 1 | 2,100 | 29.5 |
| Selp | P-selectin | 42,200 | 31.3 |
| Tln1 | Talin-1 | 267,000 | 4.1 |
Fig. 4.

Absolute protein quantification. A, quantification of the PrEST. Highly purified ABPs are quantified by means of amino acid analysis. The concentration of the SILAC-labeled PrESTs is determined using the common ABP-derived tryptic peptides. B, in a separate experiment, previously quantified PrESTs are multiplexed and spiked into the platelet lysate. The sample is processed via filter-aided sample preparation (FASP), and the concentration of the endogenous proteins is read out using the SILAC ratio determined in the mass spectrometer. C, 13 different PrESTs were used to quantify proteins of interest over the whole abundance range. D, comparison of protein copy numbers of 13 selected proteins obtained using SILAC-PrEST to those calculated using the iBAQ method.
To assess the accuracy of iBAQ-derived protein copy numbers, we plotted them against the values measured via SILAC-PrEST. The estimates from iBAQ quantification agreed well with the measured values obtained using the PrESTs, with estimated copy numbers generally located within an average 1.8-fold range, depending on protein abundance (Fig. 4D). The data from the two different methods concurred well with a high correlation coefficient of 0.94, indicating the reliability of the copy numbers determined via interpolation.
Adhesion and Signaling Receptors
Having protein copy numbers by hand we set out to examine important adhesion and signaling receptors. The primary function of platelets is to control hemostasis by scanning the blood system for vascular lesions. Most platelets never adhere or aggregate in their lifetime and are degraded in the reticuloendothelial system of the spleen or liver. In the case of a vessel lesion, however, different platelet receptors mediate adhesion, aggregation, and signaling (26). Fig. 5 depicts the major adhesion and signaling receptors of platelets.
Fig. 5.

Selection of platelet-specific proteins and pathways. Overview of major adhesion and signaling receptors of platelets, as well as downstream signaling pathways. Copy numbers derived in this study are depicted in gray (copy numbers with an asterisk were measured with SILAC-PrEST quantification).
The GPIb-IX-V complex consists of four proteins (GPIbα, GPIbβ, GPIX, and GPV) and represents the second most important platelet receptor after αIIbβ3 integrin. Its absence or deficiency in humans leads to Bernard–Soulier syndrome, the second most common bleeding disorder (27). It is responsible for initial platelet recruitment and platelet activation and is the major receptor for von Willebrand factor, a protein binding to subendothelial collagen whose absence is the most common cause of coagulation deficiency. The GPIb-IX-V complex associates in a certain stoichiometry, which was thought to be 2:2:2:1 (GPIbα:GPIbβ:GPIX:GPV). However, Li and co-workers (28) recently reported that GPIbβ is bound via two disulfide bridges, which would lead to two GPIbβ molecules for one GPIbα protein. Indeed, the stoichiometry of 1.3:4.4:1.8:1 found in our study agrees with this conclusion. Given this stoichiometry, we found 36,000 ± 5,000 GPIb-IX-V complexes to be present in each platelet on average.
Integrins represent the major class of adhesion and signaling receptors and are expressed in almost all cells. They consist of α and β subunits, and only correctly folded and associated heterodimers are transported to the plasma membrane. Upon activation integrins shift toward an active conformation with high affinity for their ligands (29). Platelets express six different integrins, αIIbβ3, αvβ3, α2β1, α5β1, α6β1, and αLβ2, each binding to different ligands. Mutations in the αIIb or β3 genes cause Glanzmann thrombostenia, the most common bleeding diathesis in patients. As expected from its prominent cellular and disease roles, the αIIbβ3 integrin was measured as the most abundant adhesion receptor, with 110,000 ± 7,900 to 130,000 ± 10,100 copies per platelet estimated from our dataset. The α2β1 integrin is the second most important integrin and mediates adhesion to collagen. We found it expressed at 18,000 ± 1,300 copies per platelet. The laminin receptor α6β1 integrin is involved in binding to laminins of the basement membrane, which is not thought to be of equal importance to the binding of platelets to collagen. Therefore it was surprising to find that the laminin receptor was expressed at similar levels (20,000 ± 1,500 copies). This indicates that it might have an underestimated role in platelet adhesion to subendothelial lesions, which expose laminins of the basement membrane. The expression levels of the other integrins are listed in Table II. Our dataset reflects the 1:1 stoichiometry of the various integrin complexes within the expected accuracy, further supporting the validity of our copy number estimates.
Table II. Integrin stoichiometry.
| Integrin subunit | Protein copy number | Collagen receptor | Fibrinogen receptor | Vitronectin receptor | Fibronectin receptor | Laminin receptor | Unknown role |
|---|---|---|---|---|---|---|---|
| Itgα2b | 106,600 | 106,600 | |||||
| Itgβ3 | 131,700 | ∼131,000a | ∼600 | ||||
| Itgα5 | 1,900 | 1,900 | |||||
| Itgα2 | 17,600 | 17,600 | |||||
| Itgβ1 | 30,900 | ∼13,530 | ∼1,460 | ∼15,910 | |||
| Itgα6 | 20,700 | 20,700 | |||||
| Itgαv | 500 | 500 | |||||
| ItgαL | 5,800 | 5,800 | |||||
| Itgβ2 | 11,000 | 11,000 |
a Integrins are heterodimers. Copy numbers of each of these (collagen receptor, fibrinogen receptor, etc.) were estimated from the measured copy numbers of their α subunits. The proportion of β subunits in each integrin receptor was allocated to this ratio (indicated by “∼”).
Glycoprotein VI (GPVI) represents an Ig superfamily member and is the other major collagen receptor. We directly quantified it via SILAC-PrEST and obtained a copy number of 19,000 ± 6,700 per platelet. Interestingly, both collagen receptors were expressed at similar levels. GPVI forms a complex with the common FcRγ chain (75,000 ± 15,400 copies), which is critical for the signaling process. Although GPVI might also have a role in platelet adhesion to collagen, its major role is platelet activation via phospholipase Cγ2 (11,000 ± 1,300 copies), which induces Ca2+ release and the activation of α2β1 integrins. Collagen-bound GPVI and α2β1-derived signals are both required for full platelet and αIIbβ3 integrin activation (30). Knowledge of copy numbers of the different collagen receptors might help understand their roles in collagen adhesion and subsequent signaling.
Beside these adhesion receptors, platelets contain a number of other receptor types. As many of them are thought to be expressed at very low levels, it is remarkable that they were identified and quantified in our measurements without any special enrichment step (Fig. 5). G-protein-coupled receptors belong to the seven transmembrane receptors and represent the major agonist receptor family in platelets. Protease-activated receptors Par4 (5,200 ± 1,500) and Par3 (3,900 ± 1,400), which reside on mouse platelets (in contrast to human platelets, where PAR1 and PAR4 are expressed), are activated by thrombin, one of the most potent platelet agonists. ADP is another important platelet agonist; it is secreted from platelet dense granules and acts as an autocrine agonist. It is bound by the two purinergic receptors P2Y1 (1,000 ± 100) and P2Y12 (2,700 ± 500). Many antiplatelet drugs approved by the U.S. Food and Drug Administration such as Ticopidine, Clopidogrel, and Prasugrel target P2Y12 and cause significant inhibition of ADP-mediated platelet activation (1). Other G-protein-coupled receptors important in transmitting signals from thromboxane, prostacyclin (PGI2), and epinephrine are thromboxane A2 receptor (1,900 ± 800), prostanoid IP receptor (2,200 ± 800), and α-2A adrenergic receptor (140 ± 60), respectively. The serotonin receptor 5HT2A is also known to be expressed on platelets; however, because we quantified it in only two of three replicates (with an average copy number of 175 ± 20), it did not pass our stringent threshold for copy number assignment.
One central step in platelet activation triggered by the above-mentioned adhesion and signaling receptors is an increase in intracellular calcium levels. This is mediated by phospholipase C hydrolyzing PIP2 to IP3, which in turn induces the release of Ca2+ from the dense tubular system (DTS). Depletion of Ca2+ from the dense tubular system activates Stim1 (33,000 ± 1,900), causing it to relocate to the plasma membrane to open the ion channel Orai1 (1,700 ± 300), resulting in Ca2+ influx from plasma. Another important Ca2+ channel is the P2X purinoceptor, which is activated independently by ATP. We measured 5,500 ± 1,400 copies of this receptor via direct SILAC-PrEST quantification. Increased calcium levels are crucial for instance, for αIIbβ3 integrin activation leading to platelet adhesion and aggregation. Knowledge of the copy numbers of these proteins might be informative for pharmacological approaches to target calcium signaling.
Determination and Quantification of Isoforms
Many protein families include different isoforms, which may have distinct functions. Quantification of isoforms via shotgun proteomics is complicated by the fact that peptides may be shared between these isoforms. Here, we restricted our analysis to cases in which the majority of peptides were sequence unique peptides for the isoform in question.
In platelets, two predominant phospholipase C isoforms can be found: β (β1, 220 ± 30 copies per cell; β3, 1,600 ± 200; β4, 1,400 ± 100) and γ (γ1, 60 ± 20; γ2, 11,300 ± 1,300). Depending on the upstream receptor, different phospholipase C isoforms are activated. In the case of the γ isoform, we can confirm that in platelets γ2 is by far the predominant isoform (31, 32). Downstream of phospholipase C, protein kinase C (PKC) is activated by diacylglycerol and increases Ca2+. We detected five different PKC isoforms: α (24,900 ± 2,200), β (30 ± 10), δ (4,000 ± 200), θ (8,000 ± 500), and ε (1,600 ± 300). In different knock-out studies (review in Ref. 33) it was shown that the different isoforms play distinct roles in the platelet activation process. PKC α, for example, phosphorylates, among other substrates, proteins involved in the secretion of the α-granules and dense granules. Mice deficient in Prkca exhibit reduced secretion of ATP (34). Other examples include the Akt kinases, of which all three mammalian isoforms have been shown to occur in platelets (35). Using SILAC-PrESTs we quantified the isoforms Akt1 (500 ± 200), Akt2 (700 ± 300), and Akt3 (1,600 ± 1,700) and can confirm that Akt3 was the most abundant isoform, as reported recently (35). It is known that they have different roles in platelet activation (36, 37). Even though the Akt isoforms have 75% sequence homology (but not sequence identity), we were able to distinguish and quantify the Akt isoforms with multiple unique peptides. These examples indicate that shotgun proteomic data with sufficiently high sequence coverage enable the determination of expression-level differences among distinct isoforms.
Global View of Protein Copy Numbers
Using our shotgun proteomics workflow, we identified and measured 4,376 platelet protein groups with an average sequence coverage of 38.5%. Estimated abundances from our data spanned a very wide, dynamic range—covering 6 orders of magnitude—from two copies up to 900,000 copies per platelet (Fig. 6A). As expected, the most abundant platelet protein was the cytoskeletal protein actin with close to one million copies per platelet. Notably, one-third of the identified platelet proteome (1,500 proteins) had copy numbers less than 500. Interestingly, for several proteins we even estimated copy numbers less than 10 per platelet; however, measurements in this range are likely to be less accurate. The lowest copy number of a protein known to have an important function in the proteome was that the α-2A adrenergic receptor (A2AR), which had 140 ± 60 copies per platelet. Conversely, some proteins that we would have expected in our platelet proteome, such as nitric oxidase, have not been identified.
Fig. 6.
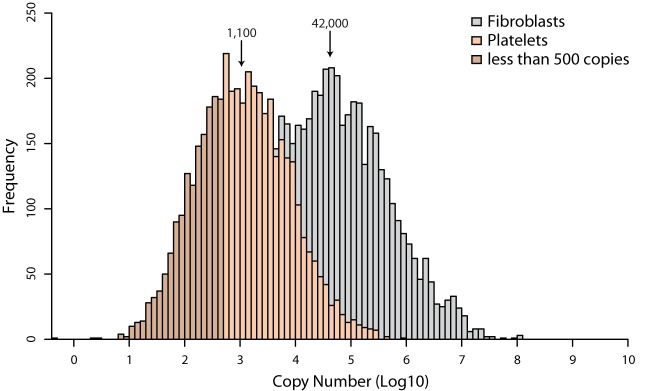
Histogram of all copy numbers. Comparison between the protein abundance distributions of fibroblast and platelet copy numbers. Proteins below 500 are depicted in dark brown.
We were intrigued by the high proportion of proteins with low copy numbers and asked whether they were likely to be functional. To investigate this, we did a bioinformatic enrichment analysis of groups or pathways that were statistically significantly overrepresented. To this end we performed a so-called one-dimensional enrichment analysis (with abundance being the one dimension) on the basis of annotation terms UniProt keywords and Gene Ontology in the Perseus software, which is part of MaxQuant (38) (supplemental Table S3). It employs a two-sample Welch's t test for difference of means of the category versus all remaining proteins and yields categories with statistical significance, and therefore does not require arbitrary cutoffs for abundance categories. We then did the same analysis for fibroblasts, for which absolute copy numbers have been reported recently (note that fibroblasts are much larger, and therefore copy numbers are in general much higher (25)). First, we could confirm that protein categories that were overrepresented in the high-abundance region were platelet-specific protein groups, as these annotation terms included “fibrinogen complex” (mean copy number: 220,000), “platelet alpha granule” (140,000), and “platelet activation” (120,000). In contrast, diverse categories such as “ribosome assembly” or “ribosomal subunits” (mean copy numbers of 6,000,000 to 10,000,000) were enriched in the high-abundant region of fibroblasts. Another abundant hit in fibroblasts was “nucleosome,” with a mean copy number of ∼4,000,000. This unbiased analysis directly confirms the different functional processes in platelets versus fibroblasts—one cell type with specialization in cell adhesion and associated signaling but little translation, in contrast to a dividing cell line allocating cellular resources to protein synthesis.
In the low-abundance region of platelet distribution, chromatin binding (mean copy number of 600), tRNA processing (500), RNA-mediated gene silencing (300), zinc finger proteins (400), nucleic acid binding (600), and different categories of proteins involved in the ubiquitination pathway were detected. Fibroblasts, in contrast, did not show any of these enrichments in the low-abundance region. Enrichment in the low-copy-number region of the platelet proteome is not surprising, as platelets lack a nucleus and are therefore not expected to have a functional requirement for proteins involved in transcription, DNA repair, or replication. Indeed, the fact that low amounts of these proteins are nevertheless clearly quantifiable suggests that they are vestiges of the budding process from the megakaryocytes. The presence of only very low copy numbers of proteins in the ubiquitylation process might reflect a relative absence of protein degradation—the mirror image of low or absent translation.
CONCLUSIONS AND OUTLOOK
In this study, we performed a deep and quantitative proteome analysis of murine platelets. Platelets are purified from blood; therefore it is crucial to discriminate between false positive proteins and contaminations from erythrocytes and plasma. To differentiate platelet proteins from common contaminations deriving from sample preparation, we successfully applied a variant of the protein correlation profiling approach based on the fact that true platelet proteins should be enriched, whereas contaminating proteins disappear during purification. After subtracting these, 4,400 platelet proteins were confidently identified. Notably, this proteome depth was achieved without laborious fractionation or enrichment for membrane proteins or post-translationally modified peptides.
Absolute quantification using the recently published SILAC-PrEST method allowed us to accurately quantify a number of platelet proteins in an absolute manner, which then enabled us to estimate the copy numbers of all identified platelet proteins per cell. These copy numbers allowed us to examine complex stoichiometry. For instance, we correctly determined the composition of the GPIb-IX-V complex and of most integrins. We are confident that the stoichiometry of many complexes can be deduced from our data.
We noted that some of our copy numbers were higher than previously published—for example, in the case of integrin αIIbβ3, which was reported to have 80,000 copies per unstimulated platelet. However, inspection of the literature revealed that only the receptors in the outer plasma membrane had been labeled and quantified (39). It is known that a significant proportion (30%) of the receptor is stored in the open canalicular system as well as in platelet α granules (40), leading to agreement with our SILAC-PrEST measurement of 120,000 copies per platelet. In general, many receptors are stored on α and dense granules and are incorporated into the plasma membrane only upon activation. Because we measured the total protein content, some copy numbers might not agree with numbers generated from surface measurements. Furthermore, to the extent that copy numbers are known, they have often been determined in human platelets, making them not directly comparable.
Given that murine platelet proteins fulfill the same functions as their human counterparts and that mice represent a valuable model organism for studying human pathology, which is also demonstrated by numerous genetically modified mice mimicking human platelet diseases, our mouse platelet proteome study might further help in illuminating the role of individual proteins in platelet physiology. At the same time, significant differences between platelets from mice and those from humans exist, such as in platelet size, counts, and expression of certain critical proteins (e.g. the above-mentioned PAR1 in human versus PAR3 in mice). Thus, our data can also be useful in further study and for follow-up of differences in protein expression and isoforms.
In conclusion, we took advantage of recent advances in MS-based proteomics and quantification techniques to achieve a very large and high-confidence dataset of platelet proteins. Estimated absolute quantification to a level down to a single copy per cell should provide a basis for further characterization of platelets and their functionality.
Supplementary Material
Acknowledgments
We thank the Department for Signal Transduction and Proteomics for help and fruitful discussions, in particular Jeffrey Liu and Georg Borner for careful reading of the manuscript and Katharina Zettl for excellent technical assistance.
Footnotes
Author contributions: M.Z., M. Moser, and M. Mann designed research; M.Z., M. Moser, and M. Mann performed research; M.Z. analyzed data; M.Z., M. Moser, and M. Mann wrote the paper.
* This work was supported by the European Commission's 7th Framework Program PROSPECTS (grant agreement HEALTH-F4-2008-201648) and the Deutsche Forschungsgemeinschaft SFB914 (project A1).
 This article contains supplemental material.
1 The abbreviations used are:
- PrEST
- protein epitope signature tag
- ABP
- albumin binding protein
- GP
- glycoprotein
- iBAQ
- intensity-based absolute quantification
- SILAC
- stable isotope labeling by amino acids in cell culture.
REFERENCES
- 1. Michelson A. D. (2010) Antiplatelet therapies for the treatment of cardiovascular disease. Nat. Rev. Drug Discov. 9, 154–169 [DOI] [PubMed] [Google Scholar]
- 2. Weyrich A. S., Schwertz H., Kraiss L. W., Zimmerman G. A. (2009) Protein synthesis by platelets: historical and new perspectives. J. Thrombosis Haemostasis 7, 241–246 [DOI] [PMC free article] [PubMed] [Google Scholar]
- 3. McRedmond J. P., Park S. D., Reilly D. F., Coppinger J. A., Maguire P. B., Shields D. C., Fitzgerald D. J. (2004) Integration of proteomics and genomics in platelets: a profile of platelet proteins and platelet-specific genes. Mol. Cell. Proteomics 3, 133–144 [DOI] [PubMed] [Google Scholar]
- 4. Rowley J. W., Oler A. J., Tolley N. D., Hunter B. N., Low E. N., Nix D. A., Yost C. C., Zimmerman G. A., Weyrich A. S. (2011) Genome-wide RNA-seq analysis of human and mouse platelet transcriptomes. Blood 118, e101–e111 [DOI] [PMC free article] [PubMed] [Google Scholar]
- 5. Zufferey A., Fontana P., Reny J. L., Nolli S., Sanchez J. C. (2012) Platelet proteomics. Mass Spectrom. Rev. 31, 331–351 [DOI] [PubMed] [Google Scholar]
- 6. Altelaar A. F., Munoz J., Heck A. J. (2013) Next-generation proteomics: towards an integrative view of proteome dynamics. Nat. Rev. Genet. 14, 35–48 [DOI] [PubMed] [Google Scholar]
- 7. Bantscheff M., Lemeer S., Savitski M. M., Kuster B. (2012) Quantitative mass spectrometry in proteomics: critical review update from 2007 to the present. Anal. Bioanal. Chem. 404, 939–965 [DOI] [PubMed] [Google Scholar]
- 8. Burkhart J. M., Vaudel M., Gambaryan S., Radau S., Walter U., Martens L., Geiger J., Sickmann A., Zahedi R. P. (2012) The first comprehensive and quantitative analysis of human platelet protein composition allows the comparative analysis of structural and functional pathways. Blood 120, e73–e82 [DOI] [PubMed] [Google Scholar]
- 9. Ong S. E., Blagoev B., Kratchmarova I., Kristensen D. B., Steen H., Pandey A., Mann M. (2002) Stable isotope labeling by amino acids in cell culture, SILAC, as a simple and accurate approach to expression proteomics. Mol. Cell. Proteomics 1, 376–386 [DOI] [PubMed] [Google Scholar]
- 10. Zeiler M., Straube W. L., Lundberg E., Uhlen M., Mann M. (2012) A protein epitope signature tag (PrEST) library allows SILAC-based absolute quantification and multiplexed determination of protein copy numbers in cell lines. Mol. Cell. Proteomics 11, O111.009613. [DOI] [PMC free article] [PubMed] [Google Scholar]
- 11. Wisniewski J. R., Zougman A., Nagaraj N., Mann M. (2009) Universal sample preparation method for proteome analysis. Nat. Methods 6, 359–362 [DOI] [PubMed] [Google Scholar]
- 12. Wisniewski J. R., Zougman A., Mann M. (2009) Combination of FASP and StageTip-based fractionation allows in-depth analysis of the hippocampal membrane proteome. J. Proteome Res. 8, 5674–5678 [DOI] [PubMed] [Google Scholar]
- 13. Michalski A., Damoc E., Hauschild J. P., Lange O., Wieghaus A., Makarov A., Nagaraj N., Cox J., Mann M., Horning S. (2011) Mass spectrometry-based proteomics using Q Exactive, a high-performance benchtop quadrupole Orbitrap mass spectrometer. Mol. Cell. Proteomics 10, M111.011015. [DOI] [PMC free article] [PubMed] [Google Scholar]
- 14. Rappsilber J., Mann M., Ishihama Y. (2007) Protocol for micro-purification, enrichment, pre-fractionation and storage of peptides for proteomics using StageTips. Nat. Protoc. 2, 1896–1906 [DOI] [PubMed] [Google Scholar]
- 15. Matic I., Jaffray E. G., Oxenham S. K., Groves M. J., Barratt C. L., Tauro S., Stanley-Wall N. R., Hay R. T. (2011) Absolute SILAC-compatible expression strain allows Sumo-2 copy number determination in clinical samples. J. Proteome Res. 10, 4869–4875 [DOI] [PMC free article] [PubMed] [Google Scholar]
- 16. Cox J., Mann M. (2008) MaxQuant enables high peptide identification rates, individualized p.p.b.-range mass accuracies and proteome-wide protein quantification. Nat. Biotechnol. 26, 1367–1372 [DOI] [PubMed] [Google Scholar]
- 17. Cox J., Neuhauser N., Michalski A., Scheltema R. A., Olsen J. V., Mann M. (2011) Andromeda: a peptide search engine integrated into the MaxQuant environment. J. Proteome Res. 10, 1794–1805 [DOI] [PubMed] [Google Scholar]
- 18. Cox J., Michalski A., Mann M. (2011) Software lock mass by two-dimensional minimization of peptide mass errors. J. Am. Soc. Mass Spectrom. 22, 1373–1380 [DOI] [PMC free article] [PubMed] [Google Scholar]
- 19. Cox J., Hein M. Y., Luber C. A., Paron I., Nagaraj N., Mann M. (2014) Accurate Proteome-wide Label-free Quantification by Delayed Normalization and Maximal Peptide Ratio Extraction, Termed MaxLFQ. Mol. Cell. Proteomics 13, 2513–2526 [DOI] [PMC free article] [PubMed] [Google Scholar]
- 20. Deeb S. J., D'Souza R. C., Cox J., Schmidt-Supprian M., Mann M. (2012) Super-SILAC allows classification of diffuse large B-cell lymphoma subtypes by their protein expression profiles. Mol. Cell. Proteomics 11, 77–89 [DOI] [PMC free article] [PubMed] [Google Scholar]
- 21. Vizcaino J. A., Cote R. G., Csordas A., Dianes J. A., Fabregat A., Foster J. M., Griss J., Alpi E., Birim M., Contell J., O'Kelly G., Schoenegger A., Ovelleiro D., Perez-Riverol Y., Reisinger F., Rios D., Wang R., Hermjakob H. (2013) The PRoteomics IDEntifications (PRIDE) database and associated tools: status in 2013. Nucleic Acids Res. 41, D1063–D1069 [DOI] [PMC free article] [PubMed] [Google Scholar]
- 22. Foster L. J., de Hoog C. L., Zhang Y., Zhang Y., Xie X., Mootha V. K., Mann M. (2006) A mammalian organelle map by protein correlation profiling. Cell 125, 187–199 [DOI] [PubMed] [Google Scholar]
- 23. Andersen J. S., Wilkinson C. J., Mayor T., Mortensen P., Nigg E. A., Mann M. (2003) Proteomic characterization of the human centrosome by protein correlation profiling. Nature 426, 570–574 [DOI] [PubMed] [Google Scholar]
- 24. Berger G., Masse J. M., Cramer E. M. (1996) Alpha-granule membrane mirrors the platelet plasma membrane and contains the glycoproteins Ib, IX, and V. Blood 87, 1385–1395 [PubMed] [Google Scholar]
- 25. Schwanhausser B., Busse D., Li N., Dittmar G., Schuchhardt J., Wolf J., Chen W., Selbach M. (2011) Global quantification of mammalian gene expression control. Nature 473, 337–342 [DOI] [PubMed] [Google Scholar]
- 26. Michelson A. D. (2013) Platelets, 3rd Ed., Elsevier Inc, Waltham, MA [Google Scholar]
- 27. Lopez J. A., Andrews R. K., Afshar-Kharghan V., Berndt M. C. (1998) Bernard-Soulier syndrome. Blood 91, 4397–4418 [PubMed] [Google Scholar]
- 28. Luo S. Z., Mo X., Afshar-Kharghan V., Srinivasan S., Lopez J. A., Li R. (2007) Glycoprotein Ibalpha forms disulfide bonds with 2 glycoprotein Ibbeta subunits in the resting platelet. Blood 109, 603–609 [DOI] [PMC free article] [PubMed] [Google Scholar]
- 29. Legate K. R., Wickstrom S. A., Fassler R. (2009) Genetic and cell biological analysis of integrin outside-in signaling. Genes Dev. 23, 397–418 [DOI] [PubMed] [Google Scholar]
- 30. Petzold T., Ruppert R., Pandey D., Barocke V., Meyer H., Lorenz M., Zhang L., Siess W., Massberg S., Moser M. (2013) Beta1 integrin-mediated signals are required for platelet granule secretion and hemostasis in mouse. Blood 122, 2723–2731 [DOI] [PubMed] [Google Scholar]
- 31. Tate B. F., Rittenhouse S. E. (1993) Thrombin activation of human platelets causes tyrosine phosphorylation of PLC-gamma 2. Biochim. Biophys. Acta 1178, 281–285 [DOI] [PubMed] [Google Scholar]
- 32. Blake R. A., Schieven G. L., Watson S. P. (1994) Collagen stimulates tyrosine phosphorylation of phospholipase C-gamma 2 but not phospholipase C-gamma 1 in human platelets. FEBS Lett. 353, 212–216 [DOI] [PubMed] [Google Scholar]
- 33. Harper M. T., Poole A. W. (2007) Isoform-specific functions of protein kinase C: the platelet paradigm. Biochem. Soc. Trans. 35, 1005–1008 [DOI] [PubMed] [Google Scholar]
- 34. Konopatskaya O., Gilio K., Harper M. T., Zhao Y., Cosemans J. M., Karim Z. A., Whiteheart S. W., Molkentin J. D., Verkade P., Watson S. P., Heemskerk J. W., Poole A. W. (2009) PKCalpha regulates platelet granule secretion and thrombus formation in mice. J. Clin. Invest. 119, 399–407 [DOI] [PMC free article] [PubMed] [Google Scholar]
- 35. O'Brien K. A., Stojanovic-Terpo A., Hay N., Du X. (2011) An important role for Akt3 in platelet activation and thrombosis. Blood 118, 4215–4223 [DOI] [PMC free article] [PubMed] [Google Scholar]
- 36. Woulfe D., Jiang H., Morgans A., Monks R., Birnbaum M., Brass L. F. (2004) Defects in secretion, aggregation, and thrombus formation in platelets from mice lacking Akt2. J. Clin. Invest. 113, 441–450 [DOI] [PMC free article] [PubMed] [Google Scholar]
- 37. Chen J., De S., Damron D. S., Chen W. S., Hay N., Byzova T. V. (2004) Impaired platelet responses to thrombin and collagen in AKT-1-deficient mice. Blood 104, 1703–1710 [DOI] [PMC free article] [PubMed] [Google Scholar]
- 38. Cox J., Mann M. (2012) 1D and 2D annotation enrichment: a statistical method integrating quantitative proteomics with complementary high-throughput data. BMC Bioinformat. 13 Suppl 16, S12. [DOI] [PMC free article] [PubMed] [Google Scholar]
- 39. Wagner C. L., Mascelli M. A., Neblock D. S., Weisman H. F., Coller B. S., Jordan R. E. (1996) Analysis of GPIIb/IIIa receptor number by quantification of 7E3 binding to human platelets. Blood 88, 907–914 [PubMed] [Google Scholar]
- 40. Schmitt A., Guichard J., Masse J. M., Debili N., Cramer E. M. (2001) Of mice and men: comparison of the ultrastructure of megakaryocytes and platelets. Exp. Hematol. 29, 1295–1302 [DOI] [PubMed] [Google Scholar]
Associated Data
This section collects any data citations, data availability statements, or supplementary materials included in this article.