

Abstract
To improve ethanol production directly from CO2 in photosynthetic cyanobacterial systems, one key issue that needs to be addressed is the low ethanol tolerance of cyanobacterial cells. Our previous proteomic and transcriptomic analyses found that several regulatory proteins were up-regulated by exogenous ethanol in Synechocystis sp. PCC6803. In this study, through tolerance analysis of the gene disruption mutants of the up-regulated regulatory genes, we uncovered that one transcriptional regulator, Sll0794, was related directly to ethanol tolerance in Synechocystis. Using a quantitative iTRAQ-LC-MS/MS proteomics approach coupled with quantitative real-time reverse transcription-PCR (RT-qPCR), we further determined the possible regulatory network of Sll0794. The proteomic analysis showed that in the Δsll0794 mutant grown under ethanol stress a total of 54 and 87 unique proteins were down- and up-regulated, respectively. In addition, electrophoretic mobility shift assays demonstrated that the Sll0794 transcriptional regulator was able to bind directly to the upstream regions of sll1514, slr1512, and slr1838, which encode a 16.6 kDa small heat shock protein, a putative sodium-dependent bicarbonate transporter and a carbon dioxide concentrating mechanism protein CcmK, respectively. The study provided a proteomic description of the putative ethanol-tolerance network regulated by the sll0794 gene, and revealed new insights on the ethanol-tolerance regulatory mechanism in Synechocystis. As the first regulatory protein discovered related to ethanol tolerance, the gene may serve as a valuable target for transcription machinery engineering to further improve ethanol tolerance in Synechocystis. All MS data have been deposited in the ProteomeXchange with identifier PXD001266 (http://proteomecentral.proteomexchange.org/dataset/PXD001266).
Through combined strategies of strain improvement and process optimization, current fermentation production of ethanol employing microbes such as yeast Saccharomyces cerevisiae and bacterium Zymomonas mobilis has reached a very high level of productivity that more than 20% (v/v) of ethanol is produced in industrial yeast fermentation vessels from starch-derived glucose (1). The technology progresses contributed significantly to the recent increase of worldwide ethanol production, from 17.0 billion liters in 2000 to more than 84.6 billion liters in 2011 (2). One of the successful strain improvement strategies was to obtain ethanol-tolerant strains from either mutant selection or more directed metabolic and genome engineering approaches and to apply them directly in industry, as ethanol is known to be highly toxic to cells (3–8). In addition to engineering an individual gene or enzyme for better tolerance, increasing studies were recently conducted using regulatory genes or proteins as targets for ethanol-tolerance improvements, as more evidences suggested that microbes tend to employ multiple resistance mechanisms in dealing with stress of single biofuel product (9, 10), and the manipulation of regulatory genes could provide a route to complex phenotypes that are not readily accessible by traditional methods of targeting some number of metabolic genes (11, 12). For example, global transcription machinery engineering approach has been applied to S. cerevisiae for improved glucose/ethanol tolerance, and mutagenesis of the transcription factor Spt15p and selection led to dominant mutations that conferred increased tolerance and more efficient glucose conversion to ethanol (13). In another study, screening yeast disruptome against high ethanol concentrations revealed that genes involved in sensing or regulation of amino acid metabolism were required for yeast resistance to ethanol, and can be used to engineer ethanol tolerance (14). More recently, expression of a mutated global regulator gene irrE from an extremely radiation-resistant bacterium, Deinococcus radiodurans, has led to 10- to 100-fold enhancement of Escherichia coli tolerances to ethanol or butanol in shock experiments (15); and error-prone PCR based engineering of a native global transcription factor cAMP receptor protein, which is known to regulate over 400 genes in E. coli, resulted in ethanol-tolerant cAMP receptor protein mutants with a higher growth rate in 62 g/L ethanol and a higher survival rate in 150 g/l ethanol (16). Together, these studies demonstrated that engineering transcriptional machinery could be a very efficient way to increase ethanol tolerance, and eventually ethanol production in industry (17).
As a nonnative platform of ethanol production, autotrophic cyanobacteria have attracted significant attention in recent years, because of the concerns that increasing production of ethanol directly from agricultural crops would require diverting farmland and crops for biofuel production, competing with world food supply, and causing economic and ethical problems (18). By expressing pyruvate decarboxylase (pdc) and alcohol dehydrogenase (adh) of Z. mobilis in cyanobacterium Synechococcus sp. PCC 7942, Deng and Coleman achieved up to 230 mg/L ethanol directly from CO2 within 4 weeks of growth (19). By constructing a genome-scale Synechocystis sp. PCC 6803 metabolic network and simulating cell growths under various conditions, Fu improved the ethanol production in the cyanobacterial host up to 690 mg/L in a week (20). More recently, by systematic evaluation and selection of adh genes from different cyanobacterial sources and optimization of culturing conditions, Gao et al. obtained an engineered Synechocystis sp. PCC 6803 strain with significantly higher ethanol-producing efficiency of 212 mg/L per day and 5.50 g/L in 26 days, respectively (21). However, to fully realize the ethanol-producing potentials that photosynthetic systems can offer, an urgent issue needs to be addressed is the extremely low tolerance of cyanobacteria to ethanol (22). In our previous investigations, we have found 1.0–2.0% ethanol was enough to cause growth inhibition of Synechocystis sp. PCC6803 (hereafter Synechocystis) (23). To identify possible targets related to ethanol tolerance, quantitative iTRAQ-LC-MS/MS based proteomics and RNA-seq based transcriptomics were applied to determine the metabolic response of Synechocystis under ethanol stress, and the results showed that multiple transcriptional regulators were differentially regulated, providing potential gene targets for engineering transcriptional machinery in order to improve ethanol tolerance in Synechocystis (23, 24). In this work, by constructing gene knockout mutants and conducting phenotypic analyses, we demonstrated that a transcriptional regulator Sll0794 was involved in ethanol tolerance. Further proteomic analysis along with electrophoretic mobility shift assays (EMSAs)1 allowed the determination of possible Sll0794 regulatory network and the identification of several possible gene targets of Sll0794. The results uncovered that the ethanol-tolerance regulation in Synechocystis may be mediated by direct binding of Sll0794 transcriptional regulator to the upstream regions of sll1514, slr1838, and slr1512, which encode a 16.6 kDa small heat shock protein, a carbon dioxide concentrating mechanism protein CcmK, and a putative sodium-dependent bicarbonate transporter, respectively. As the first transcriptional regulator involved in ethanol tolerance, Sll0794 could be a useful target for further improving ethanol tolerance through transcriptional machinery engineering approach in Synechocystis (13, 25).
EXPERIMENTAL PROCEDURES
Bacterial Growth Conditions
Synechocystis sp. PCC 6803 and the knockout mutants constructed in this study were grown in BG11 medium (pH 7.5) under a light intensity of ∼50 μmol photons m−2 s−1 in an illuminating incubator of 130 rpm at 30 °C (HNY-211B Illuminating Shaker, Honor, China) (23, 24). Cell density was measured on a UV-1750 spectrophotometer (Shimadzu, Japan) at OD730 or an ELx808 Absorbance Microplate Reader (BioTek, Winooski, VT) at OD630. For control growth and ethanol (1.5%, v/v) treatment, 10 ml fresh cells at OD730 of 0.5 collected by centrifugation and then were inoculated into 50 ml BG11 liquid medium in a 250-ml flask. Ethanol of analytical pure was purchased from Merck (Darmstadt, Germany). Growth experiments were repeated at least three times to confirm the growth patterns. Cells for proteomics analysis were collected by centrifugation at 8000 × g for 10 min at 4 °C. To reveal cell phenotype difference, flow cytometric analysis was performed to compare the wild type and the mutant cells under ethanol stress on a FACS Calibur fluorescence-activated cell sorting (FACS) cytometer (Becton Dickinson) as described before (23).
Construction and Analysis of Knockout Mutants
A fusion PCR based method was employed for the construction of gene knockout fragments (26). Briefly, for the gene target selected, three sets of primers were designed to amplify a linear DNA fragment containing the chloramphenicol resistance cassette (amplified from a plasmid pACYC184) with two flanking arms of DNA upstream and downstream of the targeted gene. The linear fused PCR amplicon was used directly for transformation into Synechocystis by natural transformation. The chloramphenicol-resistant transformants were obtained, confirmed for the gene knockout event by PCR and sequencing, and then passed several times on fresh BG11 plates supplemented with 10 μg/ml chloramphenicol to achieve complete chromosome segregation (confirmed by PCR). Three transcriptional regulator encoding genes, sll0792, sll0794, and sll1423 that were found differentially regulated by ethanol exposure either at protein or RNA levels according to previous studies (23, 24), were selected for construction of gene knockout mutants. The successful knockout mutants were confirmed by PCR and sequencing analysis. PCR primers for mutant construction and validation were listed in supplemental Table S1. Comparative growth analysis of the wild-type Synechocystis and the mutants were performed in 100-ml flasks each with 10 ml BG11 medium with or without 1.5% (v/v) ethanol. Cultivation conditions are the same as described above. Growth analysis was performed in biological triplicates.
Proteomics Analysis
1) Protein preparation and digestion: for each sample, 10 mg of cells were frozen by liquid nitrogen immediately after centrifugation and washed with phosphate buffer (pH 7.2). The cells were broken with sonication cracking at low temperature, and then centrifuged for 20 min at 20,000 × g to collect the supernatant. In addition, cell debris was then resuspended in a lysis buffer (8 m urea, 4% 3-[(3-cholamidopropyl) dimethylammonio]-1-propanesulfonate (CHAPS), 40 mm Tris-HCl), with 1 mm PMSF, and 2 mm Ethylenediaminetetraacetic acid (EDTA) (final concentration). After 5 min of vigorously vortex, dithiothreitol was also added to a final concentration of 10 mm. After mix, the sample were centrifuged for 20 min at 20,000 × g, and the supernatant was mixed well with ice-cold acetone (1:4, v/v) with 30 mm dithiothreitol. After repeating this step twice, all supernatants were combined and precipitated at −20 °C overnight, and stored at −80 °C prior to sample cleanup if not for immediate use. For digestion, protein pellet from previous step was resuspended in digestion buffer (100 mm triethylammonium bicarbonate TEAB, 0.05% w/v sodium dodecyl sulfate, SDS) to a final concentration of 1 mg/ml (total protein measured by bicinchonic acid assay (Sigma, St. Louis, MO)). Equal aliquots (500 μg) from each lysate were then digested with trypsin overnight at 37 °C (Sigma; 1:40 w/w added at 0 and 2 h) and lyophilized; 2) iTRAQ Labeling: the iTRAQ labeling of peptide samples derived from each of the wild-type control and the gene knockout mutant samples were performed using iTRAQ Reagent 8-plex kit (Applied Biosystems, Foster City, CA) according to the manufacturer's protocol. Four samples (two biological replicates for the wild-type control and two biological replicates for the mutant, respectively) were iTRAQ individually labeled. The 113-, 114-, 119-, and 121-iTRAG tags are for the wild-type control replicate 1 and 2, and the Δsll0794 mutant replicate 1 and 2, respectively. The peptides labeled with respective isobaric tags, incubated for 2 h and vacuum centrifuged to dryness. The iTRAQ labeled peptides in Buffer A (10 mm KH2PO4, 25% acetonitrile, pH 2.85) were fractionated using PolySULFOETHYL ATM Strong Cation Exchange Choematography (SCX) column (200 × 4.6 mm, 5 μm particle size, 200 A° pore size) by HPLC system (Shimadzu, Japan) at flow rate 1.0 ml min-1. The 50 min HPLC gradient consisted of 100% buffer A (10 mm KH2PO4, 25% acetonitrile, pH 2.85) for 5 min; 0–20% buffer B (10 mm KH2PO4, 25% ACN, and 500 mm KCL, pH 3.0) for 15 min; 20–40% buffer B for 10 min; and 40–100% buffer B for 5 min followed by 100% buffer A for 10 min. The chromatograms were recorded at 218 nm. A total of twenty fractions of labeled peptides were collected and then individually desalted with Sep-Pak® Vac C18 cartridges (Waters, Milford, MA), concentrated to dryness using vacuum centrifuge and reconstituted in 0.1% formic acid for LC-MS/MS analysis; 3) LC-MS/MS proteomic analysis: the mass spectroscopy analysis was performed using an AB SCIEX TripleTOF™ 5600 mass spectrometer (AB SCIEX, Framingham, MA), coupled with online micro flow HPLC system (Shimadzu, JAPAN) as described before (23, 24). The peptides were separated using nanobored C18 column with a picofrit nanospray tip (75 μm ID x 15 cm, 5 μm particles) (New Objectives, Wubrun, MA). The separation was performed at a constant flow rate of 20 μl min−1, with a splitter to get an effective flow rate of 0.2 μl min−1. The mass spectrometer data acquired in the positive ion mode, with a selected mass range of 300–2000 m/z. Peptides with +2 to +4 charge states were selected for MS/MS. The three most abundantly charged peptides above a count threshold were selected for MS/MS and dynamically excluded for 30 s with ±30 mDa mass tolerance. Smart information-dependent acquisition (IDA) was activated with automatic collision energy and automatic MS/MS accumulation. The fragment intensity multiplier was set to 20 and maximum accumulation time was 2 s. The peak areas of the iTRAQ reporter ions reflect the relative abundance of the proteins in the samples. For peptide identification, Triple TOF 5600 mass spectrometer used in this study has high mass accuracy (less than 2 ppm). Other identification parameters used included: Fragment mass tolerance: ± 0.1 Da; Mass values: monoisotopic; Variable modifications: Gln->pyro-Glu (N-term Q), Oxidation (M), iTRAQ8plex (Y); Peptide mass tolerance: 0.05 Da; Max missed cleavages: 1; Fixed modifications: Carbamidomethyl (C), iTRAQ8plex (N-term), iTRAQ8plex (K); Other parameters: default. 4) Proteomic data analysis: the MS data were processed using Proteome Discoverer software (Version 1.2.0.208) (Thermo Scientific, Marietta, OH) to generating peak list. The default parameters of Proteome Discoverer software (Version 1.2.0.208) were used. The data acquisition was performed with Analyst QS 2.0 software (Applied Biosystems/MDS SCIEX). Protein identification and quantification were performed using Mascot 2.3.02 (Matrix Science, London, United Kingdom) (23). For iTRAQ quantification, the peptide for quantification was automatically selected by the algorithm to calculate the reporter peak area, error factor (EF) and p value (default parameters in Mascot Software package). The resulting data set was auto bias-corrected to get rid of any variations imparted because of the unequal mixing during combining different labeled samples. Genome sequence and annotation information of Synechocystis sp. PCC 6803 were downloaded from NCBI, the Comprehensive Microbial Resource (CMR) of TIGR (http://www.tigr.org/CMR) and CyanoBase (http://genome.microbedb.jp/cyanobase/) (27). The Synechocystis sp. PCC 6803 genome contains 3569 predicted protein (27). The ratio between the mutant and the wild type was obtained directly based on the protein abundance for any given protein. Proteins with 1.5-fold or more change between ethanol-treated and control samples and p value of statistical evaluation less than 0.05 were determined as differentially expressed proteins. The quantitation was performed at the peptide level by following the procedures described in http://www.matrixscience.com/help/quant_statistics_help.html. The student's t test was performed using the Mascot 2.3.02 software. Briefly, a protein ratio is reported in bold face if it is significantly different from unity. The comparison test is:
 |
If this inequality is true, then there is no significant difference at the stated confidence level. (N is the number of peptide ratios, s is the standard deviation and x the mean of the peptide ratios, both numbers calculated in log space. The true value of the ratio, μ, is 0 in log space. t is student's t for N-1 degrees of freedom and a two-sided confidence level of 95%). To verify the proteomic results, the identical cell samples used for protein isolation as described above were also used for quantitative real-time reverse transcription-PCR (RT-qPCR) analysis as described before (24, 28). Three technical replicates were performed for each gene. Then data was presented as ratios of the amount of normalized transcript in the mutant to that from the wild-type control. The gene ID and their related primer sequences used for real-time RT-PCR analysis were listed in supplemental Table S1. All the mass spectrometry proteomics raw data described in this paper have been deposited to the ProteomeXchange Consortium via the PRIDE partner repository with the data set identifier PXD001266 (http://www.ebi.ac.uk/pride) (29, 30). In addition, the MASCOT csv results were also uploaded them to the MS-viewer available though University of California at San Francisco (a public website http://prospector2.ucsf.edu/prospector/cgi-bin/msform.cgi?form=msviewer), and can be retrieved using a search key “fvdaozbtdz.”
Overexpression and Purification of His6-Sll0794 Protein
The sll0794 coding gene of Synechocystis was amplified using primer pairs to introduce appropriate 5′ or 3′ extensions before its ATG initiation codon and behind its stop codon (supplemental Table S1). The resulting target fragment was treated with T4 DNA Polymerase in the presence of dATP to generate specific vector-complementary overhangs, and then annealed to pET46 Ek/LIC vector treated with the same enzymes, generating the recombinant plasmid pET46–0794. After verification by DNA sequencing, the pET46–0794 plasmid was transformed into E. coli BL21 (DE3) for protein expression. E. coli BL21 (DE3) harboring pET46–0794 was grown at 37 °C in 400 ml LB with 100 μg/ml ampicillin up to an OD600 of about 0.6. The cultures were then induced by Isopropyl β-d-1-thiogalactopyranoside (IPTG) at a final concentration of 0.2 mm and followed by incubation at 18 °C overnight. For the purification of His6-Sll0794, the cells were harvested by centrifugation at 5000 × g, 4 °C for 10 min, washed twice with binding buffer (50 mm Tris-HCl, 500 mm NaCl, 10 mm imidazole, and 10% glycerol (pH 8.0)), and resuspended in 40 ml of the same buffer. The cell suspension was then lyzed by sonication on ice. After centrifugation (13,000 × g for 40 min at 4 °C), the supernatant was recovered and loaded on the Ni-NTA agarose chromatography (GE healthcare, Sweden) equilibrated with binding buffer. After extensive washings with binding buffer and washing buffer (50 mm Tris-HCl, 500 mm NaCl, 50 mm imidazole, and 10% glycerol (pH 8.0)), His6-Sll0794 protein was eluted from the resin with 8 ml of elution buffer (50 mm Tris-HCl, 500 mm NaCl, 500 mm imidazole, and 10% glycerol (pH 8.0)) and concentrated to ∼3 mg/ml by ultrafiltration (Millipore membrane, 10 kDa cut-off size) according to the protocol provided by the manufacturer. The purity of the eluted His6-Sll0794 protein was then checked by sodium dodecyl sulfate polyacrylamide gel electrophoresis (SDS-PAGE).
Electrophoretic Mobility Shift Assays
The EMSAs were performed as described before (31). The promoter regions of 12 predicted target genes of Sll0794 were amplified using the genomic DNA of Synechocystis and primers listed in supplemental Table S1. Labeling of the probes was performed via PCR using Cy5-labeled primer (5′-AGCCAGTGGCGATAAG-3′) according to the method described by Tiffert et al. (32). The labeled PCR products were purified by QIAquick PCR Purification Kit (Qiagen, Germany). For each EMSA reaction, about 10 ng of Cy5-labeled DNA probes was incubated with varying amount of His6-Sll0794 protein in the buffer containing 1 mg/ml of nonspecific DNA competitor poly(deoxyinosinic-deoxycytidylic) acid (poly (dI-dC)) (Roche), 20 mm Tris-base (pH 7.9), 1 mm dithiothreitol, 10 mm MgCl2, 0.2 mg/ml nonspecific protein competitor calf bovine serum albumin (BSA), and 5% glycerol for 20 min at 25 °C. After incubation, protein-bound and free DNA were separated by nondenaturing 6% polyacrylamide gels with 0.5×TBE running buffer at 10 V cm−1 and 4 °C. The gels were scanned using a FujiFilm FLA 9000 Image Scanner (FUJIFILM, Japan). Probe DNA concentrations were determined using a Nanodrop 2000 (Thermo Scientific) at the wavelength of 260 nm.
Promoter Analysis and Motif Identification
The Gibbs Motif Sampler software (http://ccmbweb.ccv.brown.edu/gibbs/gibbs.html) (33, 34) and the Motif-based Sequence Analysis Tool MEME (http://meme.sdsc.edu/) (35) available online were used to identify matrix models describing DNA sequence motifs present upstream of the responsive genes between the mutant and the wild type. Regions representing ∼500 base pairs of the DNA sequences upstream of the translational start site of the responsive genes were extracted from the NCBI genome database using the Regulatory Sequence Analysis Tools (RSAT) (36). Both strands of each sequence were searched and possible motif locations were identified using the motif matrix score obtained from the Gibbs Motif Sampler software. The multilevel consensus sequence for each motif was then used to generate a sequence logo that is a graphical representation of nucleic acid multiple sequence alignment (http://www.weblogo.berkeley.edu/) (37).
RESULTS AND DISCUSSION
Ethanol Tolerance Analysis of the Transcriptional Regulator Mutants
Survey of the Synechocystis genome revealed at least 40 genes encoding putative transcriptional regulators (27). So far only a dozen of them have ever been functionally characterized and the results showed that they were involved in regulation of a wide-range of physiological functions, such as nitrogen assimilation (38), inorganic carbon starvation and osmotic stress (39), high-affinity bicarbonate transporting (40), biogenesis of photosystem I (41), photosystem stoichiometry in response to high light (42), ferric uptake (43), and heat response (44). However, no transcriptional regulator has ever been reported related to tolerance to solvents or biofuel products. Based on our previous proteomic and transcriptomic analyses of ethanol response (23, 24), three of the differentially regulated transcriptional regulator genes, sll0792, sll0794, and sll1423, were selected for construction of knockout mutants and validation of their possible functions in ethanol tolerance. After chromosomal integration and full segregation as confirmed by PCR and sequencing (data not shown), the mutants were grown in parallel with the wild-type Synechocystis in both normal BG11 medium and the BG11 medium supplemented with 1.5% (v/v) ethanol. The concentration of 1.5% ethanol was used as the concentration caused ∼50% growth inhibition in the wild-type Synechocystis (23, 24). Comparative analysis showed that in the normal BG11 medium, no visible difference in terms of growth patterns between the wild-type control and all three mutants was observed. However, in the BG11 medium supplemented with 1.5% ethanol, the Δsll0794 mutant led to a decreased growth when compared with the wild-type strain, suggesting the Δsll0794 mutant was more sensitive to ethanol and the gene may be involved in ethanol tolerance in Synechocystis (Fig. 1). In addition, a similar decreased growth of the Δsll0794 mutant under lower ethanol concentration stress (i.e. 1.0–1.4%) was also observed, although it is less significant (data not shown). For the Δsll0792 and Δsll1423 mutants, no obvious difference was observed between the wild-type strain and the mutants in the BG11 medium supplemented with ethanol of varying concentration (data not shown), suggesting these two genes may not be involved directly in ethanol tolerance, and their differential expressions upon ethanol stress in Synechocystis discovered in previous proteomic and transcriptomic analyses could be part of the secondary metabolic responses with the ethanol response cascade (23, 24).
Fig. 1.

Growth of the wild-type strain and the Δsll0794 mutant in BG11 with or without 1.5% ethanol (v/v).
Cell morphology of the wild-type Synechocystis and the Δsll0794 mutant under ethanol stress was also compared using microscopic and flow cytometric analysis. In the flow cytometric analysis, light intensity scattered at small (0.5–2 degree) angles FSC is determined to a substantial extent by the size of the scattering particles (i.e. cells), whereas light intensity scattered at large (15 to 135 degrees) angles SSC is affected by the composition or complexity of the cells (45). Although no visible difference was observed under microscope between the wild type and the mutant, flow cytometric analysis showed that internal structure complexity of the Δsll0794 mutant seemed decreasing (correlated with SSC values), especially at 48 and 72 h after long ethanol exposure (Fig. 2), suggesting different physiological responses to ethanol exposure between the wild type and the mutant.
Fig. 2.

Flow cytometric analysis of the wild-type strain and the Δsll0794 mutant grown in the BG11 medium supplemented with 1. 5% ethanol (v/v) at 24, 48, and 72 h, respectively.
The sll0794 gene was annotated as a mercuric resistance operon regulatory protein, and was previously found located within a nine-gene cluster involved in sensing and tolerance of Ni2+, Co2+, and Zn2+ in Synechocystis; within the cluster, sll0794 (corR) and slr0797 (corT) were together involved in Co2+ response system, as their mutants showed decreased Co2+ tolerance (46). Sequence analysis showed that the Sll0794 protein contains a helix_-turn_-helix (HTH) motif (E-value 5.6e-30) typically found in DNA binding proteins that regulate gene expression. The HTH motif is situated toward the N terminus at amino acid position 6–77 of Sll0794. To determine if sll0794 was involved in tolerance to other stress except Co2+ and ethanol, we also evaluated the cell growth of Δsll0794 and the wild-type control under several other stress conditions, including 0.25% butanol (v/v) and 4% NaCl (w/v), pH 6.5 and pH 11.0. Each growth experiment was repeated three times, each with three biological replicates. The results showed that no visible difference between the wild-type Synechocystis and the Δsll0794 mutant was observed under these tested stress conditions (data not shown), suggesting that the tolerance regulated by Sll0794 may be specific at certain degree rather than a part of general tolerance to all stresses.
Overview of Proteomic Analysis
To determine the possible regulatory network mediated by Sll0794, a quantitative iTRAQ-LC-MSMS proteomics approach was employed. For proteomic analysis, two independent cultivations for both the wild-type control and the Δsll0794 mutant were grown in BG11 medium supplemented with 1.5% ethanol, and cells were collected by centrifugation (8000 × g for 10 min at 4 °C) at exponential phase (i.e. 36 h) (Fig. 1), resulting two biological replicate samples for the wild-type control and the Δsll0794 mutant. The purified protein samples were subjected to the iTRAQ - LC-MS/MS proteomic analysis as described before (23). After data filtering to eliminate low-scoring spectra, the qualified spectra were matched to 1537 proteins, representing ∼43% of the 3569 predicted proteins in the Synechocystis genome (supplemental Table S2). All peptides identified and spectra annotated were provided for each protein in supplemental Table S3. Reproducibility of the quantitative proteomic analyses were accessed by two types of comparisons: first we labeled and mixed two biological replicates of either the wild type or the Δsl10794 mutant samples directly for proteomic analysis, the difference was plotted verse the percentage of the proteins identified, the results showed that ∼80% of the proteins with difference less than delta error of 0.2–0.25, and more than 95% of the proteins with difference less than delta error of 0.5 (Fig. 3A–3B); second we labeled and mixed each pair of the Δsll0794 mutant and the wild-type samples for proteomic analysis, the difference between different biological pairs was plotted in Fig. 3C–3D. The dispersion of the iTRAQ ratios of the quantified proteins was found with very similar trends between biological replicates, suggesting that the biological noise was reasonably low.
Fig. 3.

Reproducibility between biological replicates. Wild-type A, and Δsll0794 mutant B, respectively; Distribution of iTRAQ log ratios of the detected proteins between Δsll0794 biological replicate 1 and the wild-type C, and between Δsll0794 biological replicate 2 and the wild-type D.
Putative Ethanol-tolerance Network Regulated by Sll0794
Using a cutoff of 1.5-fold change and a statistical significance p value less than 0.05, we determined that between the wild-type Synechocystis and the Δsll0794 mutant grown under 1.5% ethanol, a total of 54 and 87 unique proteins were down-regulated and up-regulated, respectively. A subset of 12 genes encoding the Δsll0794-responsive proteins was selected for RT-qPCR validation. Among these genes, six were found up-regulated, and six were down-regulated by the sll0794 gene disruption according to the proteomic analysis. Although slightly greater changes were found based on the RT-qPCR analysis, an obvious positive correlation can still be detected between RT-qPCR and proteomic results for these genes (Table I), suggesting an overall good quality of the proteomic analysis.
Table I. Comparison of ratios calculated from iTRAQ proteomics and RT-PCR analyses.
| Gene ID | Proteomic ratioa | RT-PCR ratiob | Gene description |
|---|---|---|---|
| slr0869 | 1.631 ± 0.319 | 1.013 ± 0.093 | Hypothetical protein |
| sll1514 | 3.027 ± 1.305 | −1.249 ± 0.140 | HspA |
| slr0040 | 2.323 ± 0.148 | 1.933 ± 0.042 | 49-kDa membrane protein |
| sll1594 | 1.667 ± 0.417 | 2.031 ± 0.586 | Rubisco operon transcriptional regulator |
| ssl1784 | 1.536 ± 0.173 | 1.968 ± 0.040 | RpsO |
| sll1743 | 2.669 ± 0.412 | 1.367 ± 0.040 | L11 protein |
| sll0588 | −1.458 ± 0.289 | −1.454 ± 0.014 | Hypothetical protein |
| sll0781 | −1.415 ± 0.271 | −1.582 ± 0.325 | Hypothetical protein |
| slr1150 | −1.335 ± 0.239 | −1.742 ± 0.014 | Hypothetical protein |
| slr1533 | −1.597 ± 0.306 | −1.727 ± 0.148 | Hypothetical protein |
| slr1600 | −1.643 ± 0.300 | −1.48 ± 0.058 | Hypothetical protein |
| slr0809 | −1.737 ± 0.345 | −1.351 ± 0.314 | Putative dTDP-glucose 4–6-dehydratase |
a Four proteomic measurements used to calculate the average ratio and standard deviation.
b Each RT-PCR was repeated three times.
Proteins Down-regulated
The Δsll0794 mutant was grown poorly under 1.5% ethanol exposure when compared with the wild-type Synechocystis, suggesting that the sll0794 gene disruption may have decreased the expression of the proteins important to ethanol tolerance. Among 54 down-regulated proteins in the Δsll0794 mutant, only 28 were functionally annotated (Table II) (27), whereas the rest 26 were annotated as functionally unknown hypothetical proteins (supplemental Table S4). Compared with previous proteomic analysis of Synechocystis upon ethanol stress (23), a smaller number of proteins were found differentially regulated by ethanol in the Δsll0794 mutant, probably because of that the transcriptional regulator Sll0794 may have a relatively narrow range of targets with very specific and relevant function.
Table II. Proteins down-regulated in the Δsll0794 mutant upon ethanol treatment. Hypothetical proteins down-regulated provided in supplemental Table S3.
| Protein ID | Mutant_r1 vs. Control_r1 |
Mutant_r2 vs. Control_r1 |
Mutant_r1 vs. Control_r2 |
Mutant_r2 vs. Control_r2 |
Description | ||||
|---|---|---|---|---|---|---|---|---|---|
| Ratio | Sequence coverage | Ratio | Sequence coverage | Ratio | Sequence coverage | Ratio | Sequence coverage | ||
| Sll0080 | −1.517 | 45.5 | N-acetyl-gamma-glutamyl-phosphate reductase | ||||||
| Sll0135 | −1.544 | 29.1 | Putative 5′-methylthioadenosine phosphorylase | ||||||
| Sll0204 | −1.585 | 11.8 | Glucose inhibited division protein | ||||||
| Sll0273 | −1.607 | 5.2 | Na+/H+ antiporter | ||||||
| Sll0554 | −1.995 | 16.9 | Ferredoxin-thioredoxin reductase, catalytic chain | ||||||
| Sll0643 | −1.676 | 19.9 | Urease accessory protein G | ||||||
| Sll0853 | −1.51 | 35.5 | Chromophore lyase CpcS/CpeS 1; | ||||||
| Sll0858 | −1.785 | 15.2 | Zinc resistance-associated protein | ||||||
| Sll1127 | −1.52 | 21.8 | 1,4-dihydroxy-2-naphthoate synthase | ||||||
| Sll1283 | −2.112 | 13.3 | Similar to stage II sporulation protein D | ||||||
| Sll1750 | −1.56 | 20.9 | Urease alpha subunit | ||||||
| Sll1871 | −1.861 | 7 | HepK two-component system histidine kinase | ||||||
| Sll1980 | −1.951 | 15 | Thiol:disulfide interchange protein TrxA | ||||||
| Slr0064 | −1.541 | 7.3 | Putative RNA methyltransferase slr0064; | ||||||
| Slr0080 | −2.006 | 24.8 | Ribonuclease H | ||||||
| Slr0115 | −1.581 | 26.1 | Response regulator | ||||||
| Slr0288 | −1.566 | 23.5 | Glutamate–ammonia ligase | ||||||
| Slr0646 | −2.215 | 8 | Probable d-alanyl-d-alanine carboxypeptidase | ||||||
| Slr0649 | −1.544 | 26.9 | Methionyl-tRNA synthetase | ||||||
| Slr0783 | −1.783 | 31.8 | Triosephosphate isomerase | ||||||
| Slr0809 | −2.097 | 27.1 | −1.597 | 27.1 | dTDP-glucose 4,6-dehydratase | ||||
| Slr0889 | −1.513 | 7.1 | ABC transporter, putative | ||||||
| Slr0984 | −1.769 | 15.3 | CDP-glucose 4,6-dehydratase | ||||||
| Slr1490 | −1.746 | 1.2 | −1.983 | 1.2 | Ferrichrome-iron receptor | ||||
| Slr1718 | −1.64 | 33.2 | Probable 2-phosphosulfolactate phosphatase | ||||||
| Slr1829 | −1.521 | 25.9 | Putative poly(3-hydroxyalkanoate) synthase | ||||||
| Ssl2296 | −1.954 | 77.1 | −1.72 | 77.1 | Pterin-4a-carbinolamine dehydratase | ||||
| Ssr2061 | −1.628 | 55.7 | Glutaredoxin | ||||||
Among the proteins down-regulated, five that were reported previously related to resistance to environmental stresses: Sll0858 of a zinc resistance-associated protein, Ssr2061 of a glutaredoxin, Sll0273 of a Na+/H+ antiporter, Slr1829 of a putative poly(3-hydroxyalkanoate) synthase and Sll1980 of thiol/disulfide interchange protein TrxA, were found down-regulated in the Δsll0794 mutant (Table II). Early study revealed that sll0794 gene is located within a cluster involved in sensing and tolerance of Ni2+, Co2+, and Zn2+ in Synechocystis (44), so it is not surprising that Sll0858 of a zinc resistance-associated protein was down-regulated in the mutant. Glutaredoxins are small ubiquitous glutathione-disulfide oxidoreductases that reduce disulfide bonds of target proteins and maintain the redox homoeostasis of Synechocystis cells, and disruption of a glutaredoxin coding gene ssr2061 in Synechocystis has been reported with reduced cell viability against oxidative stress (47). The sll0273 gene encoding a putative Na+/H+ antiporter was found essential for growth at low Na+/K+ ratios (48), and its mutant showed low tolerance to elevated pH in the BG11 medium (49). In our previous study, we found that the slr1829 gene encoding a putative poly(3-hydroxyalkanoate) synthase was inducted by butanol, and the enhanced production of carbon storage compound polyhydroxyalkanoates (PHAs) was one important mechanism for Synechocystis to combat against butanol stress (50). The down-regulation of the same Slr1829 in the Δsll0794 mutant confirmed the previous results that the PHA synthesis could be important for the protection of ethanol toxicity in Synechocystis. Cyanobacterial thioredoxins (Trx) constitute a family of redox-active enzymes that catalyze the reduction of a variety of target enzymes, including peroxiredoxins, by disulfide/dithiol exchange. The Synechocystis genome contains several Trx, among which TrxA (slr0623) was found to be essential, whereas others, such as TrxQ, may be important in peroxide tolerance (51). Although exact function of Sll1980 (TrxA) in either cell survival or detoxification has not been fully defined, its involvement in ethanol tolerance may worth further investigation.
Interestingly, two proteins involved in urea metabolism, Sll0643 of a urease accessory protein G and Sll1750 of a urease alpha subunit were down-regulated in the Δsll0794 mutant (Table II). A previous proteomic study revealed that a common stress response of Synechocystis under various environmental stress conditions was the activation of atypical pathways for the acquisition of carbon and nitrogen from urea and arginine, as evidenced by the significant up-regulation of urease that converts urea into CO2 and ammonia, under most conditions (52), and our recent metabolomic analysis of Synechocystis under butanol stress showed that increasing concentration of urea was detected (50). The finding of down-regulation of Sll0643 and Sll1750 was consistent with these early results, suggesting that down-regulation of the urea metabolism proteins may be related to the decreased ethanol tolerance in the Δsll0794 mutant.
Slr0646 of a probable d-alanyl-d-alanine carboxypeptidase was down-regulated in the Δsll0794 mutant. The enzyme catalyzes the cross-links the peptidoglycan chains to form rigid cell walls, and a previous study has found that a single transposon insertion of Tn5-B21 in d-alanyl-d-alanine carboxypeptidase gene resulted in the altered tolerance to both ionic and osmotic stresses in a Ochrobactrum sp. strain (53). Two proteins related to bacterial two-component signal transduction, Sll1871 of a HepK two-component system sensory histidine kinase and Slr0115 of a response regulator, were down-regulated in the Δsll0794 mutant. In the previous study, it has been found that Slr0115 regulates the accumulation of the monomeric photosystem I and the D1 protein under high light stress conditions (54).
Proteins Up-regulated
Among 87 up-regulated proteins in the Δsll0794 mutant, 62 were functionally annotated (Table III), whereas the rest 25 were annotated as functionally unknown hypothetical proteins (supplemental Table S4). Detailed analysis of the up-regulated proteins showed a typical metabolic response similar to that of Synechocystis under various environmental stresses (52): (1) although the Δsll0794 mutant was grown poorly under 1.5% ethanol compared with the wild type, significant up-regulation of proteins involved protein biosynthesis and fate was observed, including 18 ribosomal proteins, a 16S rRNA processing protein RimM homolog (Ssr0808), an initiation factor IF-1 (Ssl3441), and two periplasmic protease HhoA (Sll1097, Sll1679) involved in house-keeping processes related to protein (re)folding, protein clearance and signaling (52, 55); (2) up-regulation of nine proteins involved in energy metabolism, including NADH dehydrogenase subunit 2 (Sll0223), putative thioredoxin-m (Sll0685), iron-sulfur cluster binding protein homolog (Slr2059), probable ferredoxin (Ssl3044) and heme oxygenase (Sll1184), citrate synthase (Sll0401) and succinyl-CoA synthetase alpha chain (Sll1557) of TCA cycle, photosystem I assembly related protein (Sll0226) and carbon dioxide concentrating mechanism protein CcmK homolog 3 (Slr1838) of photosynthesis and carbon fixation, and two bicarbonate transporters (Slr0040, Slr1512). Up-regulated of protein biosynthesis and energy metabolism are consistent with previous proteomic analysis of Synechocystis under various environmental stresses (51); (3) strong up-regulation in all replicates of 16.6 kDa small heat shock protein (Hsp17), which was involved in membrane fluidity of Synechocystis under stress conditions (56). A hsp17 homologous gene was also found inducible by ethanol in Leuconostoc oenos (57); (4) up-regulation of 12 regulatory proteins, most of which were found responsive to stress conditions, such as two group 2 sigma factor (Sll0184, Sll0306) (SigC, SigB) involved in acclimation to low inorganic carbon at high temperature and salt acclimation responses (58, 59), two-component sensor histidine kinase Sll0698 responsive to low temperature, antisigma B factor antagonist Slr1856 whose predicted product resembles the stress-responsive protein kinase SpoIIAA in Bacillus subtilis (60, 61). Although the functions are still unknown, it worth noting that Slll1672 and Sll1673 of a two-component hybrid sensor and regulator, and a response regulator were both up-regulated in our experiments, implying their possible functions in ethanol response in the Δsll0794 mutant.
Table III. Proteins up-regulated in the Δsll0794 mutant upon ethanol treatment. Hypothetical proteins up-regulated provided in supplemental Table S3.
| Protein ID | Mutant_r1 vs. Control_r1 |
Mutant_r2 vs. Control_r1 |
Mutant_r1 vs. Control_r2 |
Mutant_r2 vs. Control_r2 |
Description | ||||
|---|---|---|---|---|---|---|---|---|---|
| Ratio | Sequence coverage | Ratio | Sequence coverage | Ratio | Sequence coverage | Ratio | Sequence coverage | ||
| Sll0016 | 1.58 | 9.7 | Probable membrane-bound lytic transglycosylase A | ||||||
| Sll0184 | 1.61 | 18.6 | Group 2 RNA polymerase sigma factor SigC | ||||||
| Sll0223 | 2.08 | 1.8 | NADH dehydrogenase subunit 2 | ||||||
| Sll0226 | 1.62 | 17.1 | Photosystem I assembly related protein | ||||||
| Sll0244 | 1.94 | 10.4 | UDP-glucose 4-epimerase | ||||||
| Sll0306 | 1.61 | 8.9 | Group 2 RNA polymerase sigma factor | ||||||
| Sll0401 | 1.62 | 25.9 | Citrate synthase | ||||||
| Sll0489 | 1.86 | 8.5 | ATP-binding protein of ABC transporter | ||||||
| Sll0513 | 1.58 | 11.9 | 1.80 | 11.9 | Farnesyl-diphosphate farnesyltransferase synthetase | ||||
| Sll0574 | 1.75 | 5 | Probable permease protein of lipopolysaccharide ABC transporter | ||||||
| Sll0685 | 1.79 | 14.2 | 2.06 | 14.2 | Thioredoxin-m, putative | ||||
| Sll0698 | 1.92 | 6.8 | Two-component sensor histidine kinase | ||||||
| Sll0721 | 1.80 | 1.7 | S-layer-RTX protein-related | ||||||
| Sll0779 | 1.56 | 1.4 | Utilizing regulatory protein tutC | ||||||
| Sll0895 | 1.68 | 15.5 | CysQ protein homolog | ||||||
| Sll0921 | 1.64 | 13.1 | Two-component response regulator NarL subfamily | ||||||
| Sll1097 | 1.72 | 34.6 | Periplasmic protease HhoA | ||||||
| Sll1143 | 1.56 | 19.1 | 1.56 | 19.1 | ATP-dependent helicase PcrA | ||||
| Sll1184 | 1.51 | 53.8 | Heme oxygenase | ||||||
| Sll1514 | 4.76 | 45.9 | 3.26 | 45.9 | 2.28 | 45.9 | 2.14 | 45.9 | 16.6 kDa small heat shock protein Hsp17 |
| Sll1557 | 1.63 | 25.8 | Succinyl-CoA synthetase alpha chain | ||||||
| Sll1594 | 1.99 | 35.8 | 1.78 | 35.8 | 1.85 | 35.8 | 1.79 | 35.8 | ndhF3 operon transcriptional regulator |
| Sll1672 | 1.66 | 10.3 | Two-component hybrid sensor and regulator | ||||||
| Sll1673 | 1.51 | 15 | Two-component response regulator | ||||||
| Sll1679 | 1.64 | 31.7 | 1.82 | 31.7 | Periplasmic protease HhoA | ||||
| Sll1743 | 2.54 | 39.7 | 2.68 | 39.7 | 50S ribosomal protein L11 | ||||
| Sll1744 | 1.61 | 52.5 | 1.52 | 52.5 | 50S ribosomal protein L1 | ||||
| Sll1802 | 1.89 | 24.6 | 50S ribosomal protein L2 | ||||||
| Sll1809 | 1.98 | 48.9 | 30S ribosomal protein S8 | ||||||
| Sll1810 | 2.25 | 47.5 | 1.57 | 47.5 | 50S ribosomal protein L6 | ||||
| Sll1817 | 2.19 | 61.5 | 30S ribosomal protein S11 | ||||||
| Sll1819 | 1.99 | 36.2 | 50S ribosomal protein L17 | ||||||
| Sll1822 | 1.50 | 57.7 | 30S ribosomal protein S9 | ||||||
| Slr0040 | 2.35 | 53.5 | 2.12 | 53.5 | 2.44 | 53.5 | Bicarbonate transport system substrate-binding protein | ||
| Slr0260 | 1.55 | 14.2 | Cob(I)alamin adenosyltransferase | ||||||
| Slr0298 | 1.68 | 13.8 | 1.51 | 13.8 | 1.57 | 13.8 | FraH protein homolog | ||
| Slr0469 | 1.56 | 33.2 | 1.87 | 33.2 | 30S ribosomal protein S4 | ||||
| Slr0626 | 1.58 | 18.1 | Probable glycosyltransferase | ||||||
| Slr0628 | 1.79 | 13 | 1.65 | 13 | 30S ribosomal protein S14 | ||||
| Slr0653 | 1.70 | 21.9 | Principal RNA polymerase sigma factor SigA | ||||||
| Slr0808 | 1.93 | 37.3 | 16S rRNA processing protein RimM homolog | ||||||
| Slr1024 | 1.61 | 15.5 | Fibrillin | ||||||
| Slr1299 | 1.50 | 8.2 | UDP-glucose dehydrogenase | ||||||
| Slr1324 | 1.89 | 15.2 | Two-component hybrid sensor and regulator | ||||||
| Slr1364 | 1.76 | 16.6 | Biotin synthetase | ||||||
| Slr1512 | 2.11 | 19.5 | 2.58 | 19.5 | Sodium-dependent bicarbonate transporter | ||||
| Slr1597 | 2.88 | 12.1 | Chromosome partitioning ATPase, ParA family | ||||||
| Slr1727 | 2.31 | 8.5 | Na+/H+ antiporter | ||||||
| Slr1838 | 1.61 | 29.1 | Carbon dioxide concentrating mechanism protein CcmK homolog 3 | ||||||
| Slr1856 | 1.53 | 34.9 | Anti-sigma B factor antagonist | ||||||
| Slr1974 | 1.55 | 26.1 | GTP binding protein | ||||||
| Slr2041 | 2.00 | 7.1 | 1.94 | 7.1 | Probable two-component response regulator | ||||
| Slr2059 | 1.75 | 7.5 | 1.74 | 7.5 | 1.71 | 7.5 | 1.58 | 7.5 | Iron-sulfur cluster binding protein homolog |
| Ssl1426 | 1.63 | 19.4 | 50S ribosomal protein L35 | ||||||
| Ssl1784 | 1.52 | 40.4 | 1.73 | 40.4 | 1.55 | 40.4 | 30S ribosomal protein S15 | ||
| Ssl3044 | 1.60 | 11.1 | probable ferredoxin | ||||||
| Ssl3432 | 1.69 | 27.2 | 1.60 | 27.2 | 30S ribosomal protein S19 | ||||
| Ssl3441 | 1.73 | 40 | Initiation factor IF-1 | ||||||
| Ssl3445 | 1.74 | 13.6 | 50S ribosomal protein L31 | ||||||
| Ssr0482 | 1.78 | 39 | 30S ribosomal protein S16 | ||||||
| Ssr1604 | 1.79 | 33.3 | 1.83 | 33.3 | 50S ribosomal protein L28 | ||||
| Ssr2799 | 2.26 | 44.8 | 1.98 | 44.8 | 50S ribosomal protein L27 | ||||
Modification of cell envelope represents an important mechanism against stress in various microbes (62–64). In the Δsll0794 mutant grown under ethanol stress, three proteins involved in cell envelope, Slr0298 of a FraH protein homolog, Sll0016 of a probable membrane-bound lytic transglycosylase A, and Sll0721 of an S-layer-RTX protein-related, were up-regulated (Table III). Previous studies found that Fra protein influenced filament integrity, diazotrophy and localization of septal protein SepJ in the heterocyst-forming Anabaena (65), lytic transglycosylases involved in cell wall turnover in Salmonella enterica (66), and S-layer-RTX protein (Sll0721) induced by ethanol stress in Synechocystis (23).
Identification of the Direct Regulatory Targets of Sll0794
To identify the direct targets of Sll0794 transcriptional regulator, we conducted an EMSA analysis using the purified His6-Sll0794 and putative promoter regions of 12 coding genes whose corresponding proteins were differentially regulated in the Δsll0794 mutant grown under ethanol stress (Table II, III). The sll0794 gene was expressed in E. coli and his-tagged protein was purified to >90% pure as judged by SDS-PAGE (Fig. 4A). These putative gene targets were selected based on the following considerations: highly responsive in the mutant with large fold changes or responsive in most of the replicate proteomic measurements; clues that homologous genes were involved in stress responses, and large intergenic region (>100 bp) before the open reading frames with the high possibility of an independent promoter. The six genes encoding down-regulated proteins selected for EMSA investigation were sll0273 of a Na+/H+ antiporter, sll0643 of a urease accessory protein G, sll1871 of HepK two-component system histidine kinase, slr0115 of response regulator, slr1829 of a putative poly(3-hydroxyalkanoate) synthase, and ssr2061 of glutaredoxin; and the six genes encoding up-regulated proteins selected for EMSA investigation were sll0685 of putative thioredoxin, sll1514 of a 16.6 kDa small heat shock protein (Hsp17), slr0040 of a bicarbonate transport system substrate-binding protein, slr0808 of 16S rRNA processing protein RimM homolog, slr1512 of putative sodium-dependent bicarbonate transporter, and slr1838 of carbon dioxide concentrating mechanism protein CcmK homolog 3. In the EMSAs, probes containing the corresponding upstream regions of selected genes were PCR amplified and labeled for binding evaluation (supplemental Table S1). As shown in Fig. 4B, clear gel-shift pattern of the purified His6-Sll0794 protein was observed for sll1514, slr1512, and slr1838, whereas no direct binding was observed for the rest of the nine genes under the testing condition (i.e. sll0273, sll0643, sll1871, slr0115, slr1829, ssr2061, sll0685, slr0040, and slr0808), nonbinding of His6-Sll0794 protein and putative promoter of ssr2061 was presented as a negative control in Fig. 4B. All three genes showing possible binding with His6-Sll0794 were up-regulated in the Δsll0794 mutant grown under ethanol stress, suggesting that the Sll0794 transcriptional regulator could function negatively on the expression of these target genes.
Fig. 4.
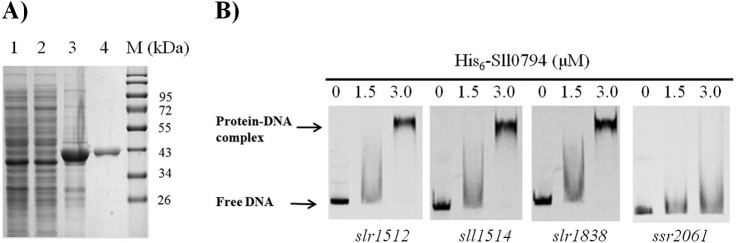
EMSAs to assess the interaction of the transcriptional regulator Sll0794 with putative promoter regions of selective target genes. A, SDS-PAGE analysis of expression and purification of His6-Sll0794 in E. coli. Lane1: the crude extract of E. coli BL21 (DE3) harboring pET46–0794 without being induced by IPTG; Lanes 2 and 3: the supernatant and the precipitate fractions of E. coli BL21(DE3) harboring pET46–0794 induced by IPTG at a final concentration of 0.2 mm at 18 °C overnight; Lane 4: the purified His6-Sll0794 protein; Lane M: protein markers. B, EMSAs of the promoter regions of ssr2061, slr1512, sll1514, and slr1838 with purified His6-Sll0794. The amounts of His6-Sll0794 (μm) used were as indicated and 10 ng each of 5′-cy5-labeled probes was added in each of the EMSAs reactions. The results for other eight probes investigated in this study were with the same patterns as ssr2061 and thus not presented.
Among the possible targets regulated by Sll0794, small heat shock protein encoding gene sll1514 was previously found involved in response to many stress conditions, such as osmostress (67), salt (68), acid (69), ethanol (23), and butanol stress (70). It was believed that the small heat protein can prevent irreversible protein aggregation and to facilitate subsequent protein renaturation in cooperation with ATP-dependent chaperones (71). The biochemical study using both immunoprecipitation and affinity chromatography has found that the Sll1514 protein can potentially interact with at least 42 different proteins in vivo specifically during heat treatment, suggesting its diverse cellular functions (70). In addition, early studies have found that sll1514 was under direct regulation by a histidine kinase, Hik34, for its roles in salt responses (67); and exhibited substantially higher expression in the ΔHik31 mutant than the wild-type strain under both aerobic and low oxygen conditions (72). However, its regulation by transcriptional regulator was not reported before in Synechocystis.
Early studies have found that Synechocystis possesses four modes of inducible inorganic carbon uptake mechanisms (i.e. ndhF, sbtA, cmp, and ccm systems) (73). The first mechanism involves NADPH dehydrogenase (NDH-1) complexes that are crucial for dark respiration and cyclic electron transport. The gene cluster ndhF3-ndhD3-orf427 was first identified in Synechococcus PCC7002 as being necessary for inducible, high-affinity CO2 uptake (73, 74); and then was shown to be essential for inducible, high-affinity CO2 uptake in Synechocystis (73, 75, 76). The transcription of the ndh operon was regulated by a transcriptional regulator ndhR under low inorganic carbon condition in Synechocystis (77). The second mechanism involves sbtA gene (slr1512) encoding a putative sodium-dependent bicarbonate transporter (78). Early study found that slr1512 was essential to Na+-dependent HCO3− transport and may play a crucial role in carbon acquisition when CO2 supply is limited, the Δslr1512 mutant was unable to take up HCO3− and grow in low CO2 at pH 9.0 (78); however, its regulation mechanism is unknown. The third mechanism also involves a HCO3− transport system, the cmp operon, which was shown to be low CO2 inducible, and under regulation by a LysR family transcriptional regulator CmpR (79). The forth mechanism involves CO2-concentrating mechanism (CCM) that is maximally expressed under inorganic carbon limitation (79), which functions to elevate the intracellular concentration of CO2 in the vicinity of Rubisco to compensate for the poor kinetic efficiency of this enzyme (79–82). In green alga Chlamydomonas reinhardtii, CCM mechanism was regulated by a nuclear regulatory gene, Ccm1, encoding a hydrophilic protein of 699 amino acids with a putative zinc-finger motif in its N-terminal region and a Gln repeat characteristic of transcriptional activators (82). Interestingly, two other putative targets of Sll0794 identified by EMSAs, slr1512 (sbtA) and slr1838 encoding a carbon dioxide concentrating mechanism protein CcmK, are the key components of the second and the forth CO2 acquisition mechanisms, respectively (Fig. 4B), suggesting that the CO2 acquisition/transport could be related to ethanol tolerance in Synechocystis, and their expression could be regulated directly by transcriptional regulator Sll0794.
To further define the possible DNA-binding motifs related to Sll0794, we performed a promoter DNA-binding motif searching using 500 bp sequences extracted from upstream region of the up-regulated genes including sll1514, slr1512, and slr1838 using both the Gibbs Motif Sampler and the MEME software (33–35). Three top conversed motifs containing 12–15 total sites were identified (Fig. 5) (37). The results showed that the motif 1 “XGGCGATCGCCX” was identified upstream of all three putative target genes, whereas motif 2 was found only upstream of gene sll1514 and slr1512, and motif 3 found only upstream of gene slr1838, respectively. Whereas it is speculative that these motifs could be involved in regulation of ethanol tolerance in Synechocystis, further experimental verification of their functionality is still needed.
Fig. 5.

Visualization of putative Sll0794 binding motifs. The motif is represented by a sequence logo generated by the WebLogos software (37).
CONCLUSIONS
To improve biofuel tolerance, increasing studies have recently been conducted targeting regulatory genes rather than metabolic genes in the pathways in various native or nonnative biofuel-producing microorganisms, and such efforts have led to a conclusion that manipulation of regulatory genes could provide a practical alternative for strain improvement (11–13). Meanwhile recent metabolic engineering and synthetic biology studies of photosynthetic cyanobacteria demonstrated that this group of bacteria could be an attractive “microbial cell factory” to produce the third-generation carbon-neutral biofuels or other bioproducts directly from solar energy and CO2 (17, 18, 20, 21). However, currently very little is known about the regulatory systems involved in biofuel production and tolerance in cyanobacteria; to address the issue, in this study we constructed gene disruption mutants for selected regulatory genes that were found responsive to exogenous ethanol treatments in Synechocystis (23, 24), and performed comparative tolerance analysis of the mutants and the wild-type strains. The efforts led to the identification of a transcriptional regulator Sll0794 that was involved in ethanol tolerance in Synechocystis. Using a quantitative iTRAQ-LC-MS/MS proteomics approach coupled with quantitative RT-qPCR and EMSAs, we further determined the possible regulatory network of Sll0794 and identified three gene targets that may be under direct control of Sll0794. As the first regulatory protein discovered so far that was related to ethanol tolerance in Synechocystis, the gene can be used as target for transcription machinery engineering approach in order to improve ethanol tolerance and productivity.
Supplementary Material
Acknowledgments
We thank Mr. Guangsheng Pei for his help with deposition of the raw proteomic data. We would also like to thank the PRIDE team for the deposition of our data to the ProteomeXchange Consortium, and Dr. Peter Baker of USCF for helps with data uploading into the MS viewer website.
Footnotes
Author contributions: L.C., J.W., Y.L., W.J., and W.Z. designed research; Z.S., L.C., J.W., Y.L., W.J., and W.Z. performed research; Z.S., L.C., J.W., Y.L., W.J., and W.Z. contributed new reagents or analytic tools; Z.S., L.C., J.W., Y.L., W.J., and W.Z. analyzed data; L.C., J.W., W.J., and W.Z. wrote the paper.
* The research was supported by grants from the National Basic Research Program of China (National “973” program) (No. 2011CBA00800), the National High-tech R&D Program (National “863” program) (No. 2012AA02A707), and the Tianjin Municipal Science and Technology Commission (No. 12HZGJHZ01000).
 This article contains supplemental Tables S1 to S4.
1 The abbreviations used are:
- CCM
- CO2-concentrating mechanism
- EMSAs
- electrophoretic mobility shift assays
- FACS
- fluorescence-activated cell sorting
- HPLC
- high-performance liquid chromatography
- IPTG
- Isopropyl β-D-1-thiogalactopyranoside
- iTRAQ
- Isobaric tag for relative and absolute quantitation
- LC-MS
- Liquid chromatography-tandem mass spectrometry
- MS
- mass spectrometry
- PCR
- polymerase chain reaction
- RT-qPCR
- quantitative real-time reverse transcription-PCR
- SDS-PAGE
- sodium dodecyl sulfate polyacrylamide gel electrophoresis
- TBE
- Tris/Borate/EDTA
- TCA
- tricarboxylic acid
- FSC
- forward scatter
- SSC
- side scatter.
REFERENCES
- 1. Antoni D., Zverlov V. V., Schwarz W. H. (2007) Biofuels from microbes. Appl. Microbiol. Biotechnol. 77, 23–35 [DOI] [PubMed] [Google Scholar]
- 2. Renewable Fuels Association (2012) “Acelerating Industry Innovation – 2012 Ethanol Industry Outlook.” Renewable Fuels Association. pp. 3, 8,, 10,, 22,, and 23 [Google Scholar]
- 3. Dunlop M. J. (2011) Engineering microbes for tolerance to next-generation biofuels. Biotechnol. Biofuels 4, 32. [DOI] [PMC free article] [PubMed] [Google Scholar]
- 4. Shao X., Raman B., Zhu M., Mielenz J. R., Brown S. D., Guss A. M., Lynd L. R. (2011) Mutant selection and phenotypic and genetic characterization of ethanol-tolerant strains of Clostridium thermocellum. Appl. Microbiol. Biotechnol. 92, 641–652 [DOI] [PubMed] [Google Scholar]
- 5. Kim H. S., Kim N. R., Yang J., Choi W. (2011) Identification of novel genes responsible for ethanol and/or thermotolerance by transposon mutagenesis in Saccharomyces cerevisiae. Appl. Microbiol. Biotechnol. 91, 1159–1172 [DOI] [PubMed] [Google Scholar]
- 6. Abe H., Fujita Y., Takaoka Y., Kurita E., Yano S., Tanaka N., Nakayama K. (2009) Ethanol-tolerant Saccharomyces cerevisiae strains isolated under selective conditions by over-expression of a proofreading-deficient DNA polymerase delta. J. Biosci. Bioeng. 108, 199–204 [DOI] [PubMed] [Google Scholar]
- 7. Yang J., Bae J. Y., Lee Y. M., Kwon H., Moon H. Y., Kang H. A., Yee S. B., Kim W., Choi W. (2011) Construction of Saccharomyces cerevisiae strains with enhanced ethanol tolerance by mutagenesis of the TATA-binding protein gene and identification of novel genes associated with ethanol tolerance. Biotechnol. Bioeng. 108, 1776–1787 [DOI] [PubMed] [Google Scholar]
- 8. Park A. H., Sugiyama M., Harashima S., Kim Y. H. (2012) Creation of an ethanol-tolerant yeast strain by genome reconstruction based on chromosome splitting technology. J. Microbiol. Biotechnol. 22, 184–189 [DOI] [PubMed] [Google Scholar]
- 9. Brynildsen M. P., Liao J. C. (2009) An integrated network approach identifies the isobutanol response network of Escherichia coli. Mol. Syst. Biol. 5, 277. [DOI] [PMC free article] [PubMed] [Google Scholar]
- 10. Rutherford B. J., Dahl R. H., Price R. E., Szmidt H. L., Benke P. I., Mukhopadhyay A., Keasling J. D. (2010) Functional genomic study of exogenous n-butanol stress in Escherichia coli. Appl. Environ. Microbiol. 76, 1935–1945 [DOI] [PMC free article] [PubMed] [Google Scholar]
- 11. Alper H., Stephanopoulos G. (2007) Global transcription machinery engineering: A new approach for improving cellular phenotype. Metab. Eng. 9, 258–267 [DOI] [PubMed] [Google Scholar]
- 12. Petranovic D., Vemuri G. N. (2009) Impact of yeast systems biology on industrial biotechnology. J. Biotechnol. 144, 204–211 [DOI] [PubMed] [Google Scholar]
- 13. Alper H., Moxley J., Nevoigt E., Fink G. R., Stephanopoulos G. (2006) Engineering yeast transcription machinery for improved ethanol tolerance and production. Science 314, 1565–1568 [DOI] [PubMed] [Google Scholar]
- 14. Teixeira M. C., Raposo L. R., Mira N. P., Lourenço A. B., Sá-Correia I. (2009) Genome-wide identification of Saccharomyces cerevisiae genes required for maximal tolerance to ethanol. Appl. Environ. Microbiol. 75, 5761–5772 [DOI] [PMC free article] [PubMed] [Google Scholar]
- 15. Chen T., Wang J., Yang R., Li J., Lin M., Lin Z. (2011) Laboratory-evolved mutants of an exogenous global regulator, IrrE from Deinococcus radiodurans, enhance stress tolerances of Escherichia coli. PLoS One 6, 16228. [DOI] [PMC free article] [PubMed] [Google Scholar]
- 16. Chong H., Huang L., Yeow J., Wang I., Zhang H., Song H., Jiang R. (2013) Improving Ethanol Tolerance of Escherichia coli by Rewiring Its Global Regulator cAMP Receptor Protein (CRP). PLoS One 8, 57628. [DOI] [PMC free article] [PubMed] [Google Scholar]
- 17. Tyo K. E., Alper H. S., Stephanopoulos G. N. (2007) Expanding the metabolic engineering toolbox: more options to engineer cells. Trends Biotechnol. 25, 132–137 [DOI] [PubMed] [Google Scholar]
- 18. Wang B., Wang J., Zhang W., Meldrum D. R. (2012) Application of synthetic biology in cyanobacteria and algae. Front. Microbiol. 3, 344. [DOI] [PMC free article] [PubMed] [Google Scholar]
- 19. Deng M., Coleman J. (1999) Ethanol synthesis by genetic engineering in cyanobacteria. Appl. Environ. Microbiol. 65, 523–528 [DOI] [PMC free article] [PubMed] [Google Scholar]
- 20. Fu P. (2009) Genome-scale modeling of Synechocystis sp. PCC 6803 and prediction of pathway insertion. J. Chem. Technol. Biotechnol. 84, 473–483 [Google Scholar]
- 21. Gao Z., Zhao H., Li Z. M., Tan X. M., Lu X. F. (2012) Photosynthetic production of ethanol from carbon dioxide in genetically engineered cyanobacteria. Energy Environ. Sci. 5, 9857–9865 [Google Scholar]
- 22. Ducat D. C., Way J. C., Silver P. A. (2011) Engineering cyanobacteria to generate high-value products. Trends Biotechnol. 29, 95–103 [DOI] [PubMed] [Google Scholar]
- 23. Qiao J., Wang J., Chen L., Tian X., Huang S., Ren X., Zhang W. (2012) Quantitative iTRAQ LC-MS/MS proteomics reveals metabolic responses to biofuel ethanol in cyanobacterial Synechocystis sp. PCC 6803. J. Proteome Res. 11, 5286–5300 [DOI] [PubMed] [Google Scholar]
- 24. Wang J., Chen L., Huang S., Liu J., Ren X., Tian X., Qiao J., Zhang W. (2012) RNA-seq based identification and mutant validation of gene targets related to ethanol resistance in cyanobacterial Synechocystis sp. PCC 6803. Biotechnol. Biofuels 5, 89. [DOI] [PMC free article] [PubMed] [Google Scholar]
- 25. Salis H., Tamsir A., Voigt C. (2009) Engineering bacterial signals and sensors. Contrib. Microbiol. 16, 194–225 [DOI] [PubMed] [Google Scholar]
- 26. Wang H. L., Postier B. L., Burnap R. L. (2002) Optimization of fusion PCR for in vitro construction of gene knockout fragments. BioTechniques 33, 26, 28,, 30 [DOI] [PubMed] [Google Scholar]
- 27. Kaneko T., Nakamura Y., Sasamoto S., Watanabe A., Kohara M., Matsumoto M., Shimpo S., Yamada M., Tabata S. (2003) Structural analysis of four large plasmids harboring in a unicellular cyanobacterium, Synechocystis sp. PCC 6803. DNA Res. 10, 221–228 [DOI] [PubMed] [Google Scholar]
- 28. Kloft N., Rasch G., Forchhammer K. (2005) Protein phosphatase PphA from Synechocystis sp. PCC 6803: the physiological framework of PII-P dephosphorylation. Microbiology 151, 1275–1283 [DOI] [PubMed] [Google Scholar]
- 29. Vizcaíno J. A., Deutsch E. W., Wang R., Csordas A., Reisinger F., Ríos D., Dianes J. A., Sun Z., Farrah T., Bandeira N., Binz P. A., Xenarios I., Eisenacher M., Mayer G., Gatto L., Campos A., Chalkley R. J., Kraus H. J., Albar J. P., Martinez-Bartolomé S., Apweiler R., Omenn G. S., Martens L., Jones A. R., Hermjakob H. (2014) ProteomeXchange provides globally co-ordinated proteomics data submission and dissemination. Nat. Biotechnol. 30, 223–226 [DOI] [PMC free article] [PubMed] [Google Scholar]
- 30. Vizcaino J. A., Cote R. G., Csordas A., Dianes J. A., Fabregat A., Foster J. M., Griss J., Alpi E., Birim M., Contell J., O'Kelly G., Schoenegger A., Ovelleiro D., Perez-Riverol Y., Reisinger F., Rios D., Wang R., Hermjakob H. (2013) The Proteomics Identifications (PRIDE) database and associated tools: status in 2013. Nucleic Acids Res. 41, D1063–D1069 [DOI] [PMC free article] [PubMed] [Google Scholar]
- 31. Yu Z., Lu Y. H., Zhu H., Dang F., Zhang W. W., Qin Z. J., Yang S., Tan H. R., Jiang W. H. (2012) Differential regulation of antibiotic biosynthesis by DraR-K, a novel two-component system in Streptomyces coelicolor. Mol. Microbiol. 85, 535–556 [DOI] [PubMed] [Google Scholar]
- 32. Tiffert Y., Supra P., Wurm R., Wohlleben W., Wagner R., Reuther J. (2008) The Streptomyces coelicolor GlnR regulon: identification of new GlnR targets and evidence for a central role of GlnR in nitrogen metabolism in actinomycetes. Mol. Microbiol. 67, 861–880 [DOI] [PubMed] [Google Scholar]
- 33. Lawrence C. E., Altschul S. F., Bogouski M. S., Liu J. S., Neuwald A. F., Wooten J. C. (1993) Detecting subtle sequence signals: a Gibbs Sampling Strategy for multiple alignment. Science 262, 208–214 [DOI] [PubMed] [Google Scholar]
- 34. Thompson W., Rouchka E. C., Lawrence C. E. (2003) Gibbs recursive sampler: Finding transcription factor binding sites. Nucleic Acids Res. 31, 3580–3585 [DOI] [PMC free article] [PubMed] [Google Scholar]
- 35. Bailey T. L., Boden M., Buske F. A., Frith M., Grant C. E., Clementi L., Ren J., Li W. W., Noble W. S. (2009) MEME SUITE: tools for motif discovery and searching. Nucleic Acids Res. 37, W202–W208 [DOI] [PMC free article] [PubMed] [Google Scholar]
- 36. Helden J. (2003) Regulatory sequence analysis tools. Nucleic Acids Res. 31, 3593–3596 [DOI] [PMC free article] [PubMed] [Google Scholar]
- 37. Crooks G. E., Hon G., Chandonia J. M., Brenner S. E. (2004) WebLogo: a sequence logo generator. Genome Res. 14, 1188–1190 [DOI] [PMC free article] [PubMed] [Google Scholar]
- 38. Muro-Pastor A. M., Herrero A., Flores E. (2001) Nitrogen-regulated group 2 sigma factor from Synechocystis sp. strain PCC 6803 involved in survival under nitrogen stress. J. Bacteriol. 183, 1090–1095 [DOI] [PMC free article] [PubMed] [Google Scholar]
- 39. Figge R. M., Cassier-Chauvat C., Chauvat F., Cerff R. (2001) Characterization and analysis of an NAD(P)H dehydrogenase transcriptional regulator critical for the survival of cyanobacteria facing inorganic carbon starvation and osmotic stress. Mol. Microbiol. 39, 455–468 [DOI] [PubMed] [Google Scholar]
- 40. Omata T., Gohta S., Takahashi Y., Harano Y., Maeda S. (2001) Involvement of a CbbR homolog in low CO2-induced activation of the bicarbonate transporter operon in cyanobacteria. J. Bacteriol. 183, 1891–1898 [DOI] [PMC free article] [PubMed] [Google Scholar]
- 41. Yu J., Shen G., Wang T., Bryant D. A., Golbeck J. H., McIntosh L. (2003) Suppressor mutations in the study of photosystem I biogenesis: sll0088 is a previously unidentified gene involved in reaction center accumulation in Synechocystis sp. strain PCC 6803. J. Bacteriol. 185, 3878–3887 [DOI] [PMC free article] [PubMed] [Google Scholar]
- 42. Fujimori T., Higuchi M., Sato H., Aiba H., Muramatsu M., Hihara Y., Sonoike K. (2005) The mutant of sll1961, which encodes a putative transcriptional regulator, has a defect in regulation of photosystem stoichiometry in the cyanobacterium Synechocystis sp. PCC 6803. Plant Physiol. 139, 408–416 [DOI] [PMC free article] [PubMed] [Google Scholar]
- 43. Kobayashi M., Ishizuka T., Katayama M., Kanehisa M., Bhattacharyya-Pakrasi M., Pakrasi H. B., Ikeuchi M. (2004) Response to oxidative stress involves a novel peroxiredoxin gene in the unicellular cyanobacterium Synechocystis sp. PCC 6803. Plant Cell Physiol. 45, 290–299 [DOI] [PubMed] [Google Scholar]
- 44. Krishna P. S., Rani B. R., Mohan M. K., Suzuki I., Shivaji S., Prakash J. S. (2013) A novel transcriptional regulator, Sll1130, negatively regulates heat-responsive genes in Synechocystis sp. PCC6803. Biochem. J. 449, 751–760 [DOI] [PubMed] [Google Scholar]
- 45. Tzur A., Moore J. K., Jorgensen P., Shapiro H. M., Kirschner M. W. (2011) Optimizing optical flow cytometry for cell volume-based sorting and analysis. PLoS One 6, e16053. [DOI] [PMC free article] [PubMed] [Google Scholar]
- 46. García-Domínguez M., Lopez-Maury L., Florencio F. J., Reyes J. C. (2000) A gene cluster involved in metal homeostasis in the cyanobacterium Synechocystis sp. strain PCC 6803. J. Bacteriol. 182, 1507–1514 [DOI] [PMC free article] [PubMed] [Google Scholar]
- 47. Li M., Yang Q., Zhang L., Li H., Cui Y., Wu Q. (2007) Identification of novel targets of cyanobacterial glutaredoxin. Arch. Biochem. Biophys. 458, 220–228 [DOI] [PubMed] [Google Scholar]
- 48. Mikkat S., Milkowski C., Hagemann M. (2000) The gene sll0273 of the cyanobacterium Synechocystis sp. strain PCC6803 encodes a protein essential for growth at low Na+/K+ ratios. Plant Cell Environ. 23, 549–559 [Google Scholar]
- 49. Wang H. L., Postier B. L., Burnap R. L. (2002) Polymerase chain reaction-based mutageneses identify key transporters belonging to multigene families involved in Na+ and pH homeostasis of Synechocystis sp. PCC 6803. Mol. Microbiol. 44, 1493–1506 [DOI] [PubMed] [Google Scholar]
- 50. Zhu H. J., Ren X. Y., Wang J. X., Song Z. D., Shi M. L., Qiao J. J., Tian X. X., Liu J., Chen L., Zhang W. (2013) Integrated OMICS guided engineering of biofuel butanol-tolerance in photosynthetic Synechocystis sp. PCC 6803. Biotechnol. Biofuels 6, 106. [DOI] [PMC free article] [PubMed] [Google Scholar]
- 51. Pérez-Pérez M. E., Mata-Cabana A., Sánchez-Riego A. M., Lindahl M., Florencio F. J. (2009) A comprehensive analysis of the peroxiredoxin reduction system in the cyanobacterium Synechocystis sp. strain PCC 6803 reveals that all five peroxiredoxins are thioredoxin dependent. J. Bacteriol. 191, 7477–7489 [DOI] [PMC free article] [PubMed] [Google Scholar]
- 52. Wegener K. M., Singh A. K., Jacobs J. M., Elvitigala T., Welsh E. A., Keren N., Gritsenko M. A., Ghosh B. K., Camp D. G., Smith R. D., Pakrasi H. B. (2010) Global proteomics reveal an atypical strategy for carbon/nitrogen assimilation by a cyanobacterium under diverse environmental perturbations. Mol. Cell Proteomics 9, 2678–2689 [DOI] [PMC free article] [PubMed] [Google Scholar]
- 53. Príncipe A., Jofré E., Alvarez F., Mori G. (2009) Role of a serine-type D-alanyl-D-alanine carboxypeptidase on the survival of Ochrobactrum sp. 11a under ionic and hyperosmotic stress. FEMS Microbiol. Lett. 295, 261–273 [DOI] [PubMed] [Google Scholar]
- 54. Majeed W., Zhang Y., Xue Y., Ranade S., Blue R. N., Wang Q., He Q. (2012) RpaA regulates the accumulation of monomeric photosystem I and PsbA under high light conditions in Synechocystis sp. PCC 6803. PLoS One 7, 45139. [DOI] [PMC free article] [PubMed] [Google Scholar]
- 55. Miranda H., Cheregi O., Netotea S., Hvidsten T. R., Moritz T., Funk C. (2013) Co-expression analysis, proteomic and metabolomic study on the impact of a Deg/HtrA protease triple mutant in Synechocystis sp. PCC 6803 exposed to temperature and high light stress. J. Proteomics 78, 294–311 [DOI] [PubMed] [Google Scholar]
- 56. Horváth I., Glatz A., Varvasovszki V., Török Z., Páli T., Balogh G., Kovács E., Nádasdi L., Benkö S., Joó F., Vígh L. (1998) Membrane physical state controls the signaling mechanism of the heat shock response in Synechocystis PCC 6803: identification of hsp17 as a “fluidity gene.” Proc. Natl. Acad. Sci. U.S.A. 95, 3513–3518 [DOI] [PMC free article] [PubMed] [Google Scholar]
- 57. Jobin M. P., Delmas F., Garmyn D., Diviès C., Guzzo J. (1997) Molecular characterization of the gene encoding an 18-kilodalton small heat shock protein associated with the membrane of Leuconostoc oenos. Appl. Environ. Microbiol. 63, 609–614 [DOI] [PMC free article] [PubMed] [Google Scholar]
- 58. Gunnelius L., Tuominen I., Rantamäki S., Pollari M., Ruotsalainen V., Tyystjärvi E., Tyystjärvi T. (2010) SigC sigma factor is involved in acclimation to low inorganic carbon at high temperature in Synechocystis sp. PCC 6803. Microbiology 156, 220–229 [DOI] [PubMed] [Google Scholar]
- 59. Nikkinen H. L., Hakkila K., Gunnelius L., Huokko T., Pollari M., Tyystjärvi T. (2012) The SigB σ factor regulates multiple salt acclimation responses of the cyanobacterium Synechocystis sp. PCC 6803. Plant Physiol. 158, 514–523 [DOI] [PMC free article] [PubMed] [Google Scholar]
- 60. Alper S., Dufour A., Garsin D. A., Duncan L., Losick R. (1996) Role of adenosine nucleotides in the regulation of a stress-response transcription factor in Bacillus subtilis. J. Mol. Biol. 260, 165–177 [DOI] [PubMed] [Google Scholar]
- 61. Shi L., Bischoff K. M., Kennelly P. J. (1999) The icfG gene cluster of Synechocystis sp. strain PCC 6803 encodes an Rsb/Spo-like protein kinase, protein phosphatase, and two phosphoproteins. J. Bacteriol. 181, 4761–4767 [DOI] [PMC free article] [PubMed] [Google Scholar]
- 62. McCallum N., Berger-Bächi B., Senn M. M. (2010) Regulation of antibiotic resistance in Staphylococcus aureus. Int. J. Med. Microbiol. 300, 118–129 [DOI] [PubMed] [Google Scholar]
- 63. Palomino M. M., Sanchez-Rivas C., Ruzal S. M. (2009) High salt stress in Bacillus subtilis: involvement of PBP4* as a peptidoglycan hydrolase. Res. Microbiol. 160, 117–124 [DOI] [PubMed] [Google Scholar]
- 64. Yang S., Land M. L., Klingeman D. M., Pelletier D. A., Lu T. Y., Martin S. L., Guo H. B., Smith J. C., Brown S. D. (2010) Paradigm for industrial strain improvement identifies sodium acetate tolerance loci in Zymomonas mobilis and Saccharomyces cerevisiae. Proc. Natl. Acad. Sci. U.S.A. 107, 10395–10400 [DOI] [PMC free article] [PubMed] [Google Scholar]
- 65. Merino-Puerto V., Mariscal V., Mullineaux C. W., Herrero A., Flores E. (2010) Fra proteins influencing filament integrity, diazotrophy and localization of septal protein SepJ in the heterocyst-forming cyanobacterium Anabaena sp. Mol. Microbiol. 75, 1159–1170 [DOI] [PubMed] [Google Scholar]
- 66. Monteiro C., Fang X, Ahmad I., Gomelsky M., Römling U. (2011) Regulation of biofilm components in Salmonella enterica serovar Typhimurium by lytic transglycosylases involved in cell wall turnover. J. Bacteriol. 193, 6443–6451 [DOI] [PMC free article] [PubMed] [Google Scholar]
- 67. Mikami K., Kanesaki Y., Suzuki I., Murata N. (2002) The histidine kinase Hik33 perceives osmotic stress and cold stress in Synechocystis sp. PCC 6803. Mol. Microbiol. 46, 905–915 [DOI] [PubMed] [Google Scholar]
- 68. Marin K., Suzuki I., Yamaguchi K., Ribbeck K., Yamamoto H., Kanesaki Y., Hagemann M., Murata N. (2003) Identification of histidine kinases that act as sensors in the perception of salt stress in Synechocystis sp. PCC 6803. Proc. Natl. Acad. Sci. U.S.A. 100, 9061–9066 [DOI] [PMC free article] [PubMed] [Google Scholar]
- 69. Ohta H., Shibata Y., Haseyama Y., Yoshino Y., Suzuki T., Kagasawa T., Kamei A., Ikeuchi M., Enami I. (2005) Identification of genes expressed in response to acid stress in Synechocystis sp. PCC 6803 using DNA microarrays. Photosynth. Res. 84, 225–230 [DOI] [PubMed] [Google Scholar]
- 70. Anfelt J., Hallström B., Nielsen J. B., Uhlén M., Hudson E. P. (2013) Using transcriptomics to improve butanol tolerance in Synechocystis sp. PCC 6803. Appl. Environ. Microbiol. 79, 7419–7427 [DOI] [PMC free article] [PubMed] [Google Scholar]
- 71. Basha E., Lee G. J., Breci L. A., Hausrath A. C., Buan N. R., Giese K. C., Vierling E. (2004) The identity of proteins associated with a small heat shock protein during heat stress in vivo indicates that these chaperones protect a wide range of cellular functions. J. Biol. Chem. 279, 7566–7575 [DOI] [PubMed] [Google Scholar]
- 72. Summerfield T. C., Nagarajan S., Sherman L. A. (2011) Gene expression under low-oxygen conditions in the cyanobacterium Synechocystis sp. PCC 6803 demonstrates Hik31-dependent and -independent responses. Microbiology 157, 301–312 [DOI] [PubMed] [Google Scholar]
- 73. McGinn P. J., Price G. D., Maleszka R., Badger M. R. (2003) Inorganic carbon limitation and light control the expression of transcripts related to the CO2-concentrating mechanism in the cyanobacterium Synechocystis sp. strain PCC6803. Plant Physiol. 132, 218–229 [DOI] [PMC free article] [PubMed] [Google Scholar]
- 74. Klughammer B., Sültemeyer D., Badger M. R., Price G. D. (1999) The involvement of NAD(P) H dehydrogenase subunits, NdhD3 and NdhF3, in high affinity CO2 uptake in Synechococcus sp. PCC7002 gives evidence for multiple NDH-1 complexes with specific roles in cyanobacteria. Mol. Microbiol. 32, 1305–1315 [DOI] [PubMed] [Google Scholar]
- 75. Ohkawa H., Pakrasi H. B., Ogawa T. (2000) Two types of functionally distinct NAD(P) H dehydrogenases in Synechocystis sp. strain PCC6803. J. Biol. Chem. 275, 31630–31634 [DOI] [PubMed] [Google Scholar]
- 76. Ohkawa H., Price G. D., Badger M. R., Ogawa T. (2000) Mutation of ndh genes leads to inhibition of CO2 uptake rather than HCO3- uptake in Synechocystis sp. strain PCC6803. J. Bacteriol. 182, 2591–2596 [DOI] [PMC free article] [PubMed] [Google Scholar]
- 77. Figge R. M., Cassier-Chauvat C., Chauvat F., Cerff R. (2001) Characterisation and analysis of an NAD(P)H dehydrogenase transcriptional regulator critical for survival of cyanobacteria facing inorganic carbon starvation and osmotic stress. Mol. Microbiol. 39, 455–468 [DOI] [PubMed] [Google Scholar]
- 78. Shibata M., Katoh H., Sonoda M., Ohkawa H., Shimoyama M., Fukuzawa H., Kaplan A., Ogawa T. (2002) Genes essential to sodium-dependent bicarbonate transport in cyanobacteria: function and phylogenetic analysis. J. Biol. Chem. 277, 18658–18664 [DOI] [PubMed] [Google Scholar]
- 79. Omata T., Gohta S., Takahashi Y., Harano Y., Maeda S. (2001) Involvement of a CbbR homolog in low CO2-induced activation of the bicarbonate transporter operon in cyanobacteria. J. Bacteriol. 183, 1891–1898 [DOI] [PMC free article] [PubMed] [Google Scholar]
- 80. Kaplan A., Reinhold L. (1999) CO2 concentrating mechanisms in photosynthetic microorganisms. Annu. Rev. Plant Physiol. Plant Mol. Biol. 50, 539–570 [DOI] [PubMed] [Google Scholar]
- 81. Matsuda Y., Nakajima K., Tachibana M. (2011) Recent progresses on the genetic basis of the regulation of CO2 acquisition systems in response to CO2 concentration. Photosynth. Res. 109, 191–203 [DOI] [PubMed] [Google Scholar]
- 82. Fukuzawa H., Miura K., Ishizaki K., Kucho K. I., Saito T., Kohinata T., Ohyama K. (2001) Ccm1, a regulatory gene controlling the induction of a carbon-concentrating mechanism in Chlamydomonas reinhardtii by sensing CO2 availability. Proc. Natl. Acad. Sci. U.S.A. 98, 5347–5352 [DOI] [PMC free article] [PubMed] [Google Scholar]
Associated Data
This section collects any data citations, data availability statements, or supplementary materials included in this article.