Abstract
AIM: To characterize tumor necrosis factor receptor-associated protein 1 (TRAP1) expression in the progression of ulcerative colitis (UC)-associated colorectal cancer.
METHODS: Chronic UC is an inflammatory bowel disease that predisposes to colorectal cancer. Immunohistochemical analysis was used to evaluate TRAP1 expression on tissue microarrays containing colonic tissues from 42 UC progressors (patients with cancer or dysplasia) and 38 non-progressors (dysplasia/cancer free patients). Statistical analyses of the TRAP1 immunohistochemistry staining were performed using GraphPad Prism. Differences in the TRAP1 level between non-progressors and progressors were tested for statistical significance using the Mann-Whitney test. Receiver operating characteristic curve method was used to quantify marker performance in distinguishing diseased cases from controls.
RESULTS: TRAP1 was up-regulated in the colon tissues from UC progressors, but not in the colon tissues from UC non-progressors. Moreover, up-regulation of TRAP1 preceded the neoplastic changes: it was present in both the dysplastic and non-dysplastic tissues of UC progressors. When TRAP1 staining in rectal tissue was used as a diagnostic marker, it could distinguish progressors from non-progressors with 59% sensitivity and 80% specificity. Our study further showed that the increase of TRAP1 expression positively correlated with the degree of inflammation in the colorectal cancer tissues, which could be related to the increased oxidation present in the colonic mucosa from UC progressors. We then investigated the cellular proteome changes underlying oxidative stress, and found that oxidative stress could induce up-regulation of TRAP1 along with several other negative modulators of apoptosis.
CONCLUSION: These results suggest that oxidative stress in long standing UC could lead to the increase of cytoprotective protein TRAP1, which in turn could promote cancer progression by preventing or protecting the oxidative damaged epithelial cells from undergoing apoptosis. TRAP1 could be a potential diagnostic marker for UC associated colorectal cancer.
Keywords: Ulcerative colitis, Colorectal cancer, Inflammation, Oxidative stress, Tumor necrosis factor receptor-associated protein 1
Core tip: Chronic ulcerative colitis (UC) is an inflammatory bowel disease that predisposes to colorectal cancer. Our study showed that up-regulation of tumor necrosis factor receptor-associated protein 1 (TRAP1) occurred early in the neoplastic progression of UC associated cancer: it was present in both the dysplastic and non-dysplastic tissues of UC progressors. Our study further showed that the increase of TRAP1 expression in UC progressors positively correlated with the degree of inflammation in the colorectal cancer tissues, which could be related to the increased oxidation present in the colonic mucosa from UC progressors. TRAP1 could be a potential diagnostic marker for UC associated colorectal cancer.
INTRODUCTION
Ulcerative colitis (UC) is a chronic inflammatory condition of the large bowel. This chronic inflammatory response results in increased production and release of reactive oxygen metabolites, such as hydrogen peroxide, and superoxide which can damage proteins, lipids, and DNA[1-3]. Work by several groups has supported a role for increased oxidative injury and dysfunction of mitochondrial respiratory chain complexes II, III, and IV in the pathogenesis of this disease[4,5]. Several mouse and human studies have demonstrated that colitis is improved through antioxidant treatments or anti-inflammatory regimens which protect the colonic epithelium from oxidative stress[6,7]. Ultimately, patients with UC are at increased risk of developing colorectal cancer as a result of this cellular damage; the severity of inflammation is a critical factor affecting disease progression[8].
Tumor necrosis factor receptor-associated protein 1 (TRAP1), also known as heat shock protein 75 (Hsp75), is a member of the highly conserved Hsp90 family of chaperone proteins, but appears to have unique functions from Hsp90[9]. This mitochondrial protein is involved in protection against oxidative stress and apoptosis[10] by regulating reactive oxidative species (ROS) metabolism and preventing damage from unfolded or denatured proteins. Studies also reported that TRAP1 excelled the cytoprotective activities by regulating mitochondrial permeability transition pore opening[11,12].
Up-regulation of TRAP1 has been reported in various cancers including ovarian, colon, and prostate[13-16]. TRAP1 is up-regulated in approximately 60% of human colorectal carcinoma cells and this protective mechanism may induce multi-drug resistance[17]. The up-regulation of TRAP1 in various cancers support its role in cancer promotion. On the other hand, a recent study suggested that TRAP1 expression correlates inversely with tumor stage in cervical, bladder and clear cell renal cell cancers, suggesting that in some settings, this mitochondrial molecular chaperone may act as a tumor suppressor[18,19].
In a previous study, using comparative proteomics and immunohistochemistry (IHC), we detected an increase in TRAP1 expression in both non-dysplastic and dysplastic colon samples from UC progressors (patients with cancer or dysplasia) relative to UC non-progressors (patients who are dysplasia/cancer free)[20]. To further characterize the role of TRAP1 in the neoplastic progression of chronic inflammation-associated colorectal cancer, we validated differences in TRAP1 expression by IHC in an independent and expanded sample set of UC non-progressors and UC progressors. We explored TRAP1 expression patterns in UC neoplastic progression by evaluating multiple dysplastic and non-dysplastic colonic mucosal specimens from each of the UC progressors and non-progressors. We then examined the possible correlation of TRAP1 expression with the degree of colonic inflammation, and evaluated the potential of TRAP1 as a diagnostic biomarker for UC associated colorectal cancer.
MATERIALS AND METHODS
Specimens
Colon tissue specimens were collected in accordance with approved Human Subject’s guidelines at the University of Washington and the Cleveland Clinic Foundation in Cleveland via institutional internal tissue banks. Once procured, all specimens were assigned with study IDs and specimen IDs. The specimens obtained at the time of colonoscopy or from surgical resections were placed in frozen media containing Minimal Essential Medium with 10% DMSO, and kept frozen at -70 °C until use or immediately processed for paraffin embedding. Acute inflammation was measured using the conventional pathologic score for inflammation activity: 0, inactive; 1, UC, cryptitis; 2, UC, crypt abcesses; 3, UC, numerous crypt abcesses; and 4, UC, ulcerated and granulation tissue.
Tissue microarray construction
UC tissue microarrays (TMA) were constructed from representative pathologic or normal tissues from paraffin-embedded formalin or Hollande’s-fixed samples, including 38 from UC non-progressors and 42 from UC progressors. Triplicate 1.5-mm-diameter cores of each tissue type were embedded into a systematic grid using a tissue arrayer (Beecher Instruments, Silver Spring, MD, United States) as previously described[21]. The histological diagnosis of each core was independently confirmed.
Immunostaining
Briefly, the deparaffinized slides were processed for antigen retrieval using heat induced epitope retrieval techniques in EDTA buffer pH 8 followed by cooling to room temperature and primary antibody incubation using the TRAP1 antibody (Abcam 26135) at a titer of 1:50. The specific protein-antibody complexes were located using a biotin/streptavidin-HRP/(DAB) detection kit. IHC staining was graded by blinded observers using two semi-quantitative measurements: staining intensity (0-4) and percentage of cells stained (0 = no staining, 1 = approximately 25%, 2 = approximately 50%, 3 = approximately 75%, and 4 = approximately 100%). Positive staining was defined as cytoplasmic staining of epithelial cells. A combined numeric IHC score was calculated as the product of staining intensity and percentage of stained cells.
Cell culture and mitochondrial preparation
HT29 cells were cultured in DMEM + 10% FBS + pen/strep with the addition of either light or heavy stable isotope labeled lysine and arginine (light: 12C, heavy: 13C). After 7 d culture, the incorporation of heavy isotope reached 96%. Cells were treated with 50 μmol/L H2O2 for 24 h. Cells were trypsinized and the mitochondria were isolated using the Qproteome Mitochondrial Isolation Kit (Invitrogen) as per the manufacturer’s instructions. Lysates were resuspended in M-Per (Thermo Scientific) and the protein concentration was quantitated using a BCA assay (Thermo Scientific). 300 μg of protein from SILAC labeled and H2O2 treated HT29 mitochondrial preps were combined, precipitated by cold acetone and resuspended in 50 mmol/L NH4HCO3. Proteins were reduced with 10 mmol/L DTT for 1 h at 56 °C and blocked with 20 mmol/L iodoacetamide for 30 min at RT in the dark. Proteins were digested with trypsin overnight at 37 °C and peptides were purified and eluted into three fractions with a C18 column (The Nest Group, Inc.). Peptides were dried in a speed vacuum, resuspended in 0.5% acetic acid, and analyzed by LTQ-Orbitrap mass spectrometry.
Mass spectrometric analysis
The samples were analyzed using an LTQ-Orbitrap hybrid mass spectrometer (Thermo Fisher Scientific) coupled with nano-flow HPLC, which consists of a trap column (100 μm × 1.5 cm) packed with Magic C18AQ resin (5 μm, 200 Å particles; Michrom Bioresources), followed by an analytical column (75 μm × 27 cm) packed with Magic C18AQ resin (5 μm, 100 Å particles; Michrom Bioresources). The peptide samples were analyzed using a 90-min non-linear gradient, starting at 5% acetonitrile with 0.1% formic acid (against water with 0.1% formic acid), changing to 7% over 2 min, then to 35% over 90 min at a flow rate of 300 nL/min. The mass spectrometry experiment consisted of a full MS scan in the Orbitrap followed by up to 5 MS/MS spectral acquisitions in the linear ion trap using collision induced dissociation. An exclusion time of 45 sec was used to enhance the interrogation of low abundance peptides.
Proteomics data processing
The MS/MS data were searched against IPI human protein database using X!tandem algorithm. The assignment of peptide sequence was validated using PeptideProphet[22]. Peptides with a probability score of 0.9 or above were selected for protein identification using ProteinProphet[23]. The quantitative ratio of peptide/protein was calculated using Xpress software.
Apoptosis assay
HT29 cells were treated with hydrogen peroxide for 24 or 48 h and apoptosis measured using the ApoOne Homogenous Caspase 3/7 kit (Promega G7792) as per the manufacturer’s instructions. Each condition was tested in triplicate.
Carbonyl ELISA
Protein lysates were prepared in CHAPS buffer as described previously[24]. Protein lysates from 4 normal controls, 6 UC non-progressors, and 6 UC progressors at sites negative for dysplasia and high grade dysplasia (HGD) sites were adjusted to 10 μg/mL following Bradford protein assay. Oxidative stress was measured in protein lysates using the OxiSelect Protein Carbonyl ELISA kit (Cell Biolabs STA-310) as per the manufacturer’s instructions.
Statistical analysis
Statistical analyses of the TRAP1 IHC staining were performed using GraphPad Prism (La Jolla, CA, United States). Differences in the TRAP1 level between non-progressors and progressors were tested for statistical significance using the Mann-Whitney test. Receiver operating characteristic (ROC) curve method was used to quantify marker performance in distinguishing diseased cases from controls. The correlation of TRAP1 level with inflammation score was tested by linear regression. Statistical significance was defined as P < 0.05.
RESULTS
Increased expression of TRAP1 in the rectal tissues from UC progressors
TMAs containing colonic tissues from 42 UC progressors and 38 non-progressors were stained with a TRAP1 antibody to evaluate the expression of TRAP1 in colon tissues. For comparison, we also examined normal colon tissues from 20 non-UC controls. The TMAs contained both dysplastic and non-dysplastic tissue samples from the UC progressors. The overall staining of TRAP1 was presented as IHC score by calculating the product of staining intensity and percentage of stained cells.
As presented in Figure 1, the staining of TRAP1 in non-progressors was not significantly different from that in normal controls. In contrast, there was a significant increase in the TRAP1 expression in the dysplasia and cancer compared to rectal tissues from normal controls (P < 0.0001) or the UC non-progressors (P < 0.001). Moreover, the non-dysplastic rectal tissues from progressors also displayed a significant increase in TRAP1 expression compared to the rectal tissues from non-progressors (P = 0.001) or from normal controls (P = 0.0045). Within the progressors, TRAP1 expression increased significantly throughout the neoplastic progression: from non-dysplasia to low grade dysplasia (LGD) and to HGD or cancer. The staining of TRAP1 in HGD was not significantly different from that in cancer. The representative IHC images are presented in Figure 2.
Figure 1.
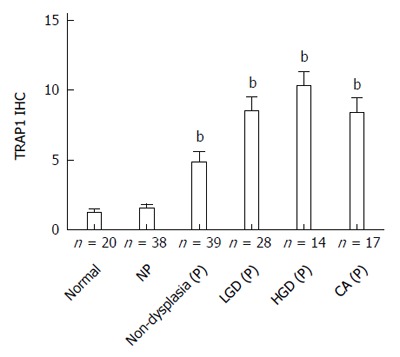
Tumor necrosis factor receptor-associated protein 1 staining increases with ulcerative colitis progression at both non-dysplastic and dysplastic sites. Plot depicts the average immunohistochemistry (IHC) score ± SE for rectal samples from normal controls, non-progressors, progressors at non-dysplastic rectal sites, and progressors at dysplastic sites. The number of patient is indicated. bP < 0.01 using Mann Whitney test vs normal controls. NP: Non-progressors; P: Progressors; LGD: Low grade dysplasia; HGD: High grade dysplasia; CA: Cancer; TRAP1: Tumor necrosis factor receptor-associated protein 1.
Figure 2.
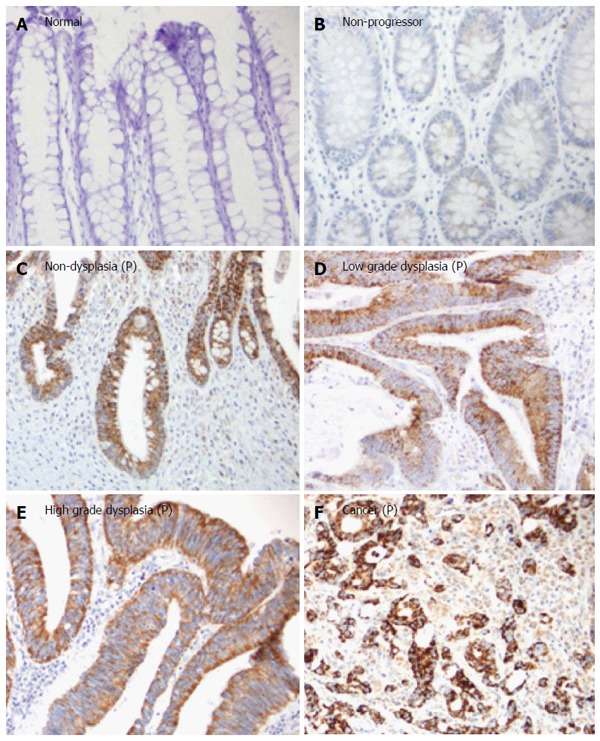
Representative tumor necrosis factor receptor-associated protein 1 immunohistochemistry staining in ulcerative colitis non-progressors and ulcerative colitis progressors. A: Normal rectum from a normal control; B: Non-dysplastic rectum from a non-progressor (NP); C: Non-dysplastic rectum from a progressor (P); D: Low grade dysplasia from a progressor; E: High grade dysplasia from a progressor; F: Cancer from a progressor. All images were taken at × 20 magnification. P: Progressor.
TRAP1 staining to distinguish progressors from
non-progressors
The ROC method was then used to evaluate and quantify TRAP1 expression as a biomarker to distinguish UC progressors from non-progressors. Since multiple tissues including dysplastic and non-dysplastic tissues from each progressor were tested for TRAP1 staining, we first evaluated using TRAP1 staining in dysplastic tissues from progressors as a biomarker. As shown in Figure 3, the AUC value of using TRAP1 staining in LGD, HGD and cancer tissues from progressors reached 0.86, 0.97 and 0.87, respectively, in separating progressors from non-progressors. If the highest TRAP1 staining in any of dysplastic tissue was used as a biomarker, the AUC could be improved to 0.94 in separating progressors from non-progressors. With 90% specificity, TRAP1 staining in dysplastic tissues could achieve 86% sensitivity in separating progressors from non-progressors (Table 1). With 80% specificity, TRAP1 staining in dysplastic tissues could achieve 94% sensitivity in separating progressors from non-progressors (Table 1).
Figure 3.
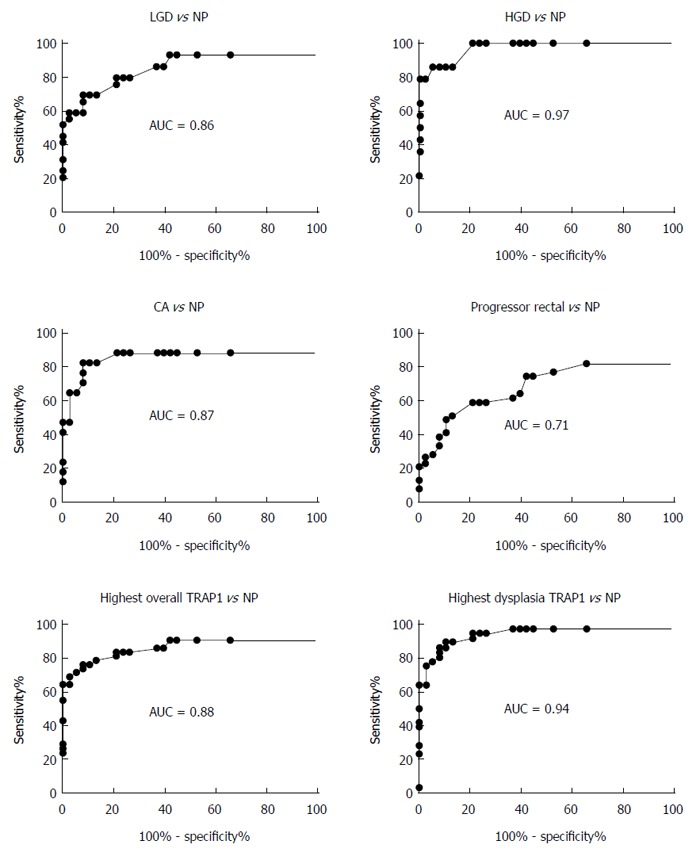
Evaluation of tumor necrosis factor receptor-associated protein 1 staining in different histological grades as a biomarker to distinguish progressors from non-progressors. The different histological grades were indicated in each specific panel. The rectal tissue from progressors was non-dysplastic, and tissue from non-progressors (NP) was also non-dysplastic rectal tissue. LGD: Low grade dysplasia; HGD: High grade dysplasia; CA: Cancer; TRAP1: Tumor necrosis factor receptor-associated protein 1.
Table 1.
Performance of tumor necrosis factor receptor-associated protein 1 staining in distinguishing progressors from non-progressors
| Using TRAP1 expression in different histologic grades as a biomarker (n) | Controls (n) | AUC value |
Sensitivity at |
|
| 90% specificity | 80% specificity | |||
| LGD (29) | Non-progressors (38) | 0.86 | 69% | 79% |
| HGD (14) | Non-progressors (38) | 0.97 | 86% | 100% |
| Cancer (17) | Non-progressors (38) | 0.87 | 82% | 88% |
| Progressor rectal tissue (39) | Non-progressors (38) | 0.71 | 41% | 59% |
| Highest TRAP1 in dysplasia (36) | Non-progressors (38) | 0.94 | 86% | 94% |
| Highest overall TRAP1 (42) | Non-progressors (38) | 0.88 | 76% | 83% |
LGD: Low grade dysplasia; HGD: High grade dysplasia; TRAP1: Tumor necrosis factor receptor-associated protein 1.
In addition to the dysplastic tissues, the non-dysplastic rectal tissues from progressors also displayed increased TRAP1 staining. We then evaluated if TRAP1 staining in the non-dysplastic rectal tissue could be used as a biomarker for progressors. As shown in Table 1, TRAP1 staining in the rectal tissue could be used to separate progressors from non-progressor with 59% sensitivity and 80% specificity. If we used the highest TRAP1 staining from the multiple tissues (including dysplastic and non-dysplastic tissues) from each progressor, the performance of TRAP1 as a biomarker could be significantly enhanced: with 83% sensitivity and 80% specificity (AUC = 0.88) in distinguishing progressors from non-progressors.
Concordance rate of TRAP1 expression in UC progressors
We then examined TRAP1 expression pattern among different histological grades in progressors. For each progressor, available non-dysplasia (rectum), LGD, HGD and cancer tissues were examined for TRAP1 expression. Using the mean TRAP1 expression of non-progressors (IHC score = 1.55) as cutoff value to define tissue with low or high TRAP1 expression, 40 out of the 42 progressors displayed consistent TRAP1 staining among rectal, LGD, HGD and cancer tissues, achieving a concordance rate of 95% among different histological grades within each progressor (Table 2). There were only two progressors that showed a non-concordant TRAP1 pattern among tissues with different histology grades. For progressor case 25, the rectal and LGD tissues were negative for TRAP1, but the HGD and cancer tissues were positive. For case 29, the rectal, LGD, and cancer tissues were all negative for TRAP1, but the HGD tissue was positive.
Table 2.
Expression pattern of tumor necrosis factor receptor-associated protein 1 among different histologic grades within each progressor
| Progressor case | Highest histologic grade present in the progressor | Rectum | LGD | HGD | CA |
| 1 | LGD | - | - | NA | NA |
| 2 | LGD | - | - | NA | NA |
| 3 | LGD | - | - | NA | NA |
| 4 | LGD | - | - | NA | NA |
| 5 | LGD | + | + | NA | NA |
| 6 | LGD | - | - | NA | NA |
| 7 | LGD | + | + | NA | NA |
| 8 | LGD | - | - | NA | NA |
| 9 | LGD | - | - | NA | NA |
| 10 | LGD | + | + | NA | NA |
| 11 | LGD | + | + | NA | NA |
| 12 | LGD | - | - | NA | NA |
| 13 | LGD | + | + | NA | NA |
| 14 | LGD | - | - | NA | NA |
| 15 | LGD | - | - | NA | NA |
| 16 | LGD | - | - | NA | NA |
| 17 | LGD | + | + | NA | NA |
| 18 | LGD | + | + | NA | NA |
| 19 | LGD | + | + | NA | NA |
| 20 | HGD | + | + | NA | NA |
| 21 | HGD | - | - | NA | NA |
| 22 | HGD | + | + | + | NA |
| 23 | HGD | + | + | + | NA |
| 24 | HGD | + | + | + | NA |
| 25 | CA | - | - | + | + |
| 26 | CA | + | + | + | + |
| 27 | CA | + | + | + | + |
| 28 | CA | NA | NA | NA | + |
| 29 | CA | - | - | + | - |
| 30 | CA | + | + | + | + |
| 31 | CA | + | + | + | NA |
| 32 | CA | - | - | NA | - |
| 33 | CA | + | + | NA | + |
| 34 | CA | NA | NA | + | + |
| 35 | CA | NA | NA | NA | + |
| 36 | CA | + | + | + | + |
| 37 | CA | + | + | + | + |
| 38 | CA | + | + | NA | + |
| 39 | CA | + | + | + | + |
| 40 | CA | + | + | NA | + |
| 41 | CA | + | + | + | + |
| 42 | CA | + | + | NA | + |
"+": Positive tumor necrosis factor receptor-associated protein 1 (TRAP1) staining; "-": Negative TRAP1 staining; NA: Not available; LGD: Low grade dysplasia; HGD: High grade dysplasia; CA: Cancer.
Differential TRAP1 staining in the surface and deep epithelium of colon tissue
In evaluation of TRAP1 staining in the colon mucosa, we observed differential TRAP1 staining in colonic surface epithelium and deep epithelium. In normal controls and non-progressors, the TRAP1 staining within surface epithelium was more intense than in the deep epithelium (Figure 4). In contrast, the TRAP1 staining of colonic surface epithelium was similar to deep epithelium in non-dysplastic tissues from progressors. TRAP1 staining in deep colonic epithelium was significantly different among the non-dysplastic colon samples from normal controls, non-progressors and progressors (P = 0.001), whereas the surface staining among them was not significantly different (P = 0.158). These observations indicate that the differential TRAP1 expression between the non-dysplastic tissues of UC non-progressors and progressors stemmed mainly from the differential TRAP1 expression in the deep colonic epithelium.
Figure 4.
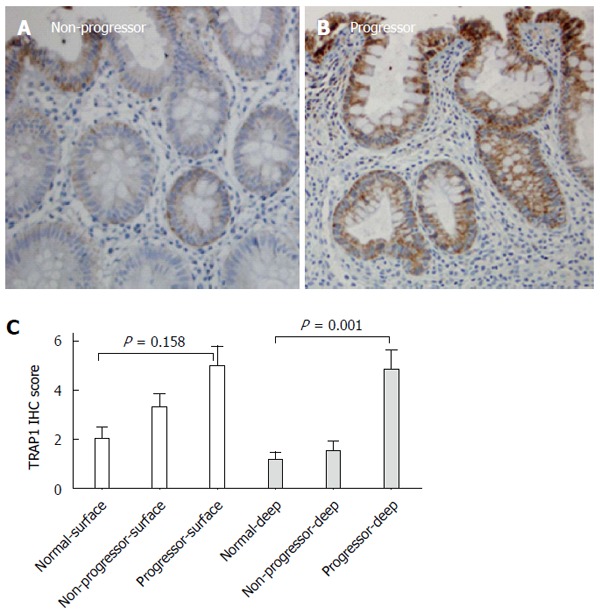
Surface and deep epithelium displayed different degrees of tumor necrosis factor receptor-associated protein 1 staining across all non-dysplastic colon tissues. A: Non-dysplastic tissue from a non-progressor; B: Non-dysplastic tissue from a progressor; C: Comparison of tumor necrosis factor receptor-associated protein 1 (TRAP1) staining in the surface epithelium and deep epithelium. Only the non-dysplastic tissues from progressors were included in this comparison. P-values were determined by Kruskal-Wallis test. IHC: Immunohistochemistry.
Correlation of TRAP1 with inflammation
UC progressors and non-progressors had various degrees of inflammation in the colon and rectum. The specimens for this study were chosen so that the overall degree of colonic inflammation was matched in non-progressors and progressors. The mean inflammation scores for non-progressor samples and progressor samples were 1.8 ± 0.2 and 1.8 ± 0.1, respectively, with no significant difference in the degree of inflammation between non-progressors and progressors (Mann Whitney test P = 0.95). To evaluate if there was a correlation between the degree of inflammation and TRAP1 expression in each of the individual samples, we performed a linear regression analysis on non-progressors and progressors. As shown in Figure 5, there was a positive correlation between the degree of inflammation and TRAP1 expression in dysplastic samples from progressors (P = 0.03), and no correlation between degree of inflammation and TRAP1 expression in samples from non-dysplastic tissues, regardless of whether the patients were progressors or non-progressors (Figure 5A and B). Among the dysplastic samples, there was no correlation between degree of inflammation and TRAP1 expression in LGD or HGD, but there was a significant correlation between degree of inflammation and TRAP1 expression in cancer (Figure 5F, P = 0.01).
Figure 5.
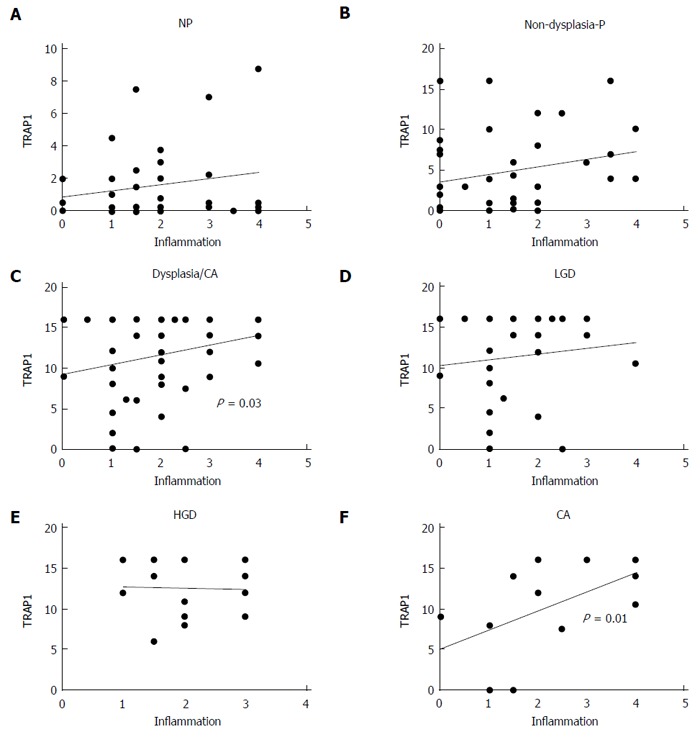
Correlation of tumor necrosis factor receptor-associated protein 1 expression with inflammation. A positive correlation between tumor necrosis factor receptor-associated protein 1 (TRAP1) staining and inflammation was observed in the dysplastic tissues. A: Non-progressors (NP); B: Non-dysplastic progressors (P); C: Dysplastic/cancer (CA); D: Low grade dysplasia (LGD); E: High grade dysplasia (HGD); F: CA.
Increased oxidation in UC colon mucosa
While histologic detection of inflammatory cells in the colonic mucosa provides a snap-shot of the inflammatory process at one point in time, it is not a measurement of the inflammatory exposure over time or cumulative oxidative injury. To measure the cumulative oxidative damage in the colonic mucosa of UC patients, we directly measured the by-product of oxidative injury to proteins in the colon: protein carbonylation. It has been reported that levels of protein carbonyls are increased within the inflamed mucosa of IBD patients, in addition to reactive oxygen intermediates and DNA oxidation products[25]. We compared protein carbonyls in lysates prepared from the colonic epithelium isolated from normal individuals, UC non-progressors, and UC progressors, using a carbonyl ELISA assay (Figure 6). UC non-progressors had similar levels of protein carbonylation to the normal non-UC controls. In contrast, the protein carbonylation in the LGD increased by 7.8-fold with statistical significance (P = 0.029). Similarly, the protein carbonylation in the HGD increased by 7.6-fold with statistical significance (P = 0.005). The protein carbonyls in the non-dysplastic sites from progressors or cancerous tissue also increased over 3-fold; however, they did not quite reach statistical significance (P = 0.08 and 0.17, respectively).
Figure 6.
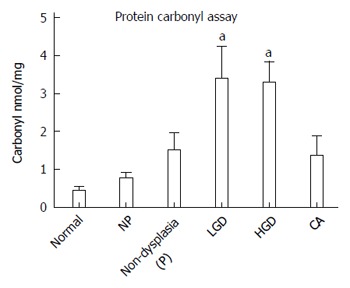
Detection of carbonyls in the colon mucosa of patients with ulcerative colitis. The carbonyls were significantly increased in the colon mucosa of patients with high grade dysplasia. NP: Non-progressors; P: Progressors; CA: Cancer. aP < 0.05 vs normal group.
Oxidative damage induces up-regulation of TRAP1 in colon cancer cells
To investigate the link between oxidative damage and up-regulation of TRAP1, we analyzed HT29 human colon cancer cells following treatment with hydrogen peroxide for 24 h. We detected a dose-dependent increase in protein carbonyls in the treated cells, suggesting that the oxidative injury in this model system parallels in vivo events (Figure 7A). To further investigate the global functional changes following oxidative stress, we next looked at the mitochondrial proteome since the regulation of stress response occurs primarily in the mitochondria. Purified mitochondrial lysates from HT29 cells treated with 50 μmol/L of hydrogen peroxide for 24 h were evaluated using SILAC based quantitative proteomics relative to untreated cells. We detected 116 mitochondrial proteins with an at least 1.5-fold change in hydrogen peroxide treated cells relative to control untreated cells. TRAP1 was one such protein, expressed at a 1.5 fold increase following hydrogen peroxide treatment. We also detected up-regulation of two other mitochondrial stress response proteins (HSPA9 and PYCR1) in the hydrogen peroxide treated cells. In addition, several proteins involved in modulation of apoptosis or antioxidants were over-expressed in the hydrogen peroxide treated cells, including PHB, PRDX3, and NDUFAF2 (Figure 7B). We next evaluated apoptosis in the treated cells. As showed in Figure 7C, there was a sharp decrease in viability of HT29 cells with increasing H2O2 exposure; however, there was only a modest (about 20% increase) in apoptosis in treated cells (as determined by activated caspase 3; Figure 7D). Moreover, we did not detect a corresponding dose-dependent increase in apoptosis, suggesting that these cells could be protected against apoptosis, possibly through up-regulation of TRAP1 and other anti-apoptotic mechanisms.
Figure 7.
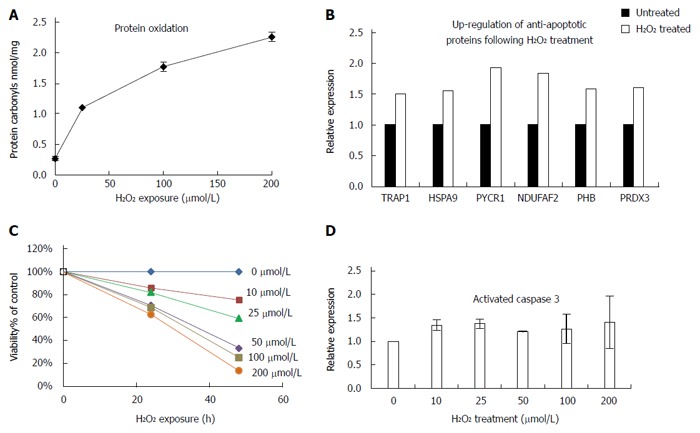
Tumor necrosis factor receptor-associated protein 1 expression is increased with oxidative damage in colon cancer cells. A: HT29 cells were treated with the indicated concentrations of H2O2 for 24 h and protein carbonyls were detected using enzyme-linked immunosorbent assay; B: Up-regulation of anti-apoptotic proteins following H2O2 treatment detected by quantitative proteomics; C: Viability assay of HT29 cells following exposure to increasing amounts of H2O2; D: Detection of activated caspase 3 following 24 h H2O2 treatment.
DISCUSSION
In chronic UC patients, the colon epithelium undergoes repeated cycles of inflammation and tissue repair, resulting in oxidative stress and accumulation of ROS. Excessive ROS can cause oxidative stress, which may subsequently lead to damage in DNA, proteins and lipids. If un-repaired, this damage could potentially lead to the development of cancer. TRAP1 is a mitochondrial protein whose function is to protect cells from oxidative injury and apoptosis. We have previously shown up-regulation of TRAP1 in UC progressors using a comparative proteomics approach. In the current study, we provide further evidence of TRAP1 involvement in UC neoplastic progression. Our data show that TRAP1 is up-regulated in the colonic mucosa from UC patients who have colorectal cancer/dysplasia (UC progressors), but not in the colonic mucosa from UC patients who are cancer/dysplasia-free (UC non-progressors). The up-regulation starts at the very earliest neoplastic stage, the stage when histological changes are not visible (i.e., non-dysplastic stage), and increases with neoplastic progression. TRAP-1 expression appears to be colon-wide, involving both the dysplastic and non-dysplastic (negative for dysplasia rectum) mucosa of UC progressors.
Inflammation and TRAP1
The patients included in this analysis had pan-colonic UC; thus acute and chronic inflammation involves the entire colon. For the purposes of this study, the UC progressors and non-progressors were matched for inflammation in the colon. It was interesting to note that the increased TRAP1 expression correlated with the degree of inflammation only in the colorectal cancer tissues, but not in the earlier stages of tumorigenesis. This suggests that the acute inflammation is not likely to influence TRAP1 expression. Increased carbonyl protein oxidation levels, which may be a better measure of accumulated chronic inflammation, were found in the non-dysplastic and dysplastic colonic mucosa from UC progressors but not in the mucosa of UC non-progressors. These findings suggest that protein oxidation and overexpression of TRAP1 are early, possibly causative events in neoplastic progression of UC.
We further showed that oxidative stress induces up-regulation of carbonyl oxidation and TRAP1 protein expression, along with several other negative modulators of apoptosis. These results confirm a paradigm whereby chronic oxidative injury to colon cells is associated with mitochondrial response of up-regulating TRAP1.
Surface epithelium vs deep epithelium
An interesting phenomenon was observed in this study. In the non-dysplastic colon specimens from UC non-progressors and from normal non-UC control subjects, TRAP1 staining is present in the surface epithelium, while in the UC progressors TRAP1 expression is present in both the superficial and deep parts of the epithelial crypts. This staining pattern is similar to the inflammation-induced increase in Cox-2 expression within the surface colonic epithelium from UC patients[26]. In the colons of UC non-progressor and normal controls, the epithelium is constantly renewing with old epithelial cells moving towards the surface and eventually sloughing off into the lumen. When the epithelial cells move closer to the surface, they face a harsh environment including stool and bacteria. The various stress stimuli could induce the up-regulation of TRAP1 in these cells. These cells are not long-lived however - the superficial cells are shed into the colon lumen within several hours of arriving to the surface. In contrast, in the histologically normal appearing colon tissues from UC progressors, high expression of TRAP1 was observed in both the surface and deep epithelium. In UC progressors, the reactive oxygen species generated from the abundant inflammatory cells in the lamina propria and sub-mucosa likely affect the nearby deep epithelium, and could induce TRAP1 for cytoprotection in these epithelial cells. If the deep epithelial cells that are damaged do not undergo cell death, one could envision that accumulated damage in the crypt stem cells would be passed to the daughter cells. This would lead to the clonal expansion of genomic instability, which we have previously described[27].
Cell damage, cell death and TRAP1
The role of TRAP1 is multi-functional in the cell. It regulates mitochondrial integrity and apoptotic cell death as well as proteins that are destined for the mitochondria. With these functions in mind, it is difficult to know whether the higher levels of TRAP1 are beneficial or detrimental to the cell. One could envision TRAP1 as a protector against oxidative injury. However, increased TRAP1 expression could be problematic if it ultimately inhibits a normal damage-induced apoptotic response. We have previously shown that the DNA of UC progressors has accumulated genomic instability[28], that bcl-2, an anti-apoptotic protein, is overexpressed in the dysplastic and non-dysplastic mucosa of UC progressors (but not in the UC non-progressors)[29] and that abrogation of the senescence pathways leads to neoplastic predisposition[24]. In the previous study[29], Bcl-2 was found to be increased in 76% of cases of ulcerative colitis associated dysplasia. In our current study, 69% of the progressors displayed positive TRAP1 staining in the dysplastic or cancerous tissues. Therefore, our current data are consistent with previous results that there are increased anti-apoptotic activities in UC dysplasia. Furthermore, in our in vitro studies of hydrogen peroxide treated coloncytes, caspase 3, an apoptosis index, is only marginally elevated in oxidatively treated cells, and moreover, even with supra-physiologic doses of H2O2, there is no dose response that one might anticipate as DNA is further injured, implying that apoptosis could be suppressed in these cells. Our results are consistent with previous report that high TRAP1 levels interfered with caspase 3 activation[30]. Taken together, it seems likely that TRAP1 is one of several proteins which impact the continued survival of colonic crypt cells that are damaged but have escaped death. These TRAP1 expressing damaged cells may be a seed for neoplastic progression in UC.
ACKNOWLEDGMENTS
We thank Yasuko Tamura and Damon May for technical support.
COMMENTS
Background
Patients with chronic inflammation, such as ulcerative colitis (UC), are prone to cancer. The chronic inflammatory response in UC patients results in increased production and release of reactive oxygen metabolites.
Research frontiers
Work by several groups has supported a role for increased oxidative injury and dysfunction of mitochondrial respiratory chain in the pathogenesis of this disease. Tumor necrosis factor receptor-associated protein 1 (TRAP1) is involved in protection against oxidative stress and apoptosis by regulating reactive oxidative species metabolism and preventing damage from unfolded or denatured proteins. Up-regulation of TRAP1 has been reported in various cancers including ovarian, colon, and prostate.
Innovations and breakthroughs
TRAP1 was up-regulated in the colon tissues from UC progressors, but not in the colon tissues from UC non-progressors. Moreover, up-regulation of TRAP1 preceded the neoplastic changes: it was present in both the dysplastic and non-dysplastic tissues of UC progressors. Their study further showed that the increase of TRAP1 expression positively correlated with the degree of inflammation in the colorectal cancer tissues, which could be related to the increased oxidation present in the colonic mucosa from UC progressors. Authors then investigated the cellular proteome changes underlying oxidative stress, and found that oxidative stress could induce up-regulation of TRAP1 along with several other negative modulators of apoptosis.
Applications
When TRAP1 staining in rectal tissue was used as a diagnostic marker, it could distinguish progressors from non-progressors with 59% sensitivity and 80% specificity. TRAP1 could be a potential diagnostic marker for UC associated colorectal cancer.
Peer review
Collectively, the authors propose that oxidative stress in long standing UC could lead to the increase of TRAP1, which in turn promotes cancer progression by preventing the oxidative damaged epithelial cells from undergoing apoptosis.
Footnotes
Supported by Grants from National Institutes of Health, No. R21CA164548; and from Crohn’s and Colitis Foundation of America
P- Reviewer: Sugimoto K S- Editor: Gou SX L- Editor: Wang TQ E- Editor: Liu XM
References
- 1.Ellis EM. Reactive carbonyls and oxidative stress: potential for therapeutic intervention. Pharmacol Ther. 2007;115:13–24. doi: 10.1016/j.pharmthera.2007.03.015. [DOI] [PubMed] [Google Scholar]
- 2.Keshavarzian A, Sedghi S, Kanofsky J, List T, Robinson C, Ibrahim C, Winship D. Excessive production of reactive oxygen metabolites by inflamed colon: analysis by chemiluminescence probe. Gastroenterology. 1992;103:177–185. doi: 10.1016/0016-5085(92)91111-g. [DOI] [PubMed] [Google Scholar]
- 3.Roessner A, Kuester D, Malfertheiner P, Schneider-Stock R. Oxidative stress in ulcerative colitis-associated carcinogenesis. Pathol Res Pract. 2008;204:511–524. doi: 10.1016/j.prp.2008.04.011. [DOI] [PubMed] [Google Scholar]
- 4.Brentnall TA, Pan S, Bronner MP, Crispin DA, Mirzaei H, Cooke K, Tamura Y, Nikolskaya T, Jebailey L, Goodlett DR, et al. Proteins That Underlie Neoplastic Progression of Ulcerative Colitis. Proteomics Clin Appl. 2009;3:1326. doi: 10.1002/prca.200900061. [DOI] [PMC free article] [PubMed] [Google Scholar]
- 5.Sifroni KG, Damiani CR, Stoffel C, Cardoso MR, Ferreira GK, Jeremias IC, Rezin GT, Scaini G, Schuck PF, Dal-Pizzol F, et al. Mitochondrial respiratory chain in the colonic mucosal of patients with ulcerative colitis. Mol Cell Biochem. 2010;342:111–115. doi: 10.1007/s11010-010-0474-x. [DOI] [PubMed] [Google Scholar]
- 6.Oz HS, Chen TS, McClain CJ, de Villiers WJ. Antioxidants as novel therapy in a murine model of colitis. J Nutr Biochem. 2005;16:297–304. doi: 10.1016/j.jnutbio.2004.09.007. [DOI] [PubMed] [Google Scholar]
- 7.Theiss AL, Vijay-Kumar M, Obertone TS, Jones DP, Hansen JM, Gewirtz AT, Merlin D, Sitaraman SV. Prohibitin is a novel regulator of antioxidant response that attenuates colonic inflammation in mice. Gastroenterology. 2009;137:199–208, 208.e1-e6. doi: 10.1053/j.gastro.2009.03.033. [DOI] [PMC free article] [PubMed] [Google Scholar]
- 8.Rutter M, Saunders B, Wilkinson K, Rumbles S, Schofield G, Kamm M, Williams C, Price A, Talbot I, Forbes A. Severity of inflammation is a risk factor for colorectal neoplasia in ulcerative colitis. Gastroenterology. 2004;126:451–459. doi: 10.1053/j.gastro.2003.11.010. [DOI] [PubMed] [Google Scholar]
- 9.Altieri DC, Stein GS, Lian JB, Languino LR. TRAP-1, the mitochondrial Hsp90. Biochim Biophys Acta. 2012;1823:767–773. doi: 10.1016/j.bbamcr.2011.08.007. [DOI] [PMC free article] [PubMed] [Google Scholar]
- 10.Hua G, Zhang Q, Fan Z. Heat shock protein 75 (TRAP1) antagonizes reactive oxygen species generation and protects cells from granzyme M-mediated apoptosis. J Biol Chem. 2007;282:20553–20560. doi: 10.1074/jbc.M703196200. [DOI] [PubMed] [Google Scholar]
- 11.Kang BH, Plescia J, Dohi T, Rosa J, Doxsey SJ, Altieri DC. Regulation of tumor cell mitochondrial homeostasis by an organelle-specific Hsp90 chaperone network. Cell. 2007;131:257–270. doi: 10.1016/j.cell.2007.08.028. [DOI] [PubMed] [Google Scholar]
- 12.Xiang F, Huang YS, Shi XH, Zhang Q. Mitochondrial chaperone tumour necrosis factor receptor-associated protein 1 protects cardiomyocytes from hypoxic injury by regulating mitochondrial permeability transition pore opening. FEBS J. 2010;277:1929–1938. doi: 10.1111/j.1742-4658.2010.07615.x. [DOI] [PubMed] [Google Scholar]
- 13.Landriscina M, Amoroso MR, Piscazzi A, Esposito F. Heat shock proteins, cell survival and drug resistance: the mitochondrial chaperone TRAP1, a potential novel target for ovarian cancer therapy. Gynecol Oncol. 2010;117:177–182. doi: 10.1016/j.ygyno.2009.10.078. [DOI] [PubMed] [Google Scholar]
- 14.Leav I, Plescia J, Goel HL, Li J, Jiang Z, Cohen RJ, Languino LR, Altieri DC. Cytoprotective mitochondrial chaperone TRAP-1 as a novel molecular target in localized and metastatic prostate cancer. Am J Pathol. 2010;176:393–401. doi: 10.2353/ajpath.2010.090521. [DOI] [PMC free article] [PubMed] [Google Scholar]
- 15.Gao JY, Song BR, Peng JJ, Lu YM. Correlation between mitochondrial TRAP-1 expression and lymph node metastasis in colorectal cancer. World J Gastroenterol. 2012;18:5965–5971. doi: 10.3748/wjg.v18.i41.5965. [DOI] [PMC free article] [PubMed] [Google Scholar]
- 16.Im CN, Seo JS. Overexpression of tumor necrosis factor receptor-associated protein 1 (TRAP1), leads to mitochondrial aberrations in mouse fibroblast NIH/3T3 cells. BMB Rep. 2014;47:280–285. doi: 10.5483/BMBRep.2014.47.5.174. [DOI] [PMC free article] [PubMed] [Google Scholar]
- 17.Costantino E, Maddalena F, Calise S, Piscazzi A, Tirino V, Fersini A, Ambrosi A, Neri V, Esposito F, Landriscina M. TRAP1, a novel mitochondrial chaperone responsible for multi-drug resistance and protection from apoptotis in human colorectal carcinoma cells. Cancer Lett. 2009;279:39–46. doi: 10.1016/j.canlet.2009.01.018. [DOI] [PubMed] [Google Scholar]
- 18.Iwai A, Bourboulia D, Mollapour M, Jensen-Taubman S, Lee S, Donnelly AC, Yoshida S, Miyajima N, Tsutsumi S, Smith AK, et al. Combined inhibition of Wee1 and Hsp90 activates intrinsic apoptosis in cancer cells. Cell Cycle. 2012;11:3649–3655. doi: 10.4161/cc.21926. [DOI] [PMC free article] [PubMed] [Google Scholar]
- 19.Yoshida S, Tsutsumi S, Muhlebach G, Sourbier C, Lee MJ, Lee S, Vartholomaiou E, Tatokoro M, Beebe K, Miyajima N, et al. Molecular chaperone TRAP1 regulates a metabolic switch between mitochondrial respiration and aerobic glycolysis. Proc Natl Acad Sci USA. 2013;110:E1604–E1612. doi: 10.1073/pnas.1220659110. [DOI] [PMC free article] [PubMed] [Google Scholar]
- 20.May D, Pan S, Crispin DA, Lai K, Bronner MP, Hogan J, Hockenbery DM, McIntosh M, Brentnall TA, Chen R. Investigating neoplastic progression of ulcerative colitis with label-free comparative proteomics. J Proteome Res. 2011;10:200–209. doi: 10.1021/pr100574p. [DOI] [PMC free article] [PubMed] [Google Scholar]
- 21.Kononen J, Bubendorf L, Kallioniemi A, Bärlund M, Schraml P, Leighton S, Torhorst J, Mihatsch MJ, Sauter G, Kallioniemi OP. Tissue microarrays for high-throughput molecular profiling of tumor specimens. Nat Med. 1998;4:844–847. doi: 10.1038/nm0798-844. [DOI] [PubMed] [Google Scholar]
- 22.Keller A, Nesvizhskii AI, Kolker E, Aebersold R. Empirical statistical model to estimate the accuracy of peptide identifications made by MS/MS and database search. Anal Chem. 2002;74:5383–5392. doi: 10.1021/ac025747h. [DOI] [PubMed] [Google Scholar]
- 23.Nesvizhskii AI, Keller A, Kolker E, Aebersold R. A statistical model for identifying proteins by tandem mass spectrometry. Anal Chem. 2003;75:4646–4658. doi: 10.1021/ac0341261. [DOI] [PubMed] [Google Scholar]
- 24.Risques RA, Lai LA, Himmetoglu C, Ebaee A, Li L, Feng Z, Bronner MP, Al-Lahham B, Kowdley KV, Lindor KD, et al. Ulcerative colitis-associated colorectal cancer arises in a field of short telomeres, senescence, and inflammation. Cancer Res. 2011;71:1669–1679. doi: 10.1158/0008-5472.CAN-10-1966. [DOI] [PMC free article] [PubMed] [Google Scholar]
- 25.Lih-Brody L, Powell SR, Collier KP, Reddy GM, Cerchia R, Kahn E, Weissman GS, Katz S, Floyd RA, McKinley MJ, et al. Increased oxidative stress and decreased antioxidant defenses in mucosa of inflammatory bowel disease. Dig Dis Sci. 1996;41:2078–2086. doi: 10.1007/BF02093613. [DOI] [PubMed] [Google Scholar]
- 26.Singer II, Kawka DW, Schloemann S, Tessner T, Riehl T, Stenson WF. Cyclooxygenase 2 is induced in colonic epithelial cells in inflammatory bowel disease. Gastroenterology. 1998;115:297–306. doi: 10.1016/s0016-5085(98)70196-9. [DOI] [PubMed] [Google Scholar]
- 27.Salk JJ, Salipante SJ, Risques RA, Crispin DA, Li L, Bronner MP, Brentnall TA, Rabinovitch PS, Horwitz MS, Loeb LA. Clonal expansions in ulcerative colitis identify patients with neoplasia. Proc Natl Acad Sci USA. 2009;106:20871–20876. doi: 10.1073/pnas.0909428106. [DOI] [PMC free article] [PubMed] [Google Scholar]
- 28.Chen R, Rabinovitch PS, Crispin DA, Emond MJ, Koprowicz KM, Bronner MP, Brentnall TA. DNA fingerprinting abnormalities can distinguish ulcerative colitis patients with dysplasia and cancer from those who are dysplasia/cancer-free. Am J Pathol. 2003;162:665–672. doi: 10.1016/S0002-9440(10)63860-6. [DOI] [PMC free article] [PubMed] [Google Scholar]
- 29.Bronner MP, Culin C, Reed JC, Furth EE. The bcl-2 proto-oncogene and the gastrointestinal epithelial tumor progression model. Am J Pathol. 1995;146:20–26. [PMC free article] [PubMed] [Google Scholar]
- 30.Montesano Gesualdi N, Chirico G, Pirozzi G, Costantino E, Landriscina M, Esposito F. Tumor necrosis factor-associated protein 1 (TRAP-1) protects cells from oxidative stress and apoptosis. Stress. 2007;10:342–350. doi: 10.1080/10253890701314863. [DOI] [PubMed] [Google Scholar]


