

Abstract
In the bone marrow (BM), hematopoietic stem cells (HSCs) lodge in specialized microenvironments that tightly control their proliferative state to adapt to the varying needs for replenishment of blood cells while also preventing exhaustion1. All putative niche cells suggested thus far have a non-hematopoietic origin2-8. Thus, it remains unclear how feedback from mature cells is conveyed to HSCs to adjust proliferation. Here we show that megakaryocytes (Mk) can directly regulate HSC pool size. Three-dimensional whole-mount imaging revealed that endogenous HSCs are frequently located adjacent to Mk in a non-random fashion. Selective in vivo depletion of Mk resulted in specific loss of HSC quiescence and led to a marked expansion of functional HSCs. Gene expression analyses revealed that Mk were the source of chemokine C-X-C motif ligand 4 (Cxcl4, also named platelet factor 4, Pf4) in the BM and Cxcl4 injection reduced HSC numbers via increased quiescence. By contrast, Cxcl4−/− mice exhibited increased HSC numbers and proliferation. Combined use of whole-mount imaging and computational modelling was highly suggestive of a megakaryocytic niche capable of influencing independently HSC maintenance by regulating quiescence. Thus, these results indicate that a terminally differentiated HSC progeny contributes to niche activity by directly regulating HSC behavior.
Recent evidence in somatic stem cells suggests that progenitors can provide niches for their own predecessors9,10. In the Drosophila system, hematopoietic progenitors are negatively regulated by differentiating cells11. Using a whole-mount three-dimensional immunofluorescence imaging technique, which allows one to visualize BM tissues in ∼75 μm thickness (Fig. 1a–c), we observed that Lineage (Lin)− CD48− CD41− CD150+ HSCs are generally located close to Mk with a considerable fraction (20.3 ± 2.6%) lying directly adjacent (Fig. 1b–d and Supplementary Fig. 1). To test for the significance of this association, we ran simulations of random HSC placement on images of whole-mount prepared sternal segments stained for CD41+ Mk to generate a null distribution of mean distances of HSCs with non-preferential localization to Mk (Fig. 1e,f and Supplementary Fig. 2). The observed mean distance of HSCs to Mk was statistically different from the mean distance of randomly placed HSCs (Fig. 1f). Furthermore, we observed only 7.0 ± 0.6% of randomly distributed HSCs adjacent to Mk (Fig. 1d). These data indicate that the observed association of HSCs with Mk is statistically different from random (P = 1.6 × 10⁻¹⁰, Fig. 1e).
Figure 1. Spatial relationships between HSCs and megakaryocytes in the BM.

(a–c) Representative whole-mount images of mouse sternal BM. White arrowheads denote phenotypic Lin− CD48− CD41− CD150+ HSCs. Mk are distinguished by their size, morphology and CD41 expression. Vascular endothelial cells are stained with antibodies against CD31 and CD144. (d,e) Percentages of HSCs in direct contact with a Mk (distance = 0 μm; Student's t-test *P < 0.05) (d) and distances between HSCs and Mk (e) in the sternal BM. Grey bars depict the mean distances between simulated randomly distributed HSCs and Mk and red bars depict actual mean distances between HSCs and Mk observed in situ. n = 252 HSCs. Two-sample Kolmogorov–Smirnov test; P = 1.6 × 10⁻¹⁰. (f) Probability distributions of mean distances from simulations of randomly positioned HSCs on maps of sternal BM in relation to Mk. Mean distances observed in situ (red line) are shown in relation to the grand mean +/− 2 s.d. (solid and dotted lines, respectively). Probability P (μ < 24.7 μm) = 0.0082. Scale bars: 100 μm (a) and 20 μm (b,c).
Previous studies have suggested a role of Mk in regulating HSC function. After transplantation, HSCs home to Mk-rich endosteal areas12-14, and host Mk facilitate donor HSC engraftment after lethal irradiation13. In addition, co-culture with Mk slightly increased HSC numbers ex vivo14. To assess the role of Mk in HSC function in vivo, we generated transgenic mice in which Mk can be depleted using inducible diphtheria toxin receptor (iDTR) expression by intercrossing Cxcl4-cre mice15 with iDTR animals. Time course studies revealed reduction of Mk after one dose of diphtheria toxin (DT) treatment with > 90% reduction after seven daily doses (P < 0.001; Fig. 2a–c and Supplementary Fig. 3), with a concomitant decline of platelets (P < 0.0001; Supplementary Fig. 4). Strikingly, Mk depletion led to a marked expansion in the number of phenotypic Lin− c-kit+ Sca1+ CD105+ CD150+ HSCs up to 11.5-fold at day 7 (P < 0.001; Fig. 2d,e and Supplementary Fig. 3c). We also observed Lin− CD48− CD41− CD150+ HSC expansion in whole-mount BM images (Fig. 2a,b). Hematopoietic cell proliferation was largely restricted to HSCs, but not other progenitors except for a slight increase in multipotent and Mk progenitors (Supplementary Fig. 4c-g). To test the impact of Mk depletion on HSC function, we carried out competitive repopulation analyses (Supplementary Fig. 5a) and observed significantly higher reconstitution (CD45.2+ cells) in mice transplanted with total BM from DT-treated Cxcl4-cre;iDTR mice than in those transplanted with BM from DT-treated control mice throughout the 16 week observation period (Fig. 2f and Supplementary Fig. 5b). Extreme limiting dilution analyses revealed 625 HSCs with repopulating capacity per femur in DT-treated Cxcl4-cre;iDTR mice which was 4.6-fold (P < 0.01) greater than in DT-treated control animals (Fig. 2g). The increased HSC numbers after Mk depletion were likely due to increased proliferation since BrdU incorporation was increased (5.5-fold) in HSCs from Mk-depleted mice compared to control animals (P < 0.001; Fig. 2h,i). Enhanced HSC proliferation was also reflected by increased expression of cyclin-dependent kinase 2 (Cdk2) and cyclin E1 (Ccne1) (Fig. 2j), a complex that promotes the entry into S-phase16 and a corresponding ∼4.3-fold increase of HSCs in non-G0 phases as per Ki67 and Hoechst 33342-based cell cycle analyses (P < 0.05; Supplementary Fig. 5c). Even if ∼50% HSCs exited G0 after Mk depletion (Supplementary Fig. 5c), the absolute number of G0 HSCs was increased by ∼4-fold, which is consistent with the increase in HSCs with repopulating capacity observed in limiting dilution analysis and in accordance with the paradigm that long-term engraftment potential resides predominantly in the G0 fraction of HSCs17. The selective HSC proliferation after Mk depletion (Fig. 2h,i and Supplementary Fig. 4g) argues that this effect is not caused by an inflammatory milieu emanating from Mk death in the marrow. To confirm this issue, we continuously depleted Mk for six consecutive weeks and found that HSCs were still increased (by 2.4-fold) when compared to control mice (Supplementary Fig. 6a–b). However, these HSC numbers were lower when compared to those after one week of Mk depletion (Fig. 2d–g), which may reflect compensatory mechanisms or the possibility of HSC exhaustion which has been seen repetitively following loss of quiescence18-20. Consistent with this possibility, we found only a slight but not significant increase in repopulating activity in Cxcl4-cre;iDTR mice after six consecutive weeks of DT treatment, compared to control mice (Supplementary Fig. 6c). These results suggest that Mk prevent exhaustion by restraining HSC proliferation.
Figure 2. Megakaryocytes maintain quiescence of HSCs in vivo.

(a,b) Representative whole-mount images of sternal BM from control (a) and Cxcl4-cre;iDTR mice (b) after 7 days of DT treatment. Arrowheads denote Lin− CD48− CD41− CD150+ phenotypic HSCs. Mk are distinguished by their size, morphology and CD41 expression. Vascular endothelial cells are stained with antibodies against CD31 and CD144. Scale bars: 50 μm. (c) Quantification of Mk per cross section of whole-mount images of transverse-shaved femoral BM of control and Cxcl4-cre;iDTR mice after 7 days of DT treatment (representative images are shown in Supplementary Fig. 3a). n = 8 cross sections from four male mice. (d,e) Number of HSCs per femur in control and Cxcl4-cre;iDTR mice (d) and representative FACS plots (e). n = 5 male mice per group. (f) Percentage of CD45.2+ cells in the blood of CD45.1+ mice competitively transplanted with total BM cells purified from the mice analysed in d. (g) Extreme limiting dilution analysis showing the estimated HSC frequency (solid bar) and confidence intervals (dashed lines) in the BM of control or Cxcl4-cre;iDTR mice after 7 days of DT treatment. n = 4 (control group) and n = 5 (Cxcl4-cre;iDTR group) female recipient mice per dilution, except for the 0.2% BM dose (control group n = 5 and Cxcl4-cre;iDTR group n = 4). (h,i) Percentage of proliferating HSCs in the BM of control and Cxcl4-cre;iDTR mice (as determined by BrdU incorporation) (h) and representative FACS plots (i). n = 5 male mice per group. (j) Q-PCR analysis of cell cycle-related genes within sorted HSCs. n = 4 independent experiments per group. *P < 0.05, **P < 0.01, ***P < 0.001 (Student's t-test).
A recent report has indicated that platelets may regulate HSC quiescence through circulating thrombopoietin concentration21. Hence, to ascertain whether the dramatic increase of HSCs was mediated by circulating platelets rather than BM Mk, we injected mice with neuraminidase (a glycoside hydrolase enzyme that cleaves the glycosidic linkages of sialic acids on the platelet surface), which depletes platelets without affecting Mk numbers22 (Supplementary Fig. 7a–c). Neuraminidase treatment did not alter HSC numbers (Supplementary Fig. 7e,f), suggesting that Mk, but not platelets, regulate BM HSC quiescence.
Since Mk have been reported to promote expansion of osteolineage cells and thereby indirectly enhance stem cell engraftment after irradiation13, we investigated whether HSC quiescence was maintained indirectly by Mk via stromal components of the HSC niche. After DT treatment of Cxcl4-cre;iDTR;Nes-GFP mice, we found no changes in the number of osteolineage cells in the compact bone (Supplementary Fig. 8a), endothelial cells (Supplementary Fig. 8b), Nestindim cells (which highly overlap with Lepr+ and CD51+ PDGFRα+ perivascular cells5,7,23; Supplementary Fig. 8c) or Nestinbright cells (which ensheath arterioles; Supplementary Fig. 8d)7, suggesting that Mk depletion did not enhance HSC numbers indirectly by altering the endothelial or mesenchymal niche.
To determine the mechanism by which Mk maintain HSC quiescence, we FACS-purified Mk based on CD41 expression and cell size (Fig. 3a). As expected, immunofluorescence analyses of sorted cells revealed CD41+ multinucleated cells (Fig. 3a) enriched for Mk markers including Fli1, Clec2, Gata2 and CD41 (data not shown). We evaluated the expression of various factors that have been shown to play roles in cell quiescence or proliferation by real-time PCR. Among these, Cxcl4 transcripts themselves were by far the most abundant compared to other quiescence or proliferation factors (9.7- to 5.8 × 10⁶-fold increase, P < 0.001; Fig. 3a). Previous studies revealed that Cxcl4 can negatively regulate the proliferation of human and mouse hematopoietic progenitors24-27. In addition, CXCL4 has been shown to reduce the chemosensitivity of human hematopoietic progenitors and mice injected with Cxcl4 prior treatment with 5-fluorouracil or cytarabine (antimetabolites that selectively kill proliferating cells) showed increased hematopoietic recovery27,28. Cxcl4 expression is almost exclusively restricted to Mk and platelets (15 and Fig. 3b) in the BM, where it is stored in α-granules in wild-type (WT) mice, but not Cxcl4−/− mice (Fig. 3b). Indeed, depletion of Mk led to a marked reduction of Cxcl4 in BM extracellular fluids (BMEF) as determined by ELISA (Fig. 3c). These results raise the possibility that Mk may promote HSC quiescence via Cxcl4.
Figure 3. Megakaryocytes control HSC quiescence via Cxcl4.
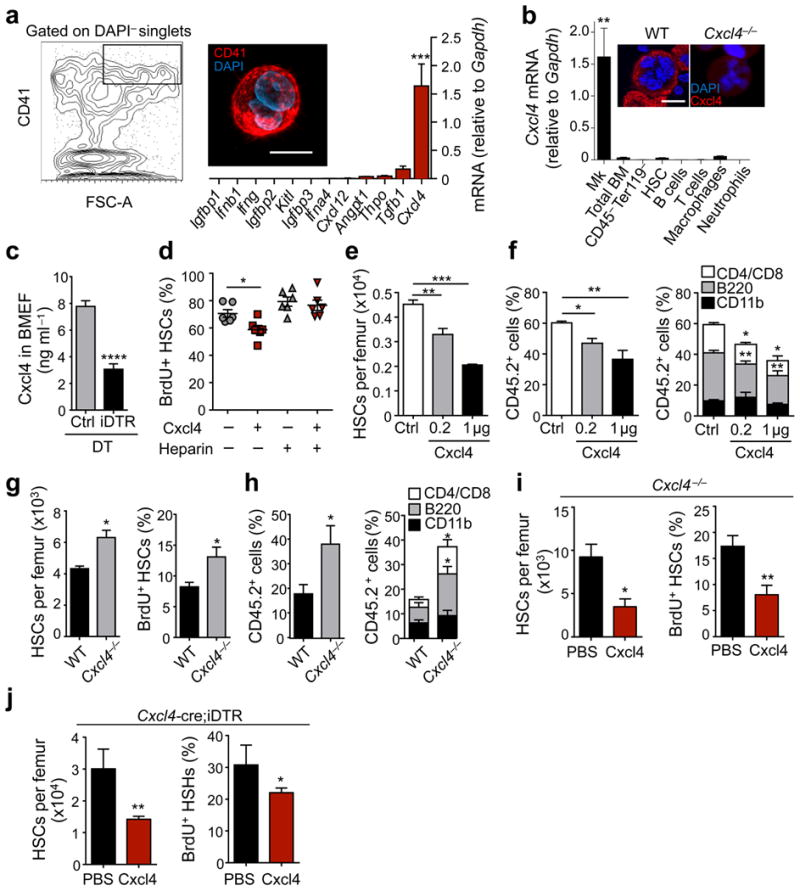
(a) Left, gating strategy for sorting of Mk and immunofluorescence image of a Mk sorted accordingly. Right, Q-PCR analysis of HSC quiescence or proliferation-related genes in Mk. n = 3-7 independent experiments. (b) Bar graphs shows Cxcl4 mRNA levels in BM cell populations. n = 3 samples per cell type, except for Mk (n = 6) and total BM (n = 5). The upper panels show high power images of sorted Mk from C57BL/6 wild-type (WT) and Cxcl4−/− mice stained with anti-Cxcl4 antibody and DAPI. (c) Concentration of Cxcl4 in BMEF of control and Cxcl4-cre;iDTR mice after DT treatment, determined by ELISA. n = 5 independent samples per group. (d) Percentage of proliferating BrdU+ HSCs in cultures of Lineage− cells. (e) Number of HSCs per femur in male mice treated with PBS (n = 5) or 0.2 μg and 1 μg Cxcl4 (n = 4). (f) Percentage of CD45.2+ cells in the blood of CD45.1+ mice competitively transplanted with total BM cells purified from the mice analysed in (e). n = 5 (PBS group and 0.2 μg Cxcl4 group) and n = 4 (1 μg Cxcl4 group) female recipient mice. (g) Number of HSCs per femur and percentage of proliferating HSCs, in WT and Cxcl4−/− mice. n = 3 (WT) and n = 5 (Cxcl4−/−) female mice per group. (h) Percentage of CD45.2+ cells in the blood of CD45.1+ mice competitively transplanted with total BM cells purified from the mice analysed in (g). n = 5 female recipient mice per group. (i,j) Number of HSCs per femur and percentage of proliferating HSCs in the BM of Cxcl4−/− (i) and Cxcl4-cre; iDTR (j) mice injected with either PBS or 1 μg Cxcl4 during seven days. n = 3 (Cxcl4−/−) and n = 4 (Cxcl4-cre;iDTR) male mice per group. *P < 0.05, **P < 0.01, ***P < 0.001, ****P < 0.0001 (Student's t-test). Scale bars: 20 μm.
To evaluate this issue, we performed in vitro experiments in which we found that the addition of recombinant murine Cxcl4 significantly reduced proliferation of cultured HSCs (Fig. 3d). This effect was abolished in the presence of heparin, a known Cxcl4 inhibitor29 (Fig. 3d). In addition, injection of Cxcl4 into C57BL/6 WT mice (Fig. 3e) led to a dose-dependent decrease of HSCs in the BM. This effect was also reflected by a dose-dependent reduction in the engraftment of BMNCs obtained from Cxcl4-treated mice, as seen at 16 weeks post-transplantation (Fig. 3f). In keeping with a key role for Cxcl4 in the regulation of HSC quiescence, we found that the number of native phenotypic HSCs and the fraction of proliferating BrdU+ HSCs were significantly higher in the BM of Cxcl4−/− animals30 compared to WT controls (Fig. 3g). These differences were confirmed by competitive transplantation assays, which revealed increased (2-fold) repopulating activity in Cxcl4−/− BM compared to WT BM (Fig. 3h). To assess whether the HSC phenotype of Cxcl4−/− mice could be rescued, we administered Cxcl4 or vehicle for seven days and found a substantial reduction of HSC numbers and BrdU incorporation by HSCs in Cxcl4-treated animals (Fig. 3i) indicating that Mk-derived Cxcl4 plays a relevant role in regulating HSC quiescence. Still, administration of Cxcl4 alongside Mk depletion in Cxcl4-cre;iDTR mice could only partially rescue HSC numbers and proliferation (Fig. 3j). Given the relatively large number of proteins produced or stored by Mk that putatively impact on HSC quiescence, other factors likely contribute to Mk-mediated HSC quiescence (as shown for Tgfb1 by Zhao et al. in this issue). Whether Cxcl4 could act indirectly on HSCs cannot be formally excluded since the identity of a Cxcl4 receptor on HSCs remains unknown.
Since recent data suggest that a microenvironment surrounding arterioles confers quiescence of both mesenchymal stem cells and HSCs7, we explored the spatial arrangement of the arteriolar and the putative megakaryocytic niche. We first sought to determine whether the association of HSCs with Mk was secondary to an association with arterioles or whether HSCs associate with Mk independently of arterioles. The distances of actual and randomly placed HSCs to arterioles (dart) or to Mk (dMk) (Fig. 4a–d and Supplementary Tables 1–4) were measured on images of whole-mount sternal preparations. In one null model (Random 1), only HSC localization was randomized, whereas in a second null model (Random 2) random placement of both HSCs and Mk was run to remove any potential inherent bias of Mk localization near or far from arterioles (Fig. 4d). The distance distributions of randomly placed HSCs were not biased to either the arterioles or Mk, as expected, in both null models (Fig. 4d). The null model distributions were not statistically different from each other (2D-Kolmogorov-Smirnov (KS test)31,32, P = 0.079). Actual HSCs found in sternal preparations were observed to enrich in two configurations: in the first, 15% of HSCs were within 25 μm dart and dMk, consistent with a niche comprised of both arterioles and Mk (Actual, Fig. 4d). This enrichment was not observed in random models 1 and 2 where only 5.1% and 4.1% of HSCs, respectively, fell into this configuration (compare deep-red bars, Fig. 4d). In the second configuration, 21% of HSCs were localized in close proximity to Mk (< 25 μm), but distant (> 100 μm) from arterioles (Actual, Fig. 4d), suggesting a Mk niche spatially distinct from the arteriolar niche. This configuration was also not seen in random models 1 and 2, (6.3% and 7.5%, respectively; Fig. 4d). The two-dimensional distributions of observed dart and dMk are significantly different from both random models as shown by 2D-KS test (P = 3.1 × 10⁻¹⁷, for Random 1 and P = 6.8 × 10⁻²⁴ for Random 2) and 2D paired KS (2D-2S-KS) test33 (P = 2.9 × 10⁻²⁰ for Random 1 and P = 3.3 × 10⁻²⁹ for Random 2).
Figure 4. Megakaryocytes regulate HSC quiescence independently from arterioles.
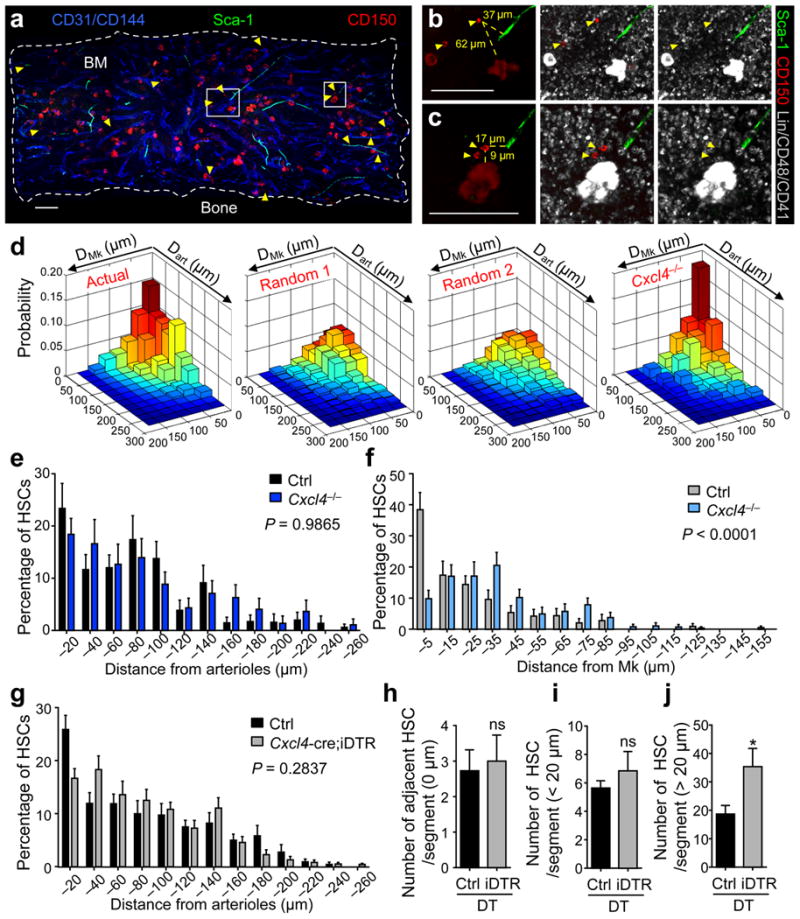
(a–c) Representative whole-mount image of a sternum compartment (a) and magnified high power views (b,c). Arterioles are identified by CD31+ CD144+ Sca-1+ expression. Yellow arrowheads denote Lin− CD48− CD41− CD150+ phenotypic HSCs and Mk are distinguished by their size, morphology and CD41 expression. (b,c) Illustrative images of the measured distances (yellow dashed lines) between HSCs and Mk as well as arterioles in the BM. Scale bars: 100 μm. (d) Two dimensional probability distribution of the distances between HSCs and Mk or arterioles in the sternal BM. From left to right: HSC distribution model in wild-type control animals (Actual; n = 260 HSCs), randomized HSC distribution models generated by computational simulations of random HSC localization (Random 1; n = 1000 HSCs) and random HSC and Mk localizations (Random 2; n = 1000 HSCs) and HSC distribution model in Cxcl4−/− mice (n = 128 HSCs). (e,f) Localization of HSCs relative to arterioles (e) and to Mk (f) in Cxcl4−/− and control mice. Two–sample Kolmogorov-Smirnov test: (e) P = 0.9865 and (f) P < 0.0001. (g) Localization of HSCs relative to arterioles in control (n = 268 HSCs) and Cxcl4-cre;iDTR mice (n = 544 HSCs) after 7 days of DT treatment. Two–sample Kolmogorov-Smirnov test; P = 0.2837. (h–j) Absolute numbers of HSCs adjacent (h; 0 μm), in close proximity (i; <20 μm) and distant from arterioles (j; >20 μm) per sternal segment. The student's t-test was used to determine statistical significance in h–j; *P < 0.05; ns, non-significant.
To assess the role of Cxcl4 in maintaining the Mk niche, we evaluated dart and dMk of HSCs in Cxcl4−/− mice (Fig. 4d). We found that HSCs were enriched within 25 μm of arterioles and Mk in Cxcl4−/− mice (18%, deep-red bar, Cxcl4−/− model, Fig. 4d) suggesting that the bias in proximity to the arteriolar niche was unaltered (P = 0.9865; Fig. 4e). By contrast, only 4.3% of HSCs in Cxcl4−/− mice where located further than 100 μm from arterioles but within 25 μm of Mk (Cxcl4−/− model, Fig. 4d), indicating that HSC associations with Mk distant from arterioles were significantly disturbed (P < 0.0001; Fig. 4f). Consistent with the notion that the association of HSCs to arterioles is independent from the association of HSCs to Mk, neither the distribution of HSCs in relation to arterioles was significantly altered after Mk depletion (P = 0.2837; Fig. 4g), nor was the absolute number of HSCs adjacent to (dart = 0 μm; Fig. 4h and Supplementary Fig. 9a,b) or in close proximity to (dart < 20 μm; Fig. 4i and Supplementary Fig. 9a,b) arterioles. Indeed, after Mk-depletion clusters of HSCs, which are rarely found in control mice, occurred distant from arterioles (dart > 20 μm, P < 0.05; Fig. 4j and Supplementary Fig. 9a,c), suggesting that HSC quiescence away from arterioles depended on the presence of Mk. These results thus suggest the possibility of two spatially and functionally distinct niches maintaining HSC quiescence near Mk and arterioles.
Whereas differentiated progenitors have previously been shown to provide a specialized niche in the intestine9, influence bulge stem cell quiescence in the skin34, or indirectly affect HSC retention in the BM by targeting the stromal niche cells35-37, thus far only cells of non-hematopoietic origin have been implicated as candidate HSC niche cells in the mammalian bone marrow2-8. The present data add further complexity to the HSC niche whereby a terminally differentiated progeny, the Mk, can control its own replenishment via a direct feedback loop (Supplementary Fig. 10). As a subset of HSCs are platelet-biased38, it will be of interest to determine whether the Mk forms a niche for these HSCs, thereby supporting its own lineage. Because Mk are a source of multiple cytokines, it is likely that other factors contribute to Mk-mediated HSC quiescence, as suggested with Tgfb1 in the accompanying paper (Zhao et al.). The role of Cxcl4 in HSC quiescence may have implications in certain malignancies (e.g. myelodysplastic syndromes) where hyperproliferative HSCs are found alongside dysplastic Mk, which secrete reduced amounts of Cxcl439. Further studies will determine the individual functions and interplay of distinct HSC niches, and their implications in disease.
Online Methods
Mice
C57BL/6-Tg(Pf4-cre)Q3Rsko/J (Cxcl4-cre) and C57BL/6‐Gt(ROSA)26Sortm1 (HBEGF)Awai/J(iDTR) mice were purchased from the Jackson laboratory. C57BL/6-CD45.1/2 congenic strains were purchased from the National Cancer Institute. Nes–GFP mice40, Cxcl4-cre;iDTR;Nes-GFP mice and Cxcl4−/− mice30 were bred in our facilities. All experimental procedures were approved by the Animal Care and Use Committees of Albert Einstein College of Medicine.
In vivo treatments
For DT-mediated Mk depletion, 250 ng of DT (Sigma) were injected i.p. every 24 h over 7 days. 0.2 or 1 μg Cxcl4 (PeproTech) and neuraminidase type IV (0.1 U) were injected i.p. every 24 h over 7 days. Mice were analysed accordingly on the day of the last injection.
Preparations, immunofluorescence staining and imaging of whole-mount sternum tissues and frozen sections of the long bones
Whole-mount tissue preparation, immunofluorescence staining and imaging of the sternum and femoral bones were performed as described previously7.
Computational modelling of random HSC localization
Simulation was performed with Matlab software (Mathworks). Images of whole-mount prepared sternal segments were used to generate spatial maps of arterioles and Mk onto which 20 HSCs were randomly placed, consistent with an average density of 20 HSCs/sternal segment sampling field. Thresholds were applied to generate binary maps, followed by median filtering to remove small scatter background to accurately represent arteriole and Mk coverage in simulations. Binary maps of Mk were cleaned using median filtering, and boundaries were defined. Random HSC coordinates were selected from the region within the boundary and the shortest Euclidean distance was calculated for each HSC. In random model 1 (Random 1), each simulated run of 20 randomly placed HSCs was repeated 1000 times on images of arterioles and Mk. In random model 2 (Random 2), each simulated run of 20 randomly placed HSCs, as before, and 135 randomly placed Mk was repeated 1000 times. Distances of randomly placed HSCs to randomly placed Mk were adjusted by subtraction of the mean radius of Mk (15.4 μm). Two-dimensional distance distributions were compared using a modified two-dimensional non-parametric Kolmogorov-Smirnov (2D-KS) test31,32 and a two-dimensional paired Kolmogorov-Smirnov (2D-2S-KS) test33.
Cell sorting and flow cytometry
For isolation of CD41+ Mk, BM cells were culture expanded in DMEM supplemented with 10% FBS, 0.5% penicillin-streptomycin, and 50 ng ml−1 recombinant Thpo over 3 days, enriched in BSA gradient as described41 and isolated by FACS sorting. All cell sorting experiments were performed using an Aria Cell Sorter (BD Biosciences). Flow cytometric analyses were carried out using an LSRII flow cytometer (BD Biosciences). For analysis of Nesdim and Nesbright cells as well as endothelial cells, BM cells were processed, stained and gated as described7. For osteoblastic lineage cell quantification, flushed bones were chopped into small fragments and incubated in 1 mg ml−1 collagenase type I at 37 °C for 90 min and filtered afterwards. Osteoblastic lineage cells were defined as CD45− Ter119− CD31− CD51+ Sca1- as described36. Dead cells and debris were excluded by FSC, SSC and DAPI (4′,6-diamino-2-phenylindole) staining profiles. Data were analysed with FlowJo (Tree Star) or FACS Diva 6.1 software (BD Biosciences).
Antibodies and staining reagents
The following antibodies were used in this study: biotin-anti-Lineage (TER-119, RB6-8C5, RA3-6B2, M1/70, 145-2C11, 1:50 dilution), FITC/PE-anti-CD45.2 (104), FITC/PE/PE-Cy7-anti-Ly6A/E (D7), BV421/PE/PE-Cy7-anti-CD117 (2B8), biotin-anti-CD48 (HM48-1), biotin-anti-CD41 (MWReg30, 1:2500 dilution), APC-Cy7-anti-CD45 (30-F11), Pe-anti-CD51 (RMV-7), Alexa647-anti-VE-cadherin (BV13) APC-anti-CD31 (MEC13.3), FITC/PE/PE-Cy7-anti-CD45.1 (A20), PE-anti-CD150 (TC15-12F12.2), CD41-PerCP-eFluor 710 (MWReg30), Gr-1-FITC/Alexa 647 RB6-8C5), CD4-PE-Cy7 (GK1.5), CD8-PE-Cy7 (53-6.7), CD115-PE (AFS98), APC-eflour780 (RA3-6B2) all from eBioscience. CD16/32-APC-Cy7 (93), CD105-PE-Cy7 (MJ7/18), Ter119-Alexa 700 (Ter 119), F4/80-Alexa 647 (BM8,) were from Biolegend. BrdU-Alexa 647 (3D4, BD Biosciences, 1:50 dilution), Alexa 647-anti-Ki67 (SolA 15) and Hoechst 33342 (Sigma). Unless otherwise specified, all antibodies were used at a 1:100 dilution.
RNA isolation and quantitative real-time-PCR (Q-PCR)
RNA isolation and Q-PCR was performed as described previously7. The sequences of the oligonucleotides used are included in Supplementary Table 5.
Proliferation and cell cycle analyses
For analyses of HSC proliferation per BrdU incorporation, mice received i.p. injections of BrdU (100 μg; BD Biosciences) 48 and 24 h before analysis. Proliferation was determined with the APC-BrdU Flow Kit (BD Biosciences) following the manufacturer's instructions. Cell cycle analysis of HSCs was performed as described previously7.
Cell culture
For in vitro analyses of HSCs, lineage-depleted BMNCs were cultured for 7 days in StemSpan medium (StemCell Technologies) supplemented with Kitl (10 ng ml−1), Fgf1 (10 ng ml−1) and Thpo (20 ng ml−1; all R&D Systems). Recombinant murine Cxcl4 (100 ng ml−1; PeproTech) or vehicle with or without heparin (30 μg ml−1; Sigma) was added to assess Cxcl4-related effects on HSCs. Proliferation of HSCs was determined by adding 10 μl of a 1 mM BrdU solution to the cell cultures, staining and analysis was performed as described above.
Competitive reconstitution
Competitive repopulation assays were performed using the CD45.1/CD45.2 congenic system. Equivalent volumes of BMNCs harvested from Cxcl4-cre;iDTR, Cxcl4−/− mice or C57BL/6 WT mice injected with Cxcl4 and the respective iDTR or control mice (CD45.2+) were transplanted into lethally irradiated (12Gy) CD45.1+ recipients with 0.1−0.25 × 10⁶ competitor CD45.1+ cells. For competitive limiting-dilution assays 0.2, 0.4 and 0.6% of CD45.2+ BMNCs were transplanted together with 0.25 × 10⁶ competitor CD45.1+ cells. Mice showing more than 1% CD45.2+ reconstitution in the myeloid, B-cell and T-cell lineages after 16 weeks were considered engrafted. HSC frequencies and statistical significance were determined using the extreme limiting dilution analysis (ELDA)43.
Statistics
All data are represented as mean ± SEM. Comparisons between two samples were done using the paired and unpaired Student's t tests. One-way ANOVA analyses followed by Tukey's multiple comparison tests were used for multiple group comparisons. Statistical analyses were performed with GraphPad Prism. *P < 0.05, **P < 0.01, ***P < 0.001.
Supplementary Material
Acknowledgments
We thank C. Prophete and P. Ciero for mouse husbandry and L. Tesfa, O. Uche and J. Zhang for technical assistance with sorting. I.B. was supported by the ASH-EHA research exchange award and the University of Düsseldorf, S.P. is a New York Stem Cell Foundation-Druckenmiller Fellow, J.A. was supported by the Integrated Training in Pharmacological Science program, NIGMS T32 063754. This work was supported by the New York State Department of Health (NYSTEM Program) and by grants from the National Institutes of Health (NIH; R01 grants DK056638 and HL069438 to P.S.F., CA164468 and DA033788 to A.B., and P01 HL110860 and U01 HL099656 to M.P.
Footnotes
Supplementary Information is linked to the online version of the paper at www.nature.com/nm
Author Contributions: I.B., D.L. and S.P. designed the study, performed the majority of the experiments and analyzed data; J.A. and A.B. performed computational modelling and statistical analysis of the data; M.P.L. performed imaging of Cxcl4 in Mk and provided mice; C.S. and Y.K. contributed to the processing and imaging of whole-mount BM tissues; L.S. genotyped mice; M.P provided mice and interpreted data; P.S.F. supervised the study. I.B., D.L., S.P. and P.S.F. wrote the manuscript. All authors discussed the results and commented on the manuscript.
Author Information: The authors declare no competing financial interests.
References
- 1.Orford KW, Scadden DT. Deconstructing stem cell self-renewal: genetic insights into cell-cycle regulation. Nat Rev Genet. 2008;9:115–128. doi: 10.1038/nrg2269. [DOI] [PubMed] [Google Scholar]
- 2.Bianco P. Bone and the hematopoietic niche: a tale of two stem cells. Blood. 2011;117:5281–5288. doi: 10.1182/blood-2011-01-315069. [DOI] [PubMed] [Google Scholar]
- 3.Mercier FE, Ragu C, Scadden DT. The bone marrow at the crossroads of blood and immunity. Nat Rev Immunol. 2012;12:49–60. doi: 10.1038/nri3132. [DOI] [PMC free article] [PubMed] [Google Scholar]
- 4.Yamazaki S, et al. Nonmyelinating schwann cells maintain hematopoietic stem cell hibernation in the bone marrow niche. Cell. 2011;147:1146–1158. doi: 10.1016/j.cell.2011.09.053. [DOI] [PubMed] [Google Scholar]
- 5.Ding L, Saunders TL, Enikolopov G, Morrison SJ. Endothelial and perivascular cells maintain haematopoietic stem cells. Nature. 2012;481:457–462. doi: 10.1038/nature10783. [DOI] [PMC free article] [PubMed] [Google Scholar]
- 6.Frenette PS, Pinho S, Lucas D, Scheiermann C. Mesenchymal stem cell: keystone of the hematopoietic stem cell niche and a stepping-stone for regenerative medicine. Annu Rev Immunol. 2013;31:285–316. doi: 10.1146/annurev-immunol-032712-095919. [DOI] [PubMed] [Google Scholar]
- 7.Kunisaki Y, et al. Arteriolar niches maintain haematopoietic stem cell quiescence. Nature. 2013;502:637–643. doi: 10.1038/nature12612. [DOI] [PMC free article] [PubMed] [Google Scholar]
- 8.Omatsu Y, et al. The essential functions of adipo-osteogenic progenitors as the hematopoietic stem and progenitor cell niche. Immunity. 2010;33:387–399. doi: 10.1016/j.immuni.2010.08.017. [DOI] [PubMed] [Google Scholar]
- 9.Sato T, et al. Paneth cells constitute the niche for Lgr5 stem cells in intestinal crypts. Nature. 2011;469:415–418. doi: 10.1038/nature09637. [DOI] [PMC free article] [PubMed] [Google Scholar]
- 10.Voog J, D'Alterio C, Jones DL. Multipotent somatic stem cells contribute to the stem cell niche in the Drosophila testis. Nature. 2008;454:1132–1136. doi: 10.1038/nature07173. [DOI] [PMC free article] [PubMed] [Google Scholar]
- 11.Mondal BC, et al. Interaction between differentiating cell- and niche-derived signals in hematopoietic progenitor maintenance. Cell. 2011;147:1589–1600. doi: 10.1016/j.cell.2011.11.041. [DOI] [PMC free article] [PubMed] [Google Scholar]
- 12.Dominici M, et al. Restoration and reversible expansion of the osteoblastic hematopoietic stem cell niche after marrow radioablation. Blood. 2009;114:2333–2343. doi: 10.1182/blood-2008-10-183459. [DOI] [PMC free article] [PubMed] [Google Scholar]
- 13.Olson TS, et al. Megakaryocytes promote murine osteoblastic HSC niche expansion and stem cell engraftment after radioablative conditioning. Blood. 2013;121:5238–5249. doi: 10.1182/blood-2012-10-463414. [DOI] [PMC free article] [PubMed] [Google Scholar]
- 14.Heazlewood SY, et al. Megakaryocytes co-localise with hemopoietic stem cells and release cytokines that up-regulate stem cell proliferation. Stem Cell Res. 2013;11:782–792. doi: 10.1016/j.scr.2013.05.007. [DOI] [PubMed] [Google Scholar]
- 15.Tiedt R, Schomber T, Hao-Shen H, Skoda RC. Pf4-Cre transgenic mice allow the generation of lineage-restricted gene knockouts for studying megakaryocyte and platelet function in vivo. Blood. 2007;109:1503–1506. doi: 10.1182/blood-2006-04-020362. [DOI] [PubMed] [Google Scholar]
- 16.Minella AC, et al. Cyclin E phosphorylation regulates cell proliferation in hematopoietic and epithelial lineages in vivo. Genes Dev. 2008;22:1677–1689. doi: 10.1101/gad.1650208. [DOI] [PMC free article] [PubMed] [Google Scholar]
- 17.Passegue E, Wagers AJ, Giuriato S, Anderson WC, Weissman IL. Global analysis of proliferation and cell cycle gene expression in the regulation of hematopoietic stem and progenitor cell fates. The Journal of experimental medicine. 2005;202:1599–1611. doi: 10.1084/jem.20050967. [DOI] [PMC free article] [PubMed] [Google Scholar]
- 18.Ito K, et al. PML targeting eradicates quiescent leukaemia-initiating cells. Nature. 2008;453:1072–1078. doi: 10.1038/nature07016. [DOI] [PMC free article] [PubMed] [Google Scholar]
- 19.Essers MA, et al. IFNalpha activates dormant haematopoietic stem cells in vivo. Nature. 2009;458:904–908. doi: 10.1038/nature07815. [DOI] [PubMed] [Google Scholar]
- 20.Sato T, et al. Interferon regulatory factor-2 protects quiescent hematopoietic stem cells from type I interferon-dependent exhaustion. Nat Med. 2009;15:696–700. doi: 10.1038/nm.1973. [DOI] [PubMed] [Google Scholar]
- 21.de Graaf CA, et al. Regulation of hematopoietic stem cells by their mature progeny. Proc Natl Acad Sci U S A. 2010;107:21689–21694. doi: 10.1073/pnas.1016166108. [DOI] [PMC free article] [PubMed] [Google Scholar]
- 22.Stenberg PE, Levin J, Baker G, Mok Y, Corash L. Neuraminidase-induced thrombocytopenia in mice: effects on thrombopoiesis. J Cell Physiol. 1991;147:7–16. doi: 10.1002/jcp.1041470103. [DOI] [PubMed] [Google Scholar]
- 23.Pinho S, et al. PDGFRalpha and CD51 mark human nestin+ sphere-forming mesenchymal stem cells capable of hematopoietic progenitor cell expansion. The Journal of experimental medicine. 2013;210:1351–1367. doi: 10.1084/jem.20122252. [DOI] [PMC free article] [PubMed] [Google Scholar]
- 24.Broxmeyer HE, et al. Comparative analysis of the human macrophage inflammatory protein family of cytokines (chemokines) on proliferation of human myeloid progenitor cells. Interacting effects involving suppression, synergistic suppression, and blocking of suppression. J Immunol. 1993;150:3448–3458. [PubMed] [Google Scholar]
- 25.Lu L, et al. Comparative effects of suppressive cytokines on isolated single CD34(3+) stem/progenitor cells from human bone marrow and umbilical cord blood plated with and without serum. Exp Hematol. 1993;21:1442–1446. [PubMed] [Google Scholar]
- 26.Han ZC, Sensebe L, Abgrall JF, Briere J. Platelet factor 4 inhibits human megakaryocytopoiesis in vitro. Blood. 1990;75:1234–1239. [PubMed] [Google Scholar]
- 27.Broxmeyer HE, et al. Synergistic inhibition in vivo of bone marrow myeloid progenitors by myelosuppressive chemokines and chemokine-accelerated recovery of progenitors after treatment of mice with Ara-C. Exp Hematol. 2006;34:1069–1077. doi: 10.1016/j.exphem.2006.04.007. [DOI] [PubMed] [Google Scholar]
- 28.Han ZC, et al. Platelet factor 4 and other CXC chemokines support the survival of normal hematopoietic cells and reduce the chemosensitivity of cells to cytotoxic agents. Blood. 1997;89:2328–2335. [PubMed] [Google Scholar]
- 29.Maione TE, et al. Inhibition of angiogenesis by recombinant human platelet factor-4 and related peptides. Science. 1990;247:77–79. doi: 10.1126/science.1688470. [DOI] [PubMed] [Google Scholar]
- 30.Eslin DE, et al. Transgenic mice studies demonstrate a role for platelet factor 4 in thrombosis: dissociation between anticoagulant and antithrombotic effect of heparin. Blood. 2004;104:3173–3180. doi: 10.1182/blood-2003-11-3994. [DOI] [PubMed] [Google Scholar]
- 31.Fasano G, Franceschini A. A multidimensional version of the Kolmogorov-Smirnov test. Monthly Notices of the Royal Astronomical Society. 1987;225:155–170. [Google Scholar]
- 32.Press WH, Numerical Recipes Software (Firm) Numerical recipes in C. 1 computer disk 3 1/2 in. Cambridge University Press; Cambridge England ; New York, N.Y.: 1992. [Google Scholar]
- 33.Peacock JA. Two-dimensional goodness-of-fit testing in astronomy. Monthly Notices of the Royal Astronomical Society. 1983;202:615–627. [Google Scholar]
- 34.Hsu YC, Pasolli HA, Fuchs E. Dynamics between stem cells, niche, and progeny in the hair follicle. Cell. 2011;144:92–105. doi: 10.1016/j.cell.2010.11.049. [DOI] [PMC free article] [PubMed] [Google Scholar]
- 35.Chow A, et al. Bone marrow CD169+ macrophages promote the retention of hematopoietic stem and progenitor cells in the mesenchymal stem cell niche. The Journal of experimental medicine. 2011;208:261–271. doi: 10.1084/jem.20101688. [DOI] [PMC free article] [PubMed] [Google Scholar]
- 36.Winkler IG, et al. Bone marrow macrophages maintain hematopoietic stem cell (HSC) niches and their depletion mobilizes HSCs. Blood. 2010;116:4815–4828. doi: 10.1182/blood-2009-11-253534. [DOI] [PubMed] [Google Scholar]
- 37.Christopher MJ, Rao M, Liu F, Woloszynek JR, Link DC. Expression of the G-CSF receptor in monocytic cells is sufficient to mediate hematopoietic progenitor mobilization by G-CSF in mice. The Journal of experimental medicine. 2011;208:251–260. doi: 10.1084/jem.20101700. [DOI] [PMC free article] [PubMed] [Google Scholar]
- 38.Sanjuan-Pla A, et al. Platelet-biased stem cells reside at the apex of the haematopoietic stem-cell hierarchy. Nature. 2013 doi: 10.1038/nature12495. [DOI] [PubMed] [Google Scholar]
- 39.Aivado M, et al. Serum proteome profiling detects myelodysplastic syndromes and identifies CXC chemokine ligands 4 and 7 as markers for advanced disease. Proc Natl Acad Sci U S A. 2007;104:1307–1312. doi: 10.1073/pnas.0610330104. [DOI] [PMC free article] [PubMed] [Google Scholar]
- 40.Mignone JL, Kukekov V, Chiang AS, Steindler D, Enikolopov G. Neural stem and progenitor cells in nestin-GFP transgenic mice. J Comp Neurol. 2004;469:311–324. doi: 10.1002/cne.10964. [DOI] [PubMed] [Google Scholar]
- 41.Shivdasani RA, Schulze H. Culture, expansion, and differentiation of murine megakaryocytes. Curr Protoc Immunol. 2005;Chapter 22(Unit 22F):26. doi: 10.1002/0471142735.im22f06s67. [DOI] [PubMed] [Google Scholar]
Associated Data
This section collects any data citations, data availability statements, or supplementary materials included in this article.