

Nuclear BRCA2 is oligomeric and associated with RAD51, possibly sequestering it until it is delivered to DNA damage sites.
Abstract
Genome maintenance by homologous recombination depends on coordinating many proteins in time and space to assemble at DNA break sites. To understand this process, we followed the mobility of BRCA2, a critical recombination mediator, in live cells at the single-molecule level using both single-particle tracking and fluorescence correlation spectroscopy. BRCA2-GFP and -YFP were compared to distinguish diffusion from fluorophore behavior. Diffusive behavior of fluorescent RAD51 and RAD54 was determined for comparison. All fluorescent proteins were expressed from endogenous loci. We found that nuclear BRCA2 existed in oligomeric clusters, and exhibited heterogeneous mobility. DNA damage increased BRCA2 transient binding, presumably including binding to damaged sites. Despite its very different size, RAD51 displayed mobility similar to BRCA2, which indicates physical interaction between these proteins both before and after induction of DNA damage. We propose that BRCA2-mediated sequestration of nuclear RAD51 serves to prevent inappropriate DNA interactions and that all RAD51 is delivered to DNA damage sites in association with BRCA2.
Introduction
The tumor suppressor BRCA2 is a key protein orchestrating DNA repair by homologous recombination (HR; Heyer et al., 2010). As such, BRCA2 interacts with numerous other proteins, including RAD51 and PALB2, as well as with single-stranded (ss) and double-stranded (ds) DNA (Siaud et al., 2011). BRCA2 plays an important role in replacing RAD51 in exchange for RPA on ssDNA, promoting the key RAD51-mediated strand exchange reaction of HR (Jensen et al., 2010; Liu et al., 2010; Thorslund et al., 2010). Like other HR repair proteins, BRCA2 accumulates into high local concentrations commonly called damage-induced foci in response to DNA damage. The mechanisms promoting this high local concentration and accumulation are not well defined but likely involve transient and more stable binding to immobile elements in the nucleus.
To define how proteins such as BRCA2 arrive at the needed nuclear location at the right time, we set out to follow in vivo diffusive behavior directly using a combination of methods. The mobility of individual components in live cells can be investigated by fluorescence correlation spectroscopy (FCS; Haustein and Schwille, 2007) and single-particle tracking (SPT; Jaqaman et al., 2008; Chenouard et al., 2014). FCS depends strongly on mathematical models and their interpretation to derive values for diffusive behavior. SPT monitors the trajectories of true single particles, directly revealing their heterogeneous behavior with transitions and binding events. Observing individual molecular entities by SPT in living mammalian cells requires methods such as total internal reflection fluorescence (TIRF) or oblique laser illumination microscopy (Tokunaga et al., 2008) that effectively reduce background fluorescence. TIRF is effectively applied to describe diffusion of membrane proteins, but because the nucleus is largely inaccessible by this method there are only a few reports of nuclear components analyzed by SPT (Grünwald et al., 2008; Mazza et al., 2012; Van Royen et al., 2014). We applied SPT to determine the functional behavior of nuclear BRCA2. This allowed us to separately determine the frequency at which proteins become immobile and the duration of immobilization for individual proteins, which could both contribute to accumulation in DNA damage–induced nuclear foci.
Because endogenous expression levels are essential to maintain function based on concentration-dependent interactions, we created BRCA2-GFP knock-in embryonic stem (ES) cell lines for in vivo SPT. GFP-tagged RAD51 and RAD54 were also expressed from endogenous loci in the work described here. Endogenous expression is particularly important for RAD51 and BRCA2, whose expression levels appear to be coordinated in vivo (Magwood et al., 2013). The endogenous BRCA2 concentration is sufficiently low such that individual fluorescent BRCA2 particles can be detected as diffraction-limited spots without additional photo-physical manipulation. Using oblique laser illumination (Tokunaga et al., 2008) in combination with SPT (Jaqaman et al., 2008), we could follow single GFP-tagged BRCA2 particles in live mouse ES cells and characterize their heterogeneous mobile behavior.
BRCA2 assures that RAD51 is in the right place in several distinct ways; BRCA2 is involved in nuclear localization of RAD51 (Davies et al., 2001; Jeyasekharan et al., 2013), BRCA2 is needed for concentration of RAD51 in foci at sites of DNA damage (Chen et al., 1999), BRCA2 specifically delivers RAD51 to replace RPA on DNA breaks (Jensen et al., 2010; Liu et al., 2010; Thorslund et al., 2010), and BRCA2 is involved with RAD51 in stabilizing stalled replication forks (Schlacher et al., 2011). Therefore, it is essential to know how these proteins move about the nucleus, how their movement is affected by DNA damage induction, and to what extent their behavior is coordinated. Including fluorescent tags with distinct photo-physical properties and applying multiple quantitative imaging methods compared with simulations provided a consistent description of BRCA2 diffusive behavior and revealed new details. Both single-molecule bleaching step analysis (Kerssemakers et al., 2006; Ulbrich and Isacoff, 2007) and FCS indicated that BRCA2 moves about the nucleus as multimeric clusters. SPT revealed remarkable heterogeneity in the behavior of BRCA2, including transient binding on the time scale of several hundreds of milliseconds, which was confirmed by FCS and simulations. DNA damage induction caused both an increase in the number of bound BRCA2 and in the time bound. RAD51 moved in the nucleus just like BRCA2, indicating that the two proteins travel in the same complex. Indeed, the detected RAD51 was either immobile or diffusing with the same properties as BRCA2, which indicates that there is little or no free RAD51 in the nucleus of these cells. We discuss the implications of this observation for RAD51 assembly onto DNA for HR repair. The sensitivity of this approach and the ability to generate protein variants expressed from endogenous loci will enable dissecting the events driving DNA damage–induced foci formation and required for DNA repair (Agarwal et al., 2011).
Results
Fluorescent fusion of endogenous BRCA2 for live cell imaging
We used gene targeting with a promoterless cassette to produce Brca2GFP/GFP mouse ES cell lines such that EGFP is added to the end of the Brca2 coding sequence (Fig. S1, A and B), performed Southern and Western blotting (Fig. S1, C and D), and compared them to parental cells in a series of functional assays (Fig. S1, E–H). Brca2GPF/GFP cells were not impaired in HR efficiency as measured by the gene-targeting assay at the Rad54 locus (Abraham et al., 2003; mean targeting efficiency ± SEM: 46.5 ± 6.0% and 25.1 ± 4.5% for Brca2GPF/GFP and Brca2WT/WT cells, respectively). Additionally, Brca2GPF/GFP cells were similar to Brca2WT/WT in the sensitivity to ionizing radiation (IR), cisplatin, and a PARP inhibitor PJ-34 (Fig. S1 E). FACS analysis of the Brca2GFP/GFP cells revealed increasing levels of BRCA2-GFP through S-phase peaking in G2/M (Fig. S1 F), matching the tight cell cycle dependence of the BRCA2 expression described previously (Vaughn et al., 1996). Mass-spectrometric analysis of the proteins coprecipitated with BRCA2-GFP identified with high confidence most known BRCA2 interaction partners, including RAD51, PALB2, and MORF4L1 (Table S1). BRCA2-GFP formed IR-induced foci, which colocalized with Trp53BP1 (Fig. S1, G and H). IR-induced RAD51 foci formation in the Brca2GFP/GFP cells was also normal (Fig. S2). We conclude that the BRCA2-GFP fusion produced was active in HR repair.
Detecting and tracking individual fluorescent particles in living cells
Using oblique laser illumination, mobile particles with diffraction-limited fluorescence signal (250 nm full width at half maximum) were detected in the Brca2GFP/GFP and Brca2GFP/WT cell lines; no such unambiguous detections were made in Brca2WT/WT cells (Fig. 1 A and Video 1). We developed a method for removing false detections, such as those found in cell-free areas or Brca2WT/WT cell nuclei, to distil signals that arise indeed from GFP-tagged protein (Fig. 1 B and Fig. S3 A). Given our image acquisition and particle tracking parameters, the largest possible diffusion constant D of the tracked BRCA2-GFP particles would theoretically be 3.0 µm2/s. Faster-diffusing species would not produce diffraction-limited spots. This routine allowed sensitive detection and quantitative characterization of (transient) binding (Fig. 2, A and B).
Figure 1.
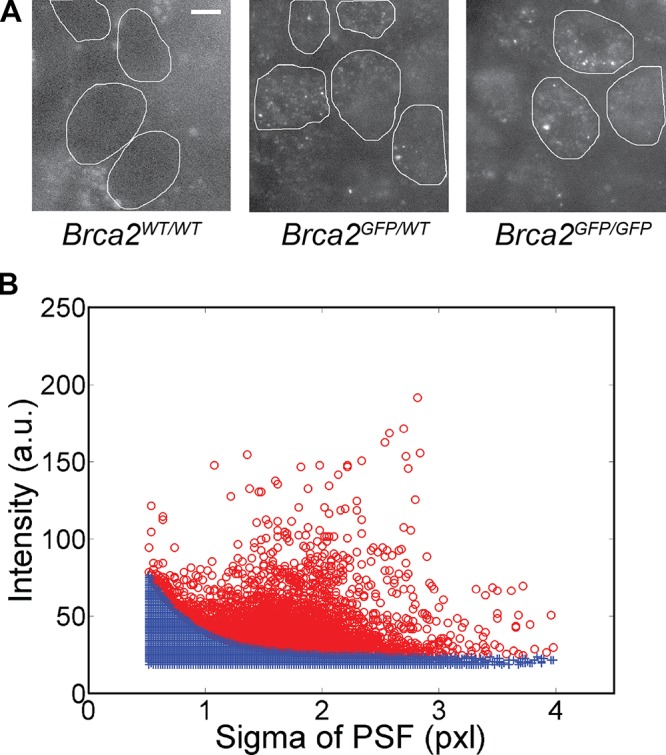
Single-molecule detections in live cells can be clearly identified. (A) Oblique laser illumination fluorescence images of the wild-type ES cells (Brca2WT/WT) and the heterozygous and homozygous Brca2-GFP knock-in cells. The nuclei of Brca2-GFP knock-in cells contain low-fluorescent diffusing and highly fluorescent bound particles. Brca2WT/WT cell nuclei lack a distinct fluorescence signal. Cell nuclei were manually demarcated based on bright-field and fluorescence images and are indicated by white lines. Bar, 5 µm. (B) Each detected pixel area above background was fitted with a 2D Gaussian PSF characterized by a sigma and an intensity value, here based on 8-bit images. The intensity-sigma data pairs were plotted for all detections from one image stack. The data shown are representative of multiple experimental repeats (the number of individual stacks is >200). Camera noise contributes false detections (blue crosses), also found in Brca2WT/WT cell nuclei and outside cell nuclei, which lie below an approximated exponential curve derived from this raw data (see Fig. S3 A). Remaining true detections are displayed as red circles. One pixel is 70 nm.
Figure 2.

BRCA2 displays heterogeneous mobility. (A) An image sequence showing diffusion of two BRCA2 particles, coming from an area above or below the observed focal plane, with transient binding. Individual frames are separated by 50 ms. (B) Tracked BRCA2 particle trajectories from the sequence in A are displayed as yellow lines superimposed on the 14th frame. (C) Other BRCA2 tracks representative of mobile or bound species. Bars, 0.5 µm. (D and F) The histograms show all particle jumps r from tracks classified as either bound (D) or mobile (F), respectively. (E and G) From these histograms, CDFs, normalized between 1 and 0 and displayed as decay, were derived and subjected to fitting with three components. The blue and red lines represent raw and fitted data, respectively. The data shown, obtained under nondamaged conditions, are representative of multiple experimental repeats (n > 10). Each dataset is based on at least 20 cells.
Defining mobile and bound behavior of BRCA2
Individual tracked particles were classified as mobile or immobile based on a cutoff value of 200 nm for total displacement. Hereafter, we refer to immobile BRCA2 particles as bound. The bound track type likely represented interactions of BRCA2 with relatively stationary nuclear objects, such as chromosomes and chromatin-associated components. For mobile BRCA2-GFP particles, 3D diffusion limits observation to a few frames unless the particles also had transient interactions (Fig. 2, A–C). To determine apparent diffusion constants Dapp from the combined BRCA2 tracking data, we assume that the mean behavior of multiple particles observed over a brief period is representative of longtime observation of a single particle (He et al., 2008). The particle jump distribution for immobile and mobile track type (Fig. 2, D and F, respectively) was analyzed by fitting the cumulative distribution function (CDF) to yield a Dapp of Di with amplitude Ai summarized in Table 1. The apparent “mobility” components below Di = 0.1 µm2/s indicate a bound state where BRCA2 is presumably bound to nuclear structures that retain some mobility due to restricted Brownian motion. The third and smallest component D3 = 0.002 µm2/s stems from camera noise and mechanical fluctuations, as these values were also detected for fluorescent beads immobilized on coverslips (Fig. S3 B and Table S2). The mobility component D1 = 0.84 µm2/s (5% of particle jumps for immobile tracks) was due to bound BRCA2-GFP particles that become mobile (for one or two steps) during the observation period, or vice versa. The mobile BRCA2 particles had a Dapp of D1 = 1.44 µm2/s. Even mobile particles were transiently bound for ∼50% of the time. The percentage of different mobility components is a read-out for the extent of transient BRCA2 interactions in nuclei.
Table 1.
Summary of the CDF diffusion analysis results for tracked BRCA2-GFP particles in live, untreated Brca2GFP/GFP cells
| Type | D1 | A1 | D2 | A2 | D3 | A3 | σ |
| µm2/s | % | µm2/s | % | µm2/s | % | µm | |
| 1 (bound) | 0.84 | 5.4 | 0.032 | 36.1 | 0.002 | 58.5 | 0.008 |
| 2 (mobile) | 1.44 | 50.0 | 0.064 | 33.9 | 0.002 | 16.1 | 0.011 |
BRCA2 behavior was also analyzed in a different cell type to test generality. We engineered HeLa cell lines stably expressing full-length human BRCA2 fused with EGFP at either the N or C terminus, along with the endogenous BRCA2 protein. Despite the numerous differences in the origin of the cells (human vs. mouse, transformed vs. ES), mode of expression (ectopic vs. knock-in), and the presence of the untagged protein, qualitatively, GFP-BRCA2 and BRCA2-GFP proteins in HeLa cells displayed the same diffusive behavior as observed in ES cells (Videos 2 and 3). This indicates that the general properties of BRCA2 fusion protein mobility in vivo are not associated solely with ES cells.
Frequent transient binding by BRCA2 confirmed by simulations and FCS
3D particle movement is projected into 2D for SPT, both limiting the time a particle can be followed and affecting the monitored tracked segments (van den Wildenberg et al., 2011). To disentangle these effects, we performed simulations in 3D with synthetic data, convolved with a point spread function (PSF) matching the microscope used, generated using (variable) diffusion values similar to those obtained experimentally. We obtained theoretical particle jump histograms that matched our data for mobile tracks using D = 2 µm2/s only when we included transient binding events characterized by time constants of τB = 40 ms and τF = 30 ms for the bound and freely mobile states, respectively (Fig. S4). A slower diffusion constant of D = 0.4 µm2/s without any binding events (τB = 0 ms) in the simulations produced particle jump histograms that deviated significantly from the measured data (Fig. S4). Thus, transient interactions on the order of 20–40 ms had to be included to match the simulations with our data, indicating that nuclear BRCA2 is frequently immobile. This has important implications for the interpretation of FCS data presented in the following section.
The behavior of BRCA2 in living cells has been described using FCS (Jeyasekharan et al., 2010). To directly compare results from this method with SPT, we performed FCS on our cell lines. To discriminate protein diffusion and binding events from the photo-physical behavior of the fluorescent proteins, we first performed FCS on free nuclear GFP or YFP expressed at low levels in ES cells (Fig. 3). The identical size but different blinking rates of GFP and YFP were used to eliminate the possible confounding influence of blinking in FCS analysis. For GFP, blinking and diffusion rates are so similar that their time decay component cannot be resolved, resulting in a single component of 330 µs (reflecting both processes), correlating with a pseudo-diffusion constant of 33.3 µm2/s also found by others (Haupts et al., 1998). Because of its different blinking behavior, YFP displays two main autocorrelation function (ACF) decay components, one at 87 µs (50%), which is characteristic of blinking, and the other at 641 µs (46.5%), which is characteristic of diffusion for a protein of this size (within the accuracy allowed by this method, not separable from the 330 µs resulting from the mixed diffusion/blinking components of GFP). Hence, any GFP-tagged protein will give a decay component for blinking that makes FCS measurements of diffusion in the range of 300–650 µs ambiguous.
Figure 3.

Mobility of BRCA2 fusion proteins determined by FCS. (A) Autocorrelation curves C(τ) were fitted with a three-component model, for ES cells with homozygous BRCA2-GFP and BRCA2-YFP knock-ins and for ES cells transiently expressing GFP and YFP, as indicated by color. Raw and fitted data are shown as solid and broken lines, respectively. ACF curves were postnormalized between 1 and 2 for better comparison of the diffusion characteristics, but the residuals were left unchanged. (B) The intensity fluctuation raw data and the photon counting histograms are displayed for cells transiently expressing GFP at a low concentration and Brca2-GFP homozygous knock-in cells, using an integration time of 4 ms. Although the photon counting histogram for GFP-expressing cells is symmetric, the histogram for BRCA2-GFP is skewed, suggesting a heterogeneous BRCA2-GFP population consisting of BRCA2 oligomers with varying protein number. The data shown are representative of multiple experimental repeats (n = 10 cells).
For comparison in FCS, we engineered Brca2YFP/YFP cells, which, except for the fluorophore, are identical to the Brca2GFP/GFP cells (Fig. S1 E). For FCS analysis of these Brca2YFP/YFP and Brca2GFP/GFP cells, we fixed the ACF component due to blinking of G/YFP to the values measured earlier and at 50 ± 5%. The remaining free mobility components were fitted to decay constants of 27.3 ms (49%) for BRCA2-GFP and to 5.4 ms (43%) for BRCA2-YFP, corresponding to Dapp of 0.45 and 2.0 µm2/s, respectively. We attribute the obvious discrepancy to different fluorophore properties, such as differences in bleaching and chromophore maturation rates (Schwille et al., 2000; Nagai et al., 2002). Importantly, neither BRCA2 fusion included fast-diffusing species, with decay constants in the range of 300–650 µs (corresponding to 15.4–33.3 µm2/s), even when we force fitted the ACF curves in this range. The FCS data are in good agreement with other published data (Jeyasekharan et al., 2010) on a BRCA2-GFP fusion protein in chicken DT40 cells. However, by comparing YFP, GFP, and respective fusion proteins directly, we note that detection of apparent fast diffusing BRCA2 could be caused by GFP blinking. An increase in this component (Jeyasekharan et al., 2010) could be explained by GFP-tagged proteins being more frequently immobile in the detection volume. It is also possible that BRCA2 behaves differently in DT40 cells compared with mouse ES cells. We did not detect fast-diffusing BRCA2 species in the BRCA2-YFP cell line, where the timing of this process is well separated from fluorescent protein blinking, and conclude that only slowly diffusing BRCA2 particles (D < 2 µm2/s) are present in our ES cells. Because transient binding was observed in our SPT data and was needed to produce accurate simulations, we interpret the ACF time component of 27.3 ms (0.45 µm2/s) as including transient binding rather than diffusion only.
BRCA2 and RAD51 display similar diffusion behavior
We compared the behavior of BRCA2 with two additional HR proteins. Both Rad51GFP/WT and Rad54GFP/− ES cells were similarly analyzed by SPT (Videos 1, 4, and 5). Although tagged versions of RAD51 do not maintain full function, this RAD51-GFP fusion interacts with BRCA2 and compensates for loss of RAD51 in cell survival (Yu et al., 2003). The Rad54GFP/− cells display normal DNA damage sensitivity and HR functions (Agarwal et al., 2011). Both RAD51 and RAD54 differ from BRCA2 significantly in molecular weight, and thus we expected diffusion of monomeric forms. RAD51, but not RAD54, can interact directly with BRCA2. As expected from known nuclear behavior (Agarwal et al., 2011), RAD54 displayed local accumulations in spontaneous foci in a background of uniform nuclear fluorescence, caused by fast diffusing protein. Individual RAD54-GFP particles with diffusion behavior similar to BRCA2 were not observed. Only immobile RAD54 particles could be tracked as displayed in the 2D histogram of protein mobility (Fig. 4 A). These 2D histograms represent the relative proportion of time that the tracked particles spent in the mobile and bound state. Based on molecular weight, RAD51 is much smaller than BRCA2 and could display fast diffusion. However, we observed RAD51 behavior similar to BRCA2, with transient binding and an overall low mobility (Fig. 4 A).
Figure 4.

BRCA2 and RAD51 display similar diffusive behavior in live cells that is disrupted by BRC3 overexpression. (A, top) Oblique illumination images of live cells expressing BRCA2-GFP, RAD51-GFP, and RAD54-GFP. Slowly diffusing particles were detected for both BRCA2 and RAD51. RAD54 was detected only as immobile clusters. Bars, 5 µm. (A, bottom) 2D histograms for all three proteins display the distribution of residence times in the mobile (particle jumps > 200 nm) and bound state (particle jumps < 200 nm) of all detected tracks. The insets illustrate representative tracks for characteristic different mobility behaviors and are also shown in Fig. 2 (B and C). The relative frequencies for tracks with the indicated times spent in the bound and mobile state are represented by the colors defined on the right. The number of acquired tracks was 4126 for BRCA2-GFP, 791 for RAD51-GFP, and 250 for RAD54-GFP, from at least four fields and 16 nuclei per sample. (B) Fluorescence images of cells transfected with BRC3 peptide expression vector and/or an RFP expression vector. Upon expression of BRC3-ΔFK peptide, which is deficient for RAD51 binding, slowly diffusing and transiently binding RAD51-GFP particles (green color channel) can be detected in Rad51GFP/WT cell nuclei. Upon BRC3 peptide expression, nuclei of most transfected cells now show bright, uniform RAD51-GFP fluorescence, indicating that BRCA2–RAD51 interactions are disrupted and RAD51 mobility is enhanced. BRC3 expression did not alter the mobile behavior of BRCA2-GFP. Bars, 5 µm. (C) Quantification of true detections (red circles) as in Fig. 1 B, in RFP-positive and -negative cells expressing BRC3, BRC3-ΔFK, or control transfection. Because of the relatively high RAD51 concentration (compared with BRCA2-GFP), and therefore enhanced fluorescence level, only relevant detections in the σ range of 1–3 were analyzed. Additionally, the exponential function was set off by 5 AU because the RFP+ BRC3 dataset did not have any detections to use for deriving a cutoff curve. Example data representative of individual video stacks are displayed. (D) Number of detections per condition (5–7 nuclei, number of initial detections: 5,000–12,000). The error bar represents the mean with the 95% confidence interval. Thus, BRC3-expressing cells have significantly fewer RAD51 detections than cells subjected to control transfection or BRC3-ΔFK expression.
This suggests that diffusive RAD51 is associated with BRCA2, a known interacting partner (Sharan et al., 1997). To determine if RAD51 diffusive behavior was due to interaction with BRCA2, we disrupted their interaction. Expression of the BRC3 peptide, which binds RAD51 and disrupts BRCA2 interaction (Chen et al., 1999), caused increased mobility of nuclear RAD51-GFP, and slow or transiently bound particles were no longer observed (Fig. 4 B and Video 6). Increased RAD51-GFP mobility was quantified by determining the number of particles that could be detected with our routine (Fig. 1 B and Fig. S3 A) in individual cells (Fig. 4 C). Transfected cells were distinguished from untransfected cells by expression of RFP from a cotransfected plasmid. RAD51-GFP particles, with mobility similar to BRCA2, detected by this routine (Fig. 4, C and D) were abundant in most RFP-negative nuclei. In contrast, RAD51 detections are almost entirely lost in RFP-positive nuclei expressing the BRC3 peptide but not in RFP-positive nuclei expressing the BRC3-ΔFK peptide, which is unable to disrupt the BRCA2–RAD51 interaction (Chen et al., 1999; Davies et al., 2001). Note that only cells exposed to the BRC3-expressing plasmid show <500 detections (Fig. 4 D), including some of the RFP-negative cells that have probably been successfully transfected but did not express the RFP plasmid well enough for detection. BRCA2 diffusive behavior was not affected by BRC3 expression. The similarity of RAD51 and BRCA2 mobility was caused by their association, as disrupting this interaction increased RAD51 mobility.
The diffusive behavior of BRCA2 and RAD51 was also analyzed by FRAP. We were able to obtain FRAP data even though BRCA2 is expressed at a low level and was therefore technically very challenging to follow in this way, as also noted by others (Jeyasekharan et al., 2010). The fluorescence recovery behavior of RAD51-GFP was in fact even slower than BRCA2-GFP, which indicates the lack of a faster freely diffusing pool of RAD51 and likely reflects a pool of immobile protein (Fig. S5 A). This assay confirms that BRCA2 and RAD51, two very differently sized proteins, both diffuse relatively slowly in the nucleus. We also performed FRAP analysis on the Rad51GFP/WT cell line after transfection to express the BRC3 peptide, which disrupts interaction with BRCA2, as explained in the previous section. Although the RFP marker protein could not be used in this case, we did detect two populations of cells after transfection based on appearance of spontaneous RAD51-GFP foci (Fig. S5 B). About half of the cells transfected with the BRC3 construct had nuclei with uniform fluorescence lacking foci, whereas all nuclei of cells from control transfections, either with the control peptide (BRC3-ΔFK) or Lipofectamine alone, had spontaneous RAD51-GFP foci (Fig. S5 B). Even though the data were obtained from a heterogeneous cell population in which the respective plasmids may or may not be expressed, averaged FRAP curves (from 8–20 cells) show that expressing the BRC3 peptide results in faster RAD51 recovery after photobleaching (Fig. S5 C). In addition, BRC3-expressing cells showed a higher final level of RAD51-GFP fluorescence recovery. In the time window of 8–10 s final, recovery values for cells expressing BRC3, BRC3-ΔFK, or no plasmid reached 0.904 ± 0.003, 0.860 ± 0.004, and 0.863 ± 0.005 relative recovery (mean ± 2 × SEM), respectively. These FRAP data support the conclusion that mobile RAD51 is traveling in complex with BRCA2 in the nucleus.
As further evidence for the co-mobility of BRCA2–RAD51, we disrupted this interaction in an independent manner. Applying (mild) hyperthermia will degrade BRCA2 but not RAD51 (Krawczyk et al., 2011). We analyzed protein diffusion by SPT in Rad51GFP/WT cells before and after hyperthermia treatment. Although BRCA2 degradation is not complete in these conditions, we observed a reduction in the number (mean ± 2 × SEM) of detectable RAD51-GFP particles per nucleus from 1,022 ± 286 to 411 ± 156 for control conditions and hyperthermia, respectively (12 and 17 nuclei, normalized for nuclear cross section size). The remaining particles that can be tracked are likely due to residual BRCA2 in some cells after this hyperthermia treatment. As in the case of BRC3 peptide expression, the decrease of detectable RAD51-GFP entities indicates increased mobility.
BRCA2 diffuses as oligomeric clusters
The FCS and SPT results indicated that the mobile BRCA2 particles detected were often multimeric. We did not detect GFP blinking during SPT, which would be expected for single fluorophores given the time scale of our observations (Dickson et al., 1997; Montenegro Gouveia et al., 2010). In addition, the diffusing diffraction-limited particles varied in fluorescence intensity, even in the same regions of interest (ROIs) where intensity variation due to oblique illumination would not be a factor. Fluorescence intensity variation was also evident in the photon count histograms from the raw FCS data (compare BRCA2-GFP to GFP in Fig. 3 B) that were clearly skewed toward higher fluorescence intensity values for BRCA2-GFP compared with GFP alone. We determined the number of fluorescent molecules in individual BRCA2 particles from fluorescence bleaching traces from fixed cells (Kerssemakers et al., 2006; Xie et al., 2008; Fig. 5 A). The intensity of a single fluorophore was defined as the mean step size (Fig. 5 B) extracted from the bleaching traces by fitting a step function (Kerssemakers et al., 2006; Fig. 5 A, red line). The number of fluorophores in the diffraction-limited BRCA2 particles was determined by two methods: (1) by counting steps equal or larger than the mean step size or (2) by dividing the difference in initial and final intensity by the mean step size (Fig. 5, C and D). Both determinations indicated that most single-entity, diffraction-limited particles detected were multimeric, including equal portions of 1, 2, or 3 fluorophores or a distribution between 1 and 10. Based on the conservative estimate, we obtain a mean value of 3.12 fluorophores per BRCA2-GFP particle. In contrast, applying the second method, the larger accumulations known as spontaneous foci were estimated to include 20–100 BRCA2 molecules.
Figure 5.

BRCA2-GFP is oligomeric in cells. (A) Fluorescence intensity bleaching traces (blue line) from six fixed cells were acquired by integrating the fluorescence intensity of 5 × 5-pixel windows centered around an intensity maximum and corrected for background using the mean value of the surrounding 9 × 9 frame (gray; see inset). (B) A histogram of the steps (n = 360) obtained from the step-function fit (red line in A) was used to estimate the mean step size by fitting the distribution with a Gaussian function. This mean step size, as mean intensity per GFP, was used to determine the number of BRCA2-GFP molecules per fluorescent object in two different ways. (C) Steps larger or equal to this mean step size were counted; steps more than twice the size of this mean were calculated as two BRCA2-GFP molecules (n = 90 traces with at least one BRCA2-GFP). (D) Alternatively, the difference between initial and final intensity in the bleaching traces (n = 118 with at least one BRCA2-GFP) was divided by the mean step size to determine the number of molecules per BRCA2 cluster. The data shown are representative of multiple experimental repeats (n = 3).
BRCA2 binding increases upon DNA damage induction
In response to certain DNA lesions, BRCA2 and other HR proteins accumulate into foci (Haaf et al., 1995; Chen et al., 1998; Essers et al., 2002b). Although foci including tens to hundreds of proteins appear immobile, individual proteins exchange at varying rates (Tan et al., 1999; Essers et al., 2006; Agarwal et al., 2011). Both the mechanism of accumulation and differential exchange rates are not understood. To describe changes in the behavior of individual BRCA2 particles that contribute to focus formation, we challenged cells with well-characterized damaging agents and determined the effect on BRCA2 with respect to the mobility and transient binding parameters. The BRCA2-GFP–expressing cells were treated with three different damaging agents using established dosage and timing protocols (Essers et al., 2006). The initial lesions induced by IR, mitomycin C (MMC), and hydroxy-urea (HU) include DNA double-strand breaks (DSBs), interstrand cross-links, and stalled and collapsed replication forks, respectively. In all cases, the resulting DNA damage is repaired by HR and induces formation of BRCA2 foci. When following individual particles (distinct from focal accumulations) by SPT in living cells, the fraction of bound BRCA2 increased in response to all three damaging agents in a similar fashion (Fig. 6 A). In the case of IR, this was most pronounced after 2 h, whereas after 5 h, when DNA repair is mostly complete (van Veelen et al., 2005; Agarwal et al., 2011), BRCA2 behavior had reverted to that of undamaged cells. DNA damage inflicted by IR, MMC, and HU caused a 15%, 16%, and 12% increase in bound BRCA2-GFP particles, respectively. The diffusion constants of mobile BRCA2 did not change significantly in response to DNA damage (Table 2). The CDF curves obtained from all tracked particles displayed a clear downward shift after DNA damage that is indicative of reduced mobility (Fig. 6 B). This effect is quantitatively reflected in a smaller percentage contribution of the largest Dapp (D1). The distribution of particles with different time in mobile and bound states is also presented in 2D difference histograms (Fig. 6 C). After DNA damage induction, individual BRCA2 particles spent more time in a bound state and less time in the mobile state, as indicated by a shift of the dwell time distribution. Our combined results indicate that BRCA2 binding increased after DNA damage, a property that is not detected using FCS alone. The combined methods we applied here unambiguously require a bound component for consistent analysis (Table 3). The advantages of combining methods for accurate description of nuclear protein behavior has been demonstrated by others investigating nuclear proteins p53 (Mazza et al., 2012) and the androgen receptor (Van Royen et al., 2014). Although we show increased binding of individual BRCA2 particles, the methods we applied are not ideally suited for analysis of foci, accumulations typically including tens to hundreds of proteins. The detected BRCA2 clusters, mobile and immobile, we analyzed contained <10 BRCA2 molecules.
Figure 6.

BRCA2 mobility changes after DNA damage. (A) The percentage of additionally bound BRCA2 particles was determined by SPT analysis after induction of DNA damage: 2 and 5 h after exposure to 10 Gy IR, after 1 h treatment with 1 mM HU, and after 24 h treatment with 1 µg/ml MMC (from at least six fields, nine nuclei, and 457 individual tracks for each sample, well above 1,000 tracks for most conditions). In the absence of induced DNA damage, between 51 and 68% of the BRCA2 particles were bound. Three experimental replicates are shown for each treatment. (B) From all track segments, CDF curves were derived for the different DNA damage treatments (solid lines). Global fitting (broken lines) of the curves yielded three Dapp components, with D1 = 1.15 µm2/s, D2 = 0.05 µm2/s, and D3 = 0.003 µm2/s indicating mobility (D1) and transient binding interactions (D2 and D3). The percentage for these different mobility contributions shows that after DNA damage induced by IR, HU, and MMC, more of the observed BRCA2 is transiently bound, manifested as an amplitude decrease of D1 to 15%, 12%, and 13%, respectively, compared with the control condition (27%). (C) 2D difference histograms display mobility changes (yellow-red for increased frequency or blue for decreased frequency) after DNA damage indicating the shift to more immobile states compared with control (as shown in Fig. 4 A). In response to DNA damage, particles spend less time in the mobile state. Change in relative frequency is indicated by the colors defined on the right.
Table 2.
Summary of the CDF diffusion analysis results for tracked BRCA2-GFP particles in live Brca2GFP/GFP cells treated with 10 Gy IR (after 2 h), 1 µg/ml MMC (24 h), and 1 mM HU (1 h)
| Damage | Type | D1 | A1 | D2 | A2 | D3 | A3 | σ |
| µm2/s | % | µm2/s | % | µm2/s | % | µm | ||
| Control | 1 (bound) | 0.59 | 10.7 | 0.037 | 37.9 | 0.002 | 51.4 | 0.009 |
| 2 (mobile) | 1.21 | 58.8 | 0.098 | 28.0 | 0.003 | 13.2 | 0.016 | |
| IR | 1 | 0.81 | 6.7 | 0.038 | 38.0 | 0.002 | 55.3 | 0.009 |
| 2 | 1.41 | 42.6 | 0.079 | 33.0 | 0.003 | 24.4 | 0.014 | |
| MMC | 1 | 0.75 | 6.8 | 0.031 | 42.0 | 0.002 | 51.2 | 0.008 |
| 2 | 1.39 | 43.7 | 0.047 | 34.2 | 0.002 | 22.1 | 0.009 | |
| HU | 1 | 0.94 | 6.9 | 0.029 | 40.3 | 0.002 | 52.8 | 0.008 |
| 2 | 1.53 | 32.4 | 0.046 | 37.9 | 0.002 | 29.7 | 0.01 |
Table 3.
Summary of BRCA2 diffusion parameters obtained from different mobility assays in live cells.
| Method | D1,mob | D2,mob | Immobile particles | τB,trans |
| µm2/s | µm2/s | % | ms | |
| SPT | 1.44 | 0.07 | ∼50 | ND |
| SPTsim | 2.0 | ND | ND | 40 |
| FCS | ND | ND | ND | 25 |
Measured and simulated parameters are indicated with bold and nonbold text, respectively. D1,mob determined by SPT is lower than Dsim established by simulations, as expected due to reduction in dimensionality from 3D to 2D. The decay time constant τB found by FCS reflects transient BRCA2 binding, as revealed by and in good agreement with SPT simulations. This transient binding behavior could not be directly measured by SPT because of the larger frame acquisition time of 50 ms. However, it produces and matches the diffusion constant D2,mob very well. The theoretical diffusion parameters established by SPT simulations yielded the apparent diffusion constants D1 and D2 of 1.25 (53%) and 0.06 µm2/s after analyzing the synthetically generated data.
Discussion
We have followed the native behavior of three core HR proteins in the nuclei of living mammalian cells by combining endogenous expression of fluorescent-tagged proteins with multiple complementary imaging and analysis methods. This revealed several previously uncharacterized aspects of nuclear BRCA2 behavior. First, following individual complexes by SPT, we found that nuclear BRCA2 is characterized by frequent transient interactions. This behavior appears to be a fundamental property of BRCA2 observed and quantified under a variety of conditions in mouse ES cells and observed to be qualitatively similar in human cells. BRCA2 or another member of its complex may frequently and transiently interact with genomic DNA, specific DNA structures, chromatin proteins, or other relatively stationary nuclear components. In the crowded nuclear environment, such transient interactions may be quite common, as other proteins also exhibit transient immobility in the 10–20 ms range (Grünwald et al., 2008; Speil and Kubitscheck, 2010; Van Royen et al., 2014). These transient interactions are likely a prominent influence on nuclear protein function and can now be quantitatively characterized. Second, BRCA2 complexes were predominantly multimeric, and estimated to consist on average of two to five monomers. The multimeric state of BRCA2, also recently reported for the purified human protein (Sanchez et al., 2014; Shahid et al., 2014), has important implications for its mechanism of action and control in promoting HR. Third, diffusion of BRCA2 and RAD51 was strikingly similar, and we show that this was due to their association. Although these two proteins are known binding partners and their co-diffusion is not unexpected, our data suggest that most mobile nuclear RAD51 is in complex with BRCA2. This observation implies that BRCA2 would be involved in all stages of RAD51 filament formation in vivo, and not limited to the initial filament nucleation step. Forth, in response to DNA damage the prevalence and duration of transient binding events increased, either due to an increase in specific interaction sites, modification of BRCA2 that favors interactions with immobile nuclear components, or both.
BRCA2 is needed in the cellular response to DNA damage that induces DSBs or stalls replication forks (Roy et al., 2012). Thus, the behavior of BRCA2 in response to these types of DNA damage will reveal aspects of its function that contribute to DNA repair. We observed an increased number of bound BRCA2 particles and enhanced transient binding interactions after DNA damage induction (Fig. 6). The (additionally) bound BRCA2 particles compare well with the number of expected DSBs produced. 1 Gy of IR induces ∼20–25 DSBs in a typical cell nucleus in G1 phase and double that in G2 phase, which correlates well with observed γH2AX foci (Löbrich et al., 2010). Using SPT, we detected an increase of 12 bound BRCA2-GFP particles 2 h after irradiation with 10 Gy in the observation volume (±250 nm above and below the focal plane), which is equivalent to 160 additional bound BRCA2-GFP particles in the whole nucleus (average). Assuming that most of the actively growing ES cells in the population we observe are in S phase, the number of additional BRCA2-GFP particles induced by 10 Gy is about half the value expected for γH2AX foci (i.e., between 300 and 375). This is consistent with the increased BRCA2 immobility occurring at sites of DNA damage, where BRCA2 will be involved in HR.
We observe that most BRCA2 travels in the nucleus as slowly mobile clusters (with Dapp < 2 µm2/s). We estimate that the clusters contain on average three BRCA2, with an equal number of 1, 2, and 3 plus a wide distribution of larger multimers. Though this association may involve additional proteins, there is growing evidence that human BRCA2 is multimeric. One of the original purification reports included EM images consistent with our in vivo observations, showing a variety of forms classified as one third monomers and two thirds dimers, though the presumed dimer population has a very wide size distribution that likely includes larger oligomers (Thorslund et al., 2010). Our scanning force microscopy analysis also reveals a variety of oligomeric forms for BRCA2 (Sanchez et al., 2014) purified by a different method (Jensen et al., 2010). Recent EM reconstructions reveal dimeric BRCA2 both in the absence and presence of RAD51, and a variety of larger forms are also evident in the raw images (Shahid et al., 2014). Our observations provide in vivo evidence that the recently described BRCA2 dimers, and possibly larger complexes, associated with RAD51 are the biologically important forms (Shahid et al., 2014).
In FCS measurements, we did not detect putatively monomeric and faster diffusing BRCA2 species, thus the slowly mobile and bound species fully describe BRCA2 behavior in mouse ES cells. Simple diffusion based on the size of a BRCA2 monomer, 384 kD, would be much faster than the value measured here and by others (Jeyasekharan et al., 2010). For comparison, the 460-kD TFIIH complex has a diffusion constant of 6 µm2/s when moving freely though the nucleus (Hoogstraten et al., 2002). Because diffusion constants vary with molecular weight cubed (simplest equation assuming spherical particles), a threefold difference (6 vs. 2 µm2/s) would be equivalent to a 27-fold difference in molecular weight, or an equivalent of 35 BRCA2. Thus, the apparent slow diffusion is not likely due to particle size alone but involves frequent, transient immobility. The component with Dapp of 0.45 µm2/s for BRCA2-GFP (detected by FCS) could represent chromatin-bound proteins because this is the value also reported for chromatin-bound heterochromatin protein 1 (Erdel et al., 2011). The percentage of bound particles and the time individual BRCA2 particles remain bound increased after DNA damage induction, both of which would logically contribute to high local concentrations and provide a quantitative basis for describing focus formation. The challenge now is to begin building and testing models for how changes in the diffusion parameter we have defined would result in high local concentration of proteins at sites of DNA damage.
The diffusion behavior of RAD51 indicates that this protein travels in the nucleus associated with BRCA2 and that the pool of free diffusing RAD51 is limited. Although biochemical analysis often uses a large excess of RAD51 over BRCA2 (Shahid et al., 2014), given the relative amount of these proteins in cells the complete association of RAD51 with BRCA2 that we observe is not unexpected. We estimate that BRCA2 concentration is 3–15 nM (see Materials and methods) and the RAD51 nuclear concentration is ∼100 nM (Essers et al., 2002a; Agarwal et al., 2011). Based on the higher value for BRCA2, most nuclear RAD51 could be bound to BRCA2, assuming the stoichiometry of ∼6:1 determined in vitro (Jensen et al., 2010). Our direct observation of (near) complete association between BRCA2 and mobile RAD51 in live cell nuclei is somewhat unexpected and currently not part of models describing nuclear RAD51 behavior. This association is, however, consistent with the large volume of biochemical and cytological data demonstrating the tight physical and functional association between the two proteins (Mizuta et al., 1997; Sharan et al., 1997; Chen et al., 1998; Katagiri et al., 1998; Davies et al., 2001; Shahid et al., 2014). Additionally, BRCA2 and RAD51 expression levels are likely to be coregulated, and an intriguing example of such a homeostatic relationship has been described previously (Magwood et al., 2013). This further emphasizes the importance of maintaining native expression levels of proteins that work in concert for the type of in vivo analysis described here, where for instance overexpression of one partner in a complex would result in behavior quite different compared with the correctly partnered version.
BRCA2 affects RAD51 in several critically important ways: its nuclear localization sequences are required for RAD51 transport to the nucleus (Davies et al., 2001), its DNA binding and/or PALB2-interaction domain plays a role in delivering RAD51 to damage sites (Saeki et al., 2006; Siaud et al., 2011), and its BRC repeats control the formation and stability of the RAD51 filament (Rajendra and Venkitaraman, 2010; Carreira and Kowalczykowski, 2011). None of these functions, however, requires continuous interaction between RAD51 and BRCA2. For example, in the case of RAD51 nuclear transport, BRCA2 may not be the delivery vehicle, but has been suggested to facilitate conversion of large RAD51 oligomers into a monomeric form capable of diffusion through nuclear pores (Yu et al., 2003; Jeyasekharan et al., 2013). Other HR steps involving BRCA2 can, in principle, similarly be accomplished by context-dependent rather than continuous BRCA2–RAD51 interaction. Our data indicate that nuclear functions involving Rad51 will also include BRCA2. Continuous chaperoning by BRCA2 may be a mechanism to prevent undesirable polymerization of RAD51 or inappropriate loading onto DNA. Importantly, the role of BRCA2 may extend beyond the initiation of RAD51 filament formation. In this case, release of BRCA2 from the RAD51 filament may be an important point of regulatory control yet to be explored.
Materials and methods
Cell culture
Mouse ES cells were cultured in medium consisting of a 1:1 mixture of phenol-red free and glutamine-free DMEM (Lonza) and filtered buffalo rat liver (BRL)-conditioned medium, supplemented with (final concentrations given) 7.5% fetal calf serum (Thermo Fisher Scientific), 0.1 mM nonessential amino acids (Lonza), 0.1 mM 2-mercaptoethanol (Sigma-Aldrich), 1,000 U/ml leukemia inhibitory factor, 100 U/ml penicillin, 100 µg/ml streptomycin (both from the same 100× stock), and 2 mM ultraglutamine (Lonza). Cells were grown on gelatin-coated (Sigma-Aldrich) Petri dishes or coverslips under a 5% CO2 atmosphere maintained at 37°C. Plasmid transfection in ES cells was performed using a Lipofectamine 2000 (Invitrogen) transfection protocol using 10 µl of reagent together with 2–10 µg of plasmid DNA prepared in 500 µl Optimem (Lonza) and added to 25% confluent cells grown on coverslips in 1 ml of ES cell medium. For mild hyperthermia treatment, cells were placed in an incubator, maintained at 42°C and 5% CO2, for 75 min, matching an effective time of 60 min at this temperature.
Generation of the Brca2GFP/GFP cell line
The Brca2-GFP targeting construct was engineered using mobile recombineering reagents and protocols (Testa et al., 2004), from the clone bMQ-178E5 from the Sanger 129/Sv BAC library (Adams et al., 2005). The cassette for the first recombineering step was constructed by overlap extension PCR by amplifying the EGFP with the self-cleaving viral F2A peptide sequence from the OCT4-EGFP targeting vector (Hockemeyer et al., 2009), the coding sequence for neomycin phosphotransferase resistance gene, and a bacterial selection cassette comprising a hygromycin resistance gene under a bacterial gb2 promoter, flanked by two I-SceI cleavage sites, which allow excision of the hygro gene after the second (retrieval) step of recombineering. The cassette thus comprised EGFP-F2A-neo-ISceI-gb2-hygro-ISceI, and was flanked by 40-bp homology arms for inserting it in frame between the last codon of the Brca2 CDS and the stop codon within exon 27 of the mouse Brca2 gene. After the BAC modification with the cassette, a fragment was subcloned into a high-copy vector, a fragment of pBluescript-KS+ amplified with the primers 5′-CCAGAGGACCCACGCATGGTTCCTGGCCATCTCAAAACAACGCAAAAGACACGCGTGCGGAACCCCTATTTGTTTAT-3′ and 5′-CAGAGCAGCCCCTGCACTCCACCAATGTGTAAGGTCATTATTATTTATCAACGCGTTTCCAGTCGGGAAACCTGTC-3′. The resulting targeting construct contained 6.6 plus 5.4 kb homology to the Brca2 locus flanking the cassette. Upon linearization with MluI and purification, 10 µg of targeting construct DNA was electroporated into 6 × 10⁶ embryonic day 14 (E14) IB10 mouse ES cells. After 10 d of selection with 200 µg/ml G418, individual colonies were picked, expanded, and analyzed by Southern blotting with an external probe; all of the colonies analyzed have undergone recombination. To produce Brca2GFP/GFP cells, one of the Brca2GFP/WT clones was further expanded and subjected to selection with a higher concentration of G418 (1.5 mg/ml) for 8–10 d; several of the numerous colonies that resulted were expanded and analyzed by genotyping PCR and then Southern blotting. Conversion to homozygosity using this method was highly efficient. The Brca2YFP/YFP lines were engineered by following a similar protocol and using the pEYFP-C1 construct (Takara Bio Inc.). Three independent heterozygous clones were used to produce independent homozygous clones.
Western blotting was performed as described previously (Krawczyk et al., 2011) using primary antibodies against mouse BRCA2 (rabbit-BRCA2ab, 27976; Abcam) and human poly(ADP-ribose) polymerase (PARP-1; C-2-10, raised in mouse; Enzo Life Sciences) with dilutions of 1:500 and 1:5,000, respectively. Protein extracts were prepared by scraping and resuspending confluent cells from a 10-cm dish in 100 µl of PBS. After the addition of 100 µl of 2× Laemmli buffer (4% SDS, 20% glycerol, and 120 mM Tris-HCl, pH 6.8), cells were boiled for 5 min at 95°C and subsequently sheared using a 1-ml syringe with a 0.5 × 16-mm needle. Protein concentration was determined with the Lowry assay to ensure equal loadings of 50 µg of total protein extract for different cell lines. SDS-PAGE was performed for 15 min at 50 V and 2 h at 100 V. Blotting was performed for 2 h at 300 mA and 4°C using 2× transfer buffer (10× buffer: 250 mM Tris base and 2 M glycine, pH ∼8.3) containing 20% (vol) methanol.
Functional assays
For colony formation survival assays, 100–1,500 cells were seeded in 6-well culture dishes in triplicate. Cells were irradiated the next day with 8 Gy using a 137Cs source (0.65 Gy/min). Cisplatin and PJ-34 (Sigma-Aldrich) were added to the media 3 h after seeding the cells; media were replaced after 18–20 h of treatment. Dishes were stained with Coomassie Brilliant Blue 6 d later and photographed; macroscopically visible colonies were counted. Three independent experiments were performed for each treatment, each with three technical replicates.
To detect localization of BRCA2 with other DNA damage markers in IR-induced foci, Brca2GFP/GFP cells were grown on glass coverslips (diameter of 15 or 24 mm) precoated with 0.1% gelatin or 50 µg/ml laminin from mouse Engelbreth-Holm-Swarm (EHS) sarcoma (Roche), irradiated with 8 Gy, allowed to recover for 2 h, washed with PBS, fixed with 2% PFA for 15 min, and mounted in Vectashield medium with DAPI (Vector Laboratories). For RAD51 staining before fixation, cells were pre-extracted with 0.5% Triton X-100, 20 mM Hepes KOH, pH 7.9, 50 mM NaCl, 3 mM MgCl2, and 300 mM sucrose solution for 1 min, and additionally washed with PBS. Immunofluorescence staining was performed using primary antibodies (pAb) against Trp53BP1 (rabbit pAb; Novus Biologicals) or RAD51 (rabbit pAb; homemade) and Alexa Fluor 594–conjugated secondary antibodies, all diluted in PBS with 0.15% glycine and 0.5% BSA. Direct BRCA2-GFP fluorescence and Trp53BP1 immunofluorescence staining were imaged using a laser confocal microscope (LSM510 Meta, 63×/1.4 NA Plan-Apochromat oil immersion objective lens). RAD51 immunofluorescence data were acquired on a confocal microscope (SP5; Leica) equipped with a hybrid detector and a photomultiplier tube, with the former used for BRCA2-GFP and the latter for DAPI and Alexa Fluor 594 fluorophores, respectively, using a 63×/1.4 NA oil immersion objective lens and LSM software (Leica). Confocal scanning was performed at room temperature. Images were processed with ImageJ for intensity level adjustment and cropping. Foci were scored using an ImageJ cell counter plugin (van Royen et al., 2007), the basis of which was the mean intensity and standard deviation of a segmented nucleus. Objects with an intensity larger than a defined threshold, calculated as the sum of the mean and three times the standard deviation, were counted as foci. The experiments were repeated at least twice.
For FACS analysis, cells were harvested by trypsinization, fixed with 1% PFA in PBS for 15 min at room temperature, permeabilized with 0.2% Triton X-100 in PBS, washed with PBS, incubated with blocking solution (3% BSA and 0.2% Triton X-100 in PBS) for 20 min, incubated with anti-GFP monoclonal antibody (1:1,000 dilution; Roche) in blocking solution for 1 h at room temperature, washed three times with PBS, and then incubated with Alexa Fluor 488 anti–mouse secondary antibody for 30 min in darkness, washed three times with PBS, and incubated with 0.25 mg/ml RNase I at 37°C for 10 min. 2 µg/ml propidium iodide was added and cells were analyzed by FACS. The experiment was performed twice. Efficiency of gene targeting by HR was determined using the Rad54-GFP gene targeting assay (Abraham et al., 2003), for which cells were trypsinized, collected by centrifugation, resuspended in 1% PFA, and incubated for 15 min; an equal volume of 0.2% Triton X-100 in PBS was added to the suspension and cells were analyzed by FACS. The reported numbers represent five independent experiments.
Pull-down from Brca2GFP/GFP and wild-type cells was performed with GFP-TrapA beads (ChromoTek): cells grown in 145-mm culture dishes were washed with PBS and lysed in situ with NETT++ lysis buffer (100 mM NaCl, 50 mM Tris HCl, pH 7.5, 5 mM EDTA, 0.5% Triton X-100, and protease inhibitor cocktail [Roche]). Pefabloc (Roche): 450 µl per plate was scraped off and centrifuged at 15,294 rcf for 15 min at 4°C; supernatant was collected and incubated with the washed GFP-TrapA beads for 5 h at 4°C with mixing. Beads were collected by centrifugation (153 rcf, 2 min, 4°C), washed three times with the NETT++ buffer, and boiled in Laemmli sample buffer for 5 min, followed by SDS-PAGE fractionation, tryptic digestion, and mass-spectrometric analysis. Protein identification was performed using MaxQuant software (Cox and Mann, 2008), the Andromeda engine (Cox et al., 2011), and by searching against the UniProt (mouse) database.
Plasmids and cell lines
The Rad51GFP/WT and Rad54GFP/− ES cell lines were engineered by gene targeting in E14 ES cells using the knock-in constructs designed to express the fusion protein from endogenous promoter by inserting into exon III (Rad51) or IV (Rad54) of the cDNA encoding the remainder of the coding sequence fused to EGFP followed by a PGK-neo selection cassette. This has been described previously (Agarwal et al., 2011; Uringa et al., 2014). Plasmids for the expression of the BRCA2 BRC3 repeat (amino acids 1,415–1,483 of human BRCA2) and a control peptide (BRC3-ΔFK, containing a deletion corresponding to Phe1428–Lys1434 within BRC3), both fused to a nuclear localization signal in pCAGGS expression vector under the CAG promoter, were obtained from J. Stark (Memorial Sloan-Kettering Cancer Center and Cornell University Graduate School of Medical Sciences, New York, NY) and have been described previously (Stark et al., 2002). pRFP-C1 contains a coding sequence for monomeric mRFP1 under a CMV promoter. GFP-BRCA2 (pAZ114) and BRCA2-GFP (pAZ115) expression plasmids were engineered by replacing the gene trap cassette in the 5′-PTK-3′ PiggyBac vector (Cadiñanos and Bradley, 2007) with a puromycin acetyltransferase expression cassette driven by a PGK promoter, and BRCA2 expression cassette consisting of a CAG promoter (1.8 kb AluI fragment from pCAGGS-Dre-IRES-puro; Anastassiadis et al., 2009), a human BRCA2 coding sequence (10.3 kb NotI–XhoI fragment from the phCMV1-MBP-BRCA2 plasmid; Jensen et al., 2010), an EGFP coding sequence PCR-amplified from the pEGFP-N1 plasmid (Takara Bio Inc.), and bovine growth hormone polyadenylation signal PCR amplified from pCAGGS-Dre-IRES-puro. Stepwise isothermal Gibson assembly was used for construction (Gibson et al., 2009). PCR-amplified fragments and cloning junctions were sequence verified. The resulting PiggyBac constructs were cotransfected with the PiggyBac transposase expression construct (mPB) into HeLa cells (1 µg each in six-well plate). Selection with 1.5 µg/ml puromycin was started after 1 d and maintained for 7 d. The population of puromycin-resistant clones was used for imaging experiments without clonal isolation. Rad54−/− and Nbs1ΔB/ΔBRad54−/− cells were produced by sequential targeting of the two wild-type alleles (Rad54−/−) or de novo isolation from blastocysts at E3.5 (Nbs1ΔB/ΔBRad54−/−; Essers et al., 1997; Brugmans et al., 2009). Nbs1ΔB/+ mice used in the crosses to produce the Nbs1ΔB/ΔBRad54−/− ES cells carry a hypomorphic allele of Nbs1, in which exons 4 and 5 encoding the BRCT domain of NBS1 are replaced by the neo selection cassette (Williams et al., 2002). The Rad54 gene in Rad54−/− cells is disrupted by insertion of the selection cassettes (neo, hygro) into exon 4, abolishing protein expression (Essers et al., 1997).
Oblique-illumination microscopy and live-cell imaging
Oblique-illumination imaging was performed on an inverted microscope (Eclipse Ti-E; Nikon), equipped with a Plan-Apochromat TIRF objective lens (100×, 1.49 NA, oil) and an EM charge-coupled device (CCD) camera (QuantEM; Roper Scientific). A 491-nm Calipso diode-pumped solid-state laser (Cobolt) was used for EGFP excitation with 5–7 mW laser power (100%) at the objective back focal plane. Reliable fine-tuning of the laser at subcritical TIRF angles (the angle of the refracted ray is ∼75° into the cell suspension with respect to the objective optical axis) for each field-of-view was achieved using the built-in motorized illumination unit (Ti TIRF-E; Nikon), which displaces the focusing lens parallel to the objective optical axis. The laser power has been adjusted for each cell line depending on the expression level of the GFP fusion protein to enable single-particle detection and tracking while avoiding signal saturation at the EM-CCD camera. A filter cube (ET-EGFP; Chroma) with an emission filter (HQ530/30M) was used; the excitation filter was removed. The hardware was run through MetaMorph 7.5 software (Molecular Devices). In combination with the 100× objective lens, the CCD camera yielded images with pixel sizes representing ∼70 nm (14.28 pixel = 1 µm). Video streams typically containing 200 frames (16 bit) were collected continuously using the full camera chip without binning, a frame acquisition time of 50 ms, and an EM Gain of 950 (3×). For display, individual image frames from video stacks were selected, cropped, labeled with a scale bar, and converted to 8-bit, without any (further) image processing, using ImageJ (Abràmoff et al., 2004). The lookup table is linear and covers the full range of the data. For two-color data, images from different color channels were overlaid and the range of brightness was linearly adjusted.
Live-cell imaging was performed in cell growth medium under a 5% CO2 atmosphere and at 37°C using a Tokai Hit stage heating system. It was critical for this experiment that the cells were well attached to the coverslip to yield crisp raw images using oblique laser illumination. As ES cells have a tendency to grow in piles and to stick to each other rather than to the coverslip, additional optical interfaces, such as medium between the coverslip and the cell colony, can obscure the laser light path and negatively affect data quality. In total, this imaging and SPT experiment (next section) was successfully performed >100 times, counting different cell lines and conditions. All reported data series were repeated at least three times (technical replicates), except for the Rad51GFP/WT and Rad54GFP/− cells, and the BRC3 expression experiments in the Brca2GFP/GFP cells, for which experimental conditions were clearly stable and the data reproducible.
Single-particle tracking
Single-particle tracking was performed using a custom-written plugin for ImageJ (Abràmoff et al., 2004), which is available from http://www.smal.ws/home/software. The plugin first applied a detection algorithm based on a weighted least-squares Gaussian fitting of PSFs, providing intensity and sigma values (Thompson et al., 2002), which yielded true and false detections, the latter originating from camera noise. False detections were separated based on an empirical approach that characterized detections based on the intensity-sigma statistics in non-ROIs of raw images. An exponential function with parameters derived from the distribution of intensity-sigma pair values was used as a threshold. Tracks were subsequently created for the remaining true detections using a nearest-neighbor linking approach with a cutoff value of 840 nm and visualized using the MTrackJ plugin of ImageJ (Meijering et al., 2012). Further, a minimum track length of four frames was required, and a maximum of one missing frame for connecting nearby track sequences was allowed. The tracks were saved to a file with six columns containing, respectively, the fitted x and y position, the track number, a logical value whether the track is active in the particular frame, the intensity of the PSF fitted spot, and the sigma of the PSF. The tracking data were imported into a MATLAB script and converted into time increments in milliseconds and positions (x−/y−) in micrometers. All information from all tracks at one sample condition was combined. Histograms of all (squared) particle jumps were produced for the time increment separating two subsequent frames (equaling τ = 50 ms) within one track. From these histograms, CDF curves were derived and fitted with three components i of the exponential decay function Ai × [r2/(4Diτ + 4σ2)], with Ai denoting the amplitude (expressed as a fraction), r2 being the squared particle jumps, Di denoting the apparent diffusion constant, and σ being the precision in particle localization (Schütz et al., 1997). Fitting three mobility components to the CDF curves described the data well (R2 > 0.99). The resulting apparent diffusion coefficients, and their distribution as percentages, are summarized in Table 1 for the two track types (results are from Fig. 2, E and G).
Simulations of single-particle diffusion
Simulations were performed in order to compare theoretical and measured diffusion constants obtained by our SPT approach and the CDF diffusion analysis. To create realistic synthetic image data, we simulated the diffusive behavior of the objects of interest (van den Wildenberg et al., 2011). Each image sequence consisted of 100 frames. Each frame (size of 512 × 512 pixels, with lateral pixel size 70 × 70 nm) represented one of the z slices of a larger 3D volume where the simulated objects moved. To create realistic cell-like backgrounds, images from the real experiments were decomposed using the undecimated wavelet transform (Zhang, B., J. Fadili, J.L. Starck, and J.C. Olivo-Marin. 2007. Proceedings of the IEEE International Conference on Image Processing. Abstr. 9820977) to extract the cell profiles and to estimate the levels of the imaging noise. This image information was added to the intensity profiles of the moving objects. The appearance of the objects was modeled using the Gaussian approximation of the PSF (Thomann et al., 2002; Zhang et al., 2007) with the following parameters: σx,y = 97 nm, σz = 175 nm. These parameters were estimated using 20-nm-spaced confocal stacks of 100-nm-sized green-fluorescent polystyrene beads (Invitrogen) obtained on a similar imaging setup equipped with a Nano-drive (Mad City Labs) and a spinning disc unit (CSU-X1; Yokogawa Electric Corporation).
The behavior of the mobile objects displaying transient (binding) interactions was simulated using the Markov jump process (Wilkinson, 2011). In this case, the motion of the object was switched randomly between stages of diffusion with a coefficient DF = 2 µm2/s and DB = 0.02 µm2/s for “free motion” and binding, respectively. In the course of the simulation, the duration of each stage was sampled from the exponential probability distribution using the corresponding time constants τF = 30 ms and τB = 40 ms, respectively. The values of these parameters were estimated by matching the particle-jump histograms (of the mobile tracks) of the simulated and measured data (Fig. S4). The simulated image stacks were then subjected to the same ImageJ and MATLAB routines used to process the measured stream acquisitions. The time-step of the simulation was 1 ms, during which the object made a displacement of fixed size, according to the corresponding diffusion coefficient, in a random direction in three dimensions (van den Wildenberg et al., 2011). In accordance with our image acquisition settings, a series of 50 displacements comprised one frame. Each simulated (1 ms) position was convolved with the measured Gaussian PSF profile also taking the z position explicitly (with respect to the focal plane) into account; 50 time points were then summed up to obtain a corresponding image frame reflecting the motion of objects within the acquired 50 ms time interval. In total, 3D motion of 700 objects in a volume of 35.84 µm × 35.84 µm × 1.1 µm was simulated. Initially, the objects were randomly positioned within a cell, using the profile extracted from the measured data. Every 25 (50 ms) frames, a set of new, randomly positioned objects within the cells was added in the focal plane to compensate the number of objects that left the observation volume during the simulation. Examples of synthetic images resembled the measured data very well.
The measured particle jump data (histograms) were compared with the data obtained by simulation with D = 0.4 and 2.0 µm2/s. The optimal values for binding parameters τB and τF, were obtained by incrementally changing the τ values in steps of 5 ms to minimize the error between two histograms calculated as ∑(Ei − Oi)2, with Ei − Oi being the measured and theoretical data points for bin i, respectively (least squares method).
The Kolmogorov-Smirnov test and the Kernel Density based global two-sample comparison test (Duong et al., 2012) were used to test for significant differences between the measured data and the two simulated datasets.
FCS measurements
FCS experiments were performed on a microscope (LSM510 ConfoCor 2; Carl Zeiss Inc.; Weisshart et al., 2004) using a 40× C-Apochromat water immersion objective lens (NA 1.2), band-pass filters BP500-550 and 535-590 for GFP and YFP, respectively, and an argon laser with a maximum output power of 30 mW. The laser lines at 488 and 514 nm were chosen for GFP and YFP excitation, respectively. Live-cell imaging was performed in cell growth medium under a 5% CO2 atmosphere and at 37°C using a stage and objective heater. Fluorescence intensity fluctuations were acquired at a laser power of 1–2% from each individual cell nucleus five times for 20 s, after an initial bleaching period of 3 s to remove the contribution of bound molecules. At least 10 different cell nuclei from each cell line were monitored in this way. Datasets for the Brca2GFP/GFP and Brca2YFP/YFP cells were replicated three times (on different days) and twice for GFP and YFP expression in the wild-type (IB10) cells.
Data acquisition was performed with the AIM software V3.2 using the module LSM-FCS (Expert Mode; Carl Zeiss). Data analysis was done using the FFS data processor (Scientific Software Technologies Centre). The autocorrelated raw data were subjected to a three-component free diffusion triplet-state model. The known triplet state of GFP was fixed to 4 µs (15%). The first decay component arises from GFP blinking and was fixed at 330 µs (50%; Haupts et al., 1998). YFP blinking was determined in vitro (Schwille et al., 2000), yielding similar blinking times of either 200 or 400 µs depending on the specific GFP mutant: T203Y or T203F, respectively. In live cells, however, the blinking constant changed to ∼100 µs, determined directly by (global) data fitting of YFP-expressing ES cells. The decay time and fraction of the remaining two components was determined by global fitting of all ACFs belonging to one cell condition or cell type. Using a previously established calibration procedure with Rhodamine 6G (Weisshart et al., 2004), diffusion constants were derived from the fitted decay times.
BRCA2-GFP single-molecule counting in in situ fixed Brca2GFP/GFP cells
Brca2GFP/GFP cells grown on coverslips for 24 h were washed twice with PBS, then immersed in 4% fresh PFA, immediately mounted on a glass slide, and imaged with oblique illumination video microscopy. These raw data were analyzed by a MATLAB routine. Bleaching intensity traces were extracted over time for objects whose pixel value was 4× the SD above the mean value, which was determined for the whole image, and then subjected to step fitting (Kerssemakers et al., 2006). The object intensity, integrated over 5 × 5-pixel windows, was corrected for the local background calculated from the 9 × 9 outer frame centered on the pixel of maximum intensity. This yielded fluorescence intensity traces with no significant steps for nuclei, which appear blurred due to an unsuitable oblique illumination angle or which display larger fluorescent aggregates that are not single-molecule-like. The obtained bleaching traces were categorized by calculating the SD of all intensity values from one trace and comparing the difference of the mean values of the first and last five intensity values. If this difference was lower than the SD, then the trace was used as a reference trace, which does not contain significant intensity steps, i.e., the mean value of all intensity steps obtained from these traces was determined and used as a lower threshold for meaningful steps. All other traces were subjected to regular step fitting, whereas steps below the above-determined threshold value were discarded. Gaussian fitting of the distribution of all real intensity steps provided a cutoff value for counting the number of BRCA2-GFP molecules in a cluster. Steps larger than this Gaussian mean were counted as a single GFP molecule, steps at least twice as large as the mean were counted as two molecules, and steps below the Gaussian mean were ignored (counting method 1). Alternatively, the number of BRCA2-GFP molecules was also counted by dividing the difference in start and final intensity (averaged over three frames) by the determined Gaussian mean (counting method 2). These two different counting methods can be regarded as a lower and upper estimate of the real BRCA2-GFP distribution in the clusters, respectively.
Estimation of BRCA2-GFP concentration in live Brca2GFP/GFP cells
We estimated the nuclear concentration of BRCA2-GFP based on the detection of single particles in live cells. The number of detected BRCA2-GFP particles was multiplied by the mean number of BRCA2-GFP molecules per cluster, determined with the second method of counting single-molecule bleaching steps in fixed cells. This product was divided by the volume element that we effectively imaged, which was calculated as the cross-sectional area of the cell nucleus (π × rnucleus2) multiplied by 400 nm, assuming ±200 nm imaging depth above and below the microscope focal plane, and an additional correction factor of 10−24 × Avogadro’s constant = 0.6022 to obtain the nuclear protein concentration directly in nanomolar. Based on the clusters, the range of apparent nuclear BRCA2-GFP concentrations, estimated from 13 individual cell nuclei, was between 0.8 and 3 nM. This value represents a lower estimate of the nuclear BRCA2 concentration because larger accumulations known as spontaneous foci are not taken into account. Using the established bleach step size of single BRCA2-GFP molecules, we also estimated the number of BRCA2 proteins in spontaneous foci to be in the range of 20–100. Background correction was performed in the direct vicinity using a control area of the same shape and size and clearly devoid of fluorescent particles. Thus, the total nuclear BRCA2 concentration is likely to be three- to fivefold higher than the above estimate, i.e., between 3 and 15 nM.
FRAP measurements
FRAP experiments were performed on a microscope (SP5; Leica) equipped with a HyD 3 (hybrid) detector used with a gain of 340. The microscope was equipped with a Plan-Apochromat 1.4 NA/63× oil immersion objective lens. Data acquisition and extraction were performed with the FRAP Wizard (Leica). For FRAP measurements, a 512 × 16 pixel stripe across the short axis of more or less ellipsoidal-shaped cell nuclei was selected, and ROIs were adjusted to touch the cell nuclear boundaries. During FRAP scanning, a zoom of 6 and scanning speed of 1,400 Hz were used. The 488-nm line of an Argon laser was used with an acousto-optical tunable filter (AOTF) value of 8 and 100% for scanning and bleaching, respectively. GFP fluorescence was collected within the spectral range of 500–550 nm. The FRAP protocol consisted of a prebleach, bleach, and postbleach (recovery) period lasting 250, 10, and 5,000 frames, respectively, while the acquisition per frame (512 × 16 pixels) took 12 ms. Similar to the SPT and FCS experiments, live-cell imaging was performed in cell growth medium under a 5% CO2 atmosphere and at 37°C. A MATLAB script for data processing and visualization was written. Because of the low protein expression level, data from aberrant cell nuclei were excluded. To assess diffusive behavior, the integrated intensity from individual ROIs, i.e., the selected stripes across single nuclei, was normalized between 0 and 1 for the lowest data point and the final part (last 50 frames), respectively, in the postbleach (recovery) period. Data from all individual curves of one cell line were then averaged and plotted together. To further smooth these averaged curves for qualitative comparison, a sliding time average window of five subsequent frames was applied. To quantify differences in final recovery, and therefore long-term binding, individual raw data curves were normalized with a correction factor so that the mean of the last 50 data points of the prebleach matches 1 and then averaged for each cell line. To assess statistically significant differences between different conditions, we calculated the mean and SEM for each averaged curve after recovery had been completed and before substantial monitor bleaching took place, i.e., within the time window of 8–10 s. The mean ± 2 × SEM covers 95% of the data; in the absence of data overlap between ranges for different conditions, this matches a p-value of <0.05.
Online supplemental material
Fig. S1 shows how the Brca2-GFP knock-in cell lines were generated and characterized using several functional assays, confirming the presence and wild-type behavior of the BRCA2 fusion proteins. Fig. S2 confirms the ability of the homozygous Brca2-GFP knock-in cell line to form IR-induced RAD51 foci. Fig. S3 A demonstrates how false detections were removed from a set of initial single-molecule detections, determined by Gaussian fitting, using a novel separation approach. Fig. S3 B defines the limits of diffusion determination by SPT and CDF analysis of coverslip-attached, 36-nm-sized green fluorescent beads. Fig. S4 employs single-particle simulations to refine BRCA2 diffusion parameters, i.e., transient interaction times, obtained by SPT and FCS. Fig. S5 shows FRAP measurements of protein mobility in live ES cells that provide evidence for the co-diffusion of BRCA2 and RAD51. Video 1 shows diffusion of single BRCA2-GFP particles imaged in a live Brca2GFP/GFP ES cell, revealing short transient interactions of the mobile protein. Video 2 shows GFP-BRCA2 diffusion in a live HeLa cell displaying the same type of mobile behavior as BRCA2-GFP in ES cells. Video 3 shows BRCA2-GFP diffusion in a live HeLa cell that follows the same mobility pattern as GFP-BRCA2 in HeLa and BRCA2-GFP in ES cells. Video 4 shows RAD54-GFP fluorescence in a live Rad54GFP/− ES cell, revealing fast diffusing protein, seen as uniform background, and visually static accumulations, often referred to as spontaneous foci. Video 5 shows slowly diffusing RAD51-GFP particles and larger (apparently) immobile RAD51 accumulations imaged in a live Rad51GFP/WT ES cell. Video 6 displays live Rad51GFP/WT ES cells in which BRC3 and RFP (red) have been coexpressed, leading to an increased RAD51-GFP (green) mobility manifested as uniform (green) fluorescence. Table S1 shows the mass-spectrometric analysis of a GFP pull-down from Brca2GFP/GFP and wild-type cells, which allows determination of physical BRCA2 interaction partners. Table S2 shows CDF fit results of the immobilized, 36-nm-sized green fluorescent beads (τ = 50 ms) characterized by apparent pseudo-diffusion constants D as large as 0.01 µm2/s. Online supplemental material is available at http://www.jcb.org/cgi/content/full/jcb.201405014/DC1. Additional data are available in the JCB DataViewer at http://dx.doi.org/10.1083/jcb.201405014.dv.
Supplementary Material
Acknowledgments
We thank H. Sanchez, E. Peterman, S. Uphoff, A. Kapanidis, and B. Eppink for discussions; J. Kerssemakers for sharing MATLAB bleaching step analysis; I. Grigoriev and G. Kremers for technical microscopy help; N. van Vliet and M.Schoonakker for technical assistance in cell biology; N. van den Tempel for help with engineering HeLa cell lines; J. Stark for sharing reagents; and the Erasmus Optical Imaging Center and Proteomics Center for providing facilities and technical support.
This work was supported by grants from the Dutch Science Foundation (NWO) Chemical Sciences VICI (700.56.441) and ECHO (711.012.003), the European Community Seventh Framework Program (HEALTH-F2-2010-259893), Dutch Technology Foundation (STW) project NWOnano 11425, and STW Perspective project 10443, “Smart Optical Systems” and “Nanoscopy”.
The authors declare no competing financial interests.
Author contributions: C. Wyman, R. Kanaar, J. Essers, M. Reuter, and A. Zelensky planned the experiments. M. Reuter performed imaging experiments, wrote software, and performed analysis. A. Zelensky engineered and characterized all Brca2 knock-in ES lines and analyzed results. A.B. Houtsmuller provided imaging expertise and, with M. Reuter, H.M. de Gruiter, G.J. van Belle, W.A. van Cappellen, and M.E. van Royen, assisted in methods, analysis, and simulations. I. Smal and E. Meijering wrote software for SPT, analysis, and visualization, and performed simulations. C. Wyman, M. Reuter, and A. Zelensky wrote the manuscript. All authors discussed results and commented on the manuscript.
Footnotes
Abbreviations used in this paper:
- ACF
- autocorrelation function
- CDF
- cumulative distribution function
- DSB
- double-strand break
- E
- embryonic day
- ES
- embryonic stem
- FCS
- fluorescence correlation spectroscopy
- HR
- homologous recombination
- HU
- hydroxy-urea
- IR
- ionizing radiation
- MMC
- mitomycin C
- PSF
- point spread function
- ROI
- region of interest
- SPT
- single-particle tracking
- TIRF
- total internal reflection fluorescence
References
- Abraham J., Lemmers B., Hande M.P., Moynahan M.E., Chahwan C., Ciccia A., Essers J., Hanada K., Chahwan R., Khaw A.K., et al. 2003. Eme1 is involved in DNA damage processing and maintenance of genomic stability in mammalian cells. EMBO J. 22:6137–6147 10.1093/emboj/cdg580 [DOI] [PMC free article] [PubMed] [Google Scholar]
- Abràmoff M.D., Magalhães P.J., and Ram S.J.. 2004. Image processing with ImageJ. Biophotonics International. 11:36–42. [Google Scholar]
- Adams D.J., Quail M.A., Cox T., van der Weyden L., Gorick B.D., Su Q., Chan W.I., Davies R., Bonfield J.K., Law F., et al. 2005. A genome-wide, end-sequenced 129Sv BAC library resource for targeting vector construction. Genomics. 86:753–758 10.1016/j.ygeno.2005.08.003 [DOI] [PubMed] [Google Scholar]
- Agarwal S., van Cappellen W.A., Guénolé A., Eppink B., Linsen S.E., Meijering E., Houtsmuller A., Kanaar R., and Essers J.. 2011. ATP-dependent and independent functions of Rad54 in genome maintenance. J. Cell Biol. 192:735–750 10.1083/jcb.201011025 [DOI] [PMC free article] [PubMed] [Google Scholar]
- Anastassiadis K., Fu J., Patsch C., Hu S., Weidlich S., Duerschke K., Buchholz F., Edenhofer F., and Stewart A.F.. 2009. Dre recombinase, like Cre, is a highly efficient site-specific recombinase in E. coli, mammalian cells and mice. Dis. Model. Mech. 2:508–515 10.1242/dmm.003087 [DOI] [PubMed] [Google Scholar]
- Brugmans L., Verkaik N.S., Kunen M., van Drunen E., Williams B.R., Petrini J.H., Kanaar R., Essers J., and van Gent D.C.. 2009. NBS1 cooperates with homologous recombination to counteract chromosome breakage during replication. DNA Repair (Amst.). 8:1363–1370 10.1016/j.dnarep.2009.09.002 [DOI] [PMC free article] [PubMed] [Google Scholar]
- Cadiñanos J., and Bradley A.. 2007. Generation of an inducible and optimized piggyBac transposon system. Nucleic Acids Res. 35:e87 10.1093/nar/gkm446 [DOI] [PMC free article] [PubMed] [Google Scholar]
- Carreira A., and Kowalczykowski S.C.. 2011. Two classes of BRC repeats in BRCA2 promote RAD51 nucleoprotein filament function by distinct mechanisms. Proc. Natl. Acad. Sci. USA. 108:10448–10453 10.1073/pnas.1106971108 [DOI] [PMC free article] [PubMed] [Google Scholar]
- Chen P.L., Chen C.F., Chen Y., Xiao J., Sharp Z.D., and Lee W.H.. 1998. The BRC repeats in BRCA2 are critical for RAD51 binding and resistance to methyl methanesulfonate treatment. Proc. Natl. Acad. Sci. USA. 95:5287–5292 10.1073/pnas.95.9.5287 [DOI] [PMC free article] [PubMed] [Google Scholar]
- Chen C.F., Chen P.L., Zhong Q., Sharp Z.D., and Lee W.H.. 1999. Expression of BRC repeats in breast cancer cells disrupts the BRCA2-Rad51 complex and leads to radiation hypersensitivity and loss of G2/M checkpoint control. J. Biol. Chem. 274:32931–32935 10.1074/jbc.274.46.32931 [DOI] [PubMed] [Google Scholar]
- Chenouard N., Smal I., de Chaumont F., Maška M., Sbalzarini I.F., Gong Y., Cardinale J., Carthel C., Coraluppi S., Winter M., et al. 2014. Objective comparison of particle tracking methods. Nat. Methods. 11:281–289 10.1038/nmeth.2808 [DOI] [PMC free article] [PubMed] [Google Scholar]
- Cox J., and Mann M.. 2008. MaxQuant enables high peptide identification rates, individualized p.p.b.-range mass accuracies and proteome-wide protein quantification. Nat. Biotechnol. 26:1367–1372 10.1038/nbt.1511 [DOI] [PubMed] [Google Scholar]
- Cox J., Neuhauser N., Michalski A., Scheltema R.A., Olsen J.V., and Mann M.. 2011. Andromeda: a peptide search engine integrated into the MaxQuant environment. J. Proteome Res. 10:1794–1805 10.1021/pr101065j [DOI] [PubMed] [Google Scholar]
- Davies A.A., Masson J.-Y., McIlwraith M.J., Stasiak A.Z., Stasiak A., Venkitaraman A.R., and West S.C.. 2001. Role of BRCA2 in control of the RAD51 recombination and DNA repair protein. Mol. Cell. 7:273–282 10.1016/S1097-2765(01)00175-7 [DOI] [PubMed] [Google Scholar]
- Dickson R.M., Cubitt A.B., Tsien R.Y., and Moerner W.E.. 1997. On/off blinking and switching behaviour of single molecules of green fluorescent protein. Nature. 388:355–358 10.1038/41048 [DOI] [PubMed] [Google Scholar]
- Duong T., Goud B., and Schauer K.. 2012. Closed-form density-based framework for automatic detection of cellular morphology changes. Proc. Natl. Acad. Sci. USA. 109:8382–8387 10.1073/pnas.1117796109 [DOI] [PMC free article] [PubMed] [Google Scholar]
- Erdel F., Müller-Ott K., Baum M., Wachsmuth M., and Rippe K.. 2011. Dissecting chromatin interactions in living cells from protein mobility maps. Chromosome Res. 19:99–115 10.1007/s10577-010-9155-6 [DOI] [PubMed] [Google Scholar]
- Essers J., Hendriks R.W., Swagemakers S.M., Troelstra C., de Wit J., Bootsma D., Hoeijmakers J.H., and Kanaar R.. 1997. Disruption of mouse RAD54 reduces ionizing radiation resistance and homologous recombination. Cell. 89:195–204 10.1016/S0092-8674(00)80199-3 [DOI] [PubMed] [Google Scholar]
- Essers J., Hendriks R.W., Wesoly J., Beerens C.E., Smit B., Hoeijmakers J.H., Wyman C., Dronkert M.L., and Kanaar R.. 2002a. Analysis of mouse Rad54 expression and its implications for homologous recombination. DNA Repair (Amst.). 1:779–793 10.1016/S1568-7864(02)00110-6 [DOI] [PubMed] [Google Scholar]
- Essers J., Houtsmuller A.B., van Veelen L., Paulusma C., Nigg A.L., Pastink A., Vermeulen W., Hoeijmakers J.H., and Kanaar R.. 2002b. Nuclear dynamics of RAD52 group homologous recombination proteins in response to DNA damage. EMBO J. 21:2030–2037 10.1093/emboj/21.8.2030 [DOI] [PMC free article] [PubMed] [Google Scholar]
- Essers J., Houtsmuller A.B., and Kanaar R.. 2006. Analysis of DNA recombination and repair proteins in living cells by photobleaching microscopy. Methods Enzymol. 408:463–485 10.1016/S0076-6879(06)08029-3 [DOI] [PubMed] [Google Scholar]
- Gibson D.G., Young L., Chuang R.-Y., Venter J.C., Hutchison C.A. III, and Smith H.O.. 2009. Enzymatic assembly of DNA molecules up to several hundred kilobases. Nat. Methods. 6:343–345 10.1038/nmeth.1318 [DOI] [PubMed] [Google Scholar]
- Grünwald D., Martin R.M., Buschmann V., Bazett-Jones D.P., Leonhardt H., Kubitscheck U., and Cardoso M.C.. 2008. Probing intranuclear environments at the single-molecule level. Biophys. J. 94:2847–2858 10.1529/biophysj.107.115014 [DOI] [PMC free article] [PubMed] [Google Scholar]
- Haaf T., Golub E.I., Reddy G., Radding C.M., and Ward D.C.. 1995. Nuclear foci of mammalian Rad51 recombination protein in somatic cells after DNA damage and its localization in synaptonemal complexes. Proc. Natl. Acad. Sci. USA. 92:2298–2302 10.1073/pnas.92.6.2298 [DOI] [PMC free article] [PubMed] [Google Scholar]
- Haupts U., Maiti S., Schwille P., and Webb W.W.. 1998. Dynamics of fluorescence fluctuations in green fluorescent protein observed by fluorescence correlation spectroscopy. Proc. Natl. Acad. Sci. USA. 95:13573–13578 10.1073/pnas.95.23.13573 [DOI] [PMC free article] [PubMed] [Google Scholar]
- Haustein E., and Schwille P.. 2007. Trends in fluorescence imaging and related techniques to unravel biological information. HFSP J. 1:169–180 10.2976/1.2778852 [DOI] [PMC free article] [PubMed] [Google Scholar]
- He Y., Burov S., Metzler R., and Barkai E.. 2008. Random time-scale invariant diffusion and transport coefficients. Phys. Rev. Lett. 101:058101 10.1103/PhysRevLett.101.058101 [DOI] [PubMed] [Google Scholar]
- Heyer W.D., Ehmsen K.T., and Liu J.. 2010. Regulation of homologous recombination in eukaryotes. Annu. Rev. Genet. 44:113–139 10.1146/annurev-genet-051710-150955 [DOI] [PMC free article] [PubMed] [Google Scholar]
- Hockemeyer D., Soldner F., Beard C., Gao Q., Mitalipova M., DeKelver R.C., Katibah G.E., Amora R., Boydston E.A., Zeitler B., et al. 2009. Efficient targeting of expressed and silent genes in human ESCs and iPSCs using zinc-finger nucleases. Nat. Biotechnol. 27:851–857 10.1038/nbt.1562 [DOI] [PMC free article] [PubMed] [Google Scholar]
- Hoogstraten D., Nigg A.L., Heath H., Mullenders L.H., van Driel R., Hoeijmakers J.H., Vermeulen W., and Houtsmuller A.B.. 2002. Rapid switching of TFIIH between RNA polymerase I and II transcription and DNA repair in vivo. Mol. Cell. 10:1163–1174 10.1016/S1097-2765(02)00709-8 [DOI] [PubMed] [Google Scholar]
- Jaqaman K., Loerke D., Mettlen M., Kuwata H., Grinstein S., Schmid S.L., and Danuser G.. 2008. Robust single-particle tracking in live-cell time-lapse sequences. Nat. Methods. 5:695–702 10.1038/nmeth.1237 [DOI] [PMC free article] [PubMed] [Google Scholar]
- Jensen R.B., Carreira A., and Kowalczykowski S.C.. 2010. Purified human BRCA2 stimulates RAD51-mediated recombination. Nature. 467:678–683 10.1038/nature09399 [DOI] [PMC free article] [PubMed] [Google Scholar]
- Jeyasekharan A.D., Ayoub N., Mahen R., Ries J., Esposito A., Rajendra E., Hattori H., Kulkarni R.P., and Venkitaraman A.R.. 2010. DNA damage regulates the mobility of Brca2 within the nucleoplasm of living cells. Proc. Natl. Acad. Sci. USA. 107:21937–21942 10.1073/pnas.1009577107 [DOI] [PMC free article] [PubMed] [Google Scholar]
- Jeyasekharan A.D., Liu Y., Hattori H., Pisupati V., Jonsdottir A.B., Rajendra E., Lee M., Sundaramoorthy E., Schlachter S., Kaminski C.F., et al. 2013. A cancer-associated BRCA2 mutation reveals masked nuclear export signals controlling localization. Nat. Struct. Mol. Biol. 20:1191–1198 10.1038/nsmb.2666 [DOI] [PMC free article] [PubMed] [Google Scholar]
- Katagiri T., Saito H., Shinohara A., Ogawa H., Kamada N., Nakamura Y., and Miki Y.. 1998. Multiple possible sites of BRCA2 interacting with DNA repair protein RAD51. Genes Chromosomes Cancer. 21:217–222 10.1002/(SICI)1098-2264(199803)21:3<217::AID-GCC5>3.0.CO;2-2 [DOI] [PubMed] [Google Scholar]
- Kerssemakers J.W., Munteanu E.L., Laan L., Noetzel T.L., Janson M.E., and Dogterom M.. 2006. Assembly dynamics of microtubules at molecular resolution. Nature. 442:709–712 10.1038/nature04928 [DOI] [PubMed] [Google Scholar]
- Krawczyk P.M., Eppink B., Essers J., Stap J., Rodermond H., Odijk H., Zelensky A., van Bree C., Stalpers L.J., Buist M.R., et al. 2011. Mild hyperthermia inhibits homologous recombination, induces BRCA2 degradation, and sensitizes cancer cells to poly (ADP-ribose) polymerase-1 inhibition. Proc. Natl. Acad. Sci. USA. 108:9851–9856 10.1073/pnas.1101053108 [DOI] [PMC free article] [PubMed] [Google Scholar]
- Liu J., Doty T., Gibson B., and Heyer W.D.. 2010. Human BRCA2 protein promotes RAD51 filament formation on RPA-covered single-stranded DNA. Nat. Struct. Mol. Biol. 17:1260–1262 10.1038/nsmb.1904 [DOI] [PMC free article] [PubMed] [Google Scholar]
- Löbrich M., Shibata A., Beucher A., Fisher A., Ensminger M., Goodarzi A.A., Barton O., and Jeggo P.A.. 2010. γH2AX foci analysis for monitoring DNA double-strand break repair: strengths, limitations and optimization. Cell Cycle. 9:662–669 10.4161/cc.9.4.10764 [DOI] [PubMed] [Google Scholar]
- Magwood A.C., Malysewich M.J., Cealic I., Mundia M.M., Knapp J., and Baker M.D.. 2013. Endogenous levels of Rad51 and Brca2 are required for homologous recombination and regulated by homeostatic re-balancing. DNA Repair (Amst.). 12:1122–1133 10.1016/j.dnarep.2013.10.006 [DOI] [PubMed] [Google Scholar]
- Mazza D., Abernathy A., Golob N., Morisaki T., and McNally J.G.. 2012. A benchmark for chromatin binding measurements in live cells. Nucleic Acids Res. 40:e119 10.1093/nar/gks701 [DOI] [PMC free article] [PubMed] [Google Scholar]
- Meijering E., Dzyubachyk O., and Smal I.. 2012. Methods for cell and particle tracking. Methods Enzymol. 504:183–200 10.1016/B978-0-12-391857-4.00009-4 [DOI] [PubMed] [Google Scholar]
- Mizuta R., LaSalle J.M., Cheng H.L., Shinohara A., Ogawa H., Copeland N., Jenkins N.A., Lalande M., and Alt F.W.. 1997. RAB22 and RAB163/mouse BRCA2: proteins that specifically interact with the RAD51 protein. Proc. Natl. Acad. Sci. USA. 94:6927–6932 10.1073/pnas.94.13.6927 [DOI] [PMC free article] [PubMed] [Google Scholar]
- Montenegro Gouveia S., Leslie K., Kapitein L.C., Buey R.M., Grigoriev I., Wagenbach M., Smal I., Meijering E., Hoogenraad C.C., Wordeman L., et al. 2010. In vitro reconstitution of the functional interplay between MCAK and EB3 at microtubule plus ends. Curr. Biol. 20:1717–1722 10.1016/j.cub.2010.08.020 [DOI] [PubMed] [Google Scholar]
- Nagai T., Ibata K., Park E.S., Kubota M., Mikoshiba K., and Miyawaki A.. 2002. A variant of yellow fluorescent protein with fast and efficient maturation for cell-biological applications. Nat. Biotechnol. 20:87–90 10.1038/nbt0102-87 [DOI] [PubMed] [Google Scholar]
- Rajendra E., and Venkitaraman A.R.. 2010. Two modules in the BRC repeats of BRCA2 mediate structural and functional interactions with the RAD51 recombinase. Nucleic Acids Res. 38:82–96 10.1093/nar/gkp873 [DOI] [PMC free article] [PubMed] [Google Scholar]
- Roy R., Chun J., and Powell S.N.. 2012. BRCA1 and BRCA2: different roles in a common pathway of genome protection. Nat. Rev. Cancer. 12:68–78 10.1038/nrc3181 [DOI] [PMC free article] [PubMed] [Google Scholar]
- Saeki H., Siaud N., Christ N., Wiegant W.W., van Buul P.P.W., Han M., Zdzienicka M.Z., Stark J.M., and Jasin M.. 2006. Suppression of the DNA repair defects of BRCA2-deficient cells with heterologous protein fusions. Proc. Natl. Acad. Sci. USA. 103:8768–8773 10.1073/pnas.0600298103 [DOI] [PMC free article] [PubMed] [Google Scholar]
- Sanchez H., Reuter M., Yokokawa M., Takeyasu K., and Wyman C.. 2014. Taking it one step at a time in homologous recombination repair. DNA Repair (Amst.). 20:110–118 10.1016/j.dnarep.2014.02.012 [DOI] [PubMed] [Google Scholar]
- Schlacher K., Christ N., Siaud N., Egashira A., Wu H., and Jasin M.. 2011. Double-strand break repair-independent role for BRCA2 in blocking stalled replication fork degradation by MRE11. Cell. 145:529–542 10.1016/j.cell.2011.03.041 [DOI] [PMC free article] [PubMed] [Google Scholar]
- Schütz G.J., Schindler H., and Schmidt T.. 1997. Single-molecule microscopy on model membranes reveals anomalous diffusion. Biophys. J. 73:1073–1080 10.1016/S0006-3495(97)78139-6 [DOI] [PMC free article] [PubMed] [Google Scholar]
- Schwille P., Kummer S., Heikal A.A., Moerner W.E., and Webb W.W.. 2000. Fluorescence correlation spectroscopy reveals fast optical excitation-driven intramolecular dynamics of yellow fluorescent proteins. Proc. Natl. Acad. Sci. USA. 97:151–156 10.1073/pnas.97.1.151 [DOI] [PMC free article] [PubMed] [Google Scholar]
- Shahid T., Soroka J., Kong E.H., Malivert L., McIlwraith M.J., Pape T., West S.C., and Zhang X.. 2014. Structure and mechanism of action of the BRCA2 breast cancer tumor suppressor. Nat. Struct. Mol. Biol. 21:962–968 10.1038/nsmb.2899 [DOI] [PMC free article] [PubMed] [Google Scholar]
- Sharan S.K., Morimatsu M., Albrecht U., Lim D.S., Regel E., Dinh C., Sands A., Eichele G., Hasty P., and Bradley A.. 1997. Embryonic lethality and radiation hypersensitivity mediated by Rad51 in mice lacking Brca2. Nature. 386:804–810 10.1038/386804a0 [DOI] [PubMed] [Google Scholar]
- Siaud N., Barbera M.A., Egashira A., Lam I., Christ N., Schlacher K., Xia B., and Jasin M.. 2011. Plasticity of BRCA2 function in homologous recombination: genetic interactions of the PALB2 and DNA binding domains. PLoS Genet. 7:e1002409 10.1371/journal.pgen.1002409 [DOI] [PMC free article] [PubMed] [Google Scholar]
- Speil J., and Kubitscheck U.. 2010. Single ovalbumin molecules exploring nucleoplasm and nucleoli of living cell nuclei. Biochim. Biophys. Acta. 1803:396–404 10.1016/j.bbamcr.2009.10.010 [DOI] [PubMed] [Google Scholar]
- Stark J.M., Hu P., Pierce A.J., Moynahan M.E., Ellis N., and Jasin M.. 2002. ATP hydrolysis by mammalian RAD51 has a key role during homology-directed DNA repair. J. Biol. Chem. 277:20185–20194 10.1074/jbc.M112132200 [DOI] [PubMed] [Google Scholar]
- Tan T.L., Essers J., Citterio E., Swagemakers S.M., de Wit J., Benson F.E., Hoeijmakers J.H., and Kanaar R.. 1999. Mouse Rad54 affects DNA conformation and DNA-damage-induced Rad51 foci formation. Curr. Biol. 9:325–328 10.1016/S0960-9822(99)80142-0 [DOI] [PubMed] [Google Scholar]
- Testa G., Vintersten K., Zhang Y., Benes V., Muyrers J.P., and Stewart A.F.. 2004. BAC engineering for the generation of ES cell-targeting constructs and mouse transgenes. Methods Mol. Biol. 256:123–139. [DOI] [PubMed] [Google Scholar]
- Thomann D., Rines D.R., Sorger P.K., and Danuser G.. 2002. Automatic fluorescent tag detection in 3D with super-resolution: application to the analysis of chromosome movement. J. Microsc. 208:49–64 10.1046/j.1365-2818.2002.01066.x [DOI] [PubMed] [Google Scholar]
- Thompson R.E., Larson D.R., and Webb W.W.. 2002. Precise nanometer localization analysis for individual fluorescent probes. Biophys. J. 82:2775–2783 10.1016/S0006-3495(02)75618-X [DOI] [PMC free article] [PubMed] [Google Scholar]
- Thorslund T., McIlwraith M.J., Compton S.A., Lekomtsev S., Petronczki M., Griffith J.D., and West S.C.. 2010. The breast cancer tumor suppressor BRCA2 promotes the specific targeting of RAD51 to single-stranded DNA. Nat. Struct. Mol. Biol. 17:1263–1265 10.1038/nsmb.1905 [DOI] [PMC free article] [PubMed] [Google Scholar]
- Tokunaga M., Imamoto N., and Sakata-Sogawa K.. 2008. Highly inclined thin illumination enables clear single-molecule imaging in cells. Nat. Methods. 5:159–161 10.1038/nmeth1171 [DOI] [PubMed] [Google Scholar]
- Ulbrich M.H., and Isacoff E.Y.. 2007. Subunit counting in membrane-bound proteins. Nat. Methods. 4:319–321. [DOI] [PMC free article] [PubMed] [Google Scholar]
- Uringa E.J., Baldeyron C., Odijk H., and Wassenaar E., van Cappellen W.A., Maas A., Grootegoed A.J., Hoeijmakers J.H.J., Baarends W.M., Kanaar R., and Essers J.. 2014. A mRad51-GFP antimorphic allele affects homologous recombination and DNA damage sensitivity. DNA Repair (Amst.). In press. [DOI] [PubMed] [Google Scholar]
- van den Wildenberg S.M., Bollen Y.J., and Peterman E.J.. 2011. How to quantify protein diffusion in the bacterial membrane. Biopolymers. 95:312–321 10.1002/bip.21585 [DOI] [PubMed] [Google Scholar]
- van Royen M.E., Cunha S.M., Brink M.C., Mattern K.A., Nigg A.L., Dubbink H.J., Verschure P.J., Trapman J., and Houtsmuller A.B.. 2007. Compartmentalization of androgen receptor protein–protein interactions in living cells. J. Cell Biol. 177:63–72 10.1083/jcb.200609178 [DOI] [PMC free article] [PubMed] [Google Scholar]
- Van Royen M.E., van Cappellen W.A., Geverts B., Schmidt T., Houtsmuller A.B., and Schaaf M.J.. 2014. Androgen receptor complexes probe DNA for recognition sequences by short random interactions. J. Cell Sci. 127:1406–1416 10.1242/jcs.135228 [DOI] [PubMed] [Google Scholar]
- van Veelen L.R., Essers J., van de Rakt M.W., Odijk H., Pastink A., Zdzienicka M.Z., Paulusma C.C., and Kanaar R.. 2005. Ionizing radiation-induced foci formation of mammalian Rad51 and Rad54 depends on the Rad51 paralogs, but not on Rad52. Mutat. Res. 574:34–49 10.1016/j.mrfmmm.2005.01.020 [DOI] [PubMed] [Google Scholar]
- Vaughn J.P., Cirisano F.D., Huper G., Berchuck A., Futreal P.A., Marks J.R., and Iglehart J.D.. 1996. Cell cycle control of BRCA2. Cancer Res. 56:4590–4594. [PubMed] [Google Scholar]
- Weisshart K., Jüngel V., and Briddon S.J.. 2004. The LSM 510 META - ConfoCor 2 system: an integrated imaging and spectroscopic platform for single-molecule detection. Curr. Pharm. Biotechnol. 5:135–154 10.2174/1389201043376913 [DOI] [PubMed] [Google Scholar]
- Wilkinson D.J.2011. Stochastic modeling for systems biology. Second edition Chapman & Hall/CRC Press, Boca Raton, FL: 363 pp. [Google Scholar]
- Williams B.R., Mirzoeva O.K., Morgan W.F., Lin J., Dunnick W., and Petrini J.H.. 2002. A murine model of Nijmegen breakage syndrome. Curr. Biol. 12:648–653 10.1016/S0960-9822(02)00763-7 [DOI] [PubMed] [Google Scholar]
- Xie X.S., Choi P.J., Li G.W., Lee N.K., and Lia G.. 2008. Single-molecule approach to molecular biology in living bacterial cells. Annu Rev Biophys. 37:417–444 10.1146/annurev.biophys.37.092607.174640 [DOI] [PubMed] [Google Scholar]
- Yu D.S., Sonoda E., Takeda S., Huang C.L., Pellegrini L., Blundell T.L., and Venkitaraman A.R.. 2003. Dynamic control of Rad51 recombinase by self-association and interaction with BRCA2. Mol. Cell. 12:1029–1041 10.1016/S1097-2765(03)00394-0 [DOI] [PubMed] [Google Scholar]
- Zhang B., Zerubia J., and Olivo-Marin J.C.. 2007. Gaussian approximations of fluorescence microscope point-spread function models. Appl. Opt. 46:1819–1829 10.1364/AO.46.001819 [DOI] [PubMed] [Google Scholar]
Associated Data
This section collects any data citations, data availability statements, or supplementary materials included in this article.