

Abstract
A Mn(II) chelating dendrimer was prepared as a contrast agent for MRI applications. The dendrimer comprises six tyrosine-derived [Mn(EDTA)(H2O)]2− moieties coupled to a cyclotriphosphazene core. Variable temperature 17O NMR revealed a single water co-ligand per Mn(II) that undergoes fast water exchange (kex = (3.0±0.1) × 108 s−1 at 37 °C). The 37 °C per Mn(II) relaxivity ranged from 8.2 to 3.8 mM−1s−1 from 0.47 to 11.7T, and is 6-fold higher on a per molecule basis. From this field dependence a rotational correlation time was estimated as 0.45±0.02 ns. The imaging and pharmacokinetic properties of the dendrimer were compared to clinically used [Gd(DTPA)(H2O)]2− in mice at 4.7T. On first pass, the higher per ion relaxivity of the dendrimer resulted in 2-fold greater blood signal than for [Gd(DTPA)(H2O)]2−. Blood clearance was fast and elimination occurred through both the renal and hepatobiliary routes. This Mn(II) containing dendrimer represents potential alternative to Gd-based contrast agents, especially in patients with chronic kidney disease where the use of current Gd-based agents may be contraindicated.
Keywords: MRI, imaging, manganese, contrast agent, NMR
Introduction
Contrast enhanced computed tomography (CT) and magnetic resonance imaging (MRI) play an integral role in modern diagnostic medicine. For CT scans, a contrast agent (a hydrophilic, polyiodinated small molecule) is administered to attenuate X-ray radiation and generate high-resolution images delineating vascular anatomy and soft-tissue structures. In MRI scans, a Gd(III)-based contrast agent is used for similar purposes but operates by catalytically shortening the 1H longitudinal (T1) relaxation time of the endogenous water NMR signal.1 This results in stronger signal in T1-weighted images. At our institution, 53% of all MRI scans include the use of a Gd(III) contrast agent. This wide usage comes from the versatility of information provided by the contrast agent which is used to diagnose and stage many cancers, characterize strokes, detect vascular narrowings, blockages, and aneurysms in blood vessels, and to determine cardiac viability after heart attack, amongst several other applications.
Chronic kidney disease (CKD) is a widespread medical problem that affects 17% of the U.S. population,2 and similar numbers worldwide. CKD is increasing in prevalence as a result of the epidemics of diabetes and obesity. Patients with CKD are often contraindicated for the use of CT or MRI contrast agents. Almost all contrast agents are cleared predominantly by the kidney and if kidney function is impaired, the body experiences prolonged exposure to the contrast agent which can lead to severe side effects. In patients with poor kidney function, the high dose of iodinated CT contrast is associated with contrast induced nephropathy (CIN), which is the third leading cause of hospital acquired renal failure.3,4 Gd(III) is associated with a rare but potentially fatal condition called nephrogenic systemic fibrosis (NSF) in patients with impaired renal function.5,6 As a result, patients with glomerular filtration rates under 30 mL/min/1.73 m2 are typically precluded from contrast enhanced MRI. The incidence of NSF has been virtually eliminated as a result of administration guidelines based on renal function,7,8 but this comes at the expense of denying critical diagnostic information to the CKD patient population. Patient preclusion is not viable in all cases as contrast enhancement is often key to diagnostic accuracy and pre-surgical decisions, and here the risk:benefit ratio must be weighed.3,9
We sought to develop a MRI contrast agent that would be suitable for the CKD population, and that would exhibit properties that would make it an attractive alternative to any of the clinically approved Gd(III)-based contrast agents. Our requirements were for a non-Gd(III) compound with high water solubility and high relaxivity that was rapidly eliminated by both the kidneys and liver after intravenous administration.
We designed a hexameric compound based on high spin Mn(II). Mn(II) possesses potent nuclear T1-relaxation properties analogous to Gd(III).10 The [Mn(EDTA)(H2O)]2− complex is amongst the most stable Mn(II) complexes and exhibits a favorable toxicity profile; LD50 = 7 mmol/kg in rats.11 We previously showed that backbone-substituted EDTA forms sufficiently stable complexes with Mn(II) such that they can be used for in vivo imaging.12 To increase relaxivity at standard and high magnetic fields, we designed a multimeric probe that would have an intermediate rotational correlation time.13,14 In addition, the relaxivity of the compound is further increased by incorporating 6 Mn(II) ions per molecule. However the size of this hexamer should still be small enough to extravasate from the blood vessels and have similar distribution to conventional clinically used Gd(III) chelates like [Gd(DTPA)(H2O)]2−. Such a small molecule will be rapidly cleared via the kidneys. In order to achieve a significant fraction of hepatobiliary clearance, we incorporated a phenyl ring into each EDTA chelator. Simple addition of an aromatic group has been used to direct liver uptake in clinical liver imaging agents like [Gd(EOB-DTPA)(H2O)]2− and 99mTc-HIDA.15–17 A further benefit of using a Mn(II) based agent in the context of CKD is that both free and protein bound Mn(II) are excreted through the hepatobiliary pathway.18 Thus if there is some dechelation of Mn(II) that occurs in vivo, then there is an efficient elimination pathway for this essential element.
Mn(II) has prior precedence as a clinical contrast agent. Infusions of Mn(II) dipyridoxal diphosphate (mangafodipir) have been used to delineate focal lesions in the liver and pancreas.19–22 However, the observed contrast in these organs is largely due to uptake of de-chelated Mn(II) by hepatocytes and subsequent enterohepatic recirculation;23 the ligand acts as a mechanism for controlled release. Stable chelates that could potentially extend applications of Mn(II)-based contrast are highly desirable.12,24–31
Here we introduce a hexanuclear Mn(II)-containing dendrimer designed for multipurpose MRI contrast. We synthesized a bi-functional Mn(II) EDTA chelator derived from tyrosine. The phenol side chain was exploited in a convergent synthesis with hexachlorocyclotriphosphazene (N3P3Cl6) to create a compact dendrimer. Here we describe the synthesis of the hexamer, its characterization, and its in vivo MR imaging properties.
Results and Discussion
Synthesis
The structure and syntheses of the monomeric and dendrimeric ligands are depicted in Schemes 1 and 2. Fmoc-Tyr(Bzl)-OH (1) was activated with isobutyl chloroformate and reacted with NH3•H2O to give Fmoc-Ty(Bzl)-NH2 (2). Removal of Fmoc with piperidine in DMF afforded Ty(Bzl)-amide (3) which was then reduced to the corresponding diamine (4) with BH3•THF. Exhaustive N-alkylation of 4 with tert-butyl bromoacetate gave the O-protected Tyr-EDTA structure (5) in good yield. Debenzylation afforded carboxylate protected monomeric ligand (6), which was then reacted with N3P3Cl6 in acetonitrile at 60°C for 48 hours to yield the protected dendrimer (7). Acid cleavage of the tert-butyl esters yielded either the monomeric or dendrimeric ligands and the products were isolated via precipitation with ether and further purified using RP-HPLC.
Scheme 1.
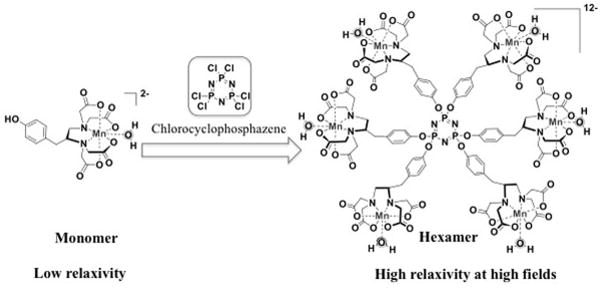
Monomeric Mn(II) chelate and hexameric dendimer.
Scheme 2.
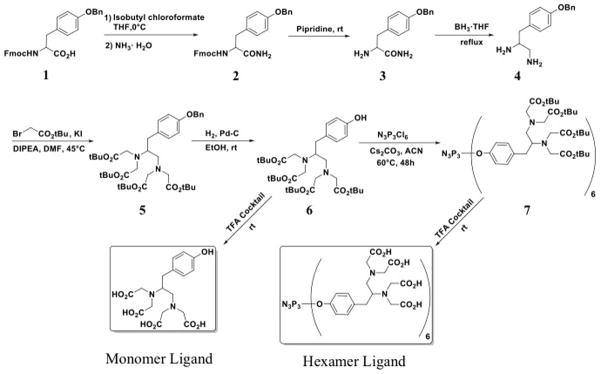
Synthesis of monomeric and dendrimeric Mn(II) ligands.
The Mn(II) complexes were prepared by mixing ligand and Mn(II) in pH 7.4 HEPES buffer. To determine the precise ligand concentration, we titrated an aliquot of ligand solution with Mn(II) and monitored the T2 of the solution. Mn(II) is a potent T2-relaxation agent and r2 (see below) at 1.4T (59.5 mM−1s−1) is much greater than that measured for the monomeric (4.3 mM−1s−1) and hexameric (13.2 mM−1s−1) complexes. Plotting 1/T2 vs [Mn] results in a sharp inflection once [Mn] > [ligand] (Supplemental). Guided by this data, we could ensure preparation of samples containing 1:1 or 6:1 Mn:ligand without the need for further chromatography.
NMR Characterization
The in vitro efficiency of a contrast agent is described by its relaxivity (r1 or r2, in mM−1s−1), defined as the paramagnetically induced change in 1H-relaxation rate (1/T1,2 in units of s−1) normalized to concentration of the metal ion in mM. Relaxivity is dependent on the number of inner-sphere water ligands (q), the mean residency time of the water co-ligand(s) (τm), the molecular rotational correlation time (τR) and the applied magnetic field.1,13,32 Relaxivity scales with q at all field strengths and the effects of solution dynamics with changing field are well established.13,14 Briefly, 2<τm<25 and 0.5<τR<2 ns will afford a high r1 over a broad range of magnetic fields, including the higher fields used in clinical and preclinical imaging.
First, we determined the hydration state (q) by measuring the T2-relaxivity of H217O ( ) as a function of temperature (Figure 1). The maximum was shown to be directly proportional to q at field strength >7T.33 The values of both the monomeric and dendrimeric chelates, 459 and 449 mM−1s−1, respectively, are consistent with q=1.
Figure 1.
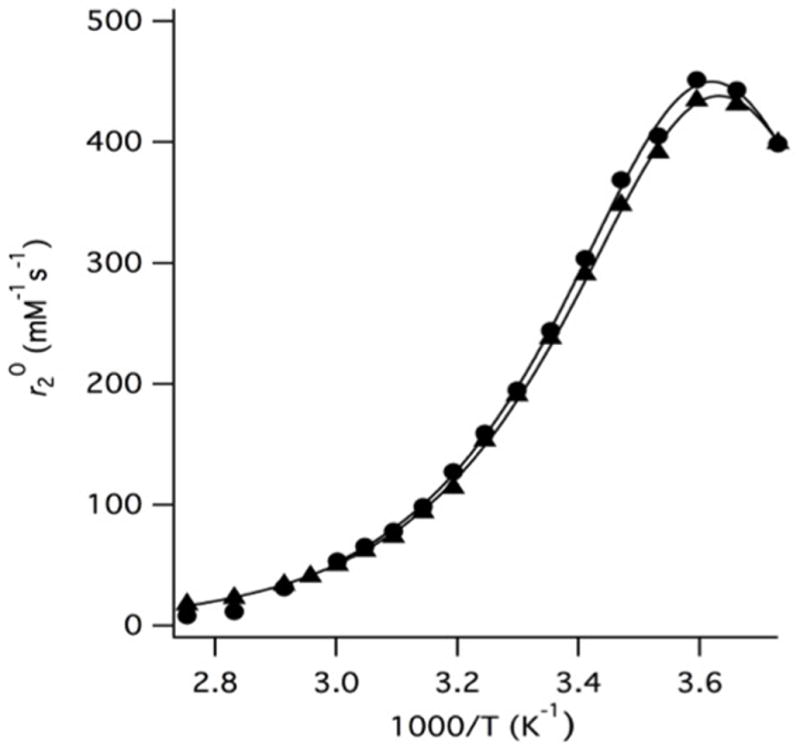
of the monomeric (circles) and dendrimeric (triangles) Mn(II) complexes as a function of temperature. Solid lines represent fits to the data. The hydration state and water exchange parameters are virtually unchanged upon incorporation of the monomer into the hexameric dendrimer.
While the maximum in Figure 1 is used to estimate q, the entire temperature dependent curve can be analysed to measure the water exchange kinetic parameters and the Mn-17O hyperfine coupling constant (Ao/ħ). We estimated Ao/ħ, the water residency time at 37 °C (τm310), and the enthalpy of activation for water exchange (ΔH‡) using a three-parameter fit as previously described.33 Table 1 shows these parameters for the monomeric and dendrimeric Mn(II) complexes. Both the hydration state and exchange parameters are similar to those reported for [Mn(EDTA)(H2O)]2− and prior reported small molecule Mn(II) derivatives of the EDTA chelate.12,34,35 Interestingly, incorporation within the dendrimer does not seem to affect τm. Previous studies on a Mn(II) complex designed to non-covalently bind to human serum albumin revealed a 4-fold increase in τm upon macromolecular association.33 If dendrimeric incorporation imparts a structural effect on the Mn(II) chelate, it is not reflected in τm.
Table 1.
Mn(II) hydration state (q), Mn-17O hyperfine coupling constant, water exchange parameters and rotational correlation time.
| q | Ao/ħ (107 rad/s) | τm310 (ns) | ΔH≠ (kJ mol−1) | τR310 (ps) | |
|---|---|---|---|---|---|
| Monomer | 1 | 2.92±0.02 | 3.3±0.1 | 35.6±0.3 | 450±20 |
| Dendrimer | 1 | 2.85±0.04 | 3.3±0.1 | 35.0±0.3 | 80±3 |
The T1-relaxivity was measured as a function of applied magnetic field between 0.47 and 11.7T. (Figure 2, Table 2). Per Mn(II) r1 decreases from 8.2 to 3.8 mM−1s−1 (49.6 to 22.8 mM−1s−1 per molecule) with increasing field strength. We used this field dependence to estimate τR for the dendrimer (Figure 2).13,36 The relaxivity contribution arising from outer- and second-sphere effects was estimated from the r1 of the q=0 complex [Mn(DTPA)]3−.33 The data were analysed using the Lipari-Szabo formalism applied to Solomon-Bloembergen-Morgan theory, as described previously.37 An order parameter (S2) to account for contributions to r1 arising from fast motions of the individual of chelates was necessary to achieve a satisfactory fit.38 S2 can vary between 0 and 1; S2 = 0 corresponds to rotation dominated solely by fast local motions whereas S2 = 1 means chelate motion is fully coupled to global motion. The fit yielded a τR of 450 ± 20 ns and S2= 0.74±0.01, indicating a highly isotropic motion. The fast local correlation time could not be determined except that this correlation time must be shorter than 50 ps. The r1 data for the monomer yielded a τR of 80 ± 3 ps.
Figure 2.

Inner-sphere per Mn(II) r1 of the monomer (circles) and dendrimer (triangles) as a function of applied magnetic field. Inner-sphere contribution to r1 estimated by subtracting the relaxivity of [Mn(DTPA]3− from the observed relaxivity of the dendrimer. The solid line represents a best fit to the data, see text.
Table 2.
Measured per Mn(II) relaxivities at 37°C, pH 7.4 as a function of applied field strength, and comparison with published values for clinically used Gd(III)-based compounds.
| 0.47T | 1.4T | 4.7T | 9.4T | 11.7T | |
|---|---|---|---|---|---|
| Hexamer | 8.2 | 8.2 | 6.6 | 4.3 | 3.8 |
| Monomer | 3.6 | 3.2 | 3.0 | 3.1 | 3.1 |
| [Gd(DTPA)(H2O)]2− | 3.8a | 3.3a,d | 3.8a | 3.1b | -- |
| [Gd(HP-DO3A)(H2O)] | 3.1a,4.3c | 2.9a,d,3.2c | 2.8a,3.6c | 3.0c | 2.9c |
| [Gd(DO3A-butrol)(H2O)] | 3.7a | 3.3a,d | 2.8a | -- | -- |
| [Gd(DOTA)(H2O)]− | 3.4a | 2.9a,d | 2.8a | 3.0b | 3.0b |
| [Gd(DTPA-BMEA)(H2O)] | 4.2a | 3.8a,d | 3.8a | 4 | -- |
| [Gd(DTPA-BMA)(H2O)] | 3.5a | 3.3a,d | 3.3a | -- | -- |
| [Gd(BOPTA)(H2O)]2− | 4.2a | 4.0a,d | 4.0a | -- | -- |
| [Gd(EOB-DTPA)(H2O)]2− | 5.3a | 4.7a,d | 4.9a | -- | -- |
The in vitro r1 data is compared with clinically used Gd(III)-based agents in Table 2 (structures in Supplemental). The dendrimer outperforms all of these Gd-based contrast agents at all field strengths tested in this study in terms of its ionic relaxivity.
In Vivo Evaluation
Inspired by the promising in vitro data, the in vivo performance of the Mn(II) dendrimer was evaluated in normal mice (N=4). Images were acquired pre and post contrast agent injection (t = 0 – 35 mins, Supplemental) on a 4.7T animal MRI scanner. The commercial extracellular contrast agent [Gd(DTPA)(H2O)]2− was used as a comparison. We compared both compounds at an equivalent metal ion dose of 200 μmol/kg which is a common clinical dose for MR angiography. In this study we wanted to compare the in vivo signal enhancing property of the Mn dendrimer to [Gd(DTPA)(H2O)]2−, and also to assess its pharmacokinetics and routes of elimination. Therefore we positioned the mouse in the scanner with an indwelling catheter in the tail vein to allow for dynamic imaging immediately following injection of the contrast agent. We performed rapid (1 min per acquisition) 3D T1-weighted MRI of the torso covering the heart to the kidneys to assess signal enhancement and rates and routes of elimination.
Figure 3 shows that intravenous injection of either [Gd(DTPA)(H2O)]2− or the Mn dendrimer results in an immediate marked increase in signal in the blood pool. However there is an obviously higher signal after the Mn dendrimer administration compared to [Gd(DTPA)(H2O)]2−. Quantification across all animals of the increase in vascular signal-to-noise ratio (SNR) at the one minute time compared to baseline resulted in a 260±80% SNR increase for [Gd(DTPA)(H2O)]2− compared with a 510±70% SNR increase for the Mn dendrimer, a 2-fold improvement. After this initial increase in SNR, the signal in the blood pool rapidly approached baseline for both [Gd(DTPA)(H2O)]2− and the Mn dendrimer, Figure 3. From this change in blood signal we estimated blood half-lives of 3.1±1.0 and 4.0±1.8 minutes for [Gd(DTPA)(H2O)]2− and the Mn dendrimer, respectively (Supplemental).
Figure 3.
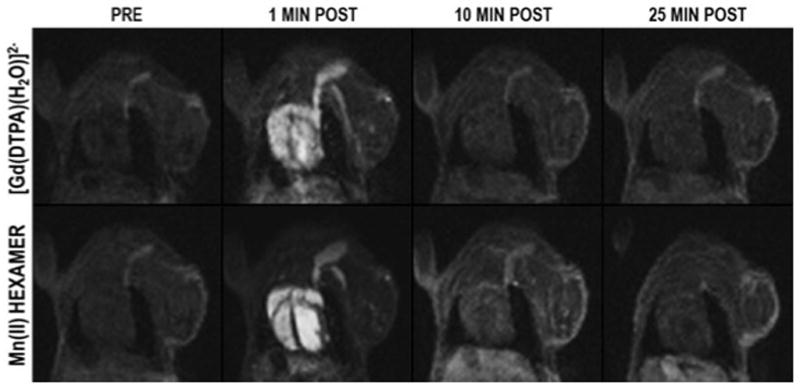
Coronal images of the chest of a mouse acquired pre- and 1, 10, and 25 minutes post-injection of [Gd(DTPA)(H2O)]2− and dendrimeric Mn (II) chelate. Selected slice shows the heart and jugular vein and demonstrates dramatic signal enhancement of the blood pool immediately after injection, but rapid washout with time. At one minute post injection [Gd(DTPA)(H2O)]2− gave a 260±80% increase in vascular signal-to-noise ratio (SNR) compared to baseline (N=4), while the Mn(II) dendrimer increased SNR 510±70%, a 2-fold improvement over [Gd(DTPA)(H2O)]2−.
[Gd(DTPA)(H2O)]2− is exclusively cleared via the kidneys and the imaging confirms this. After initial enhancement, the signal in the blood and other organs (except the kidney) is rapidly reduced. The Mn dendrimer, on the other hand, exhibited both renal and hepatobiliary clearance. Figure 4 shows a time course of images at two slice positions showing the signal in the kidney, liver, heart, gall bladder, and blood for the Mn dendrimer. The signal in the blood and kidneys is high post injection but decreases rapidly with time as the compound is cleared into the urine. We also observe strong liver enhancment as well that washes out with time. Hepatobiliary clearance is demonstrated by the growing signal in the gall bladder with time. Averaged SNR vs. time curves for the kidneys, liver, left ventricle, and gallbladder are shown in the supplementary materials.
Figure 4.
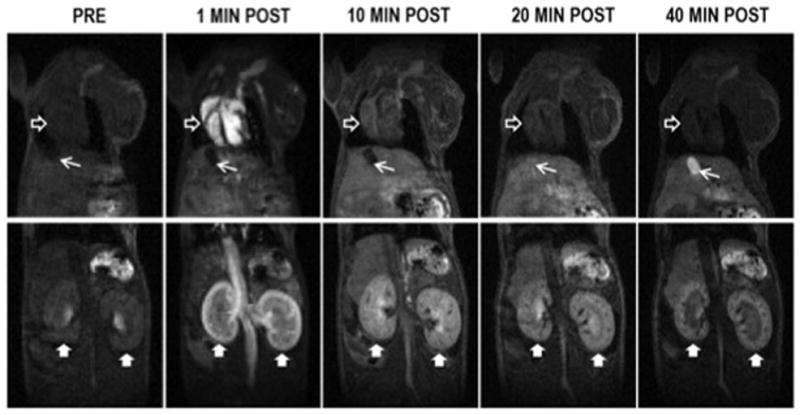
Time course of signal intensity in the heart (empty arrowhead), liver (beneath heart), kidneys (filled arrowheads), and gallbladder (arrow) following injection of the Mn(II) dendrimer. The signal in the blood and kidneys is high post injection but decreases rapidly with time as the compound clears into the urine. Strong signal enhancement that washes out with time is also evident in the liver. Gallbladder signal grows with time demonstrating hepatobiliary clearance. The image obtained one minute post injection was acquired with lower spatial resolution (0.375 mm3 isotropic) to allow sampling of peak vascular enhancement with higher temporal resolution. The images at later time points were obtained with 0.25mm3 spatial resolution.
These results demonstrate the potential of this Mn(II) dendrimer as a multipurpose MRI contrast agent for patients contraindicated for Gd(III) contrast agents. The dendrimer exhibits similar blood clearance to [Gd(DTPA)(H2O)]2− but provides a mixed renal and hepatobiliary clearance. We anticipate that this dendrimer can provide similar utility to clinically used agents like [Gd(DTPA)(H2O)]2−: tumor detection, perfusion, angiography, etc. In addition, the significant hepatobiliary enhancement offers the potential to identify and characterize liver lesions analogous to [Gd(EOB-DTPA)(H2O)]2−. In renally impaired patients, hepatobiliary clearance offers an effective means for elimination of the contrast agent. Finally, the high relaxivity offers the possibility of greater signal enhancement or equivalent enhancement to conventional agents but at a lower dose.
Conclusions
We have developed a new Mn(II) chelating dendrimer built from six EDTA chelators assembled via a cyclotriphosphazene core. The N3P3Cl6 synthon provides easy access to a densely loaded and rigid multi-nuclear scaffold to minimize chelate local motions. The 6 Mn(II) ions per molecule and intermediate correlation time confer a high relaxivity across a wide range of applied field strengths. In vitro, the per Mn(II) r1 of the dendrimer outperforms clinically used Gd(III) contrast agents between 0.47 and 11.7T. On a per molecule basis, r1 is improved by over an order of magnitude. In mice scanned at 4.7T, the vascular SNR in T1-weighted images is 2–fold enhanced over that achieved using [Gd(DTPA)(H2O)]2−. Clearance occurred through both renal and hepatobiliary routes. The imaging data suggests potential utility as a multi-purpose contrast agent. For example, the extracellular distribution and rapid clearance suggest angiography and tumor imaging applications; the hepatobiliary clearance suggests application in imaging of the liver and hepatobiliary tree. This novel imaging scaffold could be advantageous to the large CKD population for whom Gd(III) and iodinated radiocontrast are contraindicated.
Experimental Section
General
1H NMR (500 MHz), 13CNMR (126 MHz) and 31P NMR (202 MHz) spectra were recorded on Varian 11.7T spectrometer. Chemical shifts are shown in ppm (δ) with tetramethylsilane as an internal standard. Liquid chromatography-electrospray mass spectrometry (LC-MS) was performed using an Agilent 1100 Series apparatus with an LC/MSD trap and Daly conversion dynode detector with UV detection at 220, 254 and 280 nm. The methods used on this system are as follows: (A) Luna C18 column (100 x 2 mm); eluent A: H2O/0.1% formic acid, B: MeCN/0.1% formic acid; gradient: 5% B to 95% B over 9 minutes; flow rate 0.8mL/min (used for characterization of organic compounds), and (B) Kromasil C18 ultra aqueous column (250 x 4.6 mm); eluent A: 10 mM ammonium acetate, B: 95% MeCN/5% 10mM ammonium acetate; gradient 5% C to 8% C over 15 minutes; flow rate 0.8 ml/min. Thin-layer chromatography (TLC) was executed on precoated Kieselgel 60 F254 plates (Merck), with compounds visualized by UV light.
Relaxivity measurements were performed on Bruker mq60 and mq20 Minispec at 20 MHz (0.47T) and 60 MHz (1.4T), a Bruker MRI scanner at 200 MHz (4.7T) and Varian NMR spectrometers at 400 MHz (9.4T) and 500 MHz (11.7T) at 37°C in HEPES buffer (100 mM. pH = 7.4). Manganese concentrations were determined using an Agilent 7500a ICP-MS system. All samples were diluted with 0.1% Triton X-100 in 5% nitric acid containing 20 ppb of Lu (as internal standard). The ratio of Mn (54.94)/Lu (174.97) was used to quantify the manganese concentration. A linear calibration curve ranging from 0.1 ppb to 200 ppb was generated daily for the quantification.
Synthesis
Fmoc-Ty(OBzl)-Amide (2)
At 0°C, isobutyl chloroformate (1.52g, 11.2mmol) was added to the mixture of 1 (4.93g, 10.0mmol), N-methylmorpholine (NMM, 2.10g, 20.0 mmol) in THF (100mL) and the reaction mixture stirred at 0°C for 0.5 h. Aqueous ammonia (30%, 1.2mL) was then added and the reaction mixture was stirred for 1 h at 0°C (the reaction solution is cloudy). The precipitate was filtered off (product and NMM•HCl salts) and an additional 1.2mL of NH3•H2O was added to the filtrate. The mixture stirred for another 0.5h at room temperature. The collected solids were suspended in EtOAc (200mL) and refluxed for 10min to redissolve the product. Insoluble NMM•HCl salts were removed by filtration and the filtrate was concentrated under vacuum until the solution became cloudy. Then, n-hexane (50 mL) was added to precipitate the products (white solid, 2.48g). Another 80 mL of n-hexane were added to the initial filtrate to precipitate an additional 2.04 g product (Together: 4.52 g, 92%.) 1H NMR (500 MHz, CDCl3) δ: 7.76 (d, J = 7.5 Hz, 2H), 7.54 (t, J = 8.1 Hz, 2H), 7.41-7.36 (m, 5H), 7.35 – 7.29 (m, 3H), 7.12 (s, br, 2H), 6.91 (d, J = 7.7 Hz, 2H), 5.56 (s, br, 1H), 5.29 (s, br, 2H), 5.02 (s, 2H), 4.45-4.39 (m, 2H), 4.19 (t, J = 6.4 Hz, 1H), 3.07-2.99 (m, 2H). 13C NMR (126 MHz, CDCl3) δ: 172.96, 157.93, 143.69, 143.64, 141.32, 136.86, 130.36, 128.58, 128.00, 127.75, 127.48, 127.09, 124.98, 120.00, 115.12, 77.26, 77.00, 76.75, 70.02, 66.91, 53.61, 47.19, 37.54. Molecular weight for MS (ESI): [M+H+] m/z = 493.4; calcd. = 493.2. Rt = 8.8min, method A.
Ty(Bzl)-amide (3)
Compound 2 (3.60 g, 7.30 mmol) was dissolved in a solution of 20% piperidine in DMF (40mL) and stirred at room temperature for 2 h. The volatiles were removed under vacuum and the residue re-dissolved in EtOAc. n-hexane was then added to precipitate white solids (1.90 g, 99%). 1H NMR (500 MHz, CDCl3) δ: 7.43-7.31 (m, 5H), 7.15 (d, J = 8.5 Hz, 2H), 7.08 (s, 1H), 6.94 (d, J = 8.5 Hz, 2H), 5.37 (s, 1H), 5.05 (s, 1H), 3.58 (dd, J = 9.3, 4.1 Hz, 1H), 3.19 (dd, J = 13.9, 4.0 Hz, 1H), 2.69 (dd, J = 13.9, 9.3 Hz, 1H). 13C NMR (126 MHz, CDCl3) δ: 177.33, 157.82, 136.98, 130.32, 129.95, 128.60, 127.99, 127.46, 115.12, 70.05, 56.56, 40.07. LC-MS: [M+H+] m/z = 271.3; calcd. = 271.2. Rt = 4.4 min, method A.
Ty(Bzl)-diamine (4)
Compound 3 (1.86g, 6.88mmol) was suspended in dry THF (10mL) and BH3•THF (1.0M, 26mL) was added. The reaction solution was refluxed for 12 h under N2. The reaction solution was cooled over ice and methanol was carefully added. Removal of solvent yielded yellow solids. The residue was partitioned between 1.0 M HCl (40mL) and Et2O (50mL) and stirred at room temperature for 1h. After removal of the organic layer, the solution was cooled over ice and pH was adjusted to 12 using NaOH. The solution was extracted with dichloromethane (3×50mL), dried over Na2SO4 and concentrated to a light-yellow solid (1.39g, 79%). 1H NMR (500 MHz, CDCl3) δ: 7.44-7.31 (m, 5H), 7.11 (d, J = 8.5 Hz, 2H), 6.92 (d, J = 8.5 Hz, 2H), 5.05 (s, 2H), 2.96 – 2.88 (m, 1H), 2.80-2.72 (m, AB, 2H), 2.53-2.43 (m, AB, 2H). 13C NMR (126 MHz, CDCl3) δ: 157.36, 137.10, 131.51, 130.14, 128.56, 127.92, 127.45, 114.87, 70.05, 55.25, 48.21, 41.41. LC-MS:[M+H+] m/z = 257.3; calcd. = 257.2. Rt = 5.6 min, method A.
Ty(OBzl)-EDTA-tBu-Ester (5)
To a mixture of 4 (1.39 g, 5.46 mmol), KI (0.91 g, 5.46 mmol), and DIPEA (5.64 g, 43.7 mmol) in dry DMF (30mL) was added tert-butylbromoacetate (8.52 g, 43.7 mmol). The reaction was stirred for 42 h at 50°C. The DMF was then removed under vacuum and the resultant residue dissolved in H2O (40mL) and EtOAc (80mL). The organic layer was separated and washed with water and brine, dried and evaporated. The residue was purified by column chromatography (SiO2, 1% Et3N in hexane/EtOAc=2/1) to afford the product as pale yellow oil. (3.65g, 93%). 1H NMR (500 MHz, CDCl3) δ: 7.41 – 7.22 (m, 5H), 7.06 (d, J = 7.6 Hz, 2H), 6.80 (m, 2H), 4.95 (s, 2H), 4.66 (s, 1H), 4.52 (m, 1H), 3.43 (s, 4H), 3.36 (s, 4H), 3.23 (m, 1H), 3.02 (m, 1H), 2.78 (m, 1H), 2.51 (m, 1H), 1.44 – 1.27 (m, 36H). 13C NMR (126 MHz, CDCl3) δ: 171.72, 170.80, 154.25, 131.20, 130.1, 115.35, 81.20, 81.05, 63.40, 56.30, 55.20, 53.65, 35.65, 28.20. LC-MS: [M+H+] m/z = 713.5; calcd. = 713.4. Rt = 9.6 min, method A.
Ty(OH)-EDTA-tBu-Ester (6)
Pd/C (10% by wt., 0.25 g) was added to the solution of 5 (0.60 mg, 0.84 mmol) in MeOH (20mL). The reaction mixture stirred under 1 atm N2 for 2 hour. The Pd/C was removed by filtration and the solution concentrated to a light-yellow oil which was further purified by column chromatography (DCM/EtOAc/1% Et3N, 0–20% EtOAc) to yield a colorless oil. (460mg, 74%). 1H NMR (500 MHz, CDCl3) δ: 7.07 (d, J = 8.3 Hz, 2H), 6.71 (d, J = 8.3 Hz, 2H), 4.02 (s, 1H), 3.49 (d, J = 3.1 Hz, 4H), 3.43 (d, J = 3.3 Hz, 4H), 3.12 – 3.03 (m, zH), 2.89 (dd, J = 13.4, 7.2 Hz, 2H), 2.82 (dd, J = 13.8, 5.6 Hz, 2H), 2.62 – 2.51 (m, 2H), 1.45 (s, 18H), 1.41 (s, 18H). 13C NMR (126 MHz, CDCl3) δ: 171.39, 170.95, 153.78, 132.35, 130.31, 115.07, 82.56, 80.69, 63.38, 56.27, 55.20, 53.59, 35.97, 28.14. LC-MS: [M+H+] m/z = 623.4; calcd. = 623.4. Rt = 7.4 min, method A.
Hexamer Ligand tBu-Ester (7)
Compound 6 (0.55 g, 0.83 mmol) and cesium carbonate (0.32 g, 0.97 mmol) were added to a solution of hexachlorocyclotriphosphazene (45.6 mg, 0.131 mmol) stirring at 0 °C in dry acetonitrile (20 mL) under N2. The reaction mixture was stirred at 45 °C for 2 d. Aliquots were removed to monitor the reaction by NMR. The mixture was cooled to room temperature, insoluble were removed by centrifugation and the clear solution concentrated under reduced pressure. Purification by flash chromatography (SiO2, 1% Et3N, Dichloromethane/EtOAc) to afforded 7 as a yellow oil. (0.42 g, 82%). 1H NMR (500 MHz, CDCl3) δ: 7.07 (d, J = 8.3 Hz, 12H), 6.90 (d, J = 8.6 Hz, 12H), 3.47 (d, J = 8.3 Hz, 24H), 3.43 (d, J = 4.9 Hz, 24H), 3.11-3.07 (m, 6H), 2.93-2.83 (m, 12H), 2.63-2.53 (m, 12H), 1.43 (s, 108H), 1.39 (s, 108H). 31P NMR (202 MHz, CDCl3) δ: 7.80. 13C NMR (126 MHz, CDCl3) δ171.31, 170.94, 130.15, 120.69, 80.66, 80.56, 63.42, 56.35, 55.40, 53.65, 28.26, 28.24. LC-MS: [M+2H+] m/2z 1934.0; calcd. 1933.0. [M+3H+] m/3z 12.89.4; calcd. 1289.3. [M+4H+] m/4z 967.2; cacld. 967.3. [M+5H+] m/5z 774.0; calcd. 773.7. [M+6H+] m/6z 645.3; calcd. 645.2. Rt = 6.2 min, method A.
Monomer ligand (Ty(OH)-EDTA-CO2H)
Compound 6 (0.20 g, 0.32 mmol) was dissolved in 10 mL TFA/H2O/TIPS (92.5/2.5/5.0) and the reaction was stirred for 2 hours. After concentration to dryness, the residue was purified by RP-HPLC to afford white solids (0.10 g, 78%). 1H NMR (500 MHz, D2O) δ: 7.02 (d, J = 7.2 Hz, 2H), 6.73 (d, J = 7.6 Hz, 2H), 3.78-3.42 (m, 9H), 3.10 (m, 2H), 2.91 (m, 1H), 2.49 (m, 1H). 13C NMR (126 MHz, D2O) δ: 173.25, 170.85, 154.43, 130.40, 128.09, 115.72, 60.83, 55.29, 54.46, 52.54, 31.64. LC-MS: [M+H+] m/z = 399.3; calcd. = 399.1. Rt = 3.6 min, method A.
Hexamer Ligand
Compound 7 (0.41 g, 0.11 mmol) was dissolved in 10 mL TFA/H2O/thioanisol/phenol/EDT (82.5/5.0/5.0/2.5, v/v) and stirred for 12 h at RT. The reaction was then cooled in an ice-bath and cold ether (50mL) was added in to precipitate the product. The precipitated product was isolated by centrifugation and washed with Et2O to yield white solids (0.20 g, 77%). 1H NMR (500 MHz, D2O, 10%=TFA) δ: 7.15 (d, J = 8.2 Hz, 12H), 6.84 (d, J = 8.2 Hz, 12H), 3.69 (d, J = 16.7 Hz, 12H), 3.55 (m, 24H), 3.45 (d, J = 16.7 Hz, 12H), 3.29 (m, 6H), 3.11 (m, 12H), 2.78 – 2.60 (m, 6H). 13C NMR (126 MHz, D2O, 10%TFA) δ: 174.12, 171.36, 163.06, 162.78, 148.66, 133.63, 130.78, 121.30, 117.43, 115.11, 61.16, 57.08, 54.88, 54.61, 31.71. 31P NMR (202 MHz, D2O, 10%TFA) δ: 8.57. LC-MS: LC-MS: [M+3H+] m/3z = 840.8; calcd. = 840.6. Rt = 4.7 min, method A.
Mn(II) Complexation and Ligand Concentration Determination
Mn(II) complexes used for NMR characterization were prepared in situ. The precise weight of isolated ligand needed to form 1:1 adduct with Mn(II) was determined by measuring 1/T2 of water as a standardized solution of MnCl2 was titrated to a known weight of ligand in pH 7.4 Tris buffer. [Mn(H2O)6]2+ is a much more potent T2-relaxation agent than either Mn-EDTA-derivatives. A plot of 1/T2 vs [Mn] is linear with slope r2 of the Mn EDTA-derivative when [Mn] < [L] and linear with slope r2 of [Mn(H2O)6]2+ when [Mn] > [L]. The [L] can be determined from the inflection of the 1/T2 vs [M] plot.
Mn(II) Monomer
Monomer ligand (1.70 mg, 4.10 μmol) was dissolved in 5 mL pH 7.4 Tris buffer and to this was added 210 μL of 19.4 mM MnCl2 (4.10 μmol). LC-MS: [M+3H+] m/z = 452.0; calcd. = 452.1. Rt = 3.4 min, method B.
Mn(II) Hexamer
To an aqueous solution of the hexameric ligand (60.0 mg, 0.024 mmol) (2.0 mL) was added MnCl2•4H2O (24.3 mg, 0.121 mmol) at RT. The pH was adjusted to 7.4 carefully with 0.2 M NaOH. Free Mn(II) was removed by passage through a cation-exchange column (Alltech®, IC-H column pretreated by washing with NaOH) equipped with conductivity meter. Fractions containing product were freeze-dried to yield white solids (60.0 mg, 85%). LC-MS: [M+15H+] m/3z = 946.2; calcd. = 946.2. Rt = 1.2 min, method B.
Animal Imaging
Animal imaging experiments were performed in accordance with the NIH Guide for the Care and Use of Laboratory Animals and were approved by the institution’s animal care and use committee. Four female A/J mice were imaged using a 4.7T small bore animal scanner (Bruker Biospin, Billerica, MA) and a custom-made volume coil. Animals were anesthetized with isoflurane (1–2%) and the tail vein was cannulated for intravenous delivery of the contrast agent.
The commercial extracellular contrast agent [Gd(DTPA)(H2O)]2− was used as a control. Both contrast agents were injected at a dose of 200 μmol/kg. Mn(II) hexamer was formulated in PBS at 42.3 mM. In 3 mice T1-weighted scans were acquired at baseline, followed by injection of Mn(II) hexamer and 45 minutes of post-contrast imaging. Next, [Gd(DTPA)(H2O)]2− was administered and imaging was performed for additional 20 minutes. In one animal, the order of the contrast agents was reversed. All imaging was performed with a three-dimensional fast low angle shot (3D FLASH) sequence, oriented coronally, and the following parameters: FOV 48×24 mm2, TE/TR/flip angle = 1.54ms/15ms/40°, averages = 1. We performed high resolution (matrix 192 x 96, 96 slices with 0.25 mm thickness, acquisition time = 2.3 minutes) and lower resolution (matrix 128 x 64, 64 slices with 0.38 mm thickness, acquisition time = 1 minute) imaging. Both sequences were run before contrast adminsitration. To maximize the temporal resolution immediately after injection of the contrast agent, the low resolution scan was repeated immediately following injection and then the sequences were interleaved.
Images were analyzed in Matlab (Version 7.12.0 (R2011a), MathWorks, Natick, MA) by drawing regions of interest and measuring signal intensity of the kidneys, liver, left ventricle, and gallbladder. Signal to noise ratios (SNR) were calculated as the ratio of tissue signal to background noise, where noise was defined as the standard deviation of the signal measured in air. Contrast agent washout was analyzed by plotting SNR vs time curves. A monoexponential fit of the SNR vs time curve of blood signal was used to calculate the vascular half-life of the Mn(II) agent.
Supplementary Material
Acknowledgments
This work was supported by grants from the National Cancer Institute (CA161221 to P.C. and a T32 postdoctoral fellowship to E.M.G., CA009502), and an instrument grant (RR023385) from National Center for Research Resources. J.Z. is supported by the China Scholarship Council (File No. 201208510160). I.A. is a Madrid-MIT M+Vision fellow. We would like to thank Prof. Jack Szostak for access to a 9.4T NMR spectrometer.
Footnotes
Supporting information for this article is given via a link at the end of the document.
References
- 1.Caravan P, Ellison JJ, McMurry TJ, Lauffer RB. Chem Rev. 1999;99:2293. doi: 10.1021/cr980440x. [DOI] [PubMed] [Google Scholar]
- 2.Saydah S, Eberhardt M, Rios-Burrows N, Williams D, Geiss L, Dorsey R. Morbidity and Mortality Weekly Report. 2007;56:161. [Google Scholar]
- 3.Walsh SR, Tang T, Gaunt ME, Boyle JR. J Endovasc Ther. 2007;14:92. doi: 10.1583/06-2035.1. [DOI] [PubMed] [Google Scholar]
- 4.Nash K, Hafeez A, Hou S. Am J Kidney Dis. 2002;39:930. doi: 10.1053/ajkd.2002.32766. [DOI] [PubMed] [Google Scholar]
- 5.Yang L, Krefting I, Gorovets A, Marzella L, Kaiser J, Boucher R, Rieves D. Radiology. 2012;265:248. doi: 10.1148/radiol.12112783. [DOI] [PubMed] [Google Scholar]
- 6.Perez-Rodriguez J, Lai S, Ehst BD, Fine DM, Bluemke DA. Radiology. 2009;250:371. doi: 10.1148/radiol.2502080498. [DOI] [PMC free article] [PubMed] [Google Scholar]
- 7.Kanal E, BAJ, Bell C, Borgstede JP, Bradley WG, Jr, Froelich JW, Gilk T, Gimbel JR, Gosbee J, Kuhni-Kaminski E, Lester JW, Jr, Nyenhuis J, Parag Y, Schaefer DJ, Scoumis-Sebek EA, Einreb JW, Zaremba LA, Wilcox LA, Lucey L, Sass N. AJR Am J Roentgenol. 2007;188:1447. doi: 10.2214/AJR.06.1616. [DOI] [PubMed] [Google Scholar]
- 8.Besheli LD, Aran S, Shaqdan K, Kay J, Abujudeh H. Clinic Radiol. 2014;69:661. doi: 10.1016/j.crad.2014.01.003. [DOI] [PubMed] [Google Scholar]
- 9.White CJ, Gray WA. Circulation. 2007;116:2203. doi: 10.1161/CIRCULATIONAHA.106.621391. [DOI] [PubMed] [Google Scholar]
- 10.Lauffer RB. Chem Rev. 1987;87:901. [Google Scholar]
- 11.Wolf GL, Burnett KR, Goldstein EJ, Joseph PM. Magnetic Resonance Annual 1985. Raven; New York: 1985. [PubMed] [Google Scholar]
- 12.Troughton JS, Greenfield MT, Greenwood JM, Dumas S, Wiethoff AJ, Wang J, Spiller M, McMurry TJ, Caravan P. Inorg Chem. 2004;43:6313. doi: 10.1021/ic049559g. [DOI] [PubMed] [Google Scholar]
- 13.Caravan P, Farrar CT, Frullano L, Uppal R. Contrast Media Mol Imag. 2009:89. doi: 10.1002/cmmi.267. [DOI] [PMC free article] [PubMed] [Google Scholar]
- 14.Boros E, Polasek M, Zhang Z, Caravan P. J Am Chem Soc. 2012;134:19858. doi: 10.1021/ja309187m. [DOI] [PMC free article] [PubMed] [Google Scholar]
- 15.Clément O, Mühler A, Vexler V, Berthezène Y, Brasch RC. Invest Radiol. 1992;27:612. [PubMed] [Google Scholar]
- 16.Seo HJ, Kim MJ, Lee JD, Chung WS, Kim YE. Invest Radiol. 2011;46:548. doi: 10.1097/RLI.0b013e31821a2163. [DOI] [PubMed] [Google Scholar]
- 17.Shea JA, Berlin JA, Escarce JJ, Clarke JR, Kinosian BP, Cabana MD, Tsai WW, Horangic N, Malet PF, Schwartz JS, Williams SV. Arch Intern Med. 1994;154:2573. [PubMed] [Google Scholar]
- 18.Davis CD, Zech SG, Greger JL. Proc Soc Exp Biol Med. 1993;202:103. doi: 10.3181/00379727-202-43518. [DOI] [PubMed] [Google Scholar]
- 19.Rocklage SM, Cacheris WP, Quay SC, Hahn FE, Raymond KN. Inorg Chem. 1989;28:477. [Google Scholar]
- 20.Jung G, Heindel W, Krahe T, Kugel H, Walter C, Fischbach R, Klaus H, Lackner K. Magn Reson Imag. 1998:925. doi: 10.1016/s0730-725x(98)00086-1. [DOI] [PubMed] [Google Scholar]
- 21.Chung JJ, Kim MJ, Kim KW. J Magn Res Imag. 2006;23:706. doi: 10.1002/jmri.20557. [DOI] [PubMed] [Google Scholar]
- 22.Colet JM, Elst LV, Muller RN. J Magn Res Imag. 1998;8:663. doi: 10.1002/jmri.1880080322. [DOI] [PubMed] [Google Scholar]
- 23.Baba Y, Lerch MM, Tanimoto A, Kreft BP, Saluja AK, Zhao L, Chen J, Steer ML, Stark DD. Invest Radiol. 1994;29:S300. doi: 10.1097/00004424-199406001-00103. [DOI] [PubMed] [Google Scholar]
- 24.Pellagatti L, Zhang J, Drahoš B, Villette S, Suzenet F, Guillaumet G, Petoud S, Tóth E. Chem Commun. 2008:6951. doi: 10.1039/b817343e. [DOI] [PubMed] [Google Scholar]
- 25.Drahoš B, Kotek J, Hermann P, Lukeš I, Tóth E. Inorg Chem. 2010;49:3224. doi: 10.1021/ic9020756. [DOI] [PubMed] [Google Scholar]
- 26.Drahoš B, Kubíček V, Bonnet CS, Hermann P, Lukeš I, Tóth E. Dalton Trans. 2011;40:1945. doi: 10.1039/c0dt01328e. [DOI] [PubMed] [Google Scholar]
- 27.Drahoš B, Pniok M, Havlíčková J, Kotek J, Císařová I, Hermann P, Lukeš I, Tóth E. Dalton Trans. 2011;40:10131. doi: 10.1039/c1dt10543d. [DOI] [PubMed] [Google Scholar]
- 28.Drahoš B, Kotek J, Císařová I, Hermann P, Helm L, Lukeš I, Tóth E. Inorg Chem. 2011;50:12785. doi: 10.1021/ic201935r. [DOI] [PubMed] [Google Scholar]
- 29.Drahoš B, Lukeš I, Tóth E. Eur J Inorg Chem. 2012;1974 [Google Scholar]
- 30.de Sá A, Bonnet CS, Geraldes CFGC, Tóth É, Ferreira PMT, André JP. Dalton Trans. 2013;42:4522. doi: 10.1039/c2dt32496b. [DOI] [PubMed] [Google Scholar]
- 31.Loving GS, Mukherjee S, Caravan P. J Am Chem Soc. 2013;135:4623. doi: 10.1021/ja312610j. [DOI] [PMC free article] [PubMed] [Google Scholar]
- 32.Caravan P. Chem Soc Rev. 2006;35:512. doi: 10.1039/b510982p. [DOI] [PubMed] [Google Scholar]
- 33.Gale EM, Zhu J, Caravan P. J Am Chem Soc. 2013;135:18600. doi: 10.1021/ja4094132. [DOI] [PMC free article] [PubMed] [Google Scholar]
- 34.Zetter MS, Grant MW, Wood EJ, Dodgen HW, Hunt JP. Inorg Chem. 1972;11:2701. [Google Scholar]
- 35.Aime S, Anelli PL, Botta M, Brocchetta M, Canton S, Fedeli F, Gianolio E, Terreno E. J Biol Inorg Chem. 2002;7:58. doi: 10.1007/s007750100265. [DOI] [PubMed] [Google Scholar]
- 36.Caravan P, Ellison JJ, McMurry TJ, Lauffer RB. Chem Rev (Washington, DC, U S) 1999;99:2293. doi: 10.1021/cr980440x. [DOI] [PubMed] [Google Scholar]
- 37.Caravan P, Parigi G, Chasse JM, Cloutier NJ, Ellison JJ, Lauffer RB, Luchinat C, McDermid SA, Spiller M, McMurry TJ. Inorg Chem. 2007;46:6632. doi: 10.1021/ic700686k. [DOI] [PubMed] [Google Scholar]
- 38.Lipari G, Szabo A. J Am Chem Soc. 1982;104:4546. [Google Scholar]
- 39.Rohrer M, Bauer H, Mintorovitch J, Requardt M, Weinmann HJ. Invest Radiol. 2005;40:715. doi: 10.1097/01.rli.0000184756.66360.d3. [DOI] [PubMed] [Google Scholar]
- 40.Livramento JB, Helm L, Sour A, O’Neil C, Merbach AE, Tóth E. Dalton Trans. 2008:1195. doi: 10.1039/b717390c. [DOI] [PubMed] [Google Scholar]
Associated Data
This section collects any data citations, data availability statements, or supplementary materials included in this article.