Abstract
Previous studies suggest that osteoarthritis (OA) is related to abnormal or excessive articular contact stress. The peak pressure resulting from an applied load is determined by many factors, among which is shape and relative position and orientation of the articulating surfaces or, referring to a more common nomenclature, joint congruence. It has been hypothesized that anatomical differences may be among the causes of OA. Individuals with less congruent joints would likely develop higher peak pressure and thus would be more exposed to the risk of OA onset. The aim of this work was to determine if the congruence of the first carpometacarpal (CMC) joint differs with the early onset of OA or with sex, as the female population has a higher incidence of OA. 59 without and 38 with early OA were CT-scanned with their dominant or arthritic hand in a neutral configuration. The proposed measure of joint congruence is both shape and size dependent. The correlation of joint congruence with pathology and sex was analyzed both before and after normalization for joint size. We found a significant correlation between joint congruence and sex due to the sex-related differences in size. The observed correlation disappeared after normalization. Although joint congruence increased with size, it did not correlate significantly with the onset of early OA. Differences in joint congruence in this population may not be a primary cause of OA onset or predisposition, at least for the CMC joint.
Keywords: Carpometacarpal Joint, Joint Congruence, Osteoarthritis, Etiology, Sex Differences
Introduction
Osteoarthritis (OA) is a very common and highly disabling disorder (Reginster, 2002; Lawrence et al., 2008) with a great socioeconomic impact and likely destined to increase even further in the future with aging populations (Kraus, 1997). In particular, the first carpometacarpal (CMC) joint is one of the joints that is most affected by osteoarthritis (Lawrence et al., 1966; Peyron, 1986), showing a significantly higher incidence in women than men (Wilder et al., 2006).
Although the OA terminal condition is the degradation of the articular surfaces, this pathology is no longer considered a disease of cartilage, but rather a global joint disorder, originating from a combination of systemic susceptibility and abnormal mechanical events. Many researchers suggest that cartilage degradation can be correlated with abnormal or excessive articular contact stress (Dekel and Weissman, 1978; Brandt et al., 2008; Radin et al., 1978; Jackson et al., 2004). This abnormal contact stress may result both from excessive load acting on a normal joint or from normal loading acting on a weakened articulation: ligament laxity, periarticular muscle weakness, or reduced proprioception may all lead to articular instability, exposing the joint to sudden impulsive loads and finally to high peak pressure (Brandt et al. 2006, McGonagle et al. 2010, Felson et al. 2000).
Since OA is always associated with degeneration of articular surfaces, some researchers hypothesized that anatomical differences may also be among the causes of OA predisposition (Felson et al. 2000, Bredbenner et al., 2010). In particular, investigating the CMC joint of 13 arthritic cadavers (eight females, average 64 year old, five males, average 70 year old, Eaton stage from I to III, Eaton and Glickel, 1987), Ateshian and coworkers (Ateshian et al., 1992) reported significant differences in articular curvatures with sex. The same authors suggested that these geometrical differences may explain the higher predisposition of women to OA. Indeed, as indicated by clinical experience (Sokoloff, 1969; Bullough, 1981) and theoretical computations (Ateshian et al., 1994; Wu et. al, 1997), peak contact pressure is affected also by the relative position and shape of the articulating surfaces in contact or, referring to medical terms, to the joint congruence. This refers to the geometric similarity of two articulating surfaces and is clinically taken as representative of the joint capability to distribute an applied load, under the assumption that the better the two surfaces mate each other, the smaller the peak pressure. Decreased congruence, as well as decreased contact areas due to a smaller joint size, may thus lead to increased peak pressures during similar activities and finally increase the risk of osteoarthritis.
Although this hypothesis sounds reasonable and intuitive, there is still no clear evidence indicating whether alterations of joint congruence are simply the effect or also the cause of OA. The aim of this paper is thus to test the hypothesis that individuals with less congruent joint are more exposed to the risk of developing OA.
Based on evidence that bony changes in osteoarthritic joints precede changes in articular cartilage by months or years (Hutton et al., 1986) and the previous studies suggesting that articular shape may be a contributing factor in OA initiation and progression (Felson et al. 2000, Bredbenner et al., 2010, Ateshian et al., 1992, Ateshian et al., 1994; Wu et. al, 1997), differences in joint congruence were investigated by analyzing subchondral bone surfaces within a population of asymptomatic and arthritic subjects with early OA through CT scans of their CMC joints. Joint congruence was evaluated with a measure that relies on the Winkler elastic foundation contact model (Conconi and Parenti-Castelli, 2014). This measure has the merit of making the ratio of the applied load to the resulting articular peak pressure a purely geometrical relation. This ratio is size dependent. For this reason, joint congruence is also normalized with respect to the dimension of each individual in order to identify possible differences in joint congruence other than those related to joint size.
Accordingly, the purpose of this study was to determine if joint congruence (Conconi and Parenti-Castelli, 2014) differs with sex, both prior and after normalization with respect to joint size, and to determine if joint congruence differs between asymptomatic subjects and patients with early OA.
Material and methods
Subject scanning and procedure
59 asymptomatic subjects (34 women with a mean ± SD age of 42.3 ± 16.4 and 25 men with a mean ± SD age of 36.8 ± 13.6) and 39 patients with early OA (31 women with a mean ± SD age of 53.9 ± 6.8 and 7 men with a mean ± SD age of 56.3 ± 6) (Eaton Stage I, Eaton and Glickel, 1987) were recruited as part of a larger study on CMC joint biomechanics (Halilaj et al., 2013; Halilaj, Laidlaw et al., 2014a; Halilaj, Laidlaw et al., 2014b; Halilaj, Rainbow et al., 2014; Halilaj, Moore et al., 2014). Radiological inspection confirmed the absence of pathology for the asymptomatic population. After receiving approval from the Institutional Review Board and completing informed consents, the thumb CMC joints in the dominant hands of the asymptomatic subjects and the affected hands of the OA patients were CT-scanned in a braced neutral position (Fig. 1), which was standardized with a modified Rolyan® Original adjustable wrist and thumb spica-splint brace (Patterson Medical, Bolingbrook, Illinois). The brace placed the wrist in approximately 0° flexion/extension and 0° ulnar/radial deviation and the thumb in approximately 0° of flexion/extension and 0° of adduction/abduction. Image volumes were generated with a 16-slice clinical CT scanner (General Electric, Milwaukee, WI), at tube settings of 80kVp and 40mA, slice thickness of 0.625mm, and in-plane resolution of 0.4mm x 0.4mm or better. The bones forming the CMC joint, the trapezium (tpm) and the first metacarpal (fmc), were segmented using commercial software (Mimics®, Materialise, Leuven, Belgium) and 3-D bone models were exported as polygon meshes.
Figure 1.
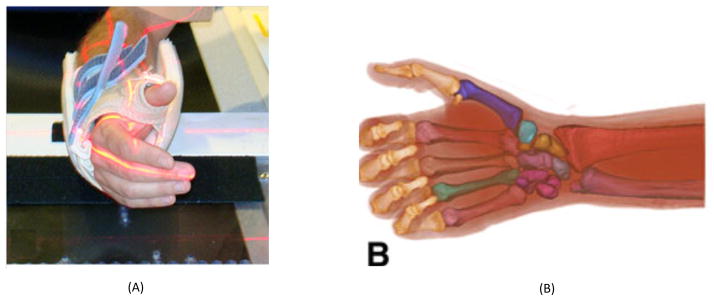
The scanning neutral positions shown by photograph (A) and respective 3D renderings of the CT scans (B).
The subchondral surfaces of the trapezium and the metacarpal were manually selected using Geomagic Studio® (Geomagic®, Research Triangle Park, NC) by carefully tracing the visible margins. The relative bone-to-bone distance was evaluated through distance maps (Tersi et. al 2010). The fifth percentile of the distance distribution of the trapezium with respect to the first metacarpal surface was considered as representative of the minimum joint space, in what follows indicated with ε.
Joint congruence
Currently, there is no general consensus on the definition of joint congruence or its evaluation. Nevertheless, any measure of joint congruence implies the choice of a contact model that makes possible the decoupling of the contribution of articular geometry to the distribution of a contact load. As shown in (Conconi and Parenti-Castelli, 2014), given two articulating surfaces in a prescribed relative position and orientation (or configuration), it is possible to derive a purely geometrical relation representing the ratio between the peak pressure p0 and the resultant of the pressure distribution at the contact, F, by means of the elastic foundation contact model. This relation can be considered as representative of the capability of an articulation, in a specific configuration, to distribute an applied load, and thus it can be used to evaluate the joint congruence. For the sake of clarity, the same relation will be derived here for a simple non-conforming contact (Fig. 2).
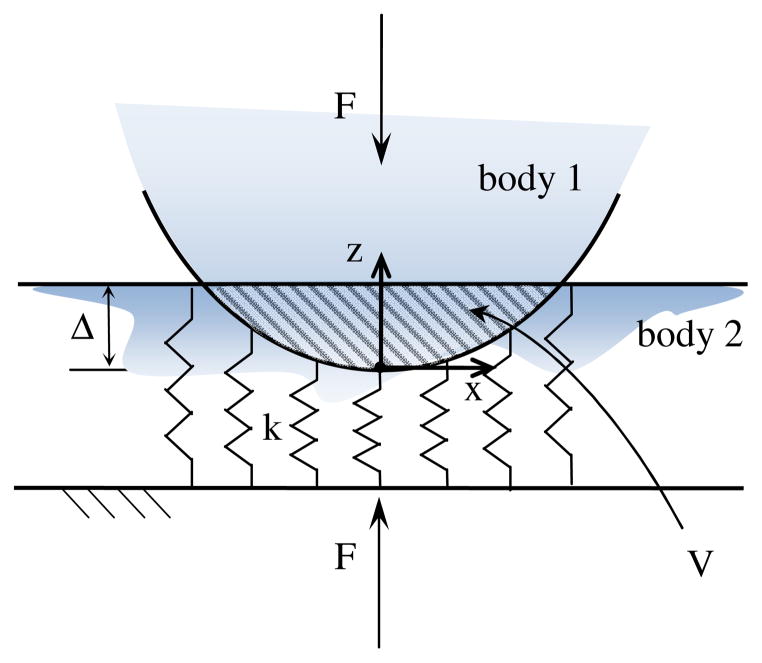
Figure 2.
Schematization of the Winkler contact model.
Let us consider a rigid body indenting a mattress of independent springs of constant stiffness k resting on a rigid base. We specify that there is no interaction between the adjacent springs (Johnson, 1985).
Defining δ(x, y) as the deformation of the spring at position (x, y), the contact pressure at the same location can be expressed as:
| (1) |
It follows that the peak pressure p0 will take place at the position of maximum indentation Δ, namely:
| (2) |
Defining A as the projection of the contact surface on a plane orthogonal to z, with dA being the infinitesimal area on which a single spring acts, the resultant F of the pressure distribution can be computed as:
| (3) |
where V is the volume of the Boolean intersection of the two undeformed bodies (corresponding to the dashed area in the cross sectional view of the contact depicted in Fig. 2).
Within this contact model, the ratio between the peak pressure and the resultant force becomes purely geometrical, i.e.:
| (4) |
The evaluation of Eq. (4) in physiological loading conditions presents some clinical difficulties, however. First, in order to measure an indentation, two scans (unloaded and loaded) of the same articulation are needed. Furthermore, normal indentation is close to the typical resolution of medical images and thus it is difficult to measure precisely. Finally, in order to make the comparison among different individuals possible, either Δ or V should be kept constant within the study population. Alternatively, it is possible to evaluate joint congruence with a single unloaded image if a virtual indentation is considered. This can be achieved by offsetting one bone surfaces by a prescribed threshold Δ. This new offset surface is then used for the evaluation of the intersection volume V.
Let us indicate with Stpm and Sfmc the undeformed and closed surfaces of trapezium and first metacarpal bones respectively, and with Vtpm and Vfmc their volumes (Fig. 3). The offset of Sfmc would be indicated with SΔ, where VΔ is the volume in it. The volume trapped between SΔ and Sfmc is called control volume Vc, i.e.
Figure 3.
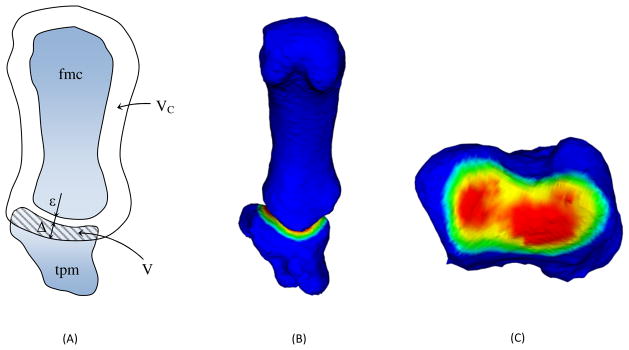
Schematization of the Winkler-based congruence measure: cross section showing the control volume, the offset threshold and the minimum joint space ε (A); 3D representation of the intersection volume (B); view of the trapezium (tpm) subchondral area, colored proportionally to its distance from the first metacarpal (fmc) subchondral surface (C).
| (5) |
The intersection volume can be measured as the volume of trapezium within the control volume, i.e.:
| (6) |
The congruence measure CM is defined as
| (7) |
Clearly, under a prescribed and constant value for the offset threshold Δ, the bigger V, the more congruent the considered joint will be.
It must be cautioned that, when the cartilage layer is not included in the scan, as in this study, an initial offset equal to minimum joint space ε is required in order to restore the contact for Δ = 0.
Finally, to make the comparison among different subjects possible, Δ has to be kept constant. Its value has been chosen as the mean of the threshold that makes the whole subchondral area of each subject included within the control volume.
Although here presented for a simple case, CM is general and holds also in the case of highly conforming surfaces, as in the case of most human joints (Conconi and Parenti-Castelli, 2014).
A significant example is provided by the knee. In this joint, the menisci increase the conformity between the tibial plateau and the femoral condyles, moving the initial contact at the periphery of the articulation and leaving an internal initial gap (Shrive, 1974; Kurosawa et al., 1980). It has been shown (Adeeb et al., 2004) that this geometry results in a better distribution of the applied load with respect to what a full congruent articulation would do. The application of CM confirms this result showing that, despite the initial internal gap, the menisci increase the joint congruence in comparison to a fully congruent contact (Fig. 4).
Figure 4.
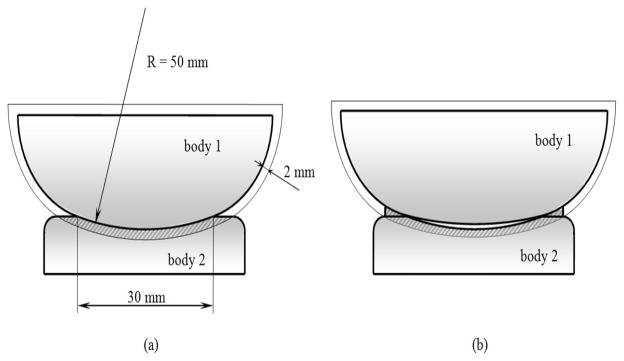
Evaluation of joint congruence for: (a) a full conforming contact, CM = 72.34 mm2; (b) a contact with peripheral structures, CM = 77.36 mm2. The internal gap in (b) is 0.25 mm, magnified in the figure for sake of clarity.
Normalization of the congruence measure
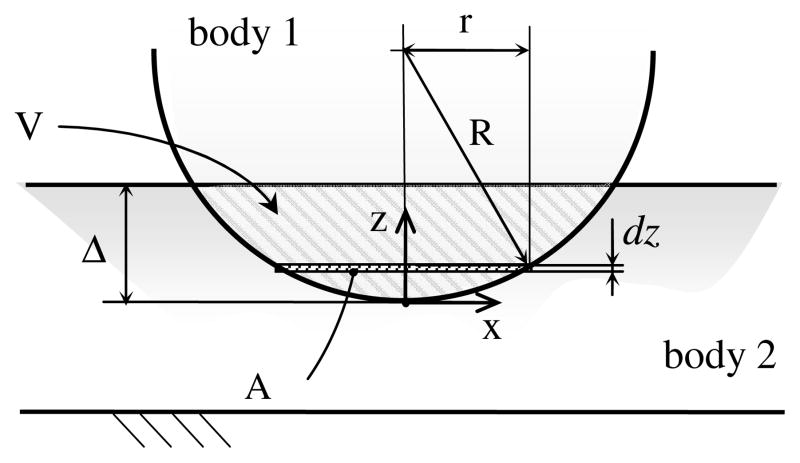
The presented measure of joint congruence depends on both the value chosen for the offset and the size of the joint, as can be seen when considering the case of a sphere of radius R touching a plane (Fig. 5). The intersection volume can be computed as the integral along z of the section of the sphere on an plane orthogonal to z. This section will be a circle of radius whose area is clearly
Figure 5.
Evaluation of the intersection volume V as the integral along z of the cross sectional area A.
| (8) |
The intersection volume can thus be evaluated as:
| (9) |
and CM will finally result:
| (10) |
Even for a constant value of Δ, congruence increases with R and thus with the size of the elements in contact. In order to consider the contribution of the shape of the contacting bodies to joint congruence, independently from the scale, CM has to be normalized. For the case of the sphere, this can be achieved by making the offset threshold δ proportional to R and then dividing CM by R2. In fact, if
| (11) |
then
| (12) |
and finally
| (13) |
We note that the value of the normalized joint congruence, cm, is constant for every sphere touching a plane. Similarly, joints differing by only a scale factor would have the same normalized joint congruence.
The definition of the CM normalization for the case of a general contact may be obtained in analogy with what is done for the sphere-plane contact.
The ratio of the volume Vfmc,i and the surface area Sfmc, i of the first metacarpal can be assumed to be proportional to R, while Sfmc,i is proportional to R2. In order to normalize with respect to the mean size of the study populations, all the volumes and areas are divided by their mean values (denoted with a tilde). The normalized offset threshold is thus:
| (14) |
while the normalized congruence measure, cm, is:
| (15) |
Statistical Analysis
Two-way ANOVAs were used to determine the effects of sex and pathology on the joint congruence both before and after normalizing with respect to the joint size. Statistical significance was set at p<0.05.
Results
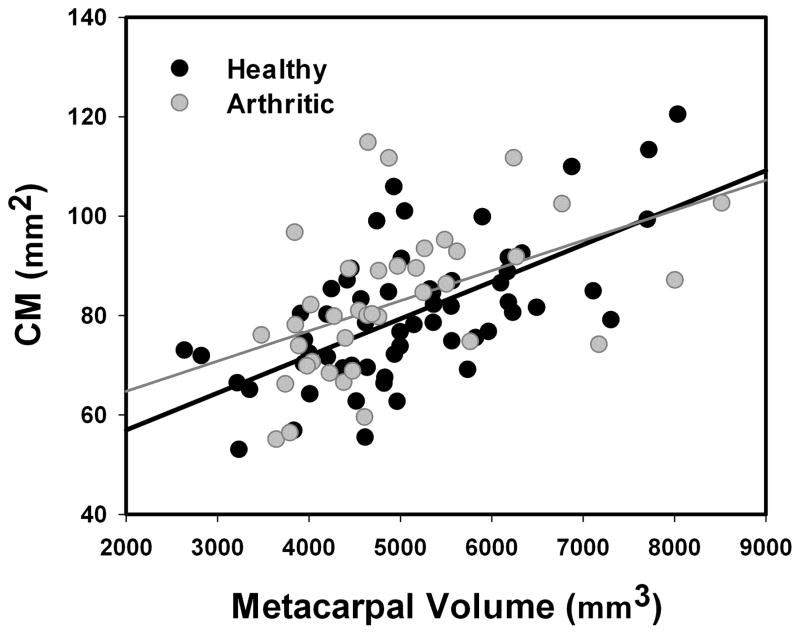
CM varied significantly with sex (p=0.007), with men showing higher mean (±SD) congruence (84.45 ± 13.10 mm2 for healthy individuals and 91.68 ± 14.47 mm2 for early stage of OA) than women (77.07 ± 13.83 mm2 for healthy individuals and 80.67 ± 14.18 mm2 for early stage of OA), but not with pathology onset (p=0.129). Also, CM was linearly correlated with joint size for both the healthy (R2=0.40, p<0.001, slope=0.0075) and pathological population (R2=0.24, p=0.002, slope= 0.0061, see Fig. 6).
Figure 6.
CM plotted versus first metacarpus volume. Red and blue lines are the linear interpolation of the healthy and arthritic population, respectively.
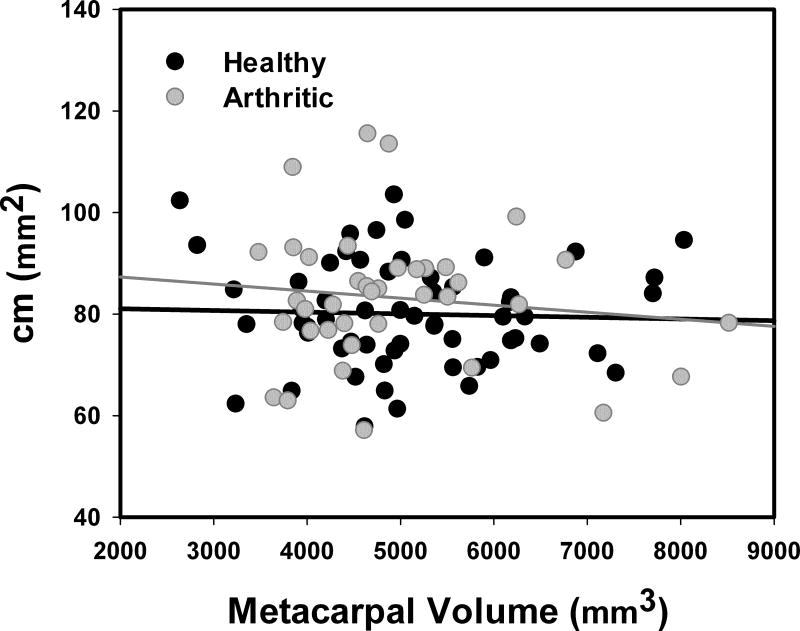
After normalization, however, cm was not significantly correlated with sex (p=0.115) or with pathology onset (p=0.366). The mean (±SD) values for men (77.88 ± 8.10 mm2 for healthy individuals and 79.10 ± 14.16 mm2 for early stage of OA) did not differ from those for women (81.56 ± 11.73 mm2 for healthy individuals and 84.14 ± 12.94 mm2 for early stage of OA). Furthermore, cm was independent of the joint size for both healthy (R2=0.001, p<0.772, slope=−0.0004) and pathological population (R2=0.016, p=0.455, slope=−0.0014, see Fig. 7).
Figure 7.
Normalized congruence measure cm plotted versus first metacarpus volume. Red and blue lines are the linear interpolation of the healthy and arthritic population, respectively.
Discussion
The aim of this work was to examine if a correlation exists between joint congruence and sex or early stage OA in the first carpometacarpal joint, in order to gain insight into the possible predisposition to OA. Individuals at the early stage of OA are considered as representative of a population with higher risk of developing the disease. Women are also considered as more susceptible OA (Wilder et al., 2006). Joint congruence was computed for all the subjects within the population under study, searching for correlation with early stage of pathology or sex.
Sex had a significant effect on joint congruence. This effect, however, disappeared when congruence was normalized with respect to joint size. The only sex-related difference in joint congruence was thus determined by the differences in size between men and women. This is in contrast with what was found in (Ateshian et al., 1992). However, the population of that study included 13 subjects at different Eaton’s stages (Eaton and Glickel, 1987). It is thus possible that the sex-related differences reported in that study were confounded by disease progression. This explanation and these current findings are also in agreement with recent study on the same population (Halilaj, Moore et al, 2014) who used a different metric of articular bone shape.
No correlation between joint congruence and OA was observable, both before and after normalization. This suggests that, although morphological variations among different individuals are possible, these variations do not alter the joint’s capability to distribute contact loads. Therefore, congruence abnormalities do not seems to be among the main causes of OA onset. The lack of correlation between joint congruence and OA does not imply however that other differences in the global joint geometry may not be among the causes of disease onset. Indeed, differences in the articular shape have been reported between healthy and pathological subjects using the same population (Halilaj, Moore et. al., 2014). Additionally, recent studies found a correlation between knee joint shape and OA (Bredbenner et al. 2010, Lynch et al. 2009) by means of statistical shape modeling. Differences in modal shape are not yet relatable to joint functionality. A comparison of these methods with the analysis of joint congruency may thus help in understanding how geometrical variations affect the joint behavior.
Despite the fact that joint congruence does vary with size, the performed analysis shows no correlation between early stage of the disease and joint congruence and thus neither between OA onset and joint size. Thus the scale effect may not represent a risk factor for the OA onset. This suggests that the peak pressure associated with the typical daily activities could be size independent due to a proportional differences in muscular strength between males and females.
A statistically not significant, though evident, trend can be observed in linear regression of both absolute and normalized congruence according to which arthritic subjects are more congruent than healthy subjects. Within the frame of the presented measure of congruence, this can be interpreted as the attempt of a pathological articulation to compensate abnormal peak pressure associated, although age related variations in subchondral curvatures with age (Halilaj, Moore et. al., 2014) may also affect this behavior.
Although the OA affects mainly weight-bearing joints, the results here presented are not limited by the non weight-bearing nature of the CMC joint. This articulation is in fact second only to the knee in term of disease incidence (Arden and Nevitt, 2006). Moreover, the articular peak pressure associated with normal activities is comparable among knee, CMC, hip and ankle (Fukubayashi and Kurosawa, 1980; Kiapour et al. 2012; Zheng et al. 2013; Krebs et al. 1991; Fitzpatrick et al., 2004). Thus, the CMC joint is analogous to other weight bearing joints in term of OA incidence and risk factors.
It must be cautioned that the current study did not analyze the actual articular surfaces, but rather the subchondral bone, assuming its morphology as a reasonable measure of cartilage morphology. Thus, variations in the cartilage layer distribution have been neglected. However, considering that mean cartilage thickness for the CMC joint is less than one mm (approx. 0.75 mm, Koff et al. 2003), variation from the mean value can be considered to be small enough not to significantly affect the outcome of CM and for this reason the result obtained here appear to be reasonable descriptor of the entire joint.
Furthermore, joint congruence is a function of the joint configuration. Changing the relative position and orientation of the articulating surface may in fact modify how the articular surfaces mate with each other and consequently the distribution of an applied load. In this study, however, only the neutral position of the thumb has been considered and therefore the variation in joint congruence associated with different configurations have not been include in the analysis. We also note that this is a cross-sectional study, and therefore, the finding do not address whether these differences predispose or are an indicator of OA progression.
The elastic foundation contact model provides a strong simplification of the real tissues behavior. Similar approximations, however, are intrinsic to any measure of congruence, which necessitates a simplified contact model in order to make possible the decoupling of the geometrical contribution to the distribution of an applied load. For this reason, the exact prediction of contact pressure, stress and strain are beyond the aim and the possibility of any measure of congruence, which must instead guarantee the correct sorting in term of the peak pressure of a set of articulations, as proven for CM in (Conconi and Parenti-Castelli, 2014).
Results of the analysis may be affected also by the choice of the congruence measure. Presently, there is not a single definition of congruence and many indexes of joint congruence are available in the literature, differing by the observed geometrical quantities and by the contact model at their basis (Ateshian et al., 1992; Connolly et al., 2009; Tummala et al, 2012). The method employed in this analysis, however, has several advantages. It allows one to relate the distribution of an applied load to purely geometrical quantities, holding both for conforming and non conforming contact. It takes into account the joint configuration. It can be implemented based on the actual bioimaging techniques, even those for which the cartilage layer representation is missing.
Conclusion
With the adopted definition and measure of joint congruence, the only observable sex-related differences in the CMC joint congruence are ascribable to scale effects. When joint congruence was normalized with respect to the joint size, no significant differences between women and men remained.
No correlation between joint congruence and early OA was observable, both before and after normalization. Neither differences in joint congruence or size seem to represent a risk factor for the OA onset.
Supplementary Material
Acknowledgments
Research reported in this publication was supported by the National Institute of Arthritis and Musculoskeletal and Skin Diseases of the National Institutes of Health under Award Number AR059185. The content is solely the responsibility of the authors and does not necessarily represent the official views of the National Institutes of Health.
Footnotes
Conflicts of interest
The authors have no financial or personal relationships that could bias this work.
Publisher's Disclaimer: This is a PDF file of an unedited manuscript that has been accepted for publication. As a service to our customers we are providing this early version of the manuscript. The manuscript will undergo copyediting, typesetting, and review of the resulting proof before it is published in its final citable form. Please note that during the production process errors may be discovered which could affect the content, and all legal disclaimers that apply to the journal pertain.
References
- Arden N, Nevitt MC. Osteoarthritis: epidemiology. Best Pract Res Clin Rheumatol. 2006;20:3–25. doi: 10.1016/j.berh.2005.09.007. [DOI] [PubMed] [Google Scholar]
- Ateshian GA, Ark JW, Rosenwasser MP, Pawluk RJ, Soslowsky LJ, Mow VC. Contact areas in the thumb carpometacarpal joint. J Orthop Res. 1995;13:450–458. doi: 10.1002/jor.1100130320. [DOI] [PubMed] [Google Scholar]
- Ateshian GA, Lai WM, Zhu WB, Mow VC. An asymptotic solution for the contact of two biphasic cartilage layers. J Biomech. 1994;27:1347–1360. doi: 10.1016/0021-9290(94)90044-2. [DOI] [PubMed] [Google Scholar]
- Ateshian G, Rosenwasser M, Mow V. Curvature characteristics and congruence of the thumb carpometacarpal joint: differences between female and male joints. J Biomech. 1992;25:591–607. doi: 10.1016/0021-9290(92)90102-7. [DOI] [PubMed] [Google Scholar]
- Adeeb SM, Sayed Ahmed EY, Matyas J, Hart DA, Frank CB, Shrive NG. Congruency effects on load bearing in diarthrodial joints. Comput Methods Biomech Biomed Engin. 2004;7:147–157. doi: 10.1080/10255840410001710885. [DOI] [PubMed] [Google Scholar]
- Bredbenner TL, Eliason TD, Potter RS, Mason RL, Havill LM, Nicolella DP. Statistical shape modeling describes variation in tibia and femur surface geometry between Control and Incidence groups from the osteoarthritis initiative database. J Biomech. 2010;43:1780–1786. doi: 10.1016/j.jbiomech.2010.02.015. [DOI] [PMC free article] [PubMed] [Google Scholar]
- Brandt KD, Dieppe P, Radin EL. Etiopathogenesis of osteoarthritis. Rheum Dis Clin North Am. 2008;34:531–559. doi: 10.1016/j.rdc.2008.05.011. [DOI] [PubMed] [Google Scholar]
- Brandt KD, Radin EL, Dieppe PA, van de Putte L. Yet more evidence that osteoarthritis is not a cartilage disease. Ann Rheum Dis. 2006;65:1261–1264. doi: 10.1136/ard.2006.058347. [DOI] [PMC free article] [PubMed] [Google Scholar]
- Bredbenner TL, Eliason TD, Potter RS, Mason RL, Havill LM, Nicolella DP. Statistical shape modeling describes variation in tibia and femur surface geometry between Control and Incidence groups from the osteoarthritis initiative database. J Biomech. 2010;43:1780–1786. doi: 10.1016/j.jbiomech.2010.02.015. [DOI] [PMC free article] [PubMed] [Google Scholar]
- Buckwalter JA, Saltzman C, Brown T. The impact of osteoarthritis: implications for research. Clin Orthop Relat Res. 2004:6–15. doi: 10.1097/01.blo.0000143938.30681.9d. [DOI] [PubMed] [Google Scholar]
- Bullough PG. The geometry of diarthrodial joints, its physiologic maintenance, and the possible significance of age-related changes in geometry-to-load distribution and the development of osteoarthritis. Clin Orthop Relat Res. 1981:61–66. [PubMed] [Google Scholar]
- Conconi M, Parenti-Castelli V. A sound and efficient measure of joint congruence. J of Eng in Med. doi: 10.1177/0954411914550848. In publishing. [DOI] [PubMed] [Google Scholar]
- Connolly K, Ronsky J, Westover L, Kupper J, Frayne R. Analysis techniques for congruence of the patellofemoral joint. J of Biomech Eng. 2009;131:1245031–7. doi: 10.1115/1.3212111. [DOI] [PubMed] [Google Scholar]
- Cooney WP, Chao EY. Biomechanical analysis of static forces in the thumb during hand function. J Bone Joint Surg Am. 1977;59:27–36. [PubMed] [Google Scholar]
- Crisco JJ, Coburn JC, Moore DC, Upal MA. Carpal bone size and scaling in men versus in women. J Hand Surg Am. 2005;30:35–42. doi: 10.1016/j.jhsa.2004.08.012. [DOI] [PubMed] [Google Scholar]
- Dekel S, Weissman SL. Joint changes after overuse and peak overloading of rabbit knees in vivo. Acta Orthop Scand. 1978;49:519–528. doi: 10.3109/17453677808993232. [DOI] [PubMed] [Google Scholar]
- Eaton RG, Glickel SZ. Trapeziometacarpal osteoarthritis. Staging as a rationale for treatment. Hand Clin. 1987;3:455–471. [PubMed] [Google Scholar]
- Eckstein F, Reiser M, Englmeier KH, Putz R. In vivo morphometry and functional analysis of human articular cartilage with quantitative magnetic resonance imaging–from image to data, from data to theory. Anat Embryol. 2001;203:147–173. doi: 10.1007/s004290000154. [DOI] [PubMed] [Google Scholar]
- Felson DT, Lawrence RC, Dieppe PA, Hirsch R, Helmick CG, Jordan JM, et al. Osteoarthritis: new insights. Part 1: the disease and its risk factors. Ann Intern Med. 2000;133:635–646. doi: 10.7326/0003-4819-133-8-200010170-00016. [DOI] [PubMed] [Google Scholar]
- Fitzpatrick DC, Otto JK, McKinley TO, Marsh JL, Brown TD. Kinematic and contact stress analysis of posterior malleolus fractures of the ankle. J Orthop Trauma. 2004;18:271–278. doi: 10.1097/00005131-200405000-00002. [DOI] [PubMed] [Google Scholar]
- Fontana L, Neel S, Claise JM, Ughetto S, Catilina P. Osteoarthritis of the thumb carpometacarpal joint in women and occupational risk factors: a case-control study. J Hand Surg Am. 2007;32:459–465. doi: 10.1016/j.jhsa.2007.01.014. [DOI] [PubMed] [Google Scholar]
- Fukubayashi T, Kurosawa H. The contact area and pressure distribution pattern of the knee. A study of normal and osteoarthrotic knee joints. Acta Orthop Scand. 1980;51:871–879. doi: 10.3109/17453678008990887. [DOI] [PubMed] [Google Scholar]
- Halilaj E, Laidlaw D, Moore D, Crisco J. Bio-Imaging and Visualization for Patient-Customized Simulations. Springer International Publishing; 2014. How Do Sex, Age, and Osteoarthritis Affect Cartilage Thickness at the Thumb Carpometacarpal Joint? Insights from Subject-Specific Cartilage Modeling. [Google Scholar]
- Halilaj E, Laidlaw DH, Moore DC, Crisco JJ. Polar histograms of curvature for quantifying skeletal joint shape and congruence. J Biomech Eng. 2014;136:094503. doi: 10.1115/1.4027938. [DOI] [PMC free article] [PubMed] [Google Scholar]
- Halilaj E, Moore D, Laidlaw D, Got C, Weiss A, Ladd A, et al. The morphology of the thumb carpometacarpal joint does not differ between men and women, but changes with aging and early osteoarthritis. Journal of Biomechanics. 2014;47:2709–2714. doi: 10.1016/j.jbiomech.2014.05.005. [DOI] [PMC free article] [PubMed] [Google Scholar]
- Halilaj E, Rainbow MJ, Got C, Schwartz JB, Moore DC, Weiss AP, et al. In vivo kinematics of the thumb carpometacarpal joint during three isometric functional tasks. Clin Orthop Relat Res. 2014;472:1114–1122. doi: 10.1007/s11999-013-3063-y. [DOI] [PMC free article] [PubMed] [Google Scholar]
- Halilaj E, Rainbow MJ, Got CJ, Moore DC, Crisco JJ. A thumb carpometacarpal joint coordinate system based on articular surface geometry. J Biomech. 2013;46:1031–1034. doi: 10.1016/j.jbiomech.2012.12.002. [DOI] [PMC free article] [PubMed] [Google Scholar]
- Hayashi D, Roemer FW, Guermazi A. Osteoarthritis year 2011 in review: imaging in OA–a radiologists’ perspective. Osteoarthr Cartil. 2012;20:207–214. doi: 10.1016/j.joca.2011.12.016. [DOI] [PubMed] [Google Scholar]
- Hutton CW, Higgs ER, Jackson PC, Watt I, Dieppe PA. 99mTc HMDP bone scanning in generalised nodal osteoarthritis. II The four hour bone scan image predicts radiographic change. Ann Rheum Dis. 1986;45:622–626. doi: 10.1136/ard.45.8.622. [DOI] [PMC free article] [PubMed] [Google Scholar]
- Jackson BD, Wluka AE, Teichtahl AJ, Morris ME, Cicuttini FM. Reviewing knee osteoarthritis–a biomechanical perspective. J Sci Med Sport. 2004;7:347–357. doi: 10.1016/s1440-2440(04)80030-6. [DOI] [PubMed] [Google Scholar]
- Johnson K. Contact mechanics. Cambridge: Cambridge University Press; 1985. [Google Scholar]
- Kiapour AM, Quatman CE, Goel VK, Ditto RC, Wordeman SC, Hewett TE, et al. Knee Articular Cartilage Pressure Distribution Under Single- and Multi-Axis Loading Conditions: Implications For ACL Injury Mechanism. Proceedings of 38th ASB Annual Meeting.2012. [Google Scholar]
- Kraus VB. Pathogenesis and treatment of osteoarthritis. Med Clin North Am. 1997;81:85–112. doi: 10.1016/s0025-7125(05)70506-x. [DOI] [PubMed] [Google Scholar]
- Krebs DE, Elbaum L, Riley PO, Hodge WA, Mann RW. Exercise and gait effects on in vivo hip contact pressures. Phys Ther. 1991;71:301–309. doi: 10.1093/ptj/71.4.301. [DOI] [PubMed] [Google Scholar]
- Kurosawa H, Fukubayashi T, Nakajima H. Load-bearing mode of the knee joint: physical behavior of the knee joint with or without menisci. Clin Orthop Relat Res. 1980:283–290. [PubMed] [Google Scholar]
- LaValley MP, McAlindon TE, Chaisson CE, Levy D, Felson DT. The validity of different definitions of radiographic worsening for longitudinal studies of knee osteoarthritis. J Clin Epidemiol. 2001;54:30–39. doi: 10.1016/s0895-4356(00)00273-0. [DOI] [PubMed] [Google Scholar]
- Lawrence JS, Bremner JM, Bier F. Osteo-arthrosis. Prevalence in the population and relationship between symptoms and x-ray changes. Ann Rheum Dis. 1966;25:1–24. [PMC free article] [PubMed] [Google Scholar]
- Lawrence RC, Felson DT, Helmick CG, Arnold LM, Choi H, Deyo RA, et al. Estimates of the prevalence of arthritis and other rheumatic conditions in the United States. Part II. Arthritis Rheum. 2008;58:26–35. doi: 10.1002/art.23176. [DOI] [PMC free article] [PubMed] [Google Scholar]
- Lynch JA, Parimi N, Chaganti RK, Nevitt MC, Lane NE. The association of proximal femoral shape and incident radiographic hip OA in elderly women. Osteoarthr Cartil. 2009;17:1313–1318. doi: 10.1016/j.joca.2009.04.011. [DOI] [PMC free article] [PubMed] [Google Scholar]
- Maleki-Fischbach M, Jordan JM. New developments in osteoarthritis. Sex differences in magnetic resonance imaging-based biomarkers and in those of joint metabolism. Arthritis Res Ther. 2010;12:212. doi: 10.1186/ar3091. [DOI] [PMC free article] [PubMed] [Google Scholar]
- McGonagle D, Tan AL, Carey J, Benjamin M. The anatomical basis for a novel classification of osteoarthritis and allied disorders. J Anat. 2010;216:279–291. doi: 10.1111/j.1469-7580.2009.01186.x. [DOI] [PMC free article] [PubMed] [Google Scholar]
- McLaughlin K, Ronsky J, Frayne R. In vivo assessment of congruence in the patellofemoral joint of healthy subjects. In Proceedings of hte XXth ISB Congress - ASB 29th Annual Meeting.2005. [Google Scholar]
- Moore D, Crisco J, Trafton T, Leventhal E. A digital database of wrist bone anatomy and carpal kinematics. J of Biomech. 2007;40:2537–42. doi: 10.1016/j.jbiomech.2006.10.041. [DOI] [PubMed] [Google Scholar]
- North ER, Rutledge WM. The trapezium-thumb metacarpal joint: the relationship of joint shape and degenerative joint disease. Hand. 1983;15:201–206. doi: 10.1016/s0072-968x(83)80014-x. [DOI] [PubMed] [Google Scholar]
- Otterness IG, Eckstein F. Women have thinner cartilage and smaller joint surfaces than men after adjustment for body height and weight. Osteoarthr Cartil. 2007;15:666–672. doi: 10.1016/j.joca.2006.12.003. [DOI] [PubMed] [Google Scholar]
- Peyron JG. Osteoarthritis. The epidemiologic viewpoint. Clin Orthop Relat Res. 1986:13–19. [PubMed] [Google Scholar]
- Radin EL, Ehrlich MG, Chernack R, Abernethy P, Paul IL, Rose RM. Effect of repetitive impulsive loading on the knee joints of rabbits. Clin Orthop Relat Res. 1978:288–293. [PubMed] [Google Scholar]
- Reginster JY. The prevalence and burden of arthritis. Rheumatology (Oxford) 2002;41(Supp 1):3–6. [PubMed] [Google Scholar]
- Shrive N. PhD Thesis. University of Oxford; 1974. The transmission of load through animal joints with particular reference to the role of the meniscus in the knee. [Google Scholar]
- Sokoloff L. The biology of degenerative joint disease. Chicago: University of Chicago Press; 1969. [Google Scholar]
- Sonne-Holm S, Jacobsen S. Osteoarthritis of the first carpometacarpal joint: a study of radiology and clinical epidemiology. Results from the Copenhagen Osteoarthritis Study. Osteoarthr Cartil. 2006;14:496–500. doi: 10.1016/j.joca.2005.12.001. [DOI] [PubMed] [Google Scholar]
- Tersi L, Fantozzi S, Stagni R. 3D Elbow Kinematics with Monoplanar Fluoroscopy: In Silico Evaluation. EURASIP J Adv Sig Proc. 2010;2010 [Google Scholar]
- Tummala S, Nielsen M, Lillholm M, Christiansen C, Dam EB. Automatic quantification of tibio-femoral contact area and congruity. IEEE Trans Med Imaging. 2012;31(7):1404–1412. doi: 10.1109/TMI.2012.2191813. [DOI] [PubMed] [Google Scholar]
- Wilder FV, Barrett JP, Farina EJ. Joint-specific prevalence of osteoarthritis of the hand. Osteoarthr Cartil. 2006;14:953–957. doi: 10.1016/j.joca.2006.04.013. [DOI] [PubMed] [Google Scholar]
- Wu J, Herzog W, Epstein M. An improved solution for the contact of two biphasic cartilage layers. J of Biomech. 1997;30:371–375. doi: 10.1016/s0021-9290(96)00148-0. [DOI] [PubMed] [Google Scholar]
- Zheng Q, Lee P, McIff TE, Toby EB, Fischer KJ. In Vivo Biomechanics of Thumb Carpometacarpal Joint: A Preliminary Study of Gender Differences. In ASME 2013 Summer Bioengineering Conference.2013. [Google Scholar]
Associated Data
This section collects any data citations, data availability statements, or supplementary materials included in this article.


