

Abstract
Prostate specific antigen (PSA) is currently used as a biomarker to diagnose prostate cancer. PSA testing has been widely used to detect and screen prostate cancer. However, in the diagnostic gray zone, the PSA test does not clearly distinguish between benign prostate hypertrophy and prostate cancer due to their overlap. To develop more specific and sensitive candidate biomarkers for prostate cancer, an in-depth understanding of the biochemical characteristics of PSA (such as glycosylation) is needed. PSA has a single glycosylation site at Asn69, with glycans constituting approximately 8% of the protein by weight. Here, we report the comprehensive identification and quantitation of N-glycans from two PSA isoforms using LC–MS/MS. There were 56 N-glycans associated with PSA, whereas 57 N-glycans were observed in the case of the PSA-high isoelectric point (pI) isoform (PSAH). Three sulfated/phosphorylated glycopeptides were detected, the identification of which was supported by tandem MS data. One of these sulfated/phosphorylated N-glycans, HexNAc5Hex4dHex1s/p1 was identified in both PSA and PSAH at relative intensities of 0.52 and 0.28%, respectively. Quantitatively, the variations were monitored between these two isoforms. Because we were one of the laboratories participating in the 2012 ABRF Glycoprotein Research Group (gPRG) study, those results were compared to that presented in this study. Our qualitative and quantitative results summarized here were comparable to those that were summarized in the interlaboratory study.
Keywords: Prostate specific antigen, PSA, N-linked glycosylation, glycopeptide, glycoproteomics, LC−MS/MS
Introduction
Prostate cancer is one of the most common cancers diagnosed in men in the United States:1 there were 238 590 new cases and 29 720 deaths recorded in 2013.1 Prostate specific antigen (PSA) is currently used as a diagnostic biomarker of prostate cancer.2 PSA is an androgen-regulated serine protease and a member of the tissue kallikrein family.3 The concentration of PSA is elevated in the blood serum of prostate cancer patients. This is due to the loss of basal cells, basement membrane, and lumen architecture, thus permitting proPSA to have direct access to the peripheral circulation.4 The simplicity of PSA testing, which measures the concentration of PSA in blood serum, has prompted its wide use to detect and screen prostate cancer. However, PSA testing in the diagnostic gray zone does not clearly distinguish between benign prostate hypertrophy and prostate cancer.5−7
To develop new candidate biomarkers for prostate cancer, a deeper understanding of the biochemical properties of PSA is needed, such as glycosylation. Glycosylation is one of the most common protein post-translational modifications (PTMs), and approximately 8% of PSA by weight is composed of N-glycans that occupy a single glycosylation site at Asn69.8 Several papers have reported a variable degree of sialylation of PSA in sera between healthy subjects and those with prostate cancer.9−11 PSA possesses charge heterogeneity resulting from different degrees of sialylation.12 The major isoform, consisting of over 90% of PSA, has an isoelectric point (pI) of 6.9, whereas the minor one has a pI of 7.2. The glycosylation pattern at high pI was observed to have a high level of sialylation.13,14 These properties were similarly observed in a study of PSA isoenzymes from the serum of patients diagnosed with prostate cancer and the serum of patients diagnosed with benign prostate hyperplasia.9 PSA N-glycans were also reported to be mostly core fucosylated and to have a minor presence of GalNAc residues with the increasing pI of the PSA fraction.15−17 These different glycosylation patterns at different pI’s could be employed to develop new diagnostic biomarker for detecting different prostate diseases.
To effectively characterize the N-glycosylation of PSA, a widely used method is liquid chromatography interfaced with mass spectrometry (LC–MS or LC–MS/MS).18,19 The applicability of these methods to investigate aberrations in glycosylation associated with several diseases has already been demonstrated.20−22 Enrichment techniques, such as lectin affinity chromatography or hydrazide chemistry, and peptide labeling have also been used in conjunction with LC–MS/MS to characterize and quantify the glycosylation sites of glycoproteins.23−25
Here, we report the comprehensive qualitative and quantitative glycoproteomic studies of two PSA isoforms by LC–MS/MS. The overarching goal is to effectively identify the different glycoforms of PSA prior to prostate cancer-related glycoproteomic study. Our results were compared with findings of 2012 ABRF Glycoprotein Research Group (gPRG) study,26 of which we were one of the participating laboratories. The purpose of the 2012 ABRF study was to establish a global overview of the approaches and methodologies in glycoproteomics using a consensus among interlaboratory data. We found a comparable pattern/level of glycosylation between our results and those of the ABRF study.
Experimental Section
Materials
PSA and PSA-high pI isoform (PSAH) samples were obtained from Lee Biosolutions (St. Louis, MO). Sodium chloride and disodium phosphate were obtained from Mallinckrodt Chemicals (Phillipsburg, NJ). d,l-Dithiothreitol (DTT), iodoacetamide (IAA), and MS-grade formic acid were purchased from Sigma-Aldrich (St. Louis, MO). HPLC-grade solvents, including methanol and isopropanol, were purchased from Fisher Scientific (Pittsburgh, PA). HPLC grade water was obtained from Mallinckrodt (Hazelwood, MO). HPLC grade acetonitrile (ACN) was obtained from J.T. Baker (Phillipsburg, NJ). Mass spectrometry grade trypsin gold was obtained from Promega (Madison, WI).
Enzymatic Digestion
A 20 μg aliquot of PSA and 5 μg aliquot of PSAH were prepared in 50 mM PBS buffer (pH 7.5) (phosphate buffered saline containing 50 mM disodium phosphate and 150 mM sodium chloride). In both cases, denaturation was performed at 65 °C for 1 h. The samples were then reduced by adding by adding a 1.25 μL aliquot of 200 mM DTT prior to incubation at 60 °C for 45 min. Those reduced samples were then alkylated with the addition of a 5 μL aliquot of 200 mM IAA and incubated at 37.5 °C for 45 min in the dark. Excess IAA was consumed through the addition of a second 1.25 μL aliquot of 200 mM DTT. The reaction was allowed to proceed at 37.5 °C for 30 min in the dark. Trypsin was added into the samples using an enzyme/substrate ratio of 1:25 w/w, and the samples were subjected to overnight incubation at 37.5 °C for 18 h. To complete the enzymatic digestion, samples were subjected to microwave digestion at 45 °C and 50 W for 30 min before adding a 0.5 μL aliquot of neat formic acid to the samples. The enzymatic digestion was quenched. Finally, the samples were dried and suspended in 0.1% formic acid prior to LC–MS/MS analysis. The samples were analyzed in technical triplicates.
LC–MS/MS Analyses
LC–MS/MS was carried out on Dionex 3000 Ultimate nano-LC system (Dionex, Sunnyvale, CA) interfaced with an LTQ Orbitrap Velos mass spectrometer (Thermo Scientific, San Jose, CA) equipped with a nano-ESI source. The PSA and PSAH digests were initially online-purified using a PepMap 100 C18 cartridge (3 μm, 100 Å, Dionex). A 2 μg aliquot of PSA and 0.4 μg aliquot of PSAH digests were injected into the trapping cartridges. The purified peptides were then separated using a PepMap 100 C18 capillary column (75 μm i.d. × 150 mm, 2 μm, 100 Å, Dionex). The separation was achieved at a 350 nL/min flow rate using the following gradient conditions: 0–10 min, 5% solvent B (98% ACN with 0.1% formic acid); 10–40 min, ramping of solvent B from 5 to 45%; 40–45 min, ramping of solvent B from 45 to 80%; 45–50 min, maintaining solvent B at 80%; 50–51 min, decreasing solvent B to 5%; and 51–60 min, sustaining solvent B at 5%. Solvent A was a 2% ACN aqueous solution containing 0.1% formic acid. The separation and scan time was set to 60 min.
The LTQ Orbitrap Velos mass spectrometer was operated with three scan events. The first scan event was a full MS scan of 380–2000 m/z at a mass resolution of 15 000. The collision induced dissociation (CID) and higher-energy collision dissociation (HCD) MS/MS were performed on the eight most intense ions seen from the first MS scan event. The second scan event was the CID MS/MS of parent ions selected from the first scan event with an isolation width of 3.0 m/z, a normalized collision energy (CE) of 35%, and an activation Q value of 0.250. The third scan event was set to acquire HCD MS/MS of the parent ions selected from the first scan event. The isolation width of HCD experiment was set to 3.0 m/z, and the normalized CE was set to 45% with an activation time of 0.1 ms. The LTQ Orbitrap Velos mass spectrometer was externally calibrated.
Data Processing and Quantitation
The protein sequence and purity of prostate specific antigen were confirmed using MASCOT and Scaffold. Proteome Discoverer, version 1.2, software (Thermo Scientific, San Jose, CA) was used to generate a mascot generic format file (*.mgf) which was subsequently employed for database searching using MASCOT, version 2.3.2 (Matrix Science Inc., Boston, MA). Parent ions were selected from a mass range of 300–10 000 Da with a minimum peak count of 1. The parameters from Mascot Daemon were set to search against UniProtKB (UniProt release 2014_06). Oxidation of methionine was set as a variable modification, and carbamidomethylation of cysteine was set as a fixed modification. Tandem MS ions were searched within a 0.8 Da mass tolerance, and the peptide sequences were identified within 10 ppm. The results from MASCOT were imported into Scaffold 3 (Proteome Software, Inc., Portland, OR), where spectral-count quantitation was performed. The protein identifications were based on an ion score cutoff higher than 30 and a minimum number of peptides of two.
The identification of PSA and PSAH glycopeptides was achieved by GlypID 2.0 and GlycoSeq with additional manual confirmation. GlypID 2.027 used a combination of HCD/CID scoring and precursor mass-based searching to detect and characterize glycopeptides. Because trypsin is well-known to produce incomplete cleavage at C-terminal lysine residues, we searched glycopeptides for theoretical PSA sequon-containing peptides. Three sequences, NKSVILLGR, AVCGGVLVHPQWVLTAAHCIRNK, and AVCGGVLVHPQWVLTAAHCIRNKSVILLGR, have valid identifications of glycopeptides in tryptic digest PSA samples. A default glycan library was modified to consider sulfated/phosphorylated versions of glycans. It contains 413 glycan compositions with combinations of GlcNAc, Man, Fuc, and NeuAc. One to three sulfations/phosphorylations were considered with the default glycan library. GlycoSeq (available as open source software at http://sourceforge.net/projects/glycoseq/; manuscript in preparation) was used to determine glycan sequences (i.e., topology or cartoon-graph representation) using a de novo sequencing algorithm. Briefly, starting with the Y1 ion, the glycan topology is grown using CID fragmentation peaks while adhering to N-linked glycan synthesis rules.28 All identified glycopeptides and associated glycan structures were manually confirmed. This strategy was also applied for other glycoprotein impurities that are present in the samples. The findings of these searches are discussed in detail in the Results and Discussion.
Although PSA possesses a single glycosylation site at Asn69, competitive ionization of co-eluting peptides still presents a challenge that limits the MS/MS identification of glycopeptides because a lower number of glycopeptides would be subjected to tandem MS. Therefore, we created an inclusion list consisting of all theoretical m/z values possibly associated with three peptide backbones, thus ensuring the acquisition of a large number of tandem MS data to facilitate identification of more glycopeptides. The theoretical m/z values were based on every theoretical peptide backbone sequence using the Glycomod tool from the ExPASy web site. These m/z values were used to create extracted ion chromatograms (EICs) using Xcalibur Qual Browser 2.1 (Thermo Scientific, San Jose, CA). A mass accuracy of 5 ppm or better was then applied to confirm ions prior to manual evaluation of tandem MS data. However, only 9% of the detected ions depicted a mass accuracy of 7 ppm. These were low-abundance glycopeptides with a distorted isotopic distribution. As a result, 3.05 ppm was obtained as an averaged mass accuracy.
For quantitation, peak areas were acquired using Xcalibur Qual Browser. The software was used to generate EICs. The mass range was set to full FTMS scan with 7-point smoothing enabled and a mass tolerance of 10 ppm allowed.
Results and Discussion
Qualitative Analyses of Glycopeptides from PSA and PSA-High pI Isoform
Prostate specific antigen in the samples analyzed here was identified with sequence coverages of 85.6 and 86.5% from PSA and PSAH samples, respectively (data not shown). Peptides containing the glycosylation sequon (N69KS) were not detected in the proteomics analysis, thus suggesting that the N69 residue is glycosylated. Protein identifications in proteomics analysis were based on an ion score cutoff higher than 30 and a minimum number of peptides of two. According to spectral count data generated by Scaffold software, spectral counts of PSA accounted for 86% of the total spectral count data (15 identified peptides), whereas the spectral counts of PSAH accounted for 78% of the total spectral count data (17 peptides). Other proteins that were detected in the case of the PSA sample were triosephosphate isomerase (6% of total spectral counts, three peptides), prostaglandin-H2 d-isomerase (3% of the total spectral count data, two peptides), and growth/differentiation factor 15 (5% of total spectral count data, two peptides). Other proteins detected in the case of the PSAH sample were triosephosphate isomerase (12% of the total spectral count data, eight peptides), prosaposin (5% of the total spectral count data, two peptides), prostaglandin-H2 d-isomerase (2% of the total spectral count data, two peptides), and growth/differentiation factor 15 (3% of the total spectral count data, two peptides). Furthermore, GlypID analysis using these proteins did not identify any valid glycopeptides associated with above-mentioned proteins, yet they all have the glycosylation sequences. Therefore, all glycopeptides reported here are unique to PSA and are not originating from the other proteins observed in the LC–MS/MS analysis. Additionally, the Y1 ions reported here are unique to PSA and are not from any contaminant proteins observed in the LC–MS/MS analysis.
Since PSA is known to have only one N-linked glycosylation site at Asn69, it is adequate to interpret its glycosylations with CID or HCD tandem MS. If the CID or HCD spectra include glycan fragmentation or glycopeptide diagnostic ions in addition to the expected Y1 ion (peptide + GlcNAc), then the glycopeptides associated with Asn69 were confirmed. For example, a Y1 ion associated with Asn69 detected at an m/z value of 602 or 601 corresponded to doubly charged NKSVILLGR + GlcNAc. Hexose rearrangement could occur during CID tandem analyses.29,30 It is observed in low abundance (<8%) when Y1 ion intensities are incredibly high. However, hexose rearrangement is not the case in this study because Y1 ion intensities associated with the PSA glycosylation site are not that high, as can be seen in CID MS/MS scans (Supporting Information Figure 1).
In cases when the theoretical m/z values of glycopeptides were used, they were confirmed by matching the retention times of the glycopeptides that were confirmed by tandem MS. Using a 5 ppm cutoff mass accuracy allowed glycopeptides that have similar molecular weights to be distinguished. For example, a glycopeptide possessing 2 Fuc residues is only 1 Da different from that possessing an NeuAc residue, which can be differentiated using this 5 ppm cutoff. Moreover, their retention time differences were also used to distinguish them, since a glycopeptide containing NeuAc is retained longer by LC than a counterpart glycopeptide containing 2 Fuc. Overall, the use of the aforementioned criteria results in an overall averaged mass accuracy of 3.05 ppm for all identified glycopeptides.
In total, tryptic digestion of the samples resulted in the formation of three peptide backbones containing the glycosylation site, namely, NKSVILLGR (17–23 min), AVCGGVLVHPQWVLTAAHCIRNK (26–21 min), and AVCGGVLVHPQWVLTAAHCIRNKSVILLGR (31–36 min), as shown in Figure 1A. There are 56 glycopeptides observed for PSA, as summarized in Table 1. Because 55 of the structures were identified on the NKSVILLGR backbone, the discussion will be mainly focused on this peptide backbone. One missing glycoform associated with the NKSVILLGR backbone is HexNAc3Hex3dHex1NeuAc1, which was detected on the AVCGGVLVHPQWVLTAAHCIRNK backbone. Figure 1B–D illustrates averaged full MS with observed N-glycans detected on the NKSVILLGR (=P) backbone. There were 11 neutral N-glycans observed at 17.5 min (Figure 1B), 36 monosialylated and 2 sulfated/phosphorylated N-glycans were observed at 19.5 min (Figure 1C), and 6 disialylated N-glycans were detected at 22 min (Figure 1D). The m/z values (charge state = 3) of these glycopeptides were listed with confirmed glycan structures if they were supported by tandem MS data. Otherwise, the most likely structures were described as previously reported.9−11,15,16 There were 32 N-glycans confirmed by tandem MS data, as shown in Table 1.
Figure 1.

Total ion chromatogram of PSA digests with different retention times of three peptide backbones possessing the Asn69 glycosylation site (A). Assigned glycoforms in MS of PSA are presented with the NKSVILLGR backbone. Different retention times correspond to the detection of neutral glycoforms (B), sulfated/phosphorylated (s/p) neutral glycoforms and monosialylated glycoforms (C), and disialylated glycoforms (D).
Table 1. Summary of Identified Glycopeptides with Three Peptide Backbones in PSA at Normal pI.
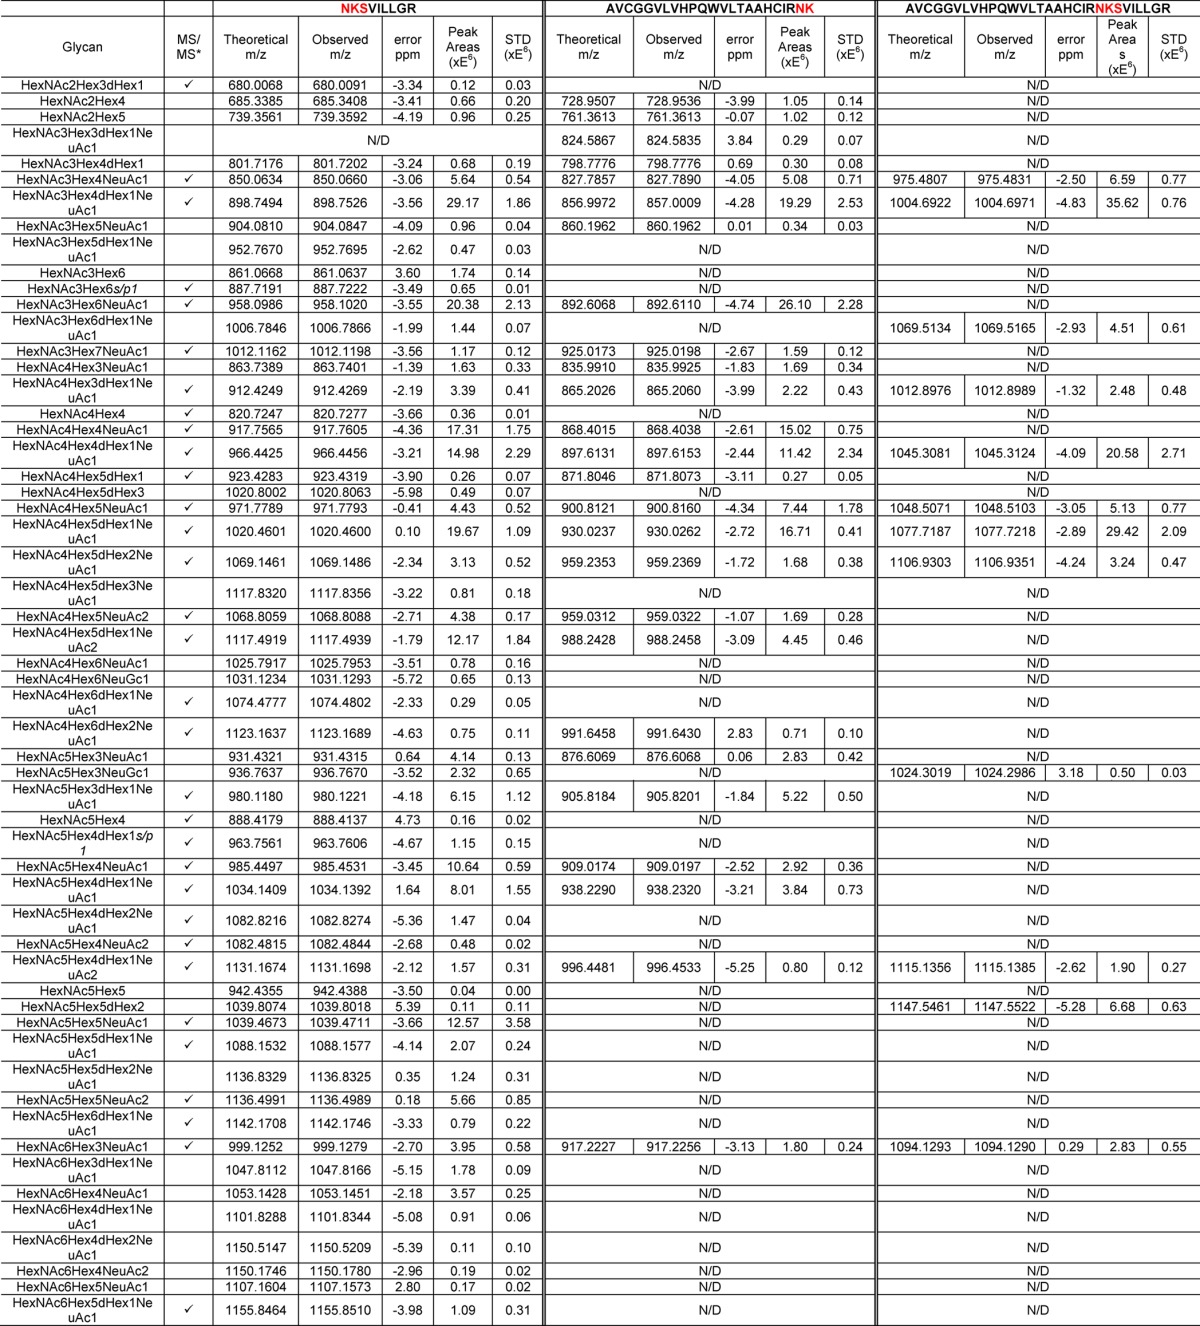
The identifications of glycan structures were supported by MS/MS, which are included in Supporting Information Figure 1.
For PSAH, similar retention times were detected with different types of N-glycans, as mentioned above (Figure 2A). In total, 57 N-glycans were identified from three peptide backbones, as summarized in Table 2. All of the N-glycans were detected on the NKSVILLGR backbone except HexNAc6Hex4dHex2NeuAc1, which was detected only on the AVCGGVLVHPQWVLTAAHCIRNK backbone. Figure 2B–D depicts an averaged full MS with identified N-glycans associated with the NKSVILLGR backbone. There were 15 neutral N-glycans observed at 17.5 min (Figure 2B), 29 monosialylated and 2 sulfated/phosphorylated N-glycans observed at 19.5 min (Figure 2C), and 10 disialylated N-glycans detected at 22 min (Figure 2D). Manual annotations of the CID MS/MS of 37 glycopeptides are depicted in Supporting Information Figure 1.
Figure 2.

Total ion chromatogram of PSAH digests with different retention times of three peptide backbones possessing the Asn69 glycosylation site (A). Assigned glycoforms in MS of PSAH are presented with the NKSVILLGR backbone. Different retention times correspond to the detection of neutral glycoforms (B), sulfated/phosphorylated (s/p) neutral glycoforms and monosialylated glycoforms (C), and disialylated glycoforms (D).
Table 2. Summary of Identified Glycopeptides with Three Peptide Backbones in PSA at High pI.
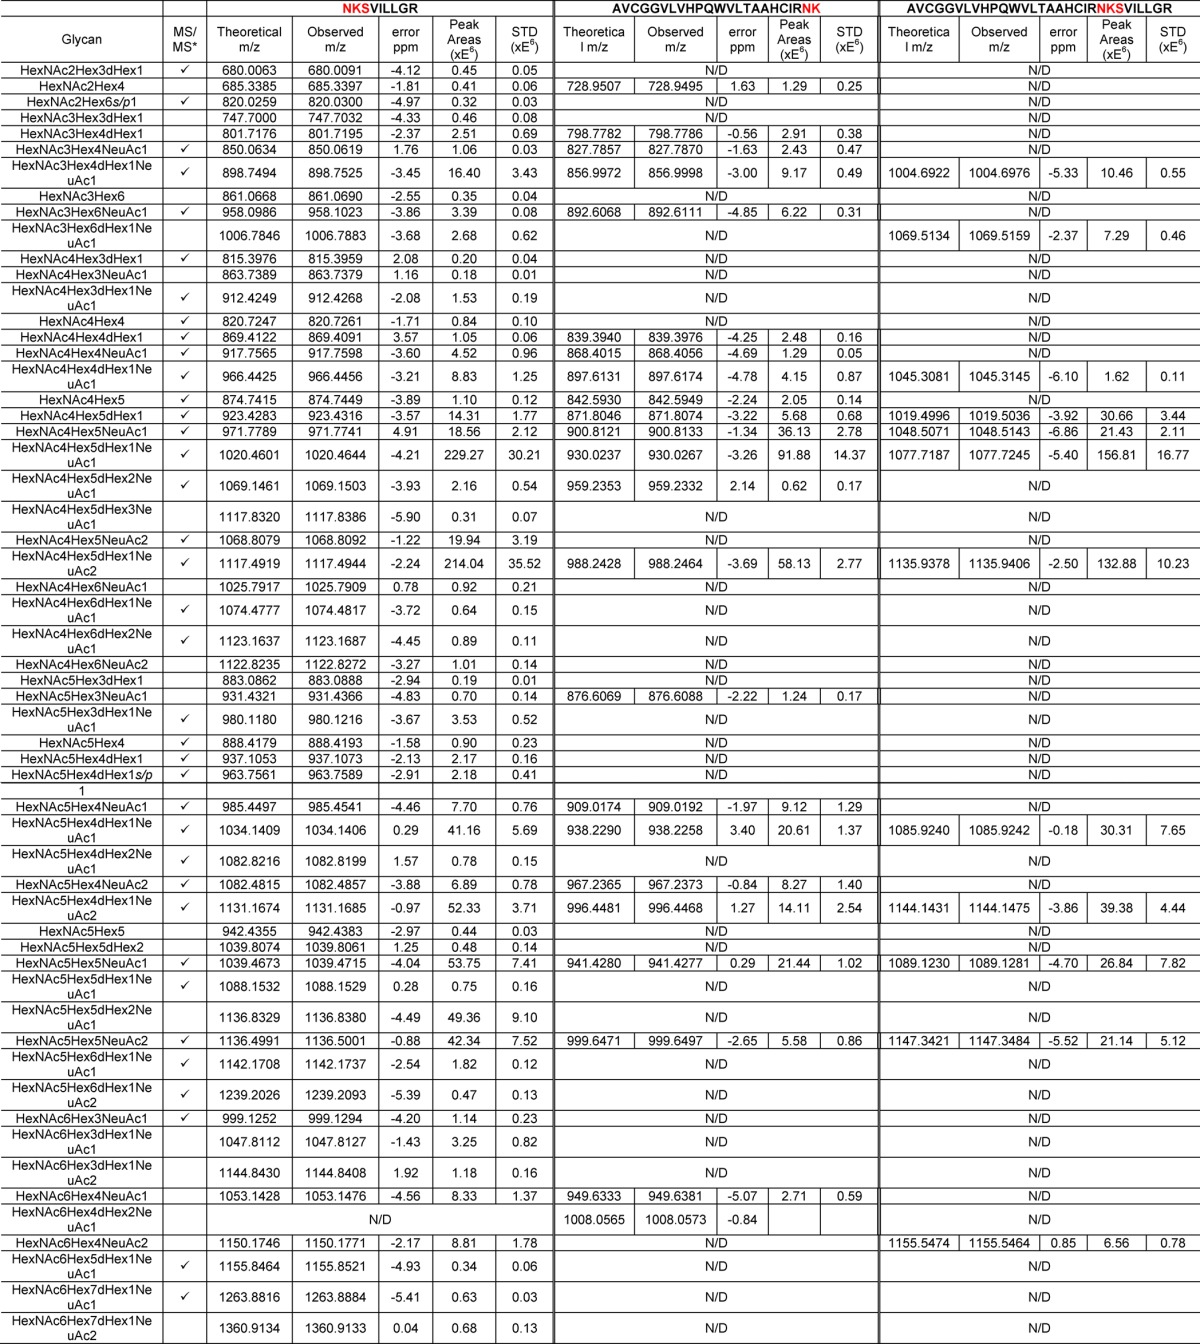
The identifications of glycan structures were supported by MS/MS, which are included in Supporting Information Figure 1.
Assigning glycan structure from CID MS/MS is achievable because the mass difference between the glycan residues of glycopeptides, such as Hex, HexNAc, Fuc, or NeuAc, is rather large. Also, sequencing N-glycan structures follows some rules because specific glycosyltransferases/exoglycosidases are involved in trimming or attachment of each glycan residue during the biosynthesis of N-glycans. The precursor m/z values of glycopeptides were confirmed using a 5 ppm cutoff mass accuracy because the detection of precursor ions was achieved by an Orbitrap FTMS analyzer.
The intriguing features of N-glycans associated with PSA are the presence of an GalNAc residue instead of Gal followed by GlcNAc and sulfation/phosphorylation.15−17 In this study, many N-glycans with these characteristics were detected, some of which were confirmed by tandem MS, as depicted in Figure 3. The glycan fragments of a glycopeptide with m/z 1034.1406 were assigned with diagnostic ions originating from glycan residues (Figure 3A). The annotation of this tandem MS demonstrates that this glycopeptide is core fucosylated and monosialylated followed by either a Gal or GlcNAc residue. The core fucosylation was confirmed on the basis of the existence of a Y1+2 ion (peptide backbone + GlcNAc) with fucose, which has an m/z value of 675.3. One of the fragment peaks with an m/z value of 1303.95 represents the loss of a GalNAc residue. Also, we confirmed that there are two co-eluting isomeric glycopeptides. In the low m/z region, diagnostic ions with m/z values of 495.16 and 698.35 confirmed GalNAc + NeuAc and GlcNAc + GalNAc + NeuAc glycan structures, respectively. In addition, the presence of a 657.19 m/z value affirms the presence of a GlcNAc + Gal + NeuAc glycan structure. Therefore, the sialylation followed by Gal and GalNAc residues co-eluted, as confirmed in this single tandem MS. Also, on the basis of the assignment of fragment ions of glycans, we distinguished between the attachment of GalNAc followed by antenna GlcNAc and bisecting structures. When a series of HexNAc fragmentation were detected as associated with antenna GlcNAc without assignment of a Glc residue, the presence of GalNAc on an antenna GlcNAc was confirmed. Regarding bisection structures, the presence of 2GlcNAc + Man + GlcNAc, 2GlcNAc + 2Man + GlcNAc, and 2GlcNAc + 3Man + GlcNAc was detected, which correspond to m/z values of 886, 967, and 1048, respectively.
Figure 3.

Two examples of identified glycoforms whose structures were confirmed by CID MS/MS. The glycan fragments of HexNAc5Hex4dHex1NeuAc1 glycopeptide with m/z 1034.1406 (A) support the presence of a GalNAc residue followed by a GlcNAc residue on its antenna. Diagnostic ions highlighted in red represent the presence of a GalNAc residue. The annotation of a sulfated/phosphorylated (s/p) glycopeptide, determined as HexNAc5Hex4dHex1s/p1 glycopeptide with m/z 963.7589 (B), suggests the occurrence of sulfation/phosphorylation on the GlcNAc residue before the GalNAc residue.
Figure 3B illustrates annotated tandem MS of a sulfated/phosphorylated glycopeptide corresponding to m/z 963.7589. The sulfation/phosphorylation on a GlcNAc residue was determined on the basis of the detection of fragment ions at m/z 1303.87 and 1344.45, the difference of which corresponds to a doubly charged sulfate or phosphate ion. Because the peak at m/z 1344.45 originated from the loss of a GalNAc residue, this suggests that the occurrence of sulfation/phosphorylation is on a GlcNAc residue. Also, the presence of m/z values of 1221.05 and 1262.04 supports the occurrence of sulfation/phosphorylation on a GlcNAc residue. The difference between these two assignments of sulfation/phosphorylation was 0.5 Da, which fits well within the mass accuracy of CID MS/MS. On the other hand, no diagnostic ions representing a sulfated/phosphorylated glycan residue were observed from HCD MS/MS, as shown in Supporting Information Figure 2. Overall, more of core-fucosylated and/or disialylated glycoforms were identified in PSAH than in normal PSA. Moreover, highly branched glycan structures such as tri- or tetra-antennary structures were more abundant in PSAH than in normal PSA. These observations are in agreement with previously published results.15,16 Glycoform differences between PSA and PSAH are illustrated in Supporting Information Figure 3.
There was a difference in the number of identified N-glycans from the three peptide backbones, as shown in Tables 1 and 2. This might be due to the fact that the ionization efficiency of peptides becomes substantially higher as the mobile phase’s organic content increases. As a result, some of the glycopeptides with minor intensities would not be subjected to tandem MS experiments. This observation is supported by the data shown in Supporting Information Figure 4. Quantitative results of all identified glycopeptides associated with the three peptide backbones are illustrated in Supporting Information Figure 4A,B for PSA and PSAH, respectively. Glycopeptides with relatively low intensities associated with the NKSVILLGR backbone were not detected in the other two peptides backbones, which is believed to be mainly due to competitive ionization.
Quantitative Analyses of Glycopeptides from PSA and PSA-High pI Isoform
The quantitation of all identified glycopeptides associated with the three detected peptide backbones is summarized in Tables 1 and 2. Average peak areas and standard deviation values (STD) were measured from technical triplicates.
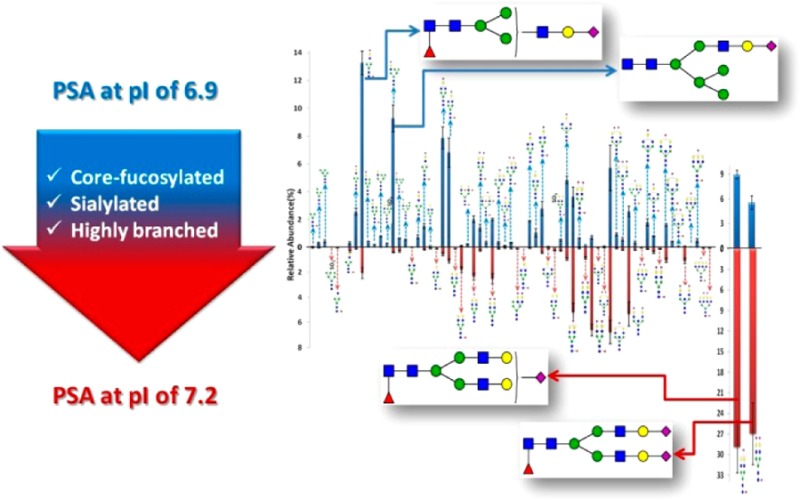
Figure 4 shows the quantitation results of N-glycans on the NKSVILLGR backbone. There are 66 common N-glycans with 68 total identified glycoforms that were quantitatively compared between PSA and PSAH samples. The abundances of two glycopeptides associated with the peptides AVCGGVLVHPQWVLTAAHCIRNK and AVCGGVLVHPQWVLTAAHCIRNKSVILLGR were excluded because their ionization efficiencies might be different from those of other glycopeptides associated with the peptide NKSVILLGR. Figure 4B depicts a separate comparison of two glycoforms that demonstrated a higher abundance for PSAH relative to that in all other structures. The most abundant glycoform for PSA was determined to be HexNAc3Hex4dHex1NeuAc1 (13.3%). Four glycopeptides possessing different glycan structures, namely, HexNAc3Hex6NeuAc1 (9.3%), HexNAc4Hex4NeuAc1 (7.9%), HexNAc4Hex4dHex1NeuAc1 (6.8%), and HexNAc5Hex5NeuAc1 (5.7%) were detected as the next most abundant ions. On the other hand, glycopeptides with HexNAc4Hex5dHex1NeuAc1 (28.9%) and HexNAc4Hex5dHex1NeuAc2 (27%) were observed at higher intensities in the PSAH sample. Glycopeptides possessing HexNAc5Hex5NeuAc1 (6.8%), HexNAc5Hex4dHex1NeuAc2 (6.6%), HexNAc5Hex5NeuAc2 (5.3%), and HexNAc5Hex4dHex1NeuAc1 (5.2%) glycans were observed as the next most abundant ions. The glycoform of HexNAc5Hex4dHex1s/p was identified in both PSA and PSAH with different abundances (0.52 and 0.28%, respectively). An interesting observation related to this structure is that the summation of the relative abundances of HexNAc5Hex4dHex1 and HexNAc5Hex4dHex1s/p from PSAH was determined to be comparable with the intensity of HexNAc5Hex4dHex1s/p from PSA. On the other hand, HexNAc5Hex4dHex1 was not detected for PSA.
Figure 4.

Quantitative values (relative abundance) of N-glycans on the NKSVILLGR backbone. Sixty six total N-glycans were quantitatively compared between PSA and PSAH. (A) Relative abundances of 64 glycoforms. (B) Relative abundances of two glycoforms, which shows low-abundance glycoforms for PSAH by separating the extremely high abundances of HexNAc4Hex5dHex1NeuAc1 and HexNAc4Hex5dHex1NeuAc2 in PSAH. An image representing a glycoform was added to the side for which higher quantities were observed.
The abundances of the 46 common N-glycans were compared between the PSA and PSAH samples. For example, the glycopeptides possessing HexNAc3Hex6NeuAc1 (>21.7-fold), HexNAc4Hex4NeuAc1 (>13.8-fold), HexNAc4Hex3dHex1NeuAc1 (>8-fold), HexNAc3Hex4dHex1NeuAc1 (>6.5-fold), and HexNAc5Hex4NeuAc1 (>5-fold) were detected with higher intensities in the PSA sample compared with that of the PSAH sample. On the other hand, the glycopeptides with HexNAc5Hex4dHex1NeuAc2 (>9.2-fold), HexNAc4Hex5dHex1NeuAc2 (>4.8-fold), and HexNAc4Hex5dHex1NeuAc1 (>3.2-fold) were observed with higher abundances in PSAH than that in PSA.
Comparison of the Data with the 2012 ABRF Data and a Data Set from a Laboratory Participating in the 2012 ABRF Study
As one of the 26 global laboratories that participated in the 2012 ABRF Glycoprotein Research Group (gPRG) study (the 2012 ABRF study),26 the qualitative and quantitative results were compared to evaluate our glycoproteomic methods. The goal of the 2012 ABRF study was to provide a global overview of glycoproteomics methods using a consensus among interlaboratory data. As a result, 57 N-glycans were reported in total. Twenty six data sets collected from the participating laboratories were classified into four clusters from A to D based on data similarity. The major cluster is C, where the data were summarized from 21 laboratories, including our laboratory. According to abundances, N-glycans were grouped into three categories, including major, intermediate, and minor abundance structures. A separate result has been published by Behnken et al.31 They were also an ABRF-participating laboratory that identified 42 glycoforms of intact PSA/PSAH glycoprotein using HR–ESI/TOF–MS. As shown in Supporting Information Figure 5A, the three studies reported 85 total glycoforms associated with PSA and PSAH, with 29 common glycoforms. Seventeen additional glycoforms were commonly identified between the 2012 ABRF study and this study. Forty six glycoforms were observed both in the ABRF study and here. Eleven glycoforms were detected only in the ABRF study. Twenty two structures were unique to this study. Three glycoforms were reported by Behnken et al.31 and were observed in our study but were not described in the ABRF study. Our study and that by Behnken et al.31 study had 32 common glycoforms. Ten glycoforms were described in Behnken et al.’s study but were not observed in our study, of which four were described in the ABRF study. This discrepancy may be due to the use of different methods: bottom-up gycoproteomics in this study and top-down glycoproteomics in the Behnken et al. study.31
As shown in Supporting Information Figure 5B, the relative abundances of 18 major/intermediate N-glycans appeared to be comparable with that in the 2012 ABRF study. In particular, the N-glycans HexNAc3Hex4dHex1NeuAc1, HexNAc4Hex5dHex1NeuAc2, HexNAc5Hex3dHex1NeuAc1, and HexNAc5Hex4dHex1NeuAc1 were observed with a very high overlap in intensities. From minor N-glycans, we noticed that 6 of the 13 missing structures were sulfated/phosphorylated N-glycans with very low intensities. One sulfated/phosphorylated glycoform, HexNAc5Hex4dHex1s/p, was reported in the 2012 ABRF study as being less than 1%, but it is present in PSA at approximately twice the amount as that in PSAH. This particular glycoform was observed in our analysis and with a similar intensity profile variation.
Behnken et al.31 reported a single analysis of quantitation; thus, no variation was inserted (Supporting Information Figure 5C). Among the 32 common glycoforms that were observed in our study, most of them showed a comparable trend of intensities between PSA and PSAH. With regard to the 18 major/intermediate glycoforms defined by the 2012 ABRF study, 16 glycoforms were observed by Behnken et al.,31 whereas 2 major/intermediate glycoforms were not reported, including HexNAc2Hex5 and HexNAc4Hex4dHex1. Most of the major/intermediate glycoforms show comparable abundance profiles except for HexNAc4Hex5dHex1NeuAc2, in which its abundance in PSA appeared to be 4.60-fold lower when comparing this study and the 2012 ABRF study.
Conclusions
The comprehensive qualitative and quantitative glycoproteomic studies of two PSA isoforms were successfully achieved by LC–MS/MS. Using three peptide backbones, there were 56 N-glycans detected for the PSA sample, whereas 57 N-glycans were observed for PSAH. In total, three sulfated/phosphorylated neutral N-glycans were identified, which were supported by tandem MS. Moreover, several GalNAc residues that were monitored were followed by GlcNAc residues on the antenna. From the quantitative results, the levels of the glycosylation patterns were investigated for two isoforms. The glycopeptide possessing HexNAc3Hex4dHex1NeuAc1 (13.3%) was observed with the highest intensity from PSA, whereas the ones with HexNAc4Hex5dHex1NeuAc1 (28.9%) and HexNAc4Hex5dHex1NeuAc2 (27%) were predominantly present from PSAH. A comparable pattern/level of glycosylation was observed between the cumulative results from the 2012 ABRF study and those from a specific participating laboratory. These results can be further investigated with the aim of distinguishing glycosylation patterns between healthy and prostate cancer patients.
Acknowledgments
This work was supported by the Office of the Vice President for Research at Texas Tech University and partially by the NIH (1R01GM093322-04).
Supporting Information Available
Figure 1: Manual annotations of CID MS/MS of 38 glycopeptides from PSA or PSAH. Figure 2: HCD MS/MS of sulfated/phosphorylated (s/p) glycopeptide HexNAc5Hex4dHex1s/p1. Figure 3: Comparison of identified glycoforms between PSA and PSA at high pI. Figure 4: Peak areas of glycoforms associated with three peptide backbones identified from PSA at normal and high pI. Figure 5: Comparisons of total identified glycoforms from the 2012 ABRF study and the study published by Behnken et al.31 This material is available free of charge via the Internet at http://pubs.acs.org.
The authors declare no competing financial interest.
Funding Statement
National Institutes of Health, United States
Supplementary Material
References
- Siegel R.; Naishadham D.; Jemal A. Cancer statistics, 2013. Ca-Cancer J. Clin. 2013, 63, 11–30. [DOI] [PubMed] [Google Scholar]
- Diamandis E. P. Prostate-specific antigen: its usefulness in clinical medicine. Trends Endocrinol. Metab. 1998, 9, 310–6. [DOI] [PubMed] [Google Scholar]
- Watt K. W.; Lee P. J.; M’Timkulu T.; Chan W. P.; Loor R. Human prostate-specific antigen: structural and functional similarity with serine proteases. Proc. Natl. Acad. Sci. U.S.A. 1986, 83, 3166–70. [DOI] [PMC free article] [PubMed] [Google Scholar]
- Balk S. P.; Ko Y. J.; Bubley G. J. Biology of prostate-specific antigen. J. Clin. Oncol. 2003, 21, 383–91. [DOI] [PubMed] [Google Scholar]
- Laguna P.; Alivizatos G. Prostate specific antigen and benign prostatic hyperplasia. Curr. Opin. Urol. 2000, 10, 3–8. [DOI] [PubMed] [Google Scholar]
- Stamey T. A.; Johnstone I. M.; McNeal J. E.; Lu A. Y.; Yemoto C. M. Preoperative serum prostate specific antigen levels between 2 and 22 ng./ml. correlate poorly with post-radical prostatectomy cancer morphology: prostate specific antigen cure rates appear constant between 2 and 9 ng./ml. J. Urol. 2002, 167, 103–11. [PubMed] [Google Scholar]
- Bonn D. Predictive value of PSA in prostate cancer is doubtful. Lancet Oncol. 2002, 3, 130. [Google Scholar]
- Armbruster D. A. Prostate-specific antigen: biochemistry, analytical methods, and clinical application. Clin. Chem. 1993, 39, 181–95. [PubMed] [Google Scholar]
- Huber P. R.; Schmid H. P.; Mattarelli G.; Strittmatter B.; van Steenbrugge G. J.; Maurer A. Serum free prostate specific antigen: isoenzymes in benign hyperplasia and cancer of the prostate. Prostate 1995, 27, 212–9. [DOI] [PubMed] [Google Scholar]
- Ohyama C.; Hosono M.; Nitta K.; Oh-eda M.; Yoshikawa K.; Habuchi T.; Arai Y.; Fukuda M. Carbohydrate structure and differential binding of prostate specific antigen to Maackia amurensis lectin between prostate cancer and benign prostate hypertrophy. Glycobiology 2004, 14, 671–9. [DOI] [PubMed] [Google Scholar]
- Tabares G.; Radcliffe C. M.; Barrabes S.; Ramirez M.; Aleixandre R. N.; Hoesel W.; Dwek R. A.; Rudd P. M.; Peracaula R.; de Llorens R. Different glycan structures in prostate-specific antigen from prostate cancer sera in relation to seminal plasma PSA. Glycobiology 2006, 16, 132–45. [DOI] [PubMed] [Google Scholar]
- Zhang W. M.; Leinonen J.; Kalkkinen N.; Dowell B.; Stenman U. H. Purification and characterization of different molecular forms of prostate-specific antigen in human seminal fluid. Clin.Chem. 1995, 41, 1567–73. [PubMed] [Google Scholar]
- Charrier J. P.; Tournel C.; Michel S.; Dalbon P.; Jolivet M. Two-dimensional electrophoresis of prostate-specific antigen in sera of men with prostate cancer or benign prostate hyperplasia. Electrophoresis 1999, 20, 1075–81. [DOI] [PubMed] [Google Scholar]
- Sarrats A.; Saldova R.; Comet J.; O’Donoghue N.; de Llorens R.; Rudd P. M.; Peracaula R. Glycan characterization of PSA 2-DE subforms from serum and seminal plasma. OMICS 2010, 14, 465–74. [DOI] [PubMed] [Google Scholar]
- Okada T.; Sato Y.; Kobayashi N.; Sumida K.; Satomura S.; Matsuura S.; Takasaki M.; Endo T. Structural characteristics of the N-glycans of two isoforms of prostate-specific antigens purified from human seminal fluid. Biochim. Biophys. Acta 2001, 1525, 149–60. [DOI] [PubMed] [Google Scholar]
- Peracaula R.; Tabares G.; Royle L.; Harvey D. J.; Dwek R. A.; Rudd P. M.; de Llorens R. Altered glycosylation pattern allows the distinction between prostate-specific antigen (PSA) from normal and tumor origins. Glycobiology 2003, 13, 457–70. [DOI] [PubMed] [Google Scholar]
- Tajiri M.; Ohyama C.; Wada Y. Oligosaccharide profiles of the prostate specific antigen in free and complexed forms from the prostate cancer patient serum and in seminal plasma: a glycopeptide approach. Glycobiology 2008, 18, 2–8. [DOI] [PubMed] [Google Scholar]
- Mechref Y.; Novotny M. V. Structural investigations of glycoconjugates at high sensitivity. Chem. Rev. 2002, 102, 321–69. [DOI] [PubMed] [Google Scholar]
- Bond M. R.; Kohler J. J. Chemical methods for glycoprotein discovery. Curr. Opin. Chem. Biol. 2007, 11, 52–8. [DOI] [PubMed] [Google Scholar]
- Mechref Y.; Hu Y.; Garcia A.; Hussein A. Identifying cancer biomarkers by mass spectrometry-based glycomics. Electrophoresis 2012, 33, 1755–67. [DOI] [PMC free article] [PubMed] [Google Scholar]
- Whelan S. A.; Lu M.; He J.; Yan W.; Saxton R. E.; Faull K. F.; Whitelegge J. P.; Chang H. R. Mass spectrometry (LC–MS/MS) site-mapping of N-glycosylated membrane proteins for breast cancer biomarkers. J. Proteome Res. 2009, 8, 4151–60. [DOI] [PMC free article] [PubMed] [Google Scholar]
- Wada Y.; Kadoya M.; Okamoto N. Mass spectrometry of apolipoprotein C-III, a simple analytical method for mucin-type O-glycosylation and its application to an autosomal recessive cutis laxa type-2 (ARCL2) patient. Glycobiology 2012, 22, 1140–4. [DOI] [PubMed] [Google Scholar]
- Madera M.; Mechref Y.; Klouckova I.; Novotny M. V. High-sensitivity profiling of glycoproteins from human blood serum through multiple-lectin affinity chromatography and liquid chromatography/tandem mass spectrometry. J. Chromatogr B Analyt Technol. Biomed Life Sci. 2007, 845, 121–37. [DOI] [PubMed] [Google Scholar]
- Zhang H.; Li X. J.; Martin D. B.; Aebersold R. Identification and quantification of N-linked glycoproteins using hydrazide chemistry, stable isotope labeling and mass spectrometry. Nat. Biotechnol. 2003, 21, 660–6. [DOI] [PubMed] [Google Scholar]
- Keshishian H.; Addona T.; Burgess M.; Kuhn E.; Carr S. A. Quantitative, multiplexed assays for low abundance proteins in plasma by targeted mass spectrometry and stable isotope dilution. Mol. Cell. Proteomics 2007, 6, 2212–29. [DOI] [PMC free article] [PubMed] [Google Scholar]
- Leymarie N.; Griffin P. J.; Jonscher K.; Kolarich D.; Orlando R.; McComb M.; Zaia J.; Aguilan J.; Alley W. R.; Altmann F.; Ball L. E.; Basumallick L.; Bazemore-Walker C. R.; Behnken H.; Blank M. A.; Brown K. J.; Bunz S. C.; Cairo C. W.; Cipollo J. F.; Daneshfar R.; Desaire H.; Drake R. R.; Go E. P.; Goldman R.; Gruber C.; Halim A.; Hathout Y.; Hensbergen P. J.; Horn D. M.; Hurum D.; Jabs W.; Larson G.; Ly M.; Mann B. F.; Marx K.; Mechref Y.; Meyer B.; Moginger U.; Neususs C.; Nilsson J.; Novotny M. V.; Nyalwidhe J. O.; Packer N. H.; Pompach P.; Reiz B.; Resemann A.; Rohrer J. S.; Ruthenbeck A.; Sanda M.; Schulz J. M.; Schweiger-Hufnagel U.; Sihlbom C.; Song E.; Staples G. O.; Suckau D.; Tang H.; Thaysen-Andersen M.; Viner R. I.; An Y.; Valmu L.; Wada Y.; Watson M.; Windwarder M.; Whittal R.; Wuhrer M.; Zhu Y.; Zou C. Interlaboratory study on differential analysis of protein glycosylation by mass spectrometry: the ABRF glycoprotein research multi-institutional study 2012. Mol. Cell. Proteomics 2013, 12, 2935–51. [DOI] [PMC free article] [PubMed] [Google Scholar]
- Mayampurath A. M.; Wu Y.; Segu Z. M.; Mechref Y.; Tang H. Improving confidence in detection and characterization of protein N-glycosylation sites and microheterogeneity. Rapid Commun. Mass Spectrom. 2011, 25, 2007–19. [DOI] [PubMed] [Google Scholar]
- Mayampurath A.; Yu C. Y.; Song E.; Balan J.; Mechref Y.; Tang H. Computational framework for identification of intact glycopeptides in complex samples. Anal. Chem. 2014, 86, 453–63. [DOI] [PubMed] [Google Scholar]
- Wuhrer M.; Koeleman C. A. M.; Deelder A. M. Hexose rearrangements upon fragmentation of N-glycopeptides and reductively aminated N-glycans. Anal. Chem. 2009, 81, 4422–32. [DOI] [PubMed] [Google Scholar]
- Wuhrer M.; Deelder A. M.; van der Burgt Y. E. M. Mass spectrometric glycan rearrangements. Mass Spectrom. Rev. 2011, 30, 664–80. [DOI] [PubMed] [Google Scholar]
- Behnken H. N.; Ruthenbeck A.; Schulz J. M.; Meyer B. Glycan analysis of prostate specific antigen (PSA) directly from the intact glycoprotein by HR–ESI/TOF–MS. J. Proteome Res. 2014, 13, 997–1001. [DOI] [PubMed] [Google Scholar]
Associated Data
This section collects any data citations, data availability statements, or supplementary materials included in this article.