

Abstract
We present a versatile method to characterize ATPase and kinase activities and discover new inhibitors of these proteins. The proton NMR-based assay directly monitors ATP turnover and is easy to implement, requires no additional reagents and can potentially be applied to GTP. We validated the method's accuracy, applied it to the monitoring of ATP turnover by actin and to the screening of ATPase inhibitors, and showed that it is also applicable for the monitoring of GTP hydrolysis.
The energy for many diverse cellular processes including signal transduction, transport, metabolism and muscle contraction is derived by the hydrolysis of ATP.1 The characterization of such processes relies on the understanding of the enzyme reactivity and is a fundamental step in the development of inhibitors of the enzymatic activity. Consequently a number of assays have been developed to monitor enzyme function and inhibitory activity. Methods employed for protein kinases often rely on the detection of the phosphorylated substrate as a product and utilize a radiolabeled phosphate donor (γ-32P-ATP) or labelled substrates and/or antibodies for substrate recognition and detection.2 Other methods are available that measure the depletion of ATP, or accumulation of ADP, and that are more generally applicable to ATPases. These include colorimetric, luminescence or fluorescence based assays for the detection of residual ATP, produced ADP or inorganic phosphates.2–6
During the course of our research we often encounter the necessity to assess the activity of a protein kinase (e.g., produced recombinantly) or an ATPase. We therefore set out to develop an NMR-based method that could be routinely used in the laboratory.
We chose to focus on the detection of ATP turnover because it is applicable to both ATPases and kinases and to utilize 1H NMR spectroscopy rather than the more classical 31P NMR7–10 1HNMR is more readily available, is inherently more sensitive and provides additional gain in sensitivity through the use of cryogenic probes.
During the course of our research, we tested the method on Bruker 600 MHz and 700 MHz spectrometers equipped with cryogenic probes as well as on a 500 MHz spectrometer with a standard room temperature probe (TBI probe). In each case this method showed high sensitivity and accuracy. The method detects the resolved signals of the purine H8 proton in ATP and ADP, which when integrated yield directly the ATP decrease during ATPase activity (Fig. 1a). We verified feasibility and validated the assay on test samples with different spectrometers and then applied it to the characterization of the ATPase activity of actin. The result is a generally applicable, facile method that directly detects ATP and GTP turnover that will find wide use in the characterization of enzymatic activity.
Fig. 1.
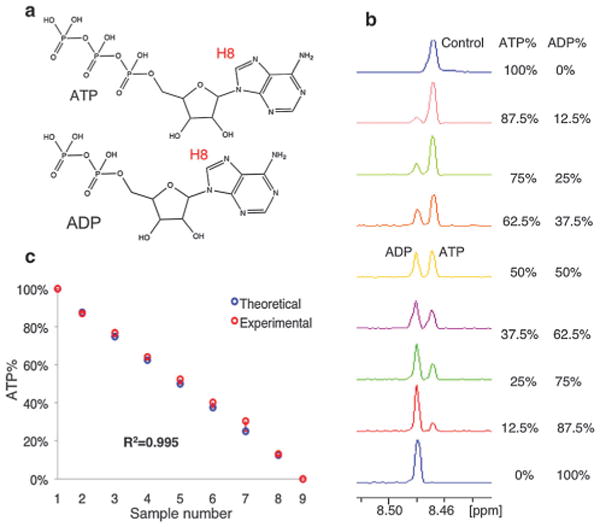
Quantitative analysis of ATP/ADP in control experiment. (a) ATP, ADP structure: the H8 used for quantification is labeled. (b) NMR titration experiment to quantify ATP% in control samples. (c) Data fitting and R2 analysis of control experiment.
We first acquired mono-dimensional 1H NMR spectra of a series of control samples with defined ratios of ATP/ADP. The purine H8 proton resonance is distinguishable for ATP and ADP at 8.47 and 8.48 ppm, respectively (Fig. 1b). The ATP percentage for each sample was calculated from the integrated peaks. As shown in Fig. 1, the experimentally determined ATP percentage agrees very well with the theoretical values with an R2 of 0.995 (Fig. 1c), demonstrating the accuracy of the method.
Actin represents a family of polymerizable ATPases found in all types of eukaryotic cells and many bacteria.11,12 ATP-bound actin assembles into helical filaments, and incorporation into the filament accelerates ATP hydrolysis 10 000-fold. Upon ATP hydrolysis and phosphate release, the resulting ADP-actin is prone to depolymerization, at which point the depolymerized actin monomer can re-load with ATP and add to the filament again, creating a cycle of polymerization–depolymerization that will continue as long as ATP is present in solution.13 Since actin polymerization–depolymerization dynamics are tightly regulated by a variety of proteins, it is possible to modulate the turnover rate with these factor proteins in vitro.
To illustrate the application of this method, we monitored the hydrolysis of ATP under three conditions: non-polymerizing (actin monomers/a); actin filament formation (actin and INF2-FFC, inverted formin2, CAAX variant/af), and accelerated actin filament formation (actin, profilin and INF2-FFC/afp).14 Time points from three minutes to two hours were taken, as well as an overnight reaction of 19 hours (Fig. 2a). After acquiring spectra in automation, percentages of residual ATP at different time points were calculated in the same manner as the control. The ATP percentage versus time plot indicates that actin alone had a minimal ATPase activity, while filament formation conditions increased ATPase activity, with a 50% ATP turnover after approximately 1 hour (Fig. 2b-a, af). In the accelerated filament formation condition, the ATP turnover rate is further increased to a 50% turnover time of less than 10 minutes (Fig. 2b-a, afp). Altogether these data suggest that 1H NMR is an accurate and efficient method for monitoring ATP turnover. Given the advances in NMR automation (e.g., a SampleJet sample changer, Bruker) all samples could be acquired with minimal operator intervention. The assay was implemented in this instance in a non-homogenous format (single time points required sample preparation), but depending on the concentration of ATP utilized (which dictates signal/noise and therefore data acquisition time) and the enzyme kinetics, the time-course experiments could be executed in a continuous manner with acquisition of NMR spectra on the same sample at different time points. The assay is also compatible with a wide range of ATP concentrations with the lowest tested in this experiment at approximately 4 μM of ATP (importantly ATP concentrations higher than 1 mM pose no problems) The assay can also be used to monitor enzymatic reactions with AMP as substrate or product. In the actin samples there is a trace contamination of some kinase that can further hydrolyze ADP into AMP (clearly observed in the overnight reaction, Fig. 2a). Importantly, the integration of ATP, ADP and AMP signals from this spectrum is equal to the initial amount of ATP.
Fig. 2.
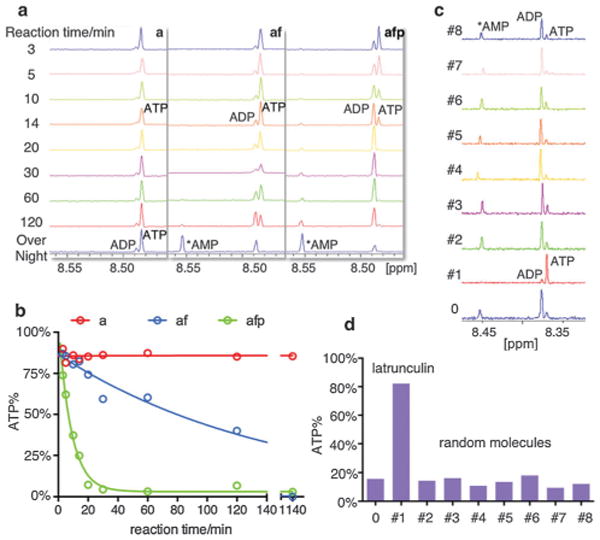
ATP hydrolysis kinetics by actin and inhibitor screening. (a) 1H NMR spectra of ATP turnover by actin at different time points (a-actin alone, af-actin and INF2-FFC, afp-actin, INF2-FFC and profilin). (b) Plot of residual ATP percentage vs. reaction time. (c) 1H NMR spectra of ATP/ADP after 30 minutes reaction in afp conditions with/without small molecules (0 – no small molecule; #1 – latrunculin; #2–8 – random small molecules). (d) Residual ATP percentage in each sample.
Single point experiments can be easily utilized for assessing inhibitor activity, providing a medium throughput NMR-based screening assay with low risk of artifacts (with the limit that inhibitor resonances should not overlap with both the ATP and the ADP H8 resonance). To demonstrate the application, we prepared a small library of small molecules and one commercially available actin inhibitor, latrunculin. The small-scale screening was carried out on a Bruker 600 MHz spectrometer equipped with a 1.7 mm cryoprobe, requiring only 35 μl of each sample and greatly reduced the sample cost for the inhibitor screening. 1H spectra were collected to analyze the percentage of residual ATP in the system after 30 minutes reaction in the accelerated actin filament formation condition with or without small molecules (Fig. 2c). At a concentration of 20 μM small molecule in each sample, latrunculin achieved high level of inhibition with more than 80% ATP left after 30 minutes while in absence of inhibitor or with other random molecules, the residual ATP was less than 20% (Fig. 2d). This implementation of the screening method, with low sample demand, was carried out in automation, utilizing a sample changer, and can be potentially used in large scale screening of small molecule libraries for inhibitors.
To expand the application of the method, we also tested the possibility of monitoring GTP turnover. Similar to the ATP standard, we prepared a series of GTP/GDP samples at know ratios, and used the integration of their H8 peaks to determine the accuracy of the experimental ratios (Fig. 3a and b). As expected, the calculated ratios matched the theoretical ones well with an R2 of 0.989 (Fig. 3c), demonstrating that the same method can be used to monitor GTPase activity as well with similar accuracy.
Fig. 3.
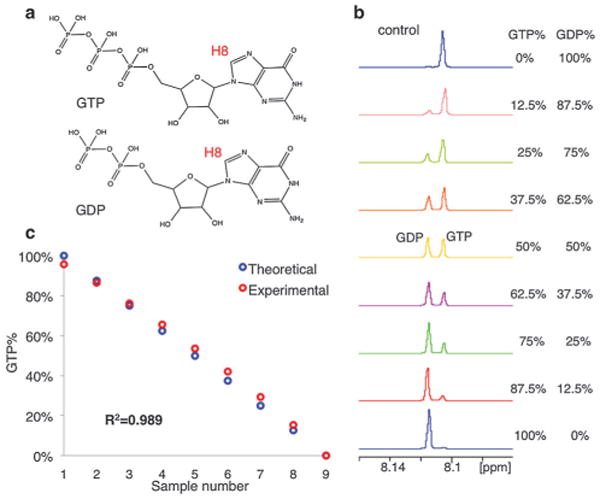
Quantitative measurement of GTP/GDP in control experiment. (a) GTP, GDP structure: the H8 used for quantification is labeled. (b) NMR titration experiment to quantify GTP% in control samples. (c) Data fitting and R2 analysis of control experiment.
We additionally measured the performance of the method with NMR instruments at a lower magnetic field, using a walk-up 500 MHz spectrometer (Dartmouth's Chemistry Department NMR facility) equipped with a room temperature, inverse TBI probe. We verified that peak resolution is still sufficient for accurate integration of the ATP/ADP signals (Fig. S1a, ESI†), with high reproducibility on five independent measurements acquired in automation on the same sample. The lower detection limit under the condition tested is approximately 300 nM ATP (Fig. S1b, ESI†).
Traditional methods to measure ATPase or kinase activity rely on the measurement of ADP formation, ATP depletion or phospho-product formation, with detection achieved by radiometric assays, fluorescence, luminescence or colorimetric methods.15,16 Radio-isotopes assays are associated with high costs and strict regulations. The widely utilized assays that measure inorganic phosphates (Pi) formation (e.g., the Malachite Green assay17), are hampered by the high background signal of contaminating Pi (for example from buffers and commercial ATP sources) or interference from buffer components such as glycerol.18 This can be particularly problematic when commercial sources of enzymes are utilized,19 when multiple protein components are present, like in the actin case examined here, and when GTP hydrolysis is monitored, as it is reported to generate a higher background.20 The NMR-based assay demonstrated here is insensitive to contaminating Pi, as it relies on the simultaneous determination of ATP, ADP and AMP and is compatible with a wide variety of buffer systems. No additional reagents or incubation times are required and the experiment time is limited to the effective NMR data acquisition time. The detection of ATP, ADP and AMP strengthens the reliability and specificity of the method and widens the applicability range. Furthermore, the NMR based assay does not rely on the activity of coupled enzymes for the detection of ADP accumulation. Assays like the pyruvate kinase (PK) l-lactate dehydrogenase (LDH) linked assay offer the advantage of a spectrophotometric measurement of NADH absorbance as ADP is recycled to ATP, at the expense of increased complexity. The assay outcome is affected by limitations in the buffer choices (the buffer must be compatible with all of the enzymes) and possible interference of assay components. For example, in assays that include co-factor proteins (e.g., formin and profilin in the case examined here) and in the widely utilized application of inhibitor screening, the effect of these additional components on the secondary (or tertiary) enzyme activity cannot be ignored.21
Our results clearly demonstrate that using 1H NMR spectroscopy to measure ATPase activity is a sensitive and highly automated approach. The method does not require antibodies, secondary enzymes or additional reagents, affords a medium throughput and can be employed under a variety of experimental conditions. Because of the absence of additional reagents and complex reactions, the assay is easily accessible to laboratories that do not routinely engage with ATPase/kinase assays. The range of ATP concentrations that can be utilized in the assay is comparable to those employed in malachite green or LDH/PK assays (micromolar to millimolar).22–24 These factors along with the possible automation of data acquisition make this method ideal for medium-throughput screening for inhibitors of ATP and GTP dependent enzymes.
Supplementary Material
Footnotes
Electronic supplementary information (ESI) available: Experimental details are included in the supplementary. See DOI: 10.1039/c4cc04399e
Contributor Information
Maria Pellegrini, Email: maria.pellegrini@dartmouth.edu.
Dale F. Mierke, Email: dale.f.mierke@dartmouth.edu.
References
- 1.Knowles JR. Annu Rev Biochem. 1980;49:877–919. doi: 10.1146/annurev.bi.49.070180.004305. [DOI] [PubMed] [Google Scholar]
- 2.Eglen RM, Reisine T. Assay Drug Dev Technol. 2009;7:22–43. doi: 10.1089/adt.2008.164. [DOI] [PubMed] [Google Scholar]
- 3.Geladopoulos TP, Sotiroudis TG, Evangelopoulos AE. Anal Biochem. 1991;192:112–116. doi: 10.1016/0003-2697(91)90194-x. [DOI] [PubMed] [Google Scholar]
- 4.Charter NW, Kauffman L, Singh R, Eglen RM. J Biomol Screening. 2006;11:390–399. doi: 10.1177/1087057106286829. [DOI] [PubMed] [Google Scholar]
- 5.Kashem MA, Nelson RM, Yingling JD, Pullen SS, Prokopowicz AS, 3rd, Jones JW, Wolak JP, Rogers GR, Morelock MM, Snow RJ, Homon CA, Jakes S. J Biomol Screening. 2007;12:70–83. doi: 10.1177/1087057106296047. [DOI] [PubMed] [Google Scholar]
- 6.Hardt N, Hacker SM, Marx A. Org Biomol Chem. 2013;11:8298–8305. doi: 10.1039/c3ob41751d. [DOI] [PubMed] [Google Scholar]
- 7.Sheldon JG, Williams SP, Fulton AM, Brindle KM. Proc Natl Acad Sci U S A. 1996;93:6399–6404. doi: 10.1073/pnas.93.13.6399. [DOI] [PMC free article] [PubMed] [Google Scholar]
- 8.Kemp GJ, Thompson CH, Barnes PRJ, Radda GK. Magn Reson Med. 1994;31:248–258. doi: 10.1002/mrm.1910310303. [DOI] [PubMed] [Google Scholar]
- 9.Bittl JA, Balschi JA, Ingwall JS. Circ Res. 1987;60:871–878. doi: 10.1161/01.res.60.6.871. [DOI] [PubMed] [Google Scholar]
- 10.Pucar D, Dzeja PP, Bast P, Gumina RJ, Drahl C, Lim L, Juranic N, Macura S, Terzic A. Mol Cell Biochem. 2004;256–257:281–289. doi: 10.1023/b:mcbi.0000009875.30308.7a. [DOI] [PMC free article] [PubMed] [Google Scholar]
- 11.Kabsch W, Vandekerckhove J. Annu Rev Biophys Biomol Struct. 1992;21:49–76. doi: 10.1146/annurev.bb.21.060192.000405. [DOI] [PubMed] [Google Scholar]
- 12.Shaevitz JW, Gitai Z. Cold Spring Harbor Perspect Biol. 2010;2:a000364. doi: 10.1101/cshperspect.a000364. [DOI] [PMC free article] [PubMed] [Google Scholar]
- 13.Straub FB, Feuer G. Biochim Biophys Acta. 1950;4:455–470. [PubMed] [Google Scholar]
- 14.Ramabhadran V, Hatch AL, Higgs HN. J Biol Chem. 2013;288:26847–26855. doi: 10.1074/jbc.M113.472415. [DOI] [PMC free article] [PubMed] [Google Scholar]
- 15.Jia Y, Quinn CM, Kwak S, Talanian RV. Curr Drug Discovery Technol. 2008;5:59–69. doi: 10.2174/157016308783769414. [DOI] [PubMed] [Google Scholar]
- 16.Wu ZL. PLoS One. 2011;6:e23172. doi: 10.1371/journal.pone.0023172. [DOI] [PMC free article] [PubMed] [Google Scholar]
- 17.Itaya K, Ui M. Clin Chim Acta. 1966;14:361–366. doi: 10.1016/0009-8981(66)90114-8. [DOI] [PubMed] [Google Scholar]
- 18.Shirasaka Y, Onishi Y, Sakurai A, Nakagawa H, Ishikawa T, Yamashita S. Biol Pharm Bull. 2006;29:2465–2471. doi: 10.1248/bpb.29.2465. [DOI] [PubMed] [Google Scholar]
- 19.Bartolini M, Wainer IW, Bertucci C, Andrisano V. J Pharm Biomed Anal. 2013;73:77–81. doi: 10.1016/j.jpba.2012.03.021. [DOI] [PMC free article] [PubMed] [Google Scholar]
- 20.Monroy CA, Mackie DI, Roman DL. PLoS One. 2013;8:e62247. doi: 10.1371/journal.pone.0062247. [DOI] [PMC free article] [PubMed] [Google Scholar]
- 21.Kiianitsa K, Solinger JA, Heyer WD. Anal Biochem. 2003;321:266–271. doi: 10.1016/s0003-2697(03)00461-5. [DOI] [PubMed] [Google Scholar]
- 22.Huang TG, Hackney DD. J Biol Chem. 1994;269:16493–16501. [PubMed] [Google Scholar]
- 23.Harmel N, Apell HJ. J Gen Physiol. 2006;128:103–118. doi: 10.1085/jgp.200609505. [DOI] [PMC free article] [PubMed] [Google Scholar]
- 24.Nadeau K, Das A, Walsh CT. J Biol Chem. 1993;268:1479–1487. [PubMed] [Google Scholar]
Associated Data
This section collects any data citations, data availability statements, or supplementary materials included in this article.