The suppression ratio (the ratio of ultrashort echo-time MR imaging signal amplitude obtained without long-T2 suppression to that obtained with long-T2 suppression) can potentially be a better biomarker for cortical bone porosity than bulk bone water concentration, thereby providing quantitative insight into the structural degradation of cortical bone in degenerative bone disease.
Abstract
Purpose
To quantify bulk bone water to test the hypothesis that bone water concentration (BWC) is negatively correlated with bone mineral density (BMD) and is positively correlated with age, and to propose the suppression ratio (SR) (the ratio of signal amplitude without to that with long-T2 suppression) as a potentially stronger surrogate measure of porosity, which is evaluated ex vivo and in vivo.
Materials and Methods
Human subject studies were conducted in compliance with institutional review board and HIPAA regulations. Healthy men and women (n = 72; age range, 20–80 years) were examined with a hybrid radial ultrashort echo time magnetic resonance (MR) imaging sequence at 3.0 T, and BWC was determined in the tibial midshaft. In a subset of 40 female subjects, the SR was measured with a similar sequence. Cortical volumetric BMD (vBMD) was measured by means of peripheral quantitative computed tomography (CT). The method was validated against micro-CT–derived porosity in 13 donor human cortical bone specimens. Associations among parameters were evaluated by using standard statistical tools.
Results
BWC was positively correlated with age (r = 0.52; 95% confidence interval [CI]: 0.22, 0.73; P = .002) and negatively correlated with vBMD at the same location (r = −0.57; 95% CI: −0.76, −0.29; P < .001). Data were suggestive of stronger associations with SR (r = 0.64, 95% CI: 0.39, 0.81, P < .001 for age; r = −0.67, 95% CI: −0.82, −0.43, P < .001 for vBMD; P < .001 for both), indicating that SR may be a more direct measure of porosity. This interpretation was supported by ex vivo measurements showing SR to be strongly positively correlated with micro-CT porosity (r = 0.88; 95% CI: 0.64, 0.96; P < .001) and with age (r = 0.87; 95% CI: 0.62, 0.96; P < .001).
Conclusion
The MR imaging–derived SR may serve as a biomarker for cortical bone porosity that is potentially superior to BWC, but corroboration in larger cohorts is indicated.
© RSNA, 2014
Introduction
Age-related increase in cortical bone porosity is a major cause of the impaired strength of osteoporotic cortical bone (1,2). McCalden et al (3) found ultimate stress, ultimate strain, and energy absorption to decrease by 5%, 9%, and 12% per decade, respectively. There is no strong evidence that the intrinsic mechanical properties of osteoporotic bone are different from those of normal bone. Rather, the impaired strength of osteoporotic cortical bone is a consequence of increased pore volume fraction (2). The majority of these pores, however, are smaller than the resolution limit achievable in vivo. Therefore, an increase in pore volume in the presence of normally mineralized bone manifests as decreased areal or volumetric bone mineral density (BMD) and cannot be distinguished from the situation wherein the pore volume is unaltered but the bone is undermineralized, as, for example, in osteomalacia.
Water in bone exists in two main compartments: The spaces of the Haversian and lacunocanalicular pore system are filled with mobile water, while another water fraction is bound to collagen (4–6). Recent work (4) based on proton nuclear magnetic resonance (MR) transverse relaxation spectroscopy in human cortical bone specimens suggests that approximately two-thirds of the total bone water signal arises from collagen-bound water and one-third arises from pore water, with the two constituents differing in T2 relaxation time. While the rotational and translational motion of pore water protons is essentially unimpeded, allowing motional averaging of dipolar interactions, the motion of bound water is restricted by hydrogen bonding to the collagen backbone. The virtual absence of motional averaging causes the T2 of collagen-bound water to be shorter than that of free water in the pores. The same group showed that the short-T2 (approximately 400 µsec) relaxation fraction assigned to collagen-bound water was strongly positively correlated with peak stress, while the fraction comprising longer T2 values (approximately 1–1000 msec), assigned to free water presumably residing in pore spaces, was negatively correlated with peak stress (7).
Previously, ultrashort echo time (UTE) MR imaging has been shown to depict the short-T2 proton components in cortical bone (8,9). Fernández-Seara et al (10) subsequently showed that the majority of the short-T2 signal resulted from exchangeable protons, and Techawiboonwong and colleagues (11,12) developed a quantitative UTE method to determine total (bulk) bone water concentration (BWC). Some of this work indicated bulk bone water to be significantly greater in postmenopausal women than in their premenopausal peers, and bulk bone water was found to be particularly elevated in patients with end-stage renal disease (12). An important problem is that during aging and osteoporosis, a loss of osteoid results in a proportionate loss of collagen-bound water, while the resulting increase in pore space causes an increase in pore water. Total BWC, being the sum of these two constituents, may therefore be a less-than-optimal measure of bone health. This prompted research on methods to separate the two bone water fractions.
Recent work (13,14) suggests that such separation may be achievable with UTE MR imaging by exploiting the hypothesized differences in T2* between the two water populations. Biswas et al (13) accomplished this goal by means of biexponential analysis of the UTE MR imaging signal decay measured from a series of UTE images obtained with a range of echo times. Although this method is straightforward to implement, it requires collection of image data at many echo times, substantially prolonging imaging time and increasing the risk of image corruption by subject motion. It is further complicated by static magnetic field inhomogeneity caused by the magnetic susceptibility difference between bone tissue and water (15), decreasing the T2* of pore water to values closer to those of bound water, particularly at elevated field strengths. More recently, Horch et al (16) proposed methods involving adiabatic single- or double-inversion pulses as a means to obtain images displaying signal from predominantly bound or pore water, respectively.
Our study aimed to quantify bulk bone water to test the hypothesis that BWC is negatively correlated with BMD and positively correlated with age, and to propose the suppression ratio (SR) (the ratio of signal amplitude without to that with long-T2 suppression) as a surrogate measure of porosity, which we evaluated ex vivo and in vivo.
Materials and Methods
Bulk BWC Quantification
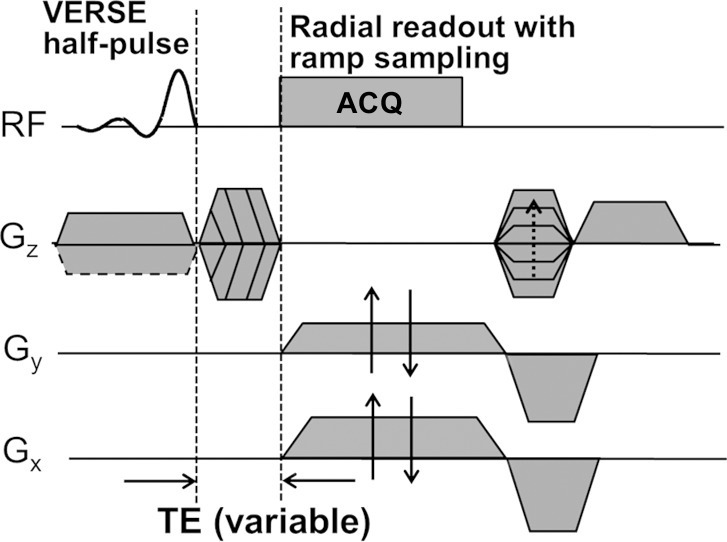
Bulk (total) BWC was quantified with a three-dimensional hybrid radial UTE imaging technique (Fig 1a). The pulse sequence and processing method were developed in the authors’ laboratory and have been previously described (17). The sequence consists of a half-sinc slab-selective excitation pulse and variable–echo time section encoding and involves measurement of the T1 of both bone water and a reference sample of known proton concentration. The signal intensity of bone (Ibone) is converted to BWC (ρbone) by using the following equation (17):
where ρref is the proton concentration of the reference sample, Iref is the reference signal intensity, TEeff is the effective echo time, and  and
and  are the effective transverse proton relaxation rates of the reference sample and bone, respectively. The variable F is given as:
where τ is the duration of the UTE half-pulse, TR is repetition time, and terms fxy and fz are the responses of the transverse and longitudinal magnetization to the RF pulses used in the imaging sequence. Although analytical expressions for fxy and fz have been derived for rectangular pulses (18), they must be calculated numerically for shaped RF pulses.
Figure 1a:
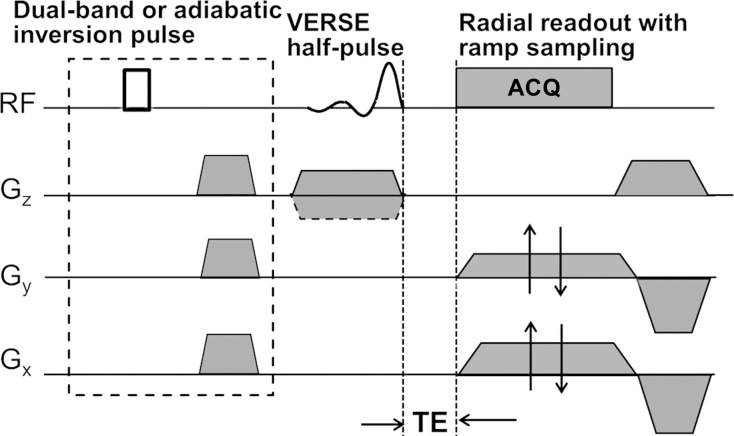
Diagrams of UTE sequences used for (a) bulk BWC and (b) SR measurements. (a) A three-dimensional hybrid radial UTE sequence involving radial readout with ramp sampling for the kx and ky axes and variable echo time (TE) on the kz axis was used to achieve minimal echo time for kz = 0. (b) A two-dimensional long-T2-suppressed UTE sequence was used for quantifying SR. Dashed box = magnetization preparation portion for long-T2 suppression, which consisted of either a dual-band or an adiabatic inversion pulse followed by a spoiler gradient before standard UTE acquisition. ACQ = data acquisition, Gx = x-gradient, Gy = y-gradient, Gz = z-gradient, RF = radiofrequency, VERSE = variable-rate selective excitation.
This technique does not resolve signals from water residing in different spaces and binding environments; rather, it yields all detectable water in the cortex. All MR imaging studies were performed with a 3.0-T whole-body imaging unit (TIM Trio; Siemens Medical Solutions, Erlangen, Germany).
SR Calculation
The SR, defined as the ratio of the unsuppressed UTE signal intensity to the long-T2–suppressed signal intensity (Sunsuppressed/Ssuppressed, where S is signal intensity), yields an index of porosity. The rationale underlying our approach is that bound water possesses shorter T2 values (approximately 300–400 μsec) than pore bone water (>1 msec), as pointed out above. Thus, in the absence of suppression, the UTE sequence detects the signal from both bound and pore water, while the long-T2–suppressed UTE signal arises primarily from bound water. The SR should therefore scale positively with pore water fraction, thus representing a surrogate marker of pore volume fraction (porosity).
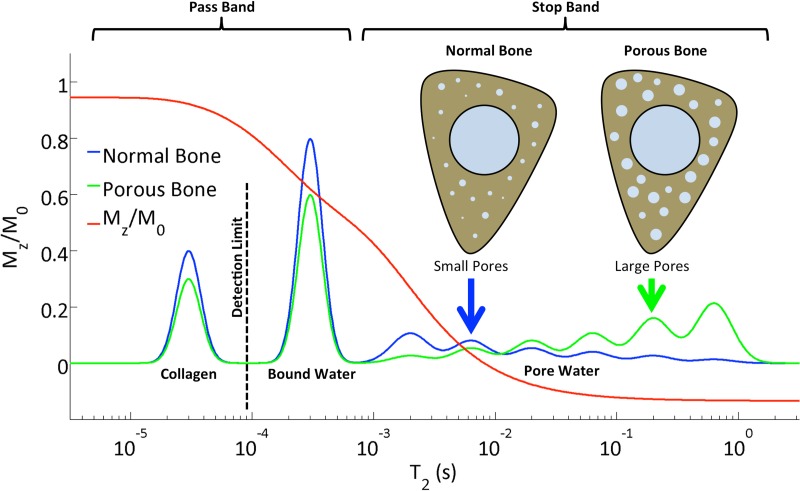
To partially suppress pore bone water, we use the long-T2 suppression techniques detailed in Li et al (19). Figure 1b shows a diagram of the UTE sequence, in which suppression was achieved in two ways: (a) with dual-band saturation-prepared UTE (DB-UTE) and (b) with adiabatic inversion-recovery UTE (IR-UTE). In a, the dual-band saturation pulse used the following parameters: pulse length, 15 msec; water flip angle/fat flip angle, 100°/110°; and suppression bandwidth water on resonance/suppression bandwidth fat at 430 Hz off resonance (3.0 T), 120 Hz/320 Hz. For b, inversion nulling, a hyperbolic secant pulse was used with the following parameters: pulse bandwidth, 1 kHz; pulse duration, 20 msec; and 270-Hz frequency shift toward the lipid peak. The B1 amplitude was set to allow for 30% variation (maximum B1 amplitude, approximately 20 μT), and an inversion time of 100 msec was chosen to null the pore water signal. The center frequency was set to that of muscle water. The response of different proton pools in cortical bone to the dual-band RF pulse computed by means of numerical Bloch equation simulation is shown in Figure 2. The collagen protons with extremely short T2 values (approximately 50 μsec) (10) are beyond the detection limit of the UTE sequences. The bound water protons contribute to the major portion of the UTE signal. On the other hand, the extent to which the pore water is suppressed depends to some extent on the pore size, because its T2 relaxation time is inversely proportional to the surface-to-volume ratio of the pore (20). Generally, the larger the pore, the smaller the surface-to-volume ratio, resulting in longer T2 relaxation times for water in larger pores. Therefore, not only will an increase in pore bone water fraction cause an increased SR, the increasing contribution of large pores will further enhance the effectiveness of suppression, thereby further elevating SRs. Last, any increase in pore volume fraction occurs at the expense of loss of osteoid and therefore bound water, thus reducing the denominator in the quotient Sunsuppressed/Ssuppressed, which defines the SR. Identical digital and analog gain settings were used for the unsuppressed and long-T2–suppressed acquisitions.
Figure 1b:
Diagrams of UTE sequences used for (a) bulk BWC and (b) SR measurements. (a) A three-dimensional hybrid radial UTE sequence involving radial readout with ramp sampling for the kx and ky axes and variable echo time (TE) on the kz axis was used to achieve minimal echo time for kz = 0. (b) A two-dimensional long-T2-suppressed UTE sequence was used for quantifying SR. Dashed box = magnetization preparation portion for long-T2 suppression, which consisted of either a dual-band or an adiabatic inversion pulse followed by a spoiler gradient before standard UTE acquisition. ACQ = data acquisition, Gx = x-gradient, Gy = y-gradient, Gz = z-gradient, RF = radiofrequency, VERSE = variable-rate selective excitation.
Figure 2:
Diagram shows the longitudinal magnetization of different proton pools in cortical bone after the application of a dual-band saturation pulse as a function of T2, as simulated by a numerical Bloch equation solver. Although bound water covers a narrow band centered around 250 µsec, the T2 of the pore water ranges from about 1 to 1000 msec. Increased porosity, along with greater pore sizes, shifts the free water spectrum toward longer T2 values, along with increased overall magnitude, therefore leading to increased SR. In parallel, both bound water and (nondetectable) collagen fractions decrease. The various populations of protons are for illustration of the principle only and are not drawn to scale.
To evaluate the reproducibility of the SR method, seven healthy volunteers (three men and four women) whose ages covered the entire age range were imaged at three time points within an average period of 2 weeks, and the root-mean-square error and intraclass correlation coefficient were computed.
Human Subject Study
A prospective human subject study was performed between July 2009 and May 2012. Bulk water was quantified in 30 healthy men (age range, 22–77 years; average age, 51 years) and 42 healthy women (age range, 26–79 years; average age, 57 years) whose ages evenly covered the age range from 20 to 80 years. Because after menopause bone quality is more variable in women than in men, the number of women enrolled was nine per decade for the age range from 50 to 80 years and five per decade for women younger than 50 years and for all men. Subjects with medical histories that included diseases or treatments known to affect bone mineral homeostasis (eg, malabsorption syndromes, renal or hepatic disease, treatment with dexamethasone or methotrexate) or conditions that limited normal physical activity (eg, stroke, hip or leg fracture, rheumatoid arthritis), were excluded, as well as subjects with a body mass index greater than 35 kg/m2 or a BMD Z-score of greater than 2 or less than −2. Patients were examined with the protocol that is described above and is detailed in Rad et al (17). Three-dimensional UTE images were acquired with the pulse sequence shown in Figure 1a and were processed and analyzed as previously described (17). Specifically, a 5.0-cm axial slab of the left mid-diaphyseal tibia, centered at 38% of the tibial length proximal to the lateral malleolus (site of the thickest cortex) was imaged with an eight-channel transmit-receive knee coil (Invivo, Gainesville, Fla). The lateral malleolus was chosen because it is an easily identifiable landmark.
A subset of the female subjects for whom bulk BWC had previously been obtained (n = 34; age range, 26–79 years; average age, 57 years) were selected (complemented by six new subjects because some subjects from the prior cohort were not available) and were reexamined with the SR protocol detailed above. Again, it was ensured that the postmenopausal age range was represented by a greater number of subjects than the premenopausal range. The purpose of this part of the study was to explore the differential abilities of the SR as a determinant of porosity in comparison to bulk bone water. The rationale for selecting women only was the observation that the range of bulk BWCs in men was far smaller than that in women (see Results). The anatomic site selected and the size and location of the imaging field of view matched those of the bulk water study. The total imaging time for the unsuppressed UTE, DB-UTE, and IR-UTE sequences was 15 minutes. The protocols for all Health Insurance Portability and Accountability Act–compliant human studies were approved by the investigators’ institutional review board, and written informed consent was obtained from the subjects.
Ex Vivo Study
To validate the relationship of the SR to porosity, a specimen study was performed, and the results were validated with micro computed tomography (micro-CT) measurements. Thirteen 36-mm-long bone specimens were cut from human tibiae (from nine women and four men; age range, 27–97 years) that were procured from the National Disease Research Interchange in Philadelphia, Pa. The center of each specimen was located at 38% of the total length of the tibia measured proximally from the lateral malleolus to match the imaging locations in the in vivo study. Bone specimens were housed in plastic tubes containing phosphate-buffered saline, and the samples were centrifuged and sealed before imaging to eliminate air bubbles. Imaging was performed with an in-house custom-built elliptical transmit-receive birdcage wrist coil at 3.0 T using two-dimensional UTE sequences without and with long-T2–suppression magnetization preparation. The latter was achieved with both DB-UTE and IR-UTE, as described above. Imaging parameters common to all three sequences were as follows: field of view, 180 × 180 mm2; section thickness, 5 mm; repetition time/echo time, 300 msec/50 μsec; flip angle, 60°; sampling frequency bandwidth, ±125 kHz; and number of readout points per half-radial projection, 288. Reconstruction yielded a matrix size of 512 × 512, and the in-plane resolution was 0.35 × 0.35 mm2. The entire bone volume was imaged and included in the analysis.
For comparison with MR imaging metrics, cortical bone porosity was measured by using micro-CT. A three-dimensional micro-CT image data set of each entire bone specimen was acquired at 9-μm isotropic resolution using a Bruker micro-CT scanner (Bruker, Kontich, Belgium). The endosteal and periosteal borders were segmented, and binary thresholding was applied to distinguish pore space from bone tissue. Porosity was quantified as the ratio of pore volume to the total volume of the segmented bone. Apparent BMD was also measured using a peripheral quantitative CT scanner (Stratec XCT; Orthometrix, White Plains, NY). A single imaging section was acquired at the center of each cortical bone specimen (0.4 × 0.4 × 2.3 mm), and apparent cortical BMD was quantified in a manner similar to the standard approach used for clinical mid-tibia peripheral quantitative CT studies using the software provided by the manufacturer.
Image Reconstruction
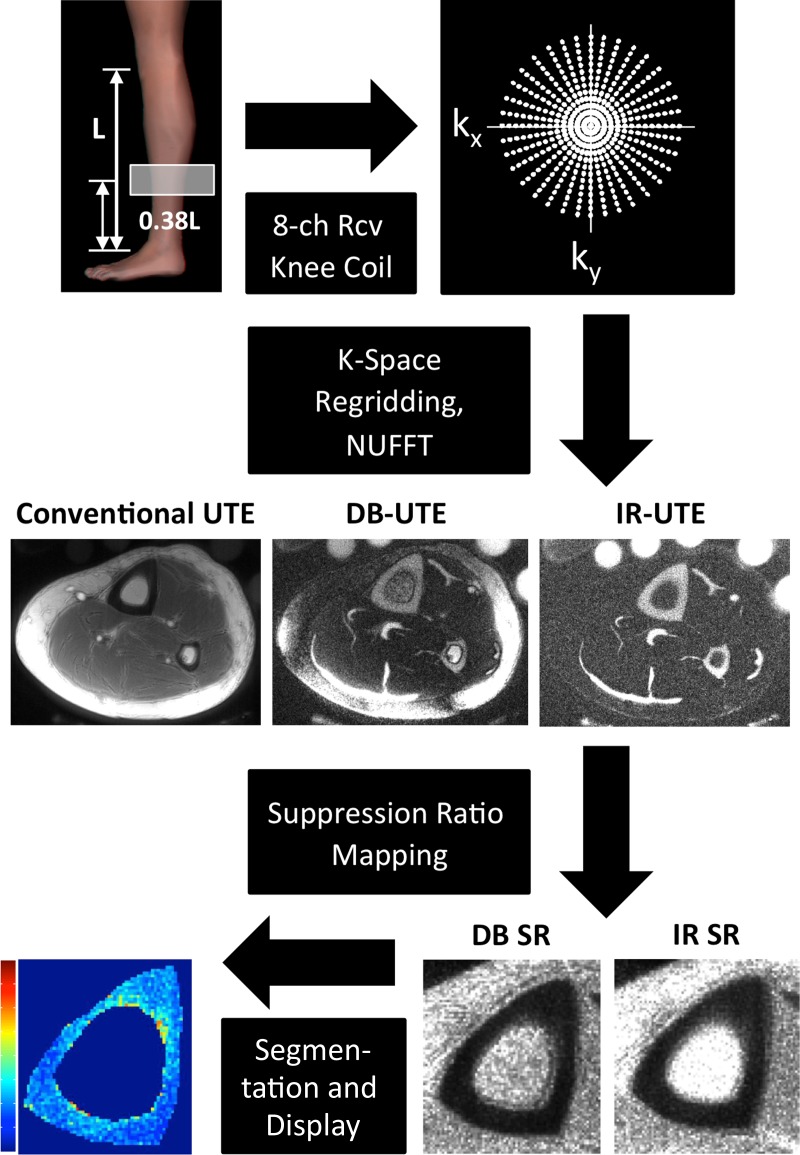
First, k-space sampling density compensation weighting, computed on the basis of gradient mapping (which measures the true k-space trajectories) (19), was performed. Next, k-space data were remapped onto a Cartesian grid by using a gridding algorithm, and a two-dimensional inverse Fourier transform was performed. The final magnitude images were generated as the square root of the sum of squares of the images from each coil.
SR maps were computed as ratios of the conventional UTE image amplitude to the corresponding DB-UTE and IR-UTE image amplitudes. Manual segmentation of the periosteal and endosteal cortical boundaries was performed, followed by voxelwise extraction of IR-SRs and DB-SRs.
Statistical Analysis
A flowchart illustrating the data-processing procedure is shown in Figure 3. All image analysis and reconstruction steps were performed by using custom-designed software programmed in MATLAB (MathWorks, Natick, Mass). Correlations between relevant parameters were examined in StatPlus:Mac LE2009 by means of linear least-squares regression yielding the Pearson correlation coefficient. The significance of each correlation was determined using one-way analysis of variance, with a significance threshold of P < .05. Retest reproducibility and reliability were assessed in terms of the root-mean-square error and intraclass correlation coefficient.
Figure 3:
Flowchart of SR data acquisition and processing procedure shows an axial section acquired without (Conventional UTE) and with dual-band saturation pulse and adiabatic inversion pulse suppression. SR maps were calculated by obtaining the ratios between a conventional UTE image and the corresponding DB-UTE and IR-UTE images. After segmentation of the periosteal and endosteal cortical boundaries, SR parametric maps of the cortical bone can be obtained. 8-ch Rcv = eight-channel receive, NUFFT = nonuniform fast Fourier transform.
Results
Human Subject Study
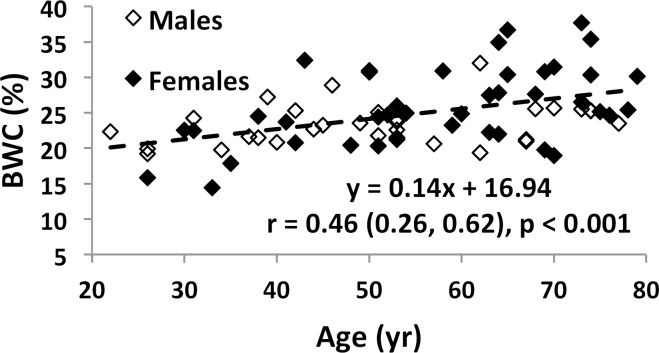
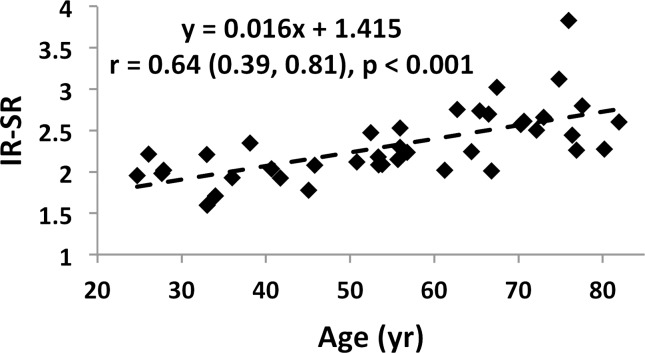
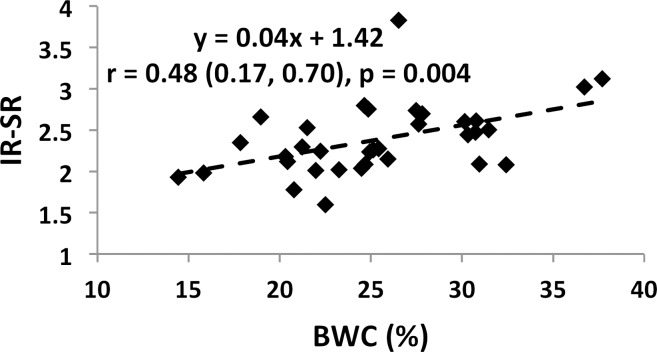
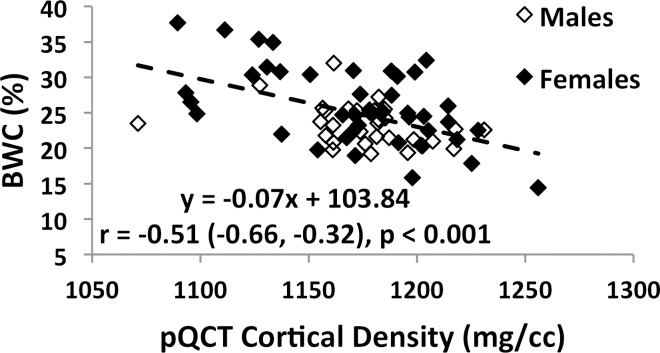
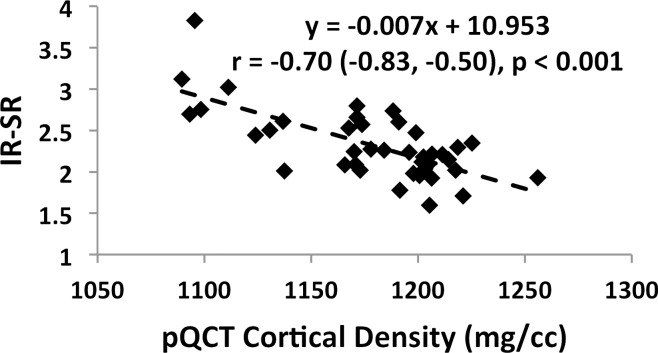
Associations involving BWC and SR versus age and BMD are charted in Figure 4 (data for IR-SRs only are shown). While data for all subjects are presented, comparisons of correlation coefficients between the two measures of porosity involve the same cohort of subjects. Both BWC and SR correlated positively with subject age (Fig 4a, 4c). Inclusion of all 72 subjects (30 men, 42 women) in the regression for BWC yielded r = 0.46 (95% confidence interval [CI]: 0.26, 0.63; P < .001). Stratifying by sex showed no significant correlation for men (n = 30; P = .08) but did for women (n = 42; r = 0.51; 95% CI: 0.25, 0.71; P < .001). The positive association involving SR (r = 0.64; 95% CI: 0.39, 0.81; P < .001) appeared stronger than that for BWC involving the same 34 subjects (r = 0.52; 95% CI: 0.22, 0.73; P = .002). This observation is consistent with bulk bone water comprising both bound and pore water, which have opposing relationships with porosity (7,17). For the same reason, bulk bone water and SR (for the same subjects undergoing studies with both protocols) were only moderately positively associated with each other (n = 34; r = 0.48; 95% CI: 0.17, 0.70; P = .004 [Fig 4e]). Cortical BMD was inversely correlated with BWC (n = 72; r = −0.51; 95% CI: −0.66, −0.32; P < .001 [Fig 4b]) and with SR (n = 40; r = −0.70; 95% CI: −0.83, −0.50; P < .001 [Fig 4d]), suggesting that increased porosity is an outcome of osteoid loss, which in the case of constant mineralization density scales with volumetric BMD.
Figure 4a:
Graphs show associations between (a) BWC and age, (b) BWC and cortical peripheral quantitative CT BMD for the entire study population, (c) IR-SR and age, (d) IR-SR and cortical BMD from peripheral quantitative CT, and (e) IR-SR and BWC. Both BWC and SR were positively correlated with age but negatively correlated with BMD. The larger correlation coefficients involving SR as opposed to BWC as the predictor suggest the former to be a superior biomarker of porosity.
Figure 4c:
Graphs show associations between (a) BWC and age, (b) BWC and cortical peripheral quantitative CT BMD for the entire study population, (c) IR-SR and age, (d) IR-SR and cortical BMD from peripheral quantitative CT, and (e) IR-SR and BWC. Both BWC and SR were positively correlated with age but negatively correlated with BMD. The larger correlation coefficients involving SR as opposed to BWC as the predictor suggest the former to be a superior biomarker of porosity.
Figure 4e:
Graphs show associations between (a) BWC and age, (b) BWC and cortical peripheral quantitative CT BMD for the entire study population, (c) IR-SR and age, (d) IR-SR and cortical BMD from peripheral quantitative CT, and (e) IR-SR and BWC. Both BWC and SR were positively correlated with age but negatively correlated with BMD. The larger correlation coefficients involving SR as opposed to BWC as the predictor suggest the former to be a superior biomarker of porosity.
Figure 4b:
Graphs show associations between (a) BWC and age, (b) BWC and cortical peripheral quantitative CT BMD for the entire study population, (c) IR-SR and age, (d) IR-SR and cortical BMD from peripheral quantitative CT, and (e) IR-SR and BWC. Both BWC and SR were positively correlated with age but negatively correlated with BMD. The larger correlation coefficients involving SR as opposed to BWC as the predictor suggest the former to be a superior biomarker of porosity.
Figure 4d:
Graphs show associations between (a) BWC and age, (b) BWC and cortical peripheral quantitative CT BMD for the entire study population, (c) IR-SR and age, (d) IR-SR and cortical BMD from peripheral quantitative CT, and (e) IR-SR and BWC. Both BWC and SR were positively correlated with age but negatively correlated with BMD. The larger correlation coefficients involving SR as opposed to BWC as the predictor suggest the former to be a superior biomarker of porosity.
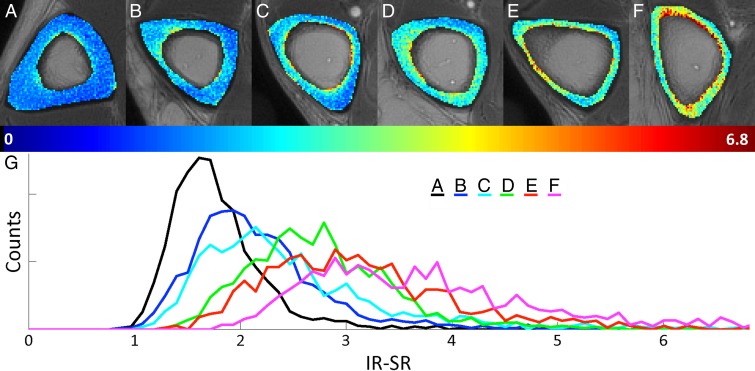
Figure 5 shows representative axial mid-tibia SR parametric maps in six subjects covering the spectrum of SRs (Fig 5, A–F), along with the corresponding histograms (Fig 5, G). We note that SR histograms of bone with low SRs are relatively symmetric. In contrast, in bone with higher average SRs, histograms become increasingly asymmetric, with long tails toward high SRs, suggesting the presence of large pores commensurate with long T2 values. Noticeable also is cortical thinning along with periosteal expansion of the bone in older subjects (eg, Fig 5, E and F).
Figure 5:
A–G, Axial mid-tibia IR-SR parametric maps overlaid on anatomic UTE images obtained without long-T2 suppression in, A–F, six representative subjects along with, G, the corresponding histograms. As SRs increase, histograms become increasingly asymmetric, with long tails toward high SRs, in line with the notion of elevated T2 of the water in larger pores.
Reproducibility
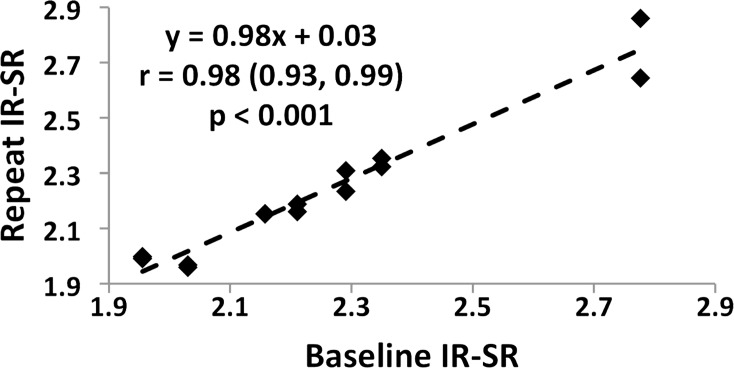
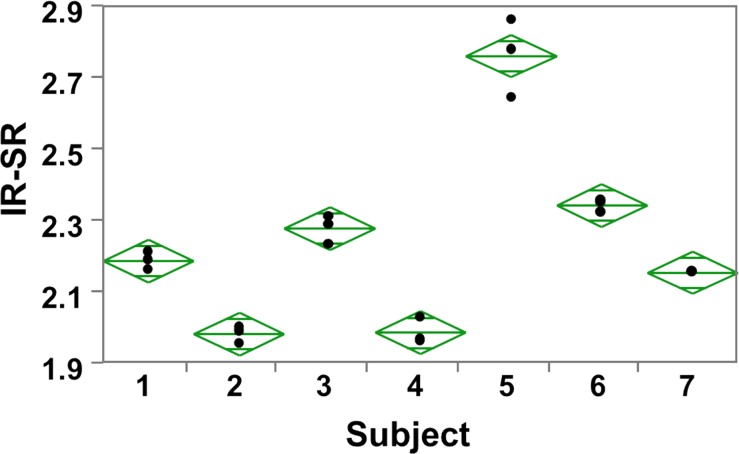
Reproducibility data in humans for the measurement of bulk BWC in the tibial shaft have been presented previously (17). Figure 6a shows the test-retest data for SRs derived by means of adiabatic inversion pulse suppression, yielding an intraclass correlation coefficient of 0.99. As a metric of repeatability, the root-mean-square error was computed for each subject, which yielded an average within-subject coefficient of variation of 1.5%, as illustrated in the scatterplot of Figure 6b. Analysis of variance further indicated real differences between subjects (P < .001), suggesting SR to be a reliable differentiator. Similar results were obtained for DB-based suppression (average within-subject coefficient of variation, 1.8%).
Figure 6a:
Graphs show test-retest reproducibility of the IR-SR method. (a) Graph shows correlation between baseline and first and second follow-up data plotted together on the ordinate in seven subjects. (b) Scatterplot of IR-SRs at three time points. The data yielded an intraclass correlation coefficient of 0.99 and an average coefficient of variation of 1.5%.
Figure 6b:
Graphs show test-retest reproducibility of the IR-SR method. (a) Graph shows correlation between baseline and first and second follow-up data plotted together on the ordinate in seven subjects. (b) Scatterplot of IR-SRs at three time points. The data yielded an intraclass correlation coefficient of 0.99 and an average coefficient of variation of 1.5%.
Correlation between IR-SR and DB-SR
A high degree of positive correlation between IR-SR and DB-SR was observed in the in vivo study (n = 40; r = 0.98; 95% CI: 0.96, 0.99; P < .001), suggesting that both methods are consistent with each other. For this reason, data from only one of the two methods are reported for the in vivo study, given the large number of associations examined.
Ex Vivo Study
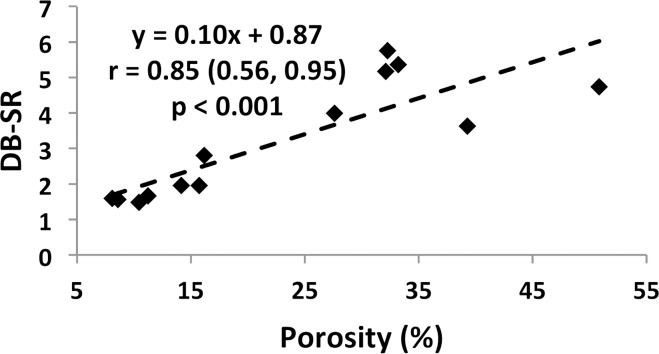
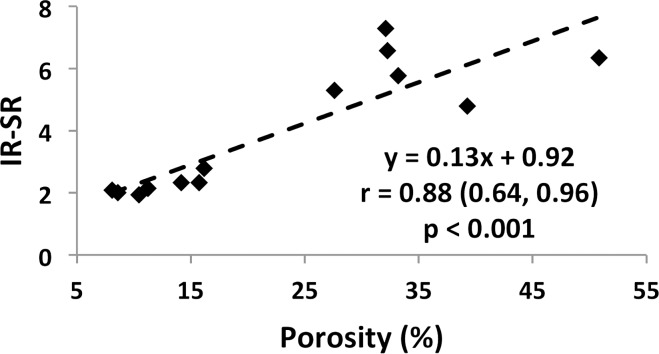
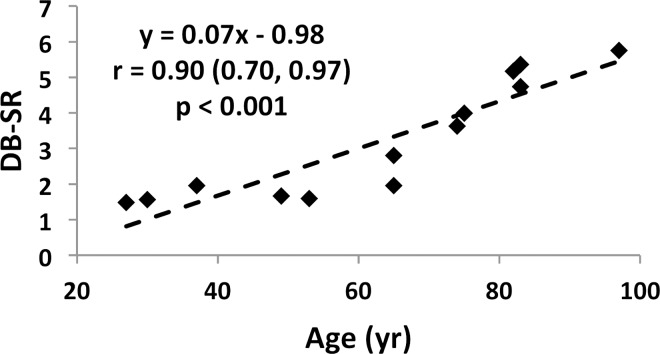
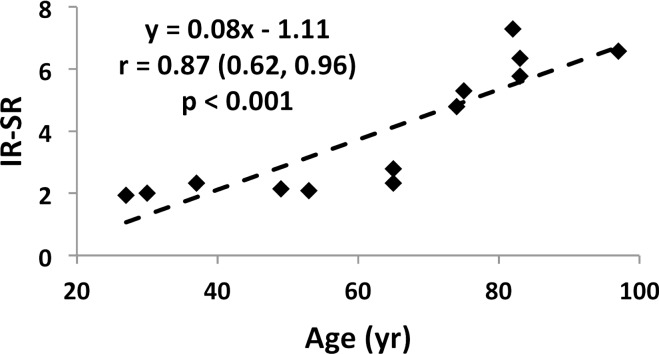
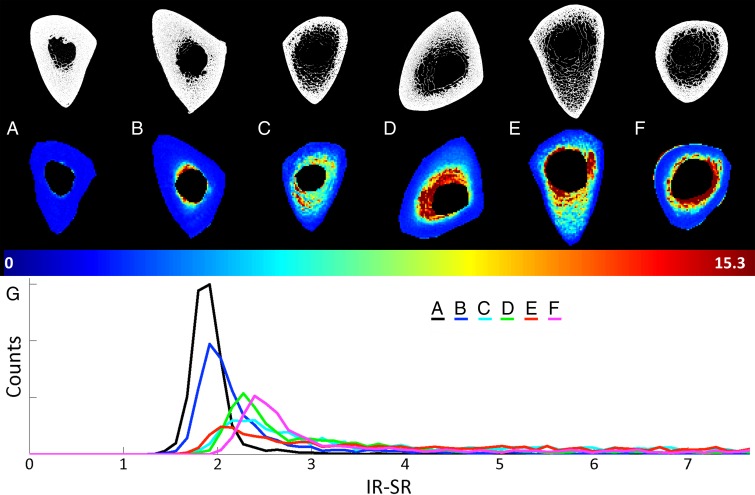
Specimen data, shown for both suppression modes (DB and IR) in Figure 7a and 7b indicate SR and micro-CT–derived porosity to be strongly positively correlated (adiabatic inversion pulse: r = 0.88; 95% CI: 0.64, 0.96; P < .001). As expected, cortical BMD was inversely associated with both micro-CT porosity (r = −0.83; 95% CI: −0.95, −0.50; P < .001) and SR (r = −0.57; 95% CI: −0.85, −0.03; P = .04), suggesting the variations in BMD to be the result of differences in porosity (data not shown). Furthermore, SR and donor age were highly positively correlated with each other (r = 0.87; 95% CI: 0.62, 0.96; P < .001; Fig 7c, 7d), supporting the expected increase in cortical bone porosity with age (22). Figure 8 shows binary micro-CT images after pore segmentation and corresponding SR parametric maps in six donors demonstrating a range of mean SRs (Fig 8, A–F), along with the histogram of pixelwise SRs (Fig 8, G). Notable are elevated SRs in the cortex in older donors, paralleling greater micro-CT porosity. Greater SR is likely the result of a greater proportion of large pores (values up to 385 µm have been reported after histologic examination [23]) associated with elevated T2 expected in the larger mobile water pools.
Figure 7a:
(a–d) Correlation plots in ex vivo validation study (n = 13 samples). Data indicate strong associations of SR with both porosity (a, b) and donor age (c, d) for both SR metrics.
Figure 7b:
(a–d) Correlation plots in ex vivo validation study (n = 13 samples). Data indicate strong associations of SR with both porosity (a, b) and donor age (c, d) for both SR metrics.
Figure 7c:
(a–d) Correlation plots in ex vivo validation study (n = 13 samples). Data indicate strong associations of SR with both porosity (a, b) and donor age (c, d) for both SR metrics.
Figure 7d:
(a–d) Correlation plots in ex vivo validation study (n = 13 samples). Data indicate strong associations of SR with both porosity (a, b) and donor age (c, d) for both SR metrics.
Figure 8:
A–F, Binary micro-CT images after pore segmentation (top) and corresponding SR parametric maps (bottom) in six donors, along with, G, SR histogram. Note the high degree of similarity between the pore distribution in micro-CT images and the SR maps.
Discussion
Quantification of BWC has previously been shown to be reliably achievable by quantitative UTE imaging techniques in conjunction with a reference sample of known composition and approximately matching relaxation characteristics (11,12). A previous pilot study from the authors’ laboratory suggested BWC to increase with age (12). By contrast, one would expect a stronger association of bound water with age, given that bound water scales with osteoid. Our study suggests SR to be more strongly associated with age than bulk BWC. Both parameters merely require the cortex be thick enough to provide enough voxels for averaging. However, unlike BWC, the quantification of SR does not require a reference sample. Also, both bulk BWC and SR were negatively correlated with volumetric BMD, with the association of the latter appearing stronger.
Previously, bicomponent analysis (13,24), an approach that makes use of the expected longer effective transverse relaxation time T2* of pore versus bound water (2–5 msec vs 300–400 µsec) has yielded compelling results ex vivo in bovine and human cortical bone. However, the method is difficult to perform in vivo because of the large number of successive scans that are needed to accurately map the signal decay curve. In contrast, SR, even though it does not yield pore volume fraction, is shown in our study to be a strong predictor of porosity, as evidenced by our ex vivo data. Notably, these were obtained from human cortical bone of the same anatomic location as the in vivo data, and the parameter can conveniently be derived from only two successive scans, obtained with and without long-T2 suppression, respectively. Indeed, our data in excised bone from the mid-tibia show that SR is highly predictive of micro-CT porosity (R2 = 0.70; P < .001), more strongly so than the long-T2* signal fraction, as reported in a recent study (R2= 0.25; P < .001) (24). Furthermore, image processing is simple and does not require curve fitting, which is a fundamentally ill-posed problem. Nevertheless, at least in specimens, where a high signal-to-noise ratio is achievable and neither scan duration or subject motion are a consideration, work (13,24) performed at 3.0-T field strength shows that the method yields bound water fractions that are of the expected order of magnitude. Furthermore, the bicomponent fitting approach rests on the assumption of only two relaxation components, which has been shown not to be the case since T2* in porous media is a function of the surface-to-volume area (25).
Our approach is more akin to the method suggested by Horch et al (16), who showed that pore water can selectively be imaged by preceding the UTE sequence by two successive adiabatic inversion pulses, which restore the pore water signal by virtue of its long T2 relaxation time while saturating the bound water protons. Obtaining the pore volume fraction then requires a measurement of either bulk bone water or bound water separately. Manhard et al (26) have recently implemented this technique on a 3.0-T clinical MR imager and showed the derived pore water fraction to correlate with values from T2 spectra obtained independently on a small-bore system at 4.7 T, as previously described (4,7).
The clinical motivation for quantifying pore and bound water is these parameters’ relationship to the bone’s mechanical properties. As has been well known for more than 2 decades, pore volume fraction is, entirely analogous to man-made materials, a predictor of material strength (27). In a study involving data from more than 200 specimens of human cortical bone of the femur, McCalden et al (3) found age-related increases in porosity to account for over 70% of the reduction in strength. Conversely, bound water fraction, as pointed out previously, is proportional to the true density of bone material and thus should be a predictor of bone strength in its own right (7). Indeed, the work of Nyman et al (28), conducted in femoral cortical bone specimens by means of a relaxometric MR approach on a low-field-strength wide-line system, indicated that the fraction assigned to bound water was positively, and mobile water negatively, correlated with fracture toughness. More recently, Horch et al (7), using similar MR relaxometric techniques to separate the relevant water constituents in bone, found the fractions of bound and free (ie, pore) water to correlate positively (R2 = 0.68) and negatively (R2 = 0.61), respectively, with peak stress.
Importantly, porosity has been shown to be a modifiable parameter. Treatment with antiresorptives has provided evidence of reduced porosity (21,29) quantified on the basis of histomorphometry or micro-CT analysis of bone biopsies. Since biopsy-based measurements of bone microstructure such as porosity are not clinically practical, a robust noninvasive tool with adequate reproducibility would be desirable. High-resolution peripheral quantitative CT has been shown to be able to partially resolve pores in the cortex of the distal extremities using segmentation techniques (16). The method has since provided useful insight, for example, by helping differentiate subjects with from those without fractures (26). In distinction, the MR imaging–derived SR index can be measured at any anatomic location, including the femoral neck, the site of the most traumatic fractures, since it does not hinge on the ability to physically resolve pores.
Some limitations of our study are noted. First, smaller pores tend to have larger surface-to-volume ratio, resulting in shorter T2 values of the resident water compared with larger pores, thereby potentially contributing to the long-T2–suppressed UTE signal. Generally, IR-UTE is less susceptible to pore bone water contamination than DB-UTE because of the superior T2 selectivity and less sensitivity to B1 inhomogeneity of the adiabatic inversion pulse. These distinguishing properties in the long-T2 suppression methods probably explain the higher IR-SRs. Second, the proposed SR is a semiquantitative index in the sense that it does not provide actual pore water volume fraction. Third, this study is not statistically powered to test the hypothesis that SR is more strongly positively correlated with age and negatively with peripheral quantitative CT BMD than is BWC. Last, the SR study was conducted 12–18 months after measurement of BWC, so one could argue that biologic effects may have confounded the results. This, however, is unlikely since all subjects were healthy and cortical bone remodeling is substantially slower than trabecular remodeling.
In addition to the evidence the study provides for the greater effectiveness of SR as a biomarker for porosity relative to BWC, its simplicity and compatibility with clinical MR imagers are particularly attractive features. Finally, given the method’s reproducibility and ease of implementation, studies in patients at risk for fracture and as a means to evaluate the response to intervention are indicated.
In conclusion, the SR (the ratio of UTE MR imaging signal amplitude obtained without long-T2 suppression to that obtained with long-T2 suppression) can potentially be a better biomarker for cortical bone porosity than bulk BWC, thereby providing quantitative insight into the structural degradation of cortical bone in degenerative bone disease.
Advances in Knowledge
■ An MR imaging–based biomarker of cortical bone porosity, the suppression ratio (SR)—the ratio of ultrashort echo time MR imaging signal amplitude obtained without long-T2 suppression to that obtained with long-T2 suppression—is proposed.
■ Ex vivo measurements show SR to be strongly correlated with micro-CT porosity (r = 0.88; 95% confidence interval [CI]: 0.64, 0.96; P < .001) and with age (r = 0.87; 95% CI: 0.62, 0.96; P < .001).
■ In vivo data suggest that SR may be more strongly associated with age than is bone water concentration (BWC) (n = 34; r = 0.64, 95% CI: 0.39, 0.81, P < .001 vs r = 0.52, 95% CI: 0.22, 0.73, P = .002) and may similarly be more strongly associated with volumetric cortical bone mineral density (n = 34; r = −0.67, 95% CI: −0.82, −0.43 vs r = −0.57, 95% CI: −0.76, −0.29; P < .001 for both).
Implications for Patient Care
■ The SR can potentially be a better biomarker for cortical bone porosity than BWC and provides quantitative insight into age-related structural degradation of cortical bone.
■ This biomarker can reliably be quantified with adequate reproducibility and may therefore be suited for evaluating the response to treatment in patients with osteoporosis.
Received November 17, 2013; revision requested January 6, 2014; revision received January 15; accepted February 11; final version accepted February 25.
This research was supported by the Institute for Translational Medicine and Therapeutics of the University of Pennsylvania and the National Center for Research Resources (grant UL1RR024134).
Current address: Endocrinology and Metabolism Research Institute, Tehran University of Medical Sciences, Tehran, Iran.
Current address: Samsung R&D Institute America, Richardson, Tex.
Current address: Center for Devices and Radiological Health, U.S. Food and Drug Administration, Silver Spring, Md.
Funding: This research was supported by the National Institutes of Health (grants R01-AR50068, F31-AG042289, and K25-AR060283) and the Howard Hughes Medical Institute International Student Research Fellowship.
Disclosures of Conflicts of Interest: C.L. No relevant conflicts of interest to disclose. A.C.S. No relevant conflicts of interest to disclose. H.S.R. No relevant conflicts of interest to disclose. Y.B. Financial activities related to the present article: none to disclose. Financial activities not related to the present article: is an employee of Samsung Electronics. Other relationships: none to disclose. C.S.R. No relevant conflicts of interest to disclose. W.S. No relevant conflicts of interest to disclose. S.C.B.L. No relevant conflicts of interest to disclose. F.W.W. No relevant conflicts of interest to disclose.
Abbreviations:
- BMD
- bone mineral density
- BWC
- bone water concentration
- CI
- confidence interval
- DB-SR
- dual-band SR
- DB-UTE
- dual-band saturation-prepared UTE
- IR-SR
- inversion-recovery SR
- IR-UTE
- adiabatic inversion-recovery UTE
- RF
- radiofrequency
- SR
- suppression ratio
- UTE
- ultrashort echo time
References
- 1.Seeman E, Delmas PD. Bone quality: the material and structural basis of bone strength and fragility. N Engl J Med 2006;354(21):2250–2261. [DOI] [PubMed] [Google Scholar]
- 2.Bousson V, Peyrin F, Bergot C, Hausard M, Sautet A, Laredo JD. Cortical bone in the human femoral neck: three-dimensional appearance and porosity using synchrotron radiation. J Bone Miner Res 2004;19(5):794–801. [DOI] [PubMed] [Google Scholar]
- 3.McCalden RW, McGeough JA, Barker MB, Court-Brown CM. Age-related changes in the tensile properties of cortical bone: the relative importance of changes in porosity, mineralization, and microstructure. J Bone Joint Surg Am 1993;75(8):1193–1205. [DOI] [PubMed] [Google Scholar]
- 4.Horch RA, Nyman JS, Gochberg DF, Dortch RD, Does MD. Characterization of 1H NMR signal in human cortical bone for magnetic resonance imaging. Magn Reson Med 2010;64(3):680–687. [DOI] [PMC free article] [PubMed] [Google Scholar]
- 5.Ong HH, Wright AC, Wehrli FW. Deuterium nuclear magnetic resonance unambiguously quantifies pore and collagen-bound water in cortical bone. J Bone Miner Res 2012;27(12):2573–2581. [DOI] [PMC free article] [PubMed] [Google Scholar]
- 6.Ni QW, Nyman JS, Wang XD, De Los Santos A, Nicolella DP. Assessment of water distribution changes in human cortical bone by nuclear magnetic resonance. Meas Sci Technol 2007;18(3):715–723. [Google Scholar]
- 7.Horch RA, Gochberg DF, Nyman JS, Does MD. Non-invasive predictors of human cortical bone mechanical properties: T(2)-discriminated H NMR compared with high resolution X-ray. PLoS ONE 2011;6(1):e16359. [DOI] [PMC free article] [PubMed] [Google Scholar]
- 8.Robson MD, Gatehouse PD, Bydder M, Bydder GM. Magnetic resonance: an introduction to ultrashort TE (UTE) imaging. J Comput Assist Tomogr 2003;27(6):825–846. [DOI] [PubMed] [Google Scholar]
- 9.Reichert IL, Robson MD, Gatehouse PD, et al. Magnetic resonance imaging of cortical bone with ultrashort TE pulse sequences. Magn Reson Imaging 2005;23(5):611–618. [DOI] [PubMed] [Google Scholar]
- 10.Fernández-Seara MA, Wehrli SL, Takahashi M, Wehrli FW. Water content measured by proton-deuteron exchange NMR predicts bone mineral density and mechanical properties. J Bone Miner Res 2004;19(2):289–296. [DOI] [PubMed] [Google Scholar]
- 11.Techawiboonwong A, Song HK, Wehrli FW. In vivo MRI of submillisecond T(2) species with two-dimensional and three-dimensional radial sequences and applications to the measurement of cortical bone water. NMR Biomed 2008;21(1):59–70. [DOI] [PubMed] [Google Scholar]
- 12.Techawiboonwong A, Song HK, Leonard MB, Wehrli FW. Cortical bone water: in vivo quantification with ultrashort echo-time MR imaging. Radiology 2008;248(3):824–833. [DOI] [PMC free article] [PubMed] [Google Scholar]
- 13.Biswas R, Bae W, Diaz E, et al. Ultrashort echo time (UTE) imaging with bi-component analysis: bound and free water evaluation of bovine cortical bone subject to sequential drying. Bone 2012;50(3):749–755. [DOI] [PMC free article] [PubMed] [Google Scholar]
- 14.Diaz E, Chung CB, Bae WC, et al. Ultrashort echo time spectroscopic imaging (UTESI): an efficient method for quantifying bound and free water. NMR Biomed 2012;25(1):161–168. [DOI] [PubMed] [Google Scholar]
- 15.Hopkins JA, Wehrli FW. Magnetic susceptibility measurement of insoluble solids by NMR: magnetic susceptibility of bone. Magn Reson Med 1997;37(4):494–500. [DOI] [PubMed] [Google Scholar]
- 16.Horch RA, Gochberg DF, Nyman JS, Does MD. Clinically compatible MRI strategies for discriminating bound and pore water in cortical bone. Magn Reson Med 2012;68(6):1774–1784. [DOI] [PMC free article] [PubMed] [Google Scholar]
- 17.Rad HS, Lam SC, Magland JF, et al. Quantifying cortical bone water in vivo by three-dimensional ultra-short echo-time MRI. NMR Biomed 2011;24(7):855–864. [DOI] [PMC free article] [PubMed] [Google Scholar]
- 18.Sussman MS, Pauly JM, Wright GA. Design of practical T2-selective RF excitation (TELEX) pulses. Magn Reson Med 1998;40(6):890–899. [DOI] [PubMed] [Google Scholar]
- 19.Li C, Magland JF, Rad HS, Song HK, Wehrli FW. Comparison of optimized soft-tissue suppression schemes for ultrashort echo time MRI. Magn Reson Med 2012;68(3):680–689. [DOI] [PMC free article] [PubMed] [Google Scholar]
- 20.Wang X, Ni Q. Determination of cortical bone porosity and pore size distribution using a low field pulsed NMR approach. J Orthop Res 2003;21(2):312–319. [DOI] [PubMed] [Google Scholar]
- 21.Borah B, Dufresne T, Nurre J, et al. Risedronate reduces intracortical porosity in women with osteoporosis. J Bone Miner Res 2010;25(1):41–47. [DOI] [PubMed] [Google Scholar]
- 22.Bousson V, Meunier A, Bergot C, et al. Distribution of intracortical porosity in human midfemoral cortex by age and gender. J Bone Miner Res 2001;16(7):1308–1317. [DOI] [PubMed] [Google Scholar]
- 23.Bell KL, Loveridge N, Jordan GR, Power J, Constant CR, Reeve J. A novel mechanism for induction of increased cortical porosity in cases of intracapsular hip fracture. Bone 2000;27(2):297–304. [DOI] [PubMed] [Google Scholar]
- 24.Bae WC, Chen PC, Chung CB, Masuda K, D’Lima D, Du J. Quantitative ultrashort echo time (UTE) MRI of human cortical bone: correlation with porosity and biomechanical properties. J Bone Miner Res 2012;27(4):848–857. [DOI] [PMC free article] [PubMed] [Google Scholar]
- 25.Ni Q, King J, Wang X. The characterization of human compact bone structure changes by low-field nuclear magnetic resonance. Meas Sci Technol 2004;15(1):58–66. [Google Scholar]
- 26.Manhard MK, Horch RA, Harkins KD, Gochberg DF, Nyman JS, Does MD. Validation of quantitative bound- and pore-water imaging in cortical bone. Magn Reson Med 2013. [DOI] [PMC free article] [PubMed] [Google Scholar]
- 27.Martin RB. Determinants of the mechanical properties of bones. J Biomech 1991;24(Suppl 1):79–88. [DOI] [PubMed] [Google Scholar]
- 28.Nyman JS, Ni Q, Nicolella DP, Wang X. Measurements of mobile and bound water by nuclear magnetic resonance correlate with mechanical properties of bone. Bone 2008;42(1):193–199. [DOI] [PMC free article] [PubMed] [Google Scholar]
- 29.Roschger P, Rinnerthaler S, Yates J, Rodan GA, Fratzl P, Klaushofer K. Alendronate increases degree and uniformity of mineralization in cancellous bone and decreases the porosity in cortical bone of osteoporotic women. Bone 2001;29(2):185–191. [DOI] [PubMed] [Google Scholar]


