

Abstract
To respond appropriately to objects, we must process visual inputs rapidly and assign them meaning. This involves highly dynamic, interactive neural processes through which information accumulates and cognitive operations are resolved across multiple time scales. However, there is currently no model of object recognition which provides an integrated account of how visual and semantic information emerge over time; therefore, it remains unknown how and when semantic representations are evoked from visual inputs. Here, we test whether a model of individual objects—based on combining the HMax computational model of vision with semantic-feature information—can account for and predict time-varying neural activity recorded with magnetoencephalography. We show that combining HMax and semantic properties provides a better account of neural object representations compared with the HMax alone, both through model fit and classification performance. Our results show that modeling and classifying individual objects is significantly improved by adding semantic-feature information beyond ∼200 ms. These results provide important insights into the functional properties of visual processing across time.
Keywords: Classification, HMax, model fit, object recognition, semantics
Introduction
Object representations in the ventral stream undergo a transition in the first half-second, becoming increasingly fine-grained and specific (Sugase et al. 1999; Hochstein and Ahissar 2002; Hegdé 2008; Mace et al. 2009; Clarke et al. 2013). This requires highly dynamic and interactive brain mechanisms through which visual information accumulates and cognitive operations are rapidly resolved across multiple time scales, with a continuing interplay between visual and cognitive factors (Humphreys et al. 1988; Humphreys and Forde 2001). However, it is currently unclear when different forms of visual and semantic information emerge across time, and when visual signals contribute to semantic representations. Early models claimed that basic level (e.g., dog) information about objects is available prior to (superordinate) category information (Rosch et al. 1976; Jolicoeur et al. 1984); however, recent evidence has challenged this presupposition in favor of a coarse-to-fine model (Fei-Fei et al. 2007; Mace et al. 2009; Loschky and Larson 2010; Fabre-Thorpe 2011; Praß et al. 2013). This research suggests that category information is present within the first-pass of neural propagations along the ventral stream (Kirchner and Thorpe 2006; Liu et al. 2009; Chan, Baker et al. 2011), while object-specific, basic-level, semantic information emerges after 150–200 ms supported by recurrent interactions within the stream (Martinovic et al. 2008; Schendan and Maher 2009; Clarke et al. 2011, 2013). Thus, information sufficient for categorical (e.g., “tool”) and object-specific (e.g., “hammer”) dissociations seem to be differentially represented over time. In the current study, we ask what kind of model of object representations can account for such categorical and object-specific semantic effects, by modeling both visual and semantic properties of individual objects, and testing the efficacy of the model against time-sensitive neural activity using magnetoencephalography (MEG).
Several biologically plausible computational models have been developed based on hierarchical stages of the ventral processing stream. The HMax model is a biologically inspired feedforward model of visual processing with different levels of the model being linked to different stages in the ventral visual pathway from V1 to posterior IT (Riesenhuber and Poggio 1999), and matches human behavioral performance in a rapid visual categorization task (Serre et al. 2007). However, the extent to which the model can account for human neural object representations and whether object representations are better modeled by adding semantic information are both unknown.
While there are well-developed computational models of human vision, models of object semantics—specifically those able to capture both category and object-specific conceptual information—are less well characterized at the neural level. Feature-based accounts of semantic representations can model both types of information (Farah and McClelland 1991; Humphreys et al. 1995; Garrard et al. 2001; Tyler and Moss 2001; Cree and McRae 2003; Rogers and McClelland 2004; Vigliocco et al. 2004; Taylor et al. 2011) but have only been explicitly tested against neural activity in a few cases (e.g., Clarke et al. 2013; Tyler et al. 2013). The semantic features from property norming studies (e.g., has ears, made of metal; McRae et al. 2005; Devereux et al. 2013) provide a means of estimating semantic content, capturing categorical structure as similar concepts have similar features, while also differentiating between concepts as each concept has a unique set of features. Such semantic content can be used as a proxy for the underlying neural representation of object meaning.
Here, we test whether a visuo-semantic model—based on combining the HMax computational model of object recognition and semantic-feature information—can capture the time-varying neural activity of individual objects. Multiple linear regressions are used to 1) ask how well our model fits MEG signals over time, and 2) test whether the mapping between the MEG signals and visual and semantic measures can predict MEG signals for novel items using a leave-two-out cross-validation approach (Fig. 1; Mitchell et al. 2008). Furthermore, we evaluate the performance of this model compared with models based only on HMax. The predictive accuracy of different combinations of model parameters was used to reveal how specific forms of visual and semantic information are represented across time and source localization was used to reveal the neural regions primarily supporting these types of information.
Figure 1.
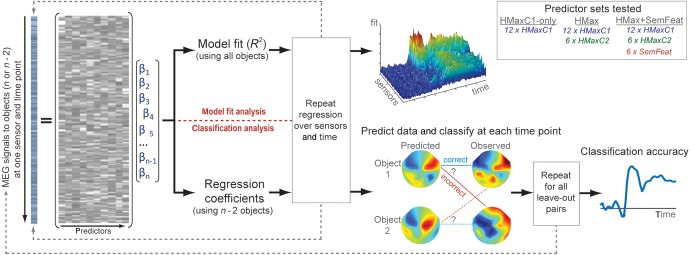
Schematic of data analysis. Multiple linear regression was performed using MEG signals from each sensor and time point independently for the HMaxC1-only, HMax, and HMax + SemFeat sets of predictors. For the model fit analyses (top path), model fit (R2) was calculated for each predictor set for statistic comparison. For the classification analysis (bottom path), the regression coefficients from the multiple linear regression (based on all but 2 objects) were used to predict the MEG signals to the 2 left-out objects at each time point. The predicted data were constructed by applying the learned regression coefficients to the known visual and semantic parameters for the 2 left-out objects. The predicted patterns were classified as correct if they matched the observed patterns. The process is repeated for all possible leave-out object pairs, and accuracy is calculated as the proportion of pairs correctly classified at each time point. The classification accuracy time course for each predictor set are then compared.
Materials and Methods
Participants
Fourteen participants (9 females, mean age 23.2 years) took part in the study. All gave informed consent and the study was approved by the Cambridge Psychology Research Ethics Committee. All were right-handed and had normal, or corrected to normal vision.
Procedure and Stimuli
Participants performed a basic-level naming task (e.g., “tiger”) with 302 objects from 11 categories (animals, buildings, clothing, food, furniture, household items, musical instruments, plant life, tools, vehicles, weapons) that represented concepts from an anglicized version of a large property generation study (McRae et al. 2005; Taylor et al. 2012). All objects were presented in color as single objects on a white background. Each trial began with a black fixation cross on a white background for 500 ms before the object was shown for 500 ms, and followed by a blank screen lasting between 2400 and 2700 ms. The order of stimuli was pseudo-randomized such that consecutive stimuli were not phonologically related (i.e., shared an initial phoneme) and no more than 4 living or nonliving items could occur in a row. The stimuli were presented in 3 blocks. Stimuli were presented using Eprime (version 2; Psychology Software Tools, Pittsburgh, PA, USA) and object naming accuracy was recorded by the experimenter during data acquisition.
Stimulus Measures
For each object, we obtained measures capturing the low and high-level visual attributes of the picture in addition to feature-based semantic measures.
The low- and high-level visual information about objects was derived from the HMax computational model of vision downloaded from http://cbcl.mit.edu/software-datasets/standardmodel. Different levels of the model have been linked to different stages in the ventral visual pathway from V1 to posterior IT. Here, we extract responses from 2 levels of the HMax model to capture low and high-level visual object information: namely, the C1 responses relating to early visual cortex (V1/V2), and C2 responses relating to V4/posterior IT (Riesenhuber and Poggio 1999; Serre et al. 2007).
The input to the HMax model were gray-scale versions of the images seen during the MEG recording that were resized to 92 × 92 pixels. Responses from different layers of the HMax model, the C1 and C2 responses, were extracted using the settings described by Serre et al. (2005) and precomputed S2 features from natural image fragments (downloaded http://cbcl.mit.edu/software-datasets/standardmodel). For each object, the responses at the 2 layers were extracted separately, and C1 and C2 matrices were constructed containing responses for all 302 objects (C1 matrix dimensions 302 × 28608, C2 matrix dimensions 302 × 2000). Principal components analyses were then performed on each matrix (using the MATLAB function princomp). The number of components used in the final model was determined based on maximum model classification performance for data in the time window 100–300 ms using an independent group of participants performing the same task with similar objects (see Clarke et al. 2013). This procedure identified that 12 HMaxC1 components and 6 HMaxC2 components resulted in maximum classification accuracy and so these values were used in the final set of models (range tested: 1–12, 30, and 50 components).
The semantic content of objects was modeled using semantic-feature norms (McRae et al. 2005; Taylor et al. 2012). The feature norms contain lists of features associated with a large range of objects (e.g., “has 4 legs,” “has stripes,” and “lives in Africa” are features of a “zebra”). As similar concepts have similar features, feature-based models capture categorical structure by virtue of feature overlap, while also capturing the properties of a concept that differentiates it from other concepts of the same semantic category, because each concept is composed of a unique set of features. Based on the feature norms, each object can be represented by a binary vector indicating whether each feature is associated with the object or not. The 302 objects used in this study were associated with 1510 features in total. Modeling semantic content was achieved using a binary concept-feature matrix derived from the property norms. The matrix had dimensions of 302 concepts by 1510 features, with cell values of 1 indicating which features are true for concepts and 0 in all other cells. A principal components analysis was used to reduce the dimensionality of this matrix, and the first 6 semantic-feature components were selected based on maximum model classification performance for the time window 100–300 ms using an independent group of participants.
MEG/MRI Recording
Continuous MEG data were recorded using a whole-head 306 channel (102 magnetometers, 204 planar gradiometers) Vector-view system (Elekta Neuromag, Helsinki, Finland) located at the MRC Cognition and Brain Sciences Unit, Cambridge, UK. Participants were in a seated position. Eye movements and blinks were monitored with electrooculogram (EOG) electrodes placed around the eyes, and 5 head-position indicator (HPI) coils were used to record the head position (every 200 ms) within the MEG helmet. The participants’ head shape was digitally recorded using a 3D digitizer (Fastrak Polhemus, Inc., Colchester, VA, USA), along with the positions of the EOG electrodes, HPI coils, and fiducial points (nasion, left and right periaricular). MEG signals were recorded at a sampling rate of 1000 Hz, with a band-pass filter from 0.03 to 125 Hz. To facilitate source reconstruction, 1-mm3 T1-weighted MPRAGE scans were acquired during a separate session with a Siemens 3 T Tim Trio scanner (Siemens Medical Solutions, Camberley, UK) located at the MRC Cognition and Brain Sciences Unit, Cambridge, UK.
MEG Preprocessing
Initial processing of the raw data used MaxFilter version 2.0 (Elektra-Neuromag). First, static bad channels were detected that were subsequently reconstructed by interpolating neighboring channels, as were bad channels containing long periods of high amplitude or noisy signals. The temporal extension of the signal-space separation technique was applied to the data every 4 s to segregate the signals originating from within the participants’ head from those generated by external sources of noise, along with head movement compensation and transformation of head position to a common head position. An artifact removal procedure was applied to the continuous data based on independent components analysis (ICA), implemented using EEGLab (Delorme and Makeig 2004). Components of the data that showed a correlation greater than a Pearson's r of 0.4 with either EOG channel were removed from the data. ICA was applied to the magnetometers and gradiometers separately.
The resulting MEG data were low-pass filtered at 40 Hz in forward and reverse directions using a fifth-order Butterworth digital filter, epoched from −200 to 600 ms, and downsampled to 100 Hz using SPM8 (Wellcome Institute of Imaging Neuroscience, London, UK). Items that were incorrectly named were excluded, where an incorrect name was defined as a response that did not match the correct concept. We did not explicitly account for potential muscle artifacts produced by the overt naming task as this should not affect our data considering the duration of the epoch examined and frequency range included in relation to the typical onset of muscle artifacts and their frequency distribution (mean naming latency: 991 ms, standard deviation over participants: 109 ms). Furthermore, any such artifacts are unlikely to be confounded with visual or semantic processing in such a way to affect classification accuracy or model fit.
Model fit
To determine how much variance in the MEG signals was captured by each of the 3 models, we calculated each model's R2 using multiple linear regression (no regularization) at each sensor and for each time point independently. We performed an item-wise analysis where the MEG activity to each object was averaged over participants, which also acted to increase signal-to-noise ratio. The 3 models tested contained different numbers of predictors—HMaxC1 predictors alone (n = 12), HMaxC1 and HMaxC2 predictors (n = 18), and HMax and semantic-feature predictors (n = 24). Significant changes in model fit were calculated by the F-ratio of the change in R2 between models with different sets of predictors, and corrected for multiple comparisons over sensors and time using a false discovery rate (FDR) with an α of 0.05.
Concept Classification
A leave-two-out cross validation approach was used to assess each model's ability to predict and classify individual concepts using multiple linear regressions (Fig. 1; Mitchell et al. 2008) where the predictors of the regression model were composed of different combinations of C1, C2, and semantic measures. The data were split into a training set and the 2 left-out concepts. Multiple linear regression was performed at each sensor and each time point independently, resulting in a spatiotemporal beta map of regression coefficients (weights) where the betas capture the relationship between the observed MEG signals and a single predictor. The MEG signals for the 2 left-out concepts were then constructed through a weighted sum of the beta maps, where the weights are derived from the known C1, C2, and semantic values for those 2 concepts. The 2 predicted MEG patterns are then compared with the actual recorded signals, where correct classification is defined as higher Pearson's correlation between the correct predicted-observed pairs than the incorrect predicted-observed pairings (Mitchell et al. 2008). Classification accuracy is determined for each time point between −200 and 600 ms, using a 30-ms sliding time window, creating a concept classification time course. The process was then repeated across all possible leave-out pairs (45 451) and for each model.
Classification accuracy was computed for all 3 models (HMaxC1, HMaxC1 and HMaxC2, and HMax and semantic features). As there was some degree of correlation between the predictors (Supplementary Fig. 1), an additional analysis was conducted showing unique effects of semantic features. This was achieved by performing multiple linear regression on the MEG data using the HMax model parameters and obtaining the residuals. The classification analysis was then performed using the semantic-feature predictors and the residuals to show unique effects of semantic features that cannot be accounted for by the HMax model.
As with model fit, concept classification was calculated with data where the MEG activity for an object was averaged across participants (except for a complementary analysis where classification was run for each participant independently; see Results). Classification accuracy was calculated for each leave-out pair, and an accuracy measure was calculated for each individual object as the mean accuracy over all leave-out pairs that contained the object. Overall classification accuracy for each model, as well as within- and between-category accuracies, was tested against chance (50%) at each time point using the Wilcoxon signed-rank test, which was also used to statistically compare classification accuracy between pairs of models. Where classification accuracy was calculated for individual participants, two-tailed paired-sampled t-tests were used in place of Wilcoxon signed-rank test. All tests were corrected for multiple comparisons across time using FDR with an α of 0.05.
To compare the onset of significant between- and within-category classification accuracies, we created 10 000 bootstrapped samples by sampling with replacement. For classifications based on the group averaged data, the object pairs were sampled with replacement, and for classification statistics based on individual participant classifications, participants were sampled with replacement. For each bootstrap sample, we calculated the classification accuracy and determined the onset of above chance classification accuracy for between- and within-category classification (defined as the first time after 50 ms that was significantly above chance). This allowed us to calculate bootstrap estimates of the difference in onsets for between- and within-category classification accuracy, which were used to calculate the probability that between or within-category classification was significantly earlier than the other.
Source Localization: Visualizing Regression Coefficients
To visualize the cortical representation of the regression weights, the minimum norm source localization technique was implemented in SPM8 using the IID option. Instead of using the regression weights derived from MEG data averaged over participants (those used for model fit and classification), for source localization, we calculated the regression weights for each participant separately, that were then used as the inputs to the source localization procedure. These individual participant localizations were used to provide more accurate source reconstructions than those that localizing the grand averaged data would have produced. Since the regression weights are obtained using linear equations with standardized predictors, they can be used for source localization (Hauk et al. 2006). MRI images were segmented and spatially normalized to an MNI template brain in Talairach space. A template cortical mesh with 8196 vertices was inverse normalized to the individual's specific MRI space. MEG sensor locations were coregistered to MRI space using the fiducial and digitized head-points obtained during acquisition. The forward model was created using the single shell option to calculate the lead-fields for the sources oriented normal to the cortical surface. The data from both magnetometers and gradiometers were inverted together (Henson et al. 2009) to estimate activity at each cortical source using a minimum norm solution, where the inversion was performed simultaneously for all the regression weights for the epoch −200 to 600 ms. No depth weighting was applied. The estimated cortical activity was averaged across the specified time windows (70–160 and 200–400 ms—see Results) before generating an image in MNI space (absolute regression coefficient values), which was smoothed with a 6-mm FWHM Gaussian smoothing kernel. This produces a cortical representation of the regression weights for each predictor, which were then averaged across participants, and displayed on an inflated cortex using Caret (http://www.nitrc.org/projects/caret/). The color scale used was defined by the maximum absolute regression coefficient over all time windows and conditions with no thresholds applied.
Source Localization: Regional Model fit
To obtain regional measures of model fit, and test for changes in model fit when adding predictors, required estimating regional responses for single trials that could be entered into multiple linear regression models. This was achieved using a minimum norm source localization of the individual participant preprocessed MEG signals using the same parameters described above. After inversion, the time course for each single trial was extracted from 6 regions along the ventral stream before the trial data were averaged over participants. The locations of the regions were defined as the peaks from the localized regression coefficients after averaging over time windows and all predictors, and had a 10 mm radius. The MNI coordinates for the peak locations were in the occipital (left: −10, −94, −16, right: 22, −92, −14), inferior temporal (left: −50, −52, −20, right: 52, −56, −16) and anterior temporal lobes (left: −30, −6, −40, right: 30, −4, −42). Each model's R2 was calculated for 2 time windows (as above) and 6 regions separately using multiple linear regression between the mean source activity in the time window and the 3 models (HMaxC1, HMaxC1 and HMaxC2, and HMax and semantic features). Significant changes in model fit were calculated by the F-ratio of the change in R2 between models with different sets of predictors.
Results
Our initial analysis aimed to determine whether semantic information plays a significant role in object representations over and above that played by visual information. We tested this by evaluating the performance of a combined visuo-semantic model compared with a computational model of visual object recognition in accounting for neural representations over time. The evaluation was performed both in terms of overall measures of model fit, and each model's accuracy at predicting time-varying neural representations for individual objects. Following this, we tested if our semantic model can dissociate categorical and object-specific semantic processing.
Computational Visual and Semantic Models
We tested 3 principal models with varying model parameters. The first model, “HMaxC1-only,” reflects a model of early visual cortical responses and is based on the C1 layer of the HMax computational model of object recognition. The second model, “HMax,” included both the C1 and C2 layers of the HMax model, and captures both low- and high-level visual object representations. Finally, HMax + SemFeat, represents a more complex visuo-semantic model and included the HMax parameters along with semantic-feature information. The semantic information captures category information as similar concepts will have similar semantic features, while also capturing object-specific semantic information as each concept is composed of a unique set of features. Therefore, we capture both category and object-specific semantic information in the same model.
Object Representations Require Semantic Information: Model fit & Concept Classification
We first determined how much variance in the MEG data was captured by each of the 3 models by calculating each model's R2 at each sensor and for each time point for the multiple linear regression models. This approach allows us to test how each model relates to the data across time, and importantly can show time-specific improvements in model fit.
The maximum R2 for all models occurred between 50 and 150 ms, while models including the C2 responses and semantic-feature information showed an increased fit following this period (Fig. 2a). The HMax model (combining C1 and C2 layers) showed a significant improvement in model fit compared with the HMaxC1-only model from 100 to 150 ms in posterior sensors, followed by fewer effects primarily between 290 and 450 ms (all qs < 0.05, FDR corrected; Fig. 2b). Importantly, the model including semantic-feature information showed a significant and sustained increase in R2 compared with the HMax model from 200 to 580 ms with a focus over left anterior sensors (all qs < 0.05, FDR corrected; Fig. 2c). As all models include the C1 responses, our results suggest that object representations are initially well modelled by low-level image properties before size and position invariant information about object shape (captured in the C2 responses) begins to be processed from 100 ms. Finally, adding semantic information into the model significantly increases model fit post 200 ms showing that object-specific semantic information is processed after this time. These findings show that a model combining low- and high-level visual properties with semantic information provides a better model of the underlying neural representations than one based only on computational models of vision.
Figure 2.

Regression model fits. (a) Model fits across MEG sensors and time showing R2 values for the HMaxC1-only, HMax, and HMax + SemFeat models. (b) F-Ratio of the change in R2 from the HMaxC1-only to the HMax model, and (c) from the HMax model to the HMax + SemFeat model. Plots show the F-ratio across sensors and time with a significant change in F-ratio shown by the gray plane (P < 0.05 FDR corrected over time and sensors). Sensor topographies are shown for peak times for both magnetometers and the mean F-ratio over the planar gradiometer pairs.
A further test of the efficacy of each model is provided by the accuracy with which they can predict novel concepts. Prediction accuracy was evaluated at each time point using a leave-two-out cross-validation approach. All 3 models could predict concepts significantly above chance (50%) from 50 ms lasting until 600 ms (all qs < 0.05 FDR, Wilcoxon signed-rank tests), with an initial maximum in classification accuracy between 70 and 160 ms and a maximum 85% accuracy (HMaxC1-only: 83%, 110 ms; HMax: 85%, 120 ms; HMax + SemFeat: 84%, 110 ms; Fig. 3). All models showed a second sustained increase in classification performance between 200 and 400 ms, during which the model including semantic information showed an increase in performance compared with both HMax models (maximum accuracy: HMaxC1-only: 73%, 290 ms; HMax: 74%, 290 ms; HMax + SemFeat: 77%, 290 ms). A statistical comparison of classification performance over time showed the model including semantic information was significantly better able to predict concepts than both the HMaxC1-only and HMax models between 190 and 600 ms (all qs < 0.05 FDR, Wilcoxon signed-rank tests). To rule out the possibility that the increased classification performance for the HMax + SemFeat model was driven by having a greater number of predictors in the model (number of predictors: HMaxC1-only 12, HMax 18, HMax + SemFeat 24), we ran an additional control analysis where all models had an equal number of predictors [i.e., 12 extra predictors were added to the HMaxC1-only model, and 6 extra were added to the HMax model (3 from C1 and 3 from C2)]. The results replicated those of the original analyses (Supplementary Fig. 2) and further support the claim that the added semantic information represents a qualitative, rather than quantitative, improvement to modeling neural activity. Together with the model fit results, our findings suggest that object-specific semantic information is present after approximately 200 ms, and that a model including semantic-feature information provided the best description of the underlying neural representations.
Figure 3.
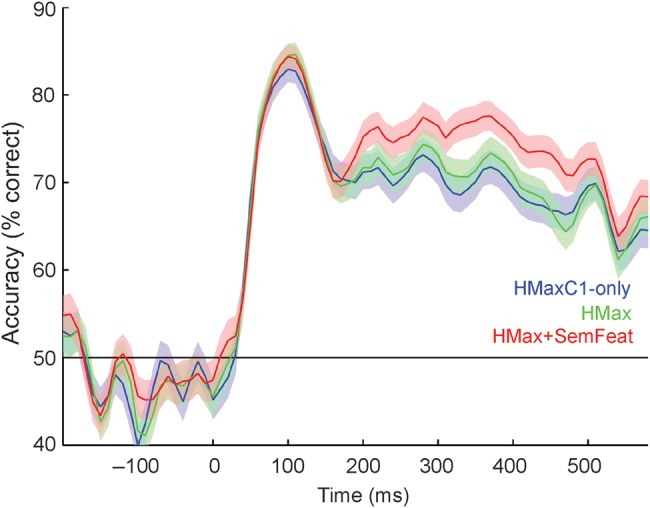
Concept classification accuracy over time for the HMaxC1-only, HMax, and HMax + SemFeat models. Shaded areas show the standard errors of the mean.
Categorical versus Object-specific Semantic Representations
The analysis up to this point has concentrated on modeling the representations of individual objects, rather than categorical representations. To test the models’ ability to account for categorical and object-specific semantic representations, we can break down the predictive accuracy of the semantic-feature model when the 2 left-out items are from different categories (between-category, e.g., when one item is an animal and the other a tool) or the same category (within-category, e.g., when both items are animals, or both items are tools). Partitioning classification accuracies in this manner gives us information about whether the semantic-feature model can successfully perform both categorical (between-category) and fine-grained (within-category) distinctions between objects.
Using the full HMax + SemFeat model, both between- and within-category classifications were significantly better than chance after 50 ms (all qs < 0.05 FDR, Wilcoxon signed-rank test). Comparing the latency of the onsets for between- and within-category classification using bootstrapping showed no significant difference in latency (P = 0.96). While early classification accuracies were similar overall, after 120 ms accuracy was significantly higher for between-category distinctions (maximum 79%) than within-category distinctions (72%) (all qs < 0.05 FDR, Wilcoxon signed-rank tests; Fig. 4a). As both within- and between-category predictions were successful from 50 ms, the full model (HMax + SemFeat) does not dissociate the timing of categorical and object-specific semantic distinctions. This may be because both types of information are rapidly accessed, or due to the HMax parameters supporting a high degree of classification in early time periods; showing that fine-grained low- and high-level visual information is present and able to dissociate any 2 images (regardless of category). If the latter case is true, this may mask any differences between categorical and fine-grained classification accuracy that is only driven by semantic information. Therefore, we evaluated the HMax and SemFeat components of the model independently. As there is some degree of correlation between the predictors for the HMax and SemFeat models (Supplementary Fig. 1), the classification analysis was performed based on the HMax model first, before being performed using the SemFeat model after removing any variance in the MEG signals that correlated with the HMax model. This was achieved by first running multiple linear regressions against the MEG signals with the HMax model predictors to obtain the residuals, which were then used in the classification analysis based on the SemFeat model predictors. This allows us to determine if the SemFeat model can still classify between- and within-category objects, even when all the variance that can be accounted for by the HMax model has been removed.
Figure 4.
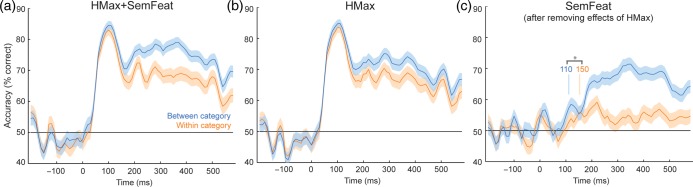
Between- and within-category classification accuracy over time for (a) the HMax + SemFeat model, (b) HMax model, and (c) the SemFeat model after removing effects of the HMax model from the MEG signals. Vertical lines in (c) show the onsets where between-category effects are significantly earlier than within-category effects.
Using the HMax model, both within and between-category distinctions were significant from 50 ms (all qs < 0.05 FDR, Wilcoxon signed-rank test) and the onsets for between- and within-category effects were not significantly different (P = 0.98). Again classification accuracies were similar for the initial peak, before accuracy was significantly higher for between-category distinctions than within-category distinctions from 150 ms to the end of the analysis window (all qs < 0.05 FDR, Wilcoxon signed-rank tests; Fig. 4b). For the SemFeat model, between-category classification was significantly better than chance after 110 ms with an initial maximum at 130 ms (q < 0.05, Wilcoxon signed-rank test, FDR corrected; maximum 59%; Fig. 4c) while within-category classification only became significant at later time points from 150 to 250 ms, reaching a maximum at 230 ms (all qs < 0.05 FDR, Wilcoxon signed-rank test; maximum 59%). Furthermore, within-category classifications were significantly better than chance between 330 and 360 ms and again from 400 to 500 ms. Bootstrapping revealed that the onset of successful between-category classification was reliably earlier than successful within-category classification (P = 0.027). Direct comparisons of between- and within-category accuracies showed that between-category accuracy was significantly higher than within-category accuracy between 120 and 140 ms, and from 200 ms to the end of the analysis window (all qs < 0.05 FDR, Wilcoxon signed-rank tests). These analyses indicate that the semantic information reflected in the MEG signals is able to dissociate between members of different categories significantly earlier than dissociations can occur within a category.
Concept Classification: Single-participant Models
The above classification analyses assessed the ability to construct and classify concepts using a model trained and tested on MEG responses averaged over participants. Here we ask whether these effects are conserved when training and testing the models on single-trial data from individual participants. To test between the 3 models, classification accuracy was tested in 2 time windows for each participant - from 70 to 160 ms where we saw strong effects of the visual model, and from 200 to 400 ms where the semantic-feature information led to a significantly better model of the data. Within these 2 time windows, we predicted/classified the MEG signals for the left-out objects based on the spatiotemporal response patterns across all sensors and all time points within the time window. In both time windows, all participants performed better than chance, ranging between 54 and 83% (Fig. 5a,b). In the first time window, the HMaxC1 model had the highest overall accuracy (HMaxC1 mean: 72.1%, HMax mean: 71.7%, HMaxSemfeat mean: 70.2%) and was significantly higher than the HMaxSemfeat model (t(13) = 2.76, P = 0.016). There were no significant differences between the HMax model and either the HMaxC1 (t(13) = 0.39, P = 0.70) or HMaxSemfeat models (t(13) = 1.35, P = 0.20). In the 200–400 ms time window, the HMaxSemfeat model had the highest overall accuracy (HMaxC1 mean: 63.2%, HMax mean: 63.0%, HMaxSemfeat mean: 64.9%) and was significantly higher than both the HMax (t(13) = 8.76, P < 0.0001) and HMaxC1 models (t(13) = 3.81, P = 0.002). There was no significant difference between the HMax and HMaxC1 models (t(13) = 0.52, P = 0.66).
Figure 5.
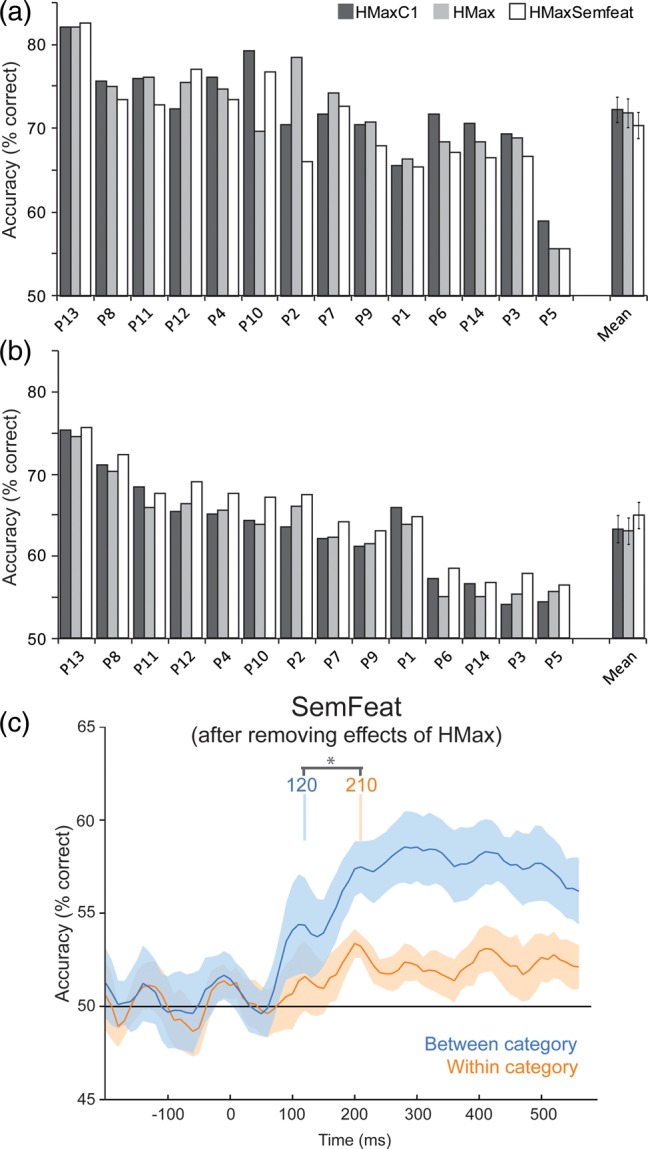
Concept classification accuracy based on single-participant MEG data. Accuracy for individual participants for the 3 models for the time windows (a) 70–160 ms and (b) 200–400 ms. Participants ordered by highest accuracies over both time windows. (c) Average between- and within-category classification accuracy over time for the SemFeat model based on single-participant classification time courses. Vertical lines in (c) show the onsets of effects, with between-category effects being significantly earlier than within-category effects.
Between- and within-category classification time courses were also calculated for each participant based on the SemFeat model (after removing effects of the HMax model). This revealed that between-category effects are significantly better than chance from 120 to 600 ms (all qs < 0.05, FDR), and that within-category classifications are significantly better than chance from 210 to 350 ms, and from 410 to 460 ms (all qs < 0.05, FDR). Furthermore, between-category classifications are significantly better than within-category classifications between 120 and 140 ms, and from 180 to 600 ms (all qs < 0.05, FDR). Finally, bootstrapping showed the onset of significant between-category classification was prior to the onset of within-category classifications (P = 0.013). These results show that the pattern of results described above is also apparent at the individual participant level, and that our effects cannot be explained by a minority of the participants driving the effects in the averaged MEG data.
Source Localisation of Regression Weights and Regional Model fit
The analyses so far highlight that early object representations—principally between 70 and 160 ms—can be modeled with the low- and higher level visual object properties of the HMax model. Furthermore, within this timeframe, we also find evidence for the processing of semantic information that can dissociate between members of different object categories prior to more specific conceptual representations largely between 150–200 and 400 ms. To visualize the neural regions that are most important to object-specific classification, we mapped the regression weights of each model predictor to the cortical surface. To achieve this, source localization was performed for each predictor's regression weights that were calculated for the MEG sensors (Hauk et al. 2006). The absolute cortical regression weights for each type of predictor were averaged to create single maps for HMaxC1, HMaxC2, and semantic information.
We found the strongest weights associated with HMaxC1 responses from 70 to 160 ms in early visual cortex, highlighting this variable's relationship to low-level visual processing of objects (Fig. 6). The HMaxC2 response weights were overall weaker but with peaks in the posterior inferior temporal (IT) cortex, while the semantic-feature weights had maximal regression weights in posterior IT and the anterior temporal lobe. During the later time window from 200 to 400 ms, the strongest regression weights for semantic features were focused in bilateral IT and the anterior temporal lobes. Furthermore, regression weights for the HMaxC2 predictors were maximal in the right IT while HMaxC1 weights were overall reduced compared with the early time window.
Figure 6.
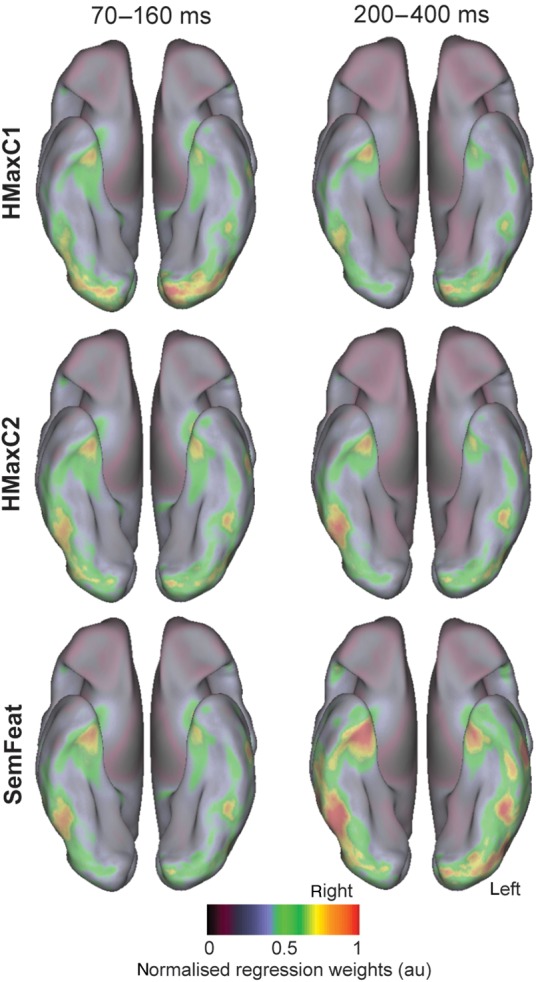
Cortical distribution of regression weights for each type of predictor along the ventral stream.
Finally, we tested to what extent the 3 different models could account for regional responses along the ventral stream and at which times and locations adding different predictors resulted in an improved model fit (Fig. 7). We found that in the time window 70–160 ms, adding the HMaxC2 responses to HMaxC1 model led to a significantly better fit to the data in bilateral occipital (left: F = 3.03, P = 0.0068, right: F = 5.41, P = 0. 0.00003) and right IT (F = 2.15, P = 0.048). During the later time window, 200–400 ms, adding semantic-feature information into the model led to a significant improvement in model fit in the bilateral anterior temporal lobe (left: F = 3.12, P = 0.0057, right: F = 2.18, P = 0.045), left IT (F = 2.31, P = 0.034) and the right occipital lobe (F = 5.25, P = 0.000038). Together, the localization of the regression weights and regional model fit analysis indicate that HMaxC1 effects are primarily driven by early visual regions while HMaxC2 responses are additionally reflected in the posterior occipital lobe and IT. Finally, the object-specific semantic information captured with the SemFeat predictors was encoded in IT and the anterior temporal lobes.
Figure 7.

Regional model fits for peak locations along the ventral stream in the left and right hemisphere for the HMaxC1-only (dark gray), HMax (light gray), and HMax + SemFeat (white) models. Asterisks show significant improvements in model fit between models. MNI coordinates shown for each region.
Discussion
The current study aimed to characterize when different forms of visual and semantic information emerge over time. To address these issues, we tested the efficacy of a visuo-semantic model based on a computational model of vision and semantic-feature statistics by evaluating its ability to model and predict time-varying neural activity patterns associated with individual objects.
This study provides clear evidence that semantic information plays a key role during the temporal formation of object representations. The model including semantic-feature information outperformed the HMax computational model of vision in terms of classification accuracy and in the model fit to the data after 200 ms. This shows that a model of meaningful object representations based on combinations of visual and semantic-feature-based measures provides a better account of underlying object representations than one based on computational models of vision alone. Furthermore, this suggests that models based just on visual information do not sufficiently model meaningful object representations beyond the first ∼150 ms. This may be expected given the HMax model is only claimed to capture immediate vision based on feedforward processing alone (Serre et al. 2005, 2007). The HMax model does not reflect any form of more abstract object information not directly related to the visual input, one class of which is semantic information that is required to fully model object representations. This is not to suggest that the feature representations used in our semantic model (e.g., “has legs,” “made of metal”) are literally coded in neural populations, but that the statistical regularities observed across features share some properties with the regularities observed in neural semantic object representations.
The timing of these semantic-feature effects, post 200 ms, provides evidence that the concept-level individuation of specific objects is not accomplished through an initial feedforward propagation of signals thought to be completed within 100–150 ms, suggesting it relies on more dynamic recurrent processing. This interpretation is supported by other MEG/EEG studies showing that fine-grained object-specific semantic information emerges beyond 150–200 ms, after which long-range recurrent processes are engaged (involving prefrontal cortex, anterior temporal, and posterior temporal regions) that function to disambiguate the object, enabling semantic individuation and the formation of concept-specific representations (Bar et al. 2006; Schendan and Maher 2009; Clarke et al. 2011, 2013; Scholl et al. 2014).
The effects driven by semantic-feature information were significant in the anterior temporal lobes, posterior IT, and the right occipital lobe. Aspects of the anterior temporal lobe are considered key to representing conceptual representations (Tyler et al. 2004, 2013; Moss et al. 2005; Patterson et al. 2007; Lambon Ralph et al. 2010; Mion et al. 2010; Clarke and Tyler 2014), which is also consistent with intracranial recording data from the human medial temporal lobes showing modality invariant responses to individual concepts from around 300 ms (Quian Quiroga et al. 2007, 2009). However, we believe it is unlikely that individual conceptual representations only rely on the anterior temporal lobes, as shown by the localization of the semantic-feature regression coefficients in IT and the region's improved model fit when adding semantic information. Therefore, the anterior temporal lobes may function in cooperation with more posterior temporal regions and is concordant with previous research which shows that interactions between the anterior temporal lobe and the posterior fusiform are crucial for processing fine-grained information about objects (Clarke et al. 2011). This is further supported by evidence showing that, when the anterior temporal lobes are damaged, there is decreased functional activation in the posterior ventral stream during semantic tasks (Mummery et al. 1999) and reduced feedback from anterior to posterior ventral stream regions (Campo et al. 2013). One hypothesis of the putative function of this interaction is the integration of semantic information coded in the posterior temporal lobes, which is driven by conjunctive neurons in the perirhinal cortex that act to bind together complex object information (Miyashita et al. 1996; Moss et al. 2005; Taylor et al. 2006; Mion et al. 2010; Chan, Baker et al. 2011; Clarke et al. 2011; Tyler et al. 2013; Clarke and Tyler 2014).
This is not to suggest that semantic information is only represented beyond ∼200 ms. We also found evidence that early semantic processing can underpin the dissociation of objects from different categories, and was observed significantly earlier than semantic information than can dissociate between members of the same category. This was based on a model including only semantic-feature information, and after any effects accounted for by the HMax model had been removed, and so directly reveals when there is sufficient semantic information captured in MEG data to make different kinds of object dissociations. The purely semantic-feature model showed significant between-category classification after 110 ms (initial maximum was 130 ms) and significant within-category classification from 160 ms (maximum at 210 ms; note the onset latency of within-category effects was 210 ms using the single-participant classifications though both analysis show similar time courses and peaks).
While between-category classification accuracy became statistically significant after 110 ms, the maximum accuracy overall was observed after 350 ms and later than the maximum for within-category classifications (230 ms). The within-category classification effects we observed were not sustained throughout the epoch, showing intermittent above chance effects. One reason why the significant within-category classifications may not be sustained after the onset could be that our analysis focuses on the aspects of the MEG signal that are time-locked to the onset of the image (the evoked signals). The initial between-category and within-category classification effects will be largely underpinned by the evoked information in the MEG signals. However, if there is information relevant to within-category classifications in the MEG signals that is jittered in time across trials, then our approach will not fully utilize this information, and as a consequence may underperform. Future research into the contribution of evoked and induced frequency-specific oscillations, and the functional relevance of these time windows will be required to fully understand the encoding of specific visual and semantic parameters and how they support behavior.
Despite this, we do not take the sustained between-category effects and intermittent within-category effects to reflect the later processing of category information compared with object-specific semantic information, but rather we focus on when there is sufficient information to make between- and within-category distinctions. The early significant category distinctions, after 110 ms, show a similar latency to previously reported categorical distinctions in the ventral stream (Liu et al. 2009; Chan, Baker et al. 2011). The latency and duration of the significant within-category distinctions (150–250 ms) is consistent with research showing increased activity in the ventral stream from 170 to 258 ms for object-specific semantic information compared with general category information (Clarke et al. 2011), and that after ∼200 ms neural activity begins to correlate with naming latencies (Costa et al. 2009).
This suggests that in addition to processing visual aspects of the image, more abstract semantic information is also processed within the initial feedforward processing, providing a sufficient level of representational detail to support coarse semantic decisions prior to the formation of specific conceptual representations. These results are in contrast to claims that basic-level conceptual information is available prior to superordinate category information (Rosch et al. 1976; Jolicoeur et al. 1984), instead supporting a model of object recognition where the initial feedforward responses support coarse, categorical knowledge about objects (Kirchner and Thorpe 2006; Liu et al. 2009; Chan, Baker et al. 2011), while the information required for individual semantic concepts emerges subsequently and depends on recurrent interactions (Schendan and Maher 2009; Clarke et al. 2011, 2013) and the continued interplay between visual and semantic factors (Humphreys et al. 1988; Humphreys and Forde 2001). This progression of semantic information over time does not necessarily suggest discrete stages of initial category representations and later concept-specific representations, but instead can be formulated in terms of information emerging and accumulating over time, where different kinds of decisions can be made at different latencies based on the information available in current representations (Mack and Palmeri 2011).
In this study, we used machine learning techniques to generate neural predictions for the representation of objects. By training a model which incorporated both visual and semantic measures, we were able to successfully construct neural representations for untrained objects with a high degree of accuracy. As the predicted neural representations were novel concepts, this approach allows us to generalize and construct spatiotemporal neural activations for a potentially limitless set of meaningful objects. However, it is worth noting that some of our analyses are based on MEG signals averaged over participants, and so future analyses can be used to determine to what extent the models fully generalize across participants. Visual object classification studies utilizing time-sensitive methods, such as EEG, intracranial recordings and MEG have successfully shown that different categories of object and word can be classified very rapidly (Liu et al. 2009; Simanova et al. 2010; Chan, Halgren et al. 2011; Murphy et al. 2011). For example, EEG patterns can successfully predict whether an object is an animal or a tool within 200 ms (Simanova et al. 2010), although it is unclear if the basis of classification success is visual or semantic (or both). The regression approach used here is based on specific, theoretically motivated predictors, and the relevance of these predictors governs whether classification accuracy improves or fails. This is in contrast to many decoding classification approaches that seek to find differences between 2 (or more) classes of stimuli, but which do not reveal the underlying basis of that difference (Kriegeskorte 2011; Naselaris et al. 2011). Therefore, the classification approach we have adopted provides important information about the basis on which classification works (also see Sudre et al. 2012 for a related approach).
Understanding how visual objects are represented in the brain is one of the central questions in neuroscience, but has traditionally been tackled using methods insensitive to the time-varying neural dynamics. Here, we utilized time-sensitive MEG recordings to model the visual and semantic representations of individual objects. Object representations are composed of complex visual and semantic information, both of which are necessary to comprehensively model the processing of such representations. We demonstrate that a visuo-semantic model that includes low and high-level visual properties together with semantic-feature information provides an effective model of the time-varying neural representations of individual objects. Our results are supported by measures of model fit as well as predictive performance in constructing and classifying individual objects, and clearly highlight the need to incorporate complex semantic information about objects to understand how objects are represented and processed in the brain.
Supplementary Material
Supplementary material can be found at: http://www.cercor.oxfordjournals.org/.
Funding
This work was supported by funding from the European Research Council under the European Community's Seventh Framework Programme (FP7/2007-2013)/ERC Grant agreement no 249640 to L.K.T. Funding to pay the Open Access publication charges for this article was provided by the European Research Council under the European Community's Seventh Framework Programme (FP7/2007-2013)/ERC Grant agreement no 249640 to L.K.T.
Notes
Conflict of Interest: None declared.
Supplementary Material
References
- Bar M, Kassam KS, Ghuman AS, Boshyan J, Schmid AM, Dale AM, Hamalainen MS, Marinkovic K, Schacter DL, Rosen BR, et al. 2006. Top-down facilitation of visual recognition. Proc Natl Acad Sci USA. 103:449–454. [DOI] [PMC free article] [PubMed] [Google Scholar]
- Campo P, Poch C, Toledano R, Igoa JM, Belinchon M, Garcia-Morales I, Gil-Nagel A. 2013. Anterobasal temporal lobe lesions alter recurrent functional connectivity within the ventral pathway during naming. J Neurosci. 33:12679–12688. [DOI] [PMC free article] [PubMed] [Google Scholar]
- Chan AM, Baker JM, Eskandar E, Schomer D, Ulbert I, Marinkovic K, Cash SS, Halgren E. 2011. First-pass selectivity for semantic categories in human anteroventral temporal cortex. J Neurosci. 31:18119–18129. [DOI] [PMC free article] [PubMed] [Google Scholar]
- Chan AM, Halgren E, Marinkovic K, Cash SS. 2011. Decoding word and category-specific spatiotemporal represenations from MEG and EEG. Neuroimage. 54:3028–3039. [DOI] [PMC free article] [PubMed] [Google Scholar]
- Clarke A, Taylor KI, Devereux B, Randall B, Tyler LK. 2013. From perception to conception: how meaningful objects are processed over time. Cereb Cortex. 23:187–197. [DOI] [PMC free article] [PubMed] [Google Scholar]
- Clarke A, Taylor KI, Tyler LK. 2011. The evolution of meaning: spatiotemporal dynamics of visual object recognition. J Cogn Neurosci. 23:1887–1899. [DOI] [PubMed] [Google Scholar]
- Clarke A, Tyler LK. 2014. Object-specific semantic coding in human perirhinal cortex. J Neurosci. 34(14):4766–4775. [DOI] [PMC free article] [PubMed] [Google Scholar]
- Costa A, Strijkers K, Martin C, Thierry G. 2009. The time course of word retrieval revealed by event-related brain potentials during overt speech. Proc Natl Acad Sci USA. 106:21442–21446. [DOI] [PMC free article] [PubMed] [Google Scholar]
- Cree GS, McRae K. 2003. Analyzing the factors underlying the structure and computation of the meaning of chipmunk, cherry, chisel, cheese, and cello (and many other such concrete nouns). J Exp Psychol Gen. 132:163–201. [DOI] [PubMed] [Google Scholar]
- Delorme A, Makeig S. 2004. EEGLAB: an open source toolbox for analysis of single-trial EEG dynamics including independent component analysis. J Neurosci Methods. 134:9–21. [DOI] [PubMed] [Google Scholar]
- Devereux BJ, Tyler LK, Geertzen J, Randall B. Forthcoming 2013. The Centre for Speech Language and the Brain (CSLB) Concept Property Norms. Behav Res Methods. [DOI] [PMC free article] [PubMed]
- Fabre-Thorpe M. 2011. The characteristics and limits of rapid visual categorization. Front Psychol. 2:243. [DOI] [PMC free article] [PubMed] [Google Scholar]
- Farah MJ, McClelland JL. 1991. A computational model of semantic memory impairment: modality specificity and emergent category specificity. J Exp Psychol Gen. 120:339–357. [PubMed] [Google Scholar]
- Fei-Fei L, Iyer A, Koch C, Perona P. 2007. What do we perceive in a glance of a real-world scene? J Vis. 7:10. [DOI] [PubMed] [Google Scholar]
- Garrard P, Lambon Ralph MA, Hodges JR, Patterson K. 2001. Prototypicality, distinctiveness, and intercorrelation: analyses of the semantic attributes of living and nonliving concepts. Cogn Neuropsychol. 18:125–174. [DOI] [PubMed] [Google Scholar]
- Hauk O, Davis MH, Ford M, Pulvermuller F, Marslen-Wilson WD. 2006. The time course of visual word recognition as revealed by linear regression analysis of ERP data. Neuroimage. 30:1383–1400. [DOI] [PubMed] [Google Scholar]
- Hegdé J. 2008. Time course of visual perception: coarse-to-fine processing and beyond. Prog Neurobiol. 84:405–439. [DOI] [PubMed] [Google Scholar]
- Henson RNA, Mouchlianitis E, Friston K. 2009. MEG and EEG data fusion: simultaneous localisation of face-evoked responses. Neuroimage. 47:581–589. [DOI] [PMC free article] [PubMed] [Google Scholar]
- Hochstein S, Ahissar M. 2002. View from the top: hierarchies and reverse hierarchies in the visual system. Neuron. 36:791–804. [DOI] [PubMed] [Google Scholar]
- Humphreys GW, Forde EME. 2001. Hierarchies, similarity, and interactivity in object recognition: category-specific neuropsychological deficits. Behav Brain Sci. 24:453–509. [PubMed] [Google Scholar]
- Humphreys GW, Lamote C, Lloyd-Jones TJ. 1995. An interactive activation approach to object processing: effects of structural similarity, name frequency, and task in normality and pathology. Memory. 3:535–586. [DOI] [PubMed] [Google Scholar]
- Humphreys GW, Riddoch MJ, Quinlan P. 1988. Cascade processes in picture identification. Cogn Neuropsychol. 5:67–103. [Google Scholar]
- Jolicoeur P, Gluck MA, Kosslyn SM. 1984. Pictures and names: making the connection. Cogn Psychol. 16:243–275. [DOI] [PubMed] [Google Scholar]
- Kirchner H, Thorpe SJ. 2006. Ultra-rapid object detection with saccadic eye movements: visual processing speed revisited. Vision Res. 46:1762–1776. [DOI] [PubMed] [Google Scholar]
- Kriegeskorte N. 2011. Pattern-information analysis: from stimulus decoding to computational-model testing. Neuroimage. 56:410–421. [DOI] [PubMed] [Google Scholar]
- Lambon Ralph MA, Sage K, Jones RW, Mayberry EJ. 2010. Coherent concepts are computed in the anterior temporal lobes. Proc Natl Acad Sci USA. 107:2717–2722. [DOI] [PMC free article] [PubMed] [Google Scholar]
- Liu H, Agam Y, Madsen JR, Kreiman G. 2009. Timing, timing timing: fast decoding of object information from intracranial field potentials in human visual cortex. Neuron. 62:281–290. [DOI] [PMC free article] [PubMed] [Google Scholar]
- Loschky L, Larson AM. 2010. The natural/man-made distinction is made before basic-level distinctions in scene gist processing. Visual Cogn. 18:513–536. [Google Scholar]
- Mace MJ-M, Joubert OR, Nespoulous J-L, Fabre-Thorpe M. 2009. The time-course of visual categorizations: you spot the animal faster than the bird. PLoS One. 4:e5927. [DOI] [PMC free article] [PubMed] [Google Scholar]
- Mack ML, Palmeri TJ. 2011. The timing of visual object categorization. Front Psychol. 2:165. [DOI] [PMC free article] [PubMed] [Google Scholar]
- Martinovic J, Gruber T, Muller MM. 2008. Coding of visual object features and feature conjunctions in the human brain. PLoS One. 3:e3781. [DOI] [PMC free article] [PubMed] [Google Scholar]
- McRae K, Cree GS, Seidenberg MS, McNorgan C. 2005. Semantic feature production norms for a large set of living and nonliving things. Behav Res Methods. 37:547–559. [DOI] [PubMed] [Google Scholar]
- Mion M, Patterson K, Acosta-Cabronero J, Pengas G, Izquierdo-Garcia D, Hong Y, Fryer T, Williams G, Hodges J, Nestor PJ. 2010. What the left and right anterior fusiform gyri tell us about semantic memory. Brain. 133:3256–3268. [DOI] [PubMed] [Google Scholar]
- Mitchell TM, Shinkareva SV, Carlson A, Chang K, Malave VL, Mason RA, Just MA. 2008. Predicting human brain activity associated with the meanings of nouns. Science. 320:1191–1195. [DOI] [PubMed] [Google Scholar]
- Miyashita Y, Okuno H, Tokuyama W, Ihara T, Nakajima K. 1996. Feedback signal from medial temporal lobe mediates visual associative mnemonic codes of inferotemporal neurons. Brain Res Cogn Brain Res. 5:81–86. [DOI] [PubMed] [Google Scholar]
- Moss HE, Rodd JM, Stamatakis EA, Bright P, Tyler LK. 2005. Anteromedial temporal cortex supports fine-grained differentiation among objects. Cereb Cortex. 15:616–627. [DOI] [PubMed] [Google Scholar]
- Mummery CJ, Patterson K, Wise RJS, Vandenbergh R, Price CJ, Hodges JR. 1999. Disrupted temporal lobe connections in semantic dementia. Brain. 122:61–73. [DOI] [PubMed] [Google Scholar]
- Murphy B, Poesio M, Bovolo F, Bruzzone L, Dalponte M, Lakany H. 2011. EEG decoding of semantic category reveals distributed representations for single concepts. Brain Lang. 117:12–22. [DOI] [PubMed] [Google Scholar]
- Naselaris T, Kay K, Nishimoto S, Gallant J. 2011. Encoding and decoding in fMRI. Neuroimage. 56:400–410. [DOI] [PMC free article] [PubMed] [Google Scholar]
- Patterson K, Nestor PJ, Rogers TT. 2007. Where do you know what you know? The representation of semantic knowledge in the human brain. Nat Rev Neurosci. 8:976–988. [DOI] [PubMed] [Google Scholar]
- Praß M, Grimsen C, König M, Fahle M. 2013. Ultra rapid object categorization: effects of level, animacy and context. PLoS One. 8:e68051 doi:68010.61371/journal.pone.0068051. [DOI] [PMC free article] [PubMed] [Google Scholar]
- Quian Quiroga R, Kraskov A, Koch C, Fried I. 2009. Explicit encoding of multimodal percepts by single neurons in the human brain. Curr Biol. 19:1308–1313. [DOI] [PMC free article] [PubMed] [Google Scholar]
- Quian Quiroga R, Reddy L, Koch C, Fried I. 2007. Decoding visual inputs from multiple neurons in the human temporal lobe. J Neurophysiol. 98:1997–2007. [DOI] [PubMed] [Google Scholar]
- Riesenhuber M, Poggio T. 1999. Hierarchical models of object recognition. Nature. 2:1019–1025. [DOI] [PubMed] [Google Scholar]
- Rogers TT, McClelland JL. 2004. Semantic cognition: a parallel distributed approach. Cambridge, MA: MIT press. [DOI] [PubMed] [Google Scholar]
- Rosch E, Mervis CB, Gray WD, Johnson DM, Boyes-Braem P. 1976. Basic objects in natural categories. Cogn Psychol. 8:382–439. [Google Scholar]
- Schendan HE, Maher SM. 2009. Object knowledge during entry-level categorization is activated and modified by implicit memory after 200 ms. Neuroimage. 44:1423–1438. [DOI] [PubMed] [Google Scholar]
- Scholl CA, Jiang X, Martin J, Riesenhuber M. 2014. Time course of shape and category selectivity revealed by EEG rapid adaptation. J Cogn Neurosci. 26:408–421. [DOI] [PubMed] [Google Scholar]
- Serre T, Oliva A, Poggio T. 2007. A feedforward architecture accounts for rapid categorization. PNAS. 104:6424–6429. [DOI] [PMC free article] [PubMed] [Google Scholar]
- Serre T, Wolf L, Poggio T. 2005. Object recognition with features inspired by visual cortex. In. Computer Vision and pattern recognition (CVPR 2005) San Diego, USA.
- Simanova I, van Gerven M, Oostenveld R, Hagoort P. 2010. Identifying object categories from event-related EEG: towards decoding of conceptual representations. PLoS One. 5:e14465. [DOI] [PMC free article] [PubMed] [Google Scholar]
- Sudre G, Pomerleau D, Palatucci M, Wehbe L, Fyshe A, Salmelin R, Mitchell T. 2012. Tracking neural coding of perceptual and semantic features of concrete nouns. Neuroimage. 62:451–463. [DOI] [PMC free article] [PubMed] [Google Scholar]
- Sugase Y, Yamane S, Ueno S, Kawano K. 1999. Global and fine information coded by single neurons in the temporal visual cortex. Nature. 400:869–873. [DOI] [PubMed] [Google Scholar]
- Taylor KI, Devereux BJ, Acres K, Randall B, Tyler LK. 2012. Contrasting effects of feature-based statistics on the categorisation and identification of visual objects. Cognition. 122:363–374. [DOI] [PMC free article] [PubMed] [Google Scholar]
- Taylor KI, Devereux BJ, Tyler LK. 2011. Conceptual structure: towards an integrated neurocognitive account. Lang Cogn Process. 26:1368–1401. [DOI] [PMC free article] [PubMed] [Google Scholar]
- Taylor KI, Moss HE, Stamatakis EA, Tyler LK. 2006. Binding crossmodal object features in perirhinal cortex. Proc Natl Acad Sci USA. 103:8239–8244. [DOI] [PMC free article] [PubMed] [Google Scholar]
- Tyler LK, Chiu S, Zhuang J, Randall B, Devereux BJ, Wright P, Clarke A, Taylor KI. 2013. Objects and categories: feature statistics and object processing in the ventral stream. J Cogn Neurosci. 25:1723–1735. [DOI] [PMC free article] [PubMed] [Google Scholar]
- Tyler LK, Moss HE. 2001. Towards a distributed account of conceptual knowledge. Trends Cogn Sci. 5:244–252. [DOI] [PubMed] [Google Scholar]
- Tyler LK, Stamatakis EA, Bright P, Acres K, Abdallah S, Rodd JM, Moss HE. 2004. Processing objects at different levels of specificity. J Cogn Neurosci. 16:351–362. [DOI] [PubMed] [Google Scholar]
- Vigliocco G, Vinson DP, Lewis W, Garrett MF. 2004. Representing the meanings of object and action words: the featural and unitary semantic space hypothesis. Cogn Psychol. 48:422–488. [DOI] [PubMed] [Google Scholar]
Associated Data
This section collects any data citations, data availability statements, or supplementary materials included in this article.