Abstract
Magnetic resonance imaging (MRI) offers the direct visualization of human musculoskeletal (MSK) system, especially all diarthrodial tissues including cartilage, bone, menisci, ligaments, tendon, hip, synovium etc. Conventional MR imaging techniques based on T1- and T2-weighted, proton density (PD) contrast are inconclusive in quantifying early biochemically degenerative changes in MSK system in general and articular cartilage in particular. In recent years, quantitative MR parameter mapping techniques have been used to quantify the biochemical changes in articular cartilage with a special emphasis on evaluating joint injury, cartilage degeneration, and soft tissue repair. In this article, we will focus on cartilage biochemical composition, basic principles of T1ρ MR imaging, implementation of T1ρ pulse sequences, biochemical validation, and summarize the potential applications of T1ρ MR imaging technique in MSK diseases including osteoarthritis (OA), anterior cruciate ligament (ACL) injury, and knee joint repair. Finally, we will also review the potential advantages, challenges, and future prospects of T1ρ MR imaging for widespread clinical translation.
Keywords: T1ρ, musculoskeletal system, osteoarthritis, cartilage, meniscus, anterior cruciate ligament
Introduction
More than half of the individuals aged over 65 years show symptoms of osteoarthritis (OA) (1, 2). OA severely affects the quality of life of elderly people and is increasingly regarded as a metabolically active joint complaint of multi-factorial etiologies (3, 4).
Normal articular cartilage is composed of a small portion of chondrocytes, which are dedicated cells, within a large extracellular matrix (ECM). Cartilage ECM is mainly composed of water (60%–80%), type II collagen (15%–20%) and negatively charged proteoglycans (PGs) (3%–10%) that facilitate the binding of water molecules. The structure of cartilage varies across its depth and consists of four histological zones or layers. These are the superficial (tangential) layer, the transitional (intermediate) layer, the radial (deep) layer, and the calcified layer. Underneath these layers are subchondral bone and cancellous bone, respectively (5, 6). It is generally recognized that the collagen fibrils are oriented perpendicular to the articular surface in the radial layer, randomly distributed in the transitional layer, and parallel to the articular cartilage surface in the superficial layer (6). Articular cartilage contains a high concentration of PGs which are complex macromolecules consisting of protein and polysaccharides (6, 7). Aggrecan, a high-molecular-weight PG, making up 80–90% of the total cartilage (dry weight), is comprised of a bottle brush-shaped protein core with a long extended domain to which many glycosaminoglycan (GAG) side chains are attached. The distribution of the PG macromolecules within the collagen fibre network contributes to the resistance of the matrix to the passage of water molecules and therefore affects the mechanics of the cartilage in this fashion (5, 7). Many different types of collagen are found in cartilage, but the most common is type II collagen (90–95% of the total volume of collagen in cartilage). The main role of the type II collagen fibers is to offer a tensile force opposing the tendency of the PGs to expand the cartilage and serve to immobilize the PGs as well. The concentration of collagen and PGs varies with the depth from the cartilage surface to the radial layer. The PG concentration at the cartilage surface is at its lowest, rising to a broad peak in the middle layers (7, 8). Water is the most abundant component of cartilage with the concentration ranging from 80% of the gross mass on the surface to 65% in the deep layer. Only a small fraction of the water is bound to collagen molecules (5, 7).
A high PG content is necessary to the load-bearing requirements of joints for it confer low hydraulic permeability and high swelling pressure upon the cartilage tissue. Cartilage degeneration with a loss of PG from the ECM is thought to be an initiating event of early OA, and the fatigue and breakdown of collagen fibre network may be the earliest event in a degenerative chain of OA process (7, 8, 10). The biochemical changes of the degenerative cartilage generally include the reduction of PG concentration, the elevation of water content, and the increased rate of synthesis and degradation of matrix macromolecules (5, 10). All these changes in the macromolecular matrix lead to alteration of the mechanical properties of the cartilage, which consequently becomes unable to serve as an effective load-bearing matrix.
Over the last two decades, there have been endeavors in developing new techniques for the treatment of OA such as chondroprotective drugs and repairs of the cartilage defects through autologous chondrocyte implantation (ACI) or allograft with subsequent regeneration of the damaged cartilage (11–14). Most recently, the clinical outcomes of the particulated juvenile articular cartilage (PJAC) technique showed a significant improvement over baseline, with histologically favorable repair tissue 2 years postoperatively (15). Matrix-associated autologous chondrocyte transplantation (MACT) has become an established articular cartilage repair technique which provides good short-term and midterm results (16). At long-term follow-up, microfracture technique (MF) and osteochondral autologous transplantation (OAT) mosaicplasty have no significant differences in treating focal chondral lesions of the knee (17). The cell seeded collagen membrane method was used to treat the localized cartilage defects (18). A novel functionalised hydrogel with an integrated drug delivery system was developed to stimulate articular cartilage regeneration (19). The hyaluronic acid-salmon calcitonin conjugate was used for the local treatment of osteoarthritis and had chondro-protective effect in a rabbit model of early OA (20). Although the development of drugs in animals and humans is promising in preventing the cartilage macromolecules from breakdown and effectively halting further progression of OA, the long natural history of OA (approximately 10–20 years in humans) validating the efficacy of these drugs requires a noninvasive technique directly evaluating their effect on molecular changes in association with early stages of cartilage degeneration prior to the emergence of distinct morphological changes (13, 21, 22). The reliable and non-invasive measurements of molecular (PGs, collagen, and water) and morphological (joint space width, tissue surface area and volume) changes in cartilage enable the detection of OA in its early stages. These measurements can monitor the disease progression, evaluate the potential scenarios for disease management, and validate the efficacy of the disease-modifying drugs (13).
In current clinical settings, the diagnostic imaging techniques available to examine the progression of cartilage loss in OA mainly include plain radiographs, microfocal radiographs, radionuclide imaging, arthrography, computed tomography (CT), ultrasound, arthroscopy, and MR imaging of articular cartilage. Arthroscopy is an invasive method that can cause discomfort to patients, although it is a proclaimed gold standard of joint examination. Plain and microfocal radiographs are the simplest means of joint evaluation. Radiography along with radionuclide scans, arthrography, CT, and ultrasound are limited in their clinical use because they cannot detect early cartilage abnormalities. In contrast, MR imaging (MRI) has the advantages of multi-planar imaging, excellent soft tissue contrast, non-invasiveness, and no ionizing radiation (22). The role of MR imaging of cartilage is evolving and articular cartilage can be evaluated by various MRI techniques. In recent years, new MR imaging techniques of being able to detect changes in the ECM have been developed, among which T1ρ mapping is most sensitive to the changes of PG content in the ECM compared to proton-based methods such as T2 relaxation mapping, delayed gadolinium-enhanced MR imaging of cartilage (dGEMRIC), chemical exchange-dependent saturation transfer (gagCEST) (23), and the direct MR imaging of sodium (5, 9). T2 mapping is effective primarily in quantifying changes associated with collagen component of the cartilage ECM. Sodium MR imaging of cartilage and dGEMRIC have been shown to be useful mainly in quantifying changes of PG content (4, 24). However, dGEMRIC is invasive and patients have to wait for a relatively long time before they are scanned; Sodium MR of cartilage has the drawbacks of low image contrast and resolution and the need of extra hardware of a sodium coil. T1ρ imaging technique has the comparative advantage of direct visualization of PG content changes in cartilage non-invasively without the addition of any extra hardware provided that the limit of specific absorption rate (SAR) is satisfied (25, 26).
In the following sections of this article, we will review the basic principles of T1ρ MR imaging, implementation of different T1ρ pulse sequences, biochemical validation and outline the potential applications of T1ρ MR imaging technique in MSK diseases such as OA, anterior cruciate ligament (ACL) injury, knee joint repair etc. We will summarize the potential advantages, challenges, and future prospects of T1ρ MR imaging for widespread clinical translation as well.
Basic Principles of T1ρ MR Imaging
Spin-lattice relaxation in the rotating frame is characterized by the time constant (T1ρ) that defines the magnetic relaxation of spins under the influence of a radio-frequency field (27–30). A spin-locking (SL) experiment was described by Redfield (31), and it has been used extensively to investigate low-frequency interactions between macromolecules and bulk water (28, 30). T1ρ MR imaging has been shown to be sensitive to changes in PG of cartilage (27). The T1ρ relaxation is often measured using the spin-lock technique. T1ρ is somewhat of a hybrid between T1 and T2. In fact, the boundaries for T1ρ are always between T2 and T1. Normally, magnetization is rotated into the transverse plane along one axis, immediately followed by a spin-locking pulse applied along the same axis. The spin-locking pulse is an on-resonance and continuous wave radiofrequency pulse with long duration and low energy. Because the magnetization and radiofrequency field are along the same direction, the magnetization seems to be “spin-locked” provided the locking condition is satisfied, namely, instead of allowing the transverse magnetization to decay unperturbed, a low amplitude RF pulse is applied for a prolonged period of time to force the transverse magnetization to relax while under the influence of this applied pulse. If the RF pulse is appropriately aligned with the transverse magnetization, the magnetization no longer relaxes according to T2, but instead relaxes according to T1ρ. The corresponding RF pulse that accomplishes this is called a spin-locking pulse termed, say, BSL as shown in Fig. 1. The T1ρ relaxation parameter provides unique biomedical information in the low-frequency regime. The frequency range is generally from a few hundred hertz to a few kilohertz (32, 33).
Fig. 1.

Application of a spin-locking pulse in the rotating frame. Initially, longitudinal magnetization (a) is flipped into the transverse plane (b). A spin-locking pulse, which by definition is oriented along the magnetization, is immediately applied (c). After some time, the magnetization decays under the influence of the spin-locking pulse (d). The time constant of this relaxation is T1ρ.
The amplitude of the spin-locking pulse, BSL, and the duration of the spin-locking pulse or time of spin-lock length (TSL), can be arbitrarily chosen within the limits posed by the electronics of the MR system. In conventional T1 relaxation, longitudinal magnetization relaxes by exchanging energy with the processes in the lattice that are occurring at the Larmor frequency. In the case of the spin-lock pulse, transverse magnetization can exchange energy with lattice processes occurring at the spin-locking frequency that is directly proportional to the amplitude of the spin-locking pulse (BSL). Therefore, T1ρ is spin-locking frequency-dependent similarly to the dependence of T1 is dependent on the Larmor frequency (33). T1 and T2 that are intrinsic properties of tissue and are generally not affected by pulse sequence parameters. On the other hand, the value of T1ρ is determined both by tissue properties and features of the applied spin-locking pulse. By changing the spin-locking pulse amplitude one can alter the spin-locking frequency and as a result influence the spin interaction with the lattice. Hence, T1ρ can be sensitized to slow motion in the lattice, which is important for biomedical imaging, since slow motion in the lattice is associated with large molecules such as proteins. In fact, T1ρ has been shown to be sensitive to the protein composition of tissue (32, 34), and may therefore offer information about properties of macromolecules in the tissue that is otherwise not possible when imaging using conventional T1 and T2 relaxation measurements. For a fixed spin-lock amplitude, T1ρ values can be calculated by the acquisition of a series of T1ρ -weighted images at various spin-locking pulse durations, termed time of spin-lock length (TSL). Although a wealth of literature concerning the T1ρ applications in research circles (25, 27–30, 34–38) has been published, the T1ρ relaxation mechanism in biological tissues, mostly in cartilage and neighboring meniscus, remains poorly understood. Further exploration to better understand this relaxation mechanism is warranted.
The History of T1ρ Pulse Sequence development
Table. 1 summarizes the evolution of T1ρ pulse sequnce development.
As shown in Figures 1 and 2, T1ρ-weighted MR imaging sequences mainly consist of two steps: first a spin-locking pulse cluster is applied prior to imaging. After allowing adequate time for T1ρ relaxation to occur and while maintaining this T1ρ prepared magnetization along the Z-axis; a 2D or 3D data acquisition is performed. This means that the T1ρ prepared magnetization can be imaged using any type of pulse sequences such as spin-echo (45), fast spin-echo (28, 46), single-shot fast spin-echo (33), 3D gradient-echo (32, 33, 39, 47), spiral imaging (41), and steady-state free precession (SSFP/True-FISP)-based sequences (43, 48, 49). Figure 3 shows the T1ρ-weighted MR imaging pulse sequence diagram based on single-slice 2D fast spin-echo (FSE) sequence [Figure 3(a)] and 3D gradient echo sequence with a self-compensating spin-lock pulse cluster [Figure 3(b)], respectively. In the T1ρ-weighted imaging sequence, a three-pulse cluster ((π/2)x − (spin-lock)y − (π/2)−x − crusher gradient) prepares the T1ρ-weighted magnetization. The initial (π/2)x pulse flips the longitudinal magnetization into the transverse plane along the y-axis. A long low power pulse is then applied along the y-axis to spin-lock the magnetization. The second (π/2)−x pulse flips this spin-locked magnetization back to the z-axis. Residual transverse magnetization is then dephased by a crusher gradient. The magnetization stored along the z-axis can then be read out by different pulse sequences such as fast spin-echo, single-shot fast spin-echo, and 3D gradient-echo (20, 26). These different pulse sequences were performed in the spin-lock pulse cluster in order to improve the spin-locking robustness to the B0 and B1 inhomogeneity. A composite spin-lock pulse showing the tolerance to shimming and radio frequency errors was designed to allow spin locking with relatively weak RF (low spin-lock frequency) and therefore low specific energy absorption rate (SAR) (50). A “self-compensated” spin-locking pulse (25, 26, 33, 51) with the phase of the second half of the spin-lock pulse being shifted 180° from the first half was proposed to reduce the artifacts due to the B1 inhomogeneity. Application of spin-locking pulses in a system with species at a range of chemical shifts or in a system with significant B0 inhomogeneity can result in more complex rotations arising from off-resonance spin-locking. In the off-resonance rotating frame, the “effective” spin-locking vector is not located in the transverse plane. Therefore, shifting the phase of the spin-locking RF by 180° does not result in an opposite orientation of the spin-locking vector. The resultant magnetization rotations and artifacts are not modeled by the theoretical discussion presented here, but the off-resonance effect becomes worse for larger resonance offsets (i.e., greater B0 inhomogeneity or larger chemical shifts) or weaker spin-locking powers (i.e., lower B1) [13]. T1ρ quantification techniques can be performed on two-dimensional (2D) spin-echo, fast spin-echo, three-dimensional (3D) gradient echo (28, 32, 33, 39, 45–47), spiral imaging (35) or SSFP/True-FISP based sequences (43, 48, 49). The corresponding pulse sequences have been implemented on human subjects at both 1.5T and 3.0T on MR scanners by different manufacturers.
Fig. 2.
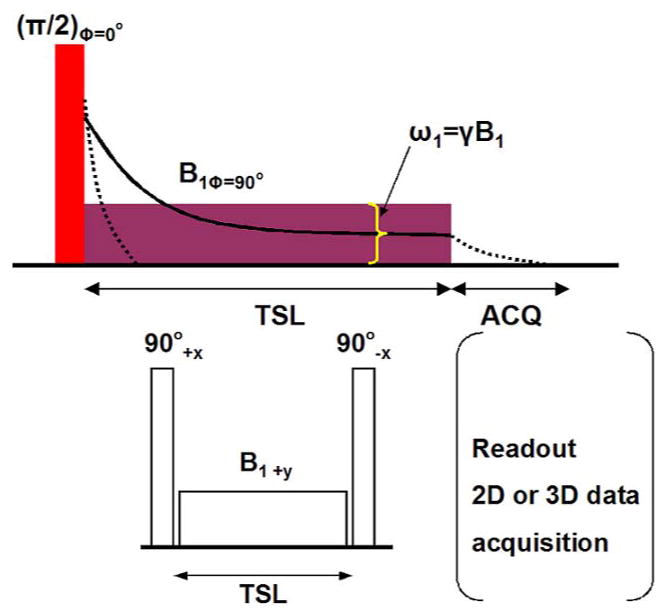
Schematic diagram for spin lock magnetization in the transverse plane (upper row). Initially, a π/2 pulse flips the longitudinal magnetization into the transverse plane. The horizontal rectangle pulse represents the spin lock (SL) pulse. And TSL and B1 are the duration and amplitude, respectively. The dotted line represents the decay of the magnetization in the absence of spin-locking and is governed by time constant T2*. If the magnetization is spin-locked, it decays according to T1ρ (solid line) for the duration of time TSL. After implementation of the SL pulse the decay is again dictated by T2*, during which time the signal may be acquired (right in lower row also); Radiofrequency pulse cluster for T1ρ-encoding (left in lower row). TSL and B1 are the duration and amplitude of the SL pulse, respectively.
Fig. 3.
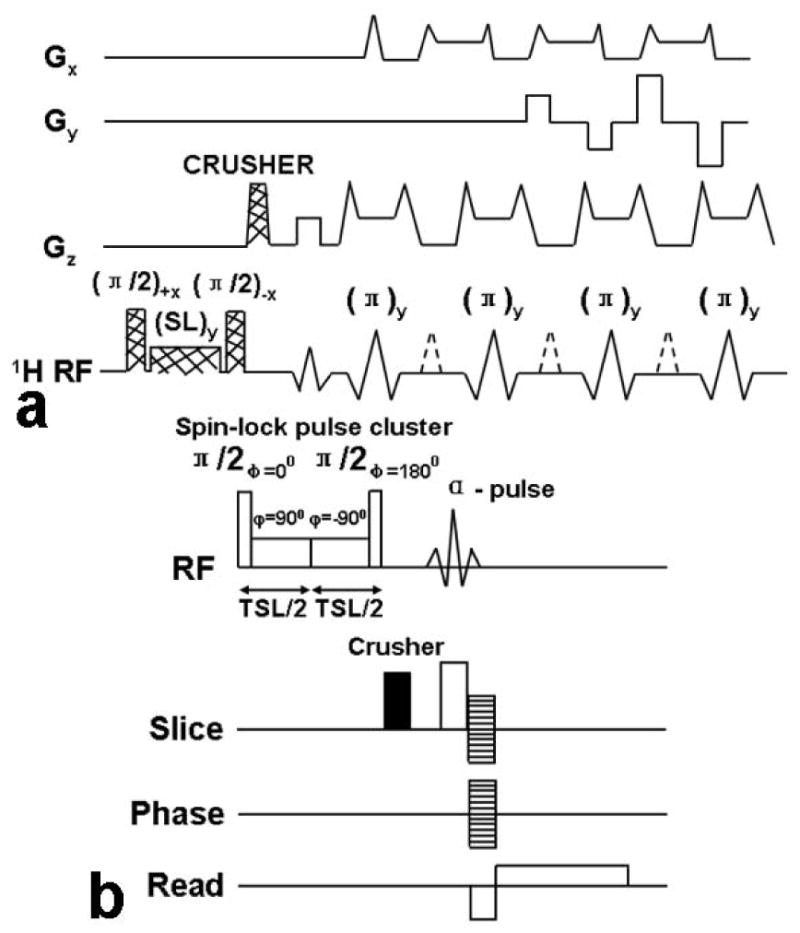
(a) Schematic diagram of the pulse sequence for implementation of T1ρ-weighted fast spin-echo (FSE) MR imaging. The magnetization undergoes T1ρ relaxation during the time of spin locking, which generates T1ρ weighting. A crusher gradient is used after the SL pulse cluster to dephase any residual transverse magnetization. The magnetization is then imaged with a standard two-dimensional fast spin-echo sequence. Only three echoes are shown for the sake of clarity. 1H RF = proton radio frequency, SL = spin lock pulse. (b) The pulse sequence diagram for the GRE sequence with a self-compensating spin-lock pulse cluster. A strong crusher gradient is applied before the α pulse to destroy any residual magnetization in the transverse plane and prevent the information of unwanted coherences. The stacked lines in the gradient region indicate the phase-encoding gradients.
For a fixed spin-lock frequency, a series of T1ρ-weighted images can be obtained with varying time of spin-lock length (TSL). The spin-lock frequency may be calibrated from the amplitude and length of the hard 90° pulse employed. The typical length of the hard 90° pulse is ~100–200 us. The spin-lock field varies from 0–1500 Hz (27, 32). 2D spin-echo or fast spin-echo (FSE) sequence-based T1ρ-weighted imaging was first developed (30). The 2D T1ρ maps can be constructed from a series of T1ρ-weighted images acquired with various TSL values and with the image signal intensity data fit according to equation 1:
| (1) |
Here, S(TSL) and S0 are the signal intensity at a given TSL and at the shortest TSL, respectively. The image data are fitted on a pixel-by-pixel basis.
Wheaton and colleagues (40, 41) presented a multislice spin-lock (MS-SL) pulse sequence to acquire multiple images with spin-lock generated contrast that produces images with T1ρ contrast with an additional factor of intrinsic T2ρ weighting, which hinders direct measurement of T1ρ. A T2ρ compensation method was proposed to accurately calculate multislice T1ρ maps in an acceptable experimental time in this work which demonstrated that the T2ρ-compensated multislice T1ρ maps produced errors in the measurement of T1ρ in healthy patellar cartilage of roughly 5% compared to the so-called gold standard measurement of T1ρ acquired with single-slice spin-lock pulse sequence (28). Li and co-workers (42) implemented a multi-slice T1ρ imaging method using spin-lock techniques based on spiral imaging. The adverse effect of T1 regrowth during the multi-slice acquisition was eliminated by RF phase cycling. Their research study demonstrated the feasibility of applying this imaging technique to in vivo knee cartilage T1ρ mapping and quantification. In recent years, Du et al (44) reported a novel ultrashort echo time (UTE) T1ρ sequence that combines a spin-lock preparation pulse with a two-dimensional ultrashort echo time sequence of a nominal echo time 8 μsec. The UTE-T1ρ sequence was employed to quantify T1ρ in short T2 tissues including the Achilles tendon and the meniscus. Their preliminary results on the cadaveric ankle specimens and healthy controls show that this UTE T1ρ sequence can provide high signal and contrast in imaging the Achilles tendon and the meniscus. Although several studies have demonstrated that 2D T1ρ MR imaging is sensitive to changes in the proteoglycan content of cartilage, they are restricted to single-section imaging and are hence impractical as guides for T1ρ imaging of a typical anatomic region (30). Applying single-section techniques is a consequence of the need to make the spin-locking pulse section selective. Compared to the 2D-T1ρ-weighted imaging technique, the 3D-T1ρ-weighted imaging method has several advantages. 3D imaging allows rapid acquisition of images of the entire anatomic region. 3D sequences generally have a thinner slice thickness and may provide more accurate evaluation of cartilage degeneration. High-resolution 3D MR imaging is particularly significant for the assessment of OA where cartilage becomes very thin, (i.e. less than 1 mm) (30, 32). In addition, by suppressing the fluid and fat signals, 3D-T1ρ-weighted MR imaging can generate better demarcation in compared to 2D T1ρ-weighted MR imaging between cartilage on the one hand and bone marrow (fat) and fluid on the other. 3D acquisition is desirable because of the non-slice-selective nature of the T1ρ preparation pulses (spin-lock pulses) [32]. On the other hand, several studies (30, 48) have validated that there was very good agreement between T1ρ values computed by 2D and 3D T1ρ-weighted imaging methods.
It is impossible to reduce scan times below a certain point because of hardware and physiological limits stemming from the limits of the switching rates. Parallel imaging technique can provide solutions to this limitation. The basic principle of parallel imaging is to utilize the spatial sensitivity of each coil element of a phased-array (PA) coil for spatial encoding (28). Parallel imaging reduces the number of phase-coding lines that must be acquired in order to keep the same field of view (FOV). Therefore, the acquisition time can be reduced measurably (25, 26).
Biochemical T1ρ Validation in Ex-vivo Model Systems
In vitro and ex-vivo studies have assessed the relationship between T1ρ relaxation time and the biochemical composition of cartilage. As shown in Fig. 4, Akella and colleagues (4, 27) implemented T1ρ mapping of healthy bovine patella as a function of PG depletion. Their work suggested that T1ρ-mapping may be used to sensitively measure and spatially map the changes in the PG component of articular cartilage. Specifically, as the early stages of OA involve the loss of PG with only minor changes in collagen content, T1ρ-mapping could potentially be beneficial in measuring and monitoring these early degenerative changes. Regatte and co-workers demonstrated that T1ρ mapping is sensitive to sequential depletion of proteoglycan in bovine cartilage and may be exploited to sensitively measure and spatially map the changes in the PG component of articular cartilage (27, 37, 52–54) (Fig. 5). Their results suggest that T1ρ has a higher dynamic range (>100%) for detecting early pathology compared to T2 using human cartilage specimens for T2- and T1ρ-weighted imaging. They also implied that T1ρ relaxation mapping is a sensitive noninvasive marker for quantitatively predicting and monitoring the status of macromolecules in early OA (53). Taylor et al (55) used human osteochondral specimens from OA patients and cadavers for T1ρ, T2, and dGEMRIC magntic resonance imaging and indicated that T1ρ, T2, and contrast enhanced techniques may provide complementary information about the molecular environment in cartilage during the evolution of OA. Koskinen and co-workers showed that T1ρ relaxation time is longer in advanced cartilage degeneration than in intermediate degeneration via T1ρ imaging of cadaveric patellae (56). Wheaton and colleagues (37, 57) investigated the correlation of changes in cartilage biomechanical and biochemical properties with T1ρ relaxation rate in a cytokine-induced model of degeneration. By T1ρ imaging of cultured bovine cartilage explants, they demonstrated that T1ρ MRI can detect changes in proteoglycan content and biomechanical properties of cartilage in a physiologically relevant model of cartilage degeneration; the T1ρ technique can potentially be used to noninvasively and quantitatively assess the biochemical and biomechanical characteristics of articular cartilage in humans during the progression of osteoarthritis. Duvvuri and co-workers demonstrated that T1ρ relaxation changes are correlated with PG loss in vitro, and T1ρ measurements alone can be used to indicate PG loss data (29, 58). Using T2 and T1ρ MR imaging of suspensions of cartilage macromolecules and bovine cartilage samples, Menezes and colleagues (59) illustrated that T2 and T1ρ are sensitive to biologically meaningful changes in cartilage, and these two relaxation mechanisms are not specific to any one inherent tissue parameter which is contrary to some published reports (60).
Fig. 4.
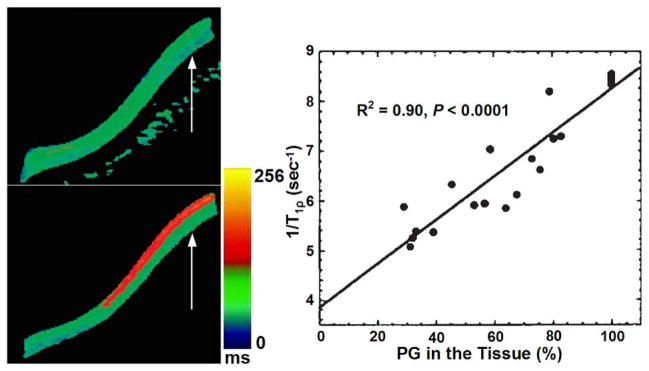
Comparison of representative T1ρ maps of control and 40% PG depleted bovine patellae, control T1ρ map (upper row of left column) and 40% PG depleted T1ρ map (lower row of left column), respectively. The color bar scale shows the relaxation time values distribution ranging from 0 to 256 ms; The right column shows a plot of 1/T1rho vs. PG loss from a group of bovine cartilage patellae subjected to serial depletion of PG content. The solid line indicates the linear fit to the experimental data. T1ρ data demonstrated a strong correlation (R2 = 0.90, p < 0.0001) between changes in PG content and 1/T1rho. Figure reprinted from reference (4), with permission.
Fig. 5.
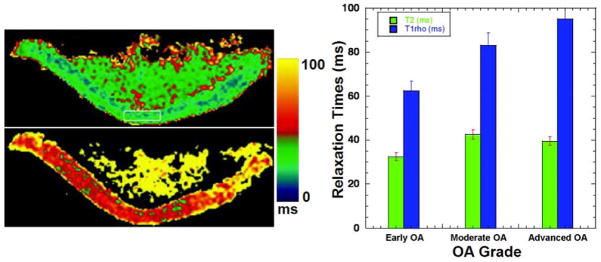
Representative T2 (upper row of left column) and T1ρ (lower row of left column) maps. T2 map constructed from a series of T2-weighted images obtained with parameters TR/TE = 4000 ms/15 ms, FOV = 7 cm × 7 cm, slice thickness = 3 mm, matrix = 512 × 128, NEX = 1. T1ρ map constructed from a series of T1ρ-weighted images of the same slice obtained with parameters TR/TE+TSL = 4000 ms/17 ms; FOV = 7 cm × 7 cm, slice thickness = 3 mm, matrix = 512 × 128, NEX = 1, and ω1 = 500 Hz. The color bar scale shows the relaxation time values distribution ranging from 0 ms to 100 ms; (right column) comparison of T2 and T1ρ relaxation times as a function of various clinical grades of OA cartilage (early OA, moderate OA, and advanced OA). Figure reprinted from reference (52), with permission.
In vivo MSK Applications
The interplay between motion-restricted water molecules and their local macromolecular environment can be monitored by measuring T1ρ, making it a promising technique for assessing the composition of human MSK system like cartilage, since its ECM provides a motion-restricted environment for the water molecules. In the osteoarthritic knee, damaged hyaline cartilage demonstrates higher T1ρ values than normal cartilage, and T1ρ imaging has higher sensitivity than T2-weighted imaging for differentiating between normal cartilage and early-stage osteoarthritis (36). There is evidence that several factors other than proteoglycan depletion may contribute to variations in T1ρ values; these factors include collagen fiber orientation and concentration and the concentration of other macromolecules (60). T1ρ imaging may provide valuable etiologic, diagnostic, or prognostic information regarding knee osteoarthritis (61).
T1ρ Imaging of the Knee Joint
Lozano et al (62) described two cases in which cartilage injuries could not be detected with standard morphological magnetic resonance imaging but in which T1ρ-weighted imaging was able to detect cartilage abnormalities in vivo that were confirmed at the time of arthroscopy. A recently published research study (63) suggested that there exists some degree of association between knee alignment and subregional T1ρ values of femorotibial cartilage and menisci in patients with clinical OA. Wang et al (64) compared parallel changes of quantitative T2, T1ρ, and dGEMRIC mapping of human cartilage and suggested that T1ρ and dGEMRIC mapping seem to be more sensitive in detecting early stage of cartilage degeneration. Goto and co-workers (65, 66) evaluated age- and weight-bearing-related changes of T1ρ values in normal cartilage. Stahl et al (36) suggested that T1ρ is well suited to differentiate healthy subjects and early OA patients and is more sensitive than T2 relaxations times, yet T1ρ is also dependent on age. Pakin et al (25, 26) demonstrated the feasibility of 3D T1ρ-weighted imaging of the knee joint at 3.0T. Souza and co-workers (67) observed an association between cartilage defects and meniscal damage in advanced disease via T1ρ MR imaging in knee OA subjects. Regatte et al (30, 34) and Duvvuri et al (28) demonstrated the feasibility of quantifying early biochemical changes in symptomatic OA subjects employing T1ρ-weighted MRI on a clinical scanner. Nishioka and colleagues (9) suggested that using both T1ρ and T2 imaging methods could provide an evaluation of cartilage constituents, detect qualitative changes in the ECM, and quantitatively measure cartilage degeneration. Li et al (68–70) indicated that T1ρ and T2 values show different spatial distributions and may provide complementary information regarding cartilage degeneration in OA. Link and colleagues (71) suggested that dGEMRIC, T2 and T1ρ mapping techniques can detect cartilage damage at a stage when changes are potentially still reversible before cartilage tissue is lost. At the early stage of OA, an overall increase in cartilage parameters (T1ρ, T2) were observed in patients (72). Fig. 6 shows representative T1ρ maps of femorotibial cartilage obtained from patients with mild (KL1), minimal (KL2), moderate (KL3), and advanced (KL4) OA, respectively.
Fig. 6.
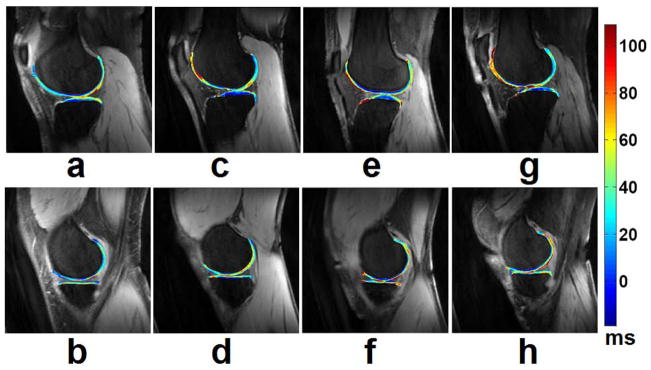
Representative T1ρ maps of femorotibial cartilage in the lateral (a, c, e, g) and medial (b, d, f, h) compartments obtained from patients with mild (KL1) (a, b), minimal (KL2) (c, d), moderate (KL3) (e, f), and advanced (g, h) (KL4) OA, respectively. The color bar scale on the right shows the T1ρ values range of distribution. The imaging parameters for 3D-T1ρ mapping were: duration of each 90° pulse = 200 μs, TR/TE = 175 ms/2.04 ms, spin-lock frequency = 300 Hz, number of slices = 30, time of spin-lock (TSL) = 2/10/20/30 ms, slice thickness = 3 mm, matrix = 256 × 128, FOV = 15 cm, flip angle = 25°, bandwidth = 260 Hz/pixel, respectively.
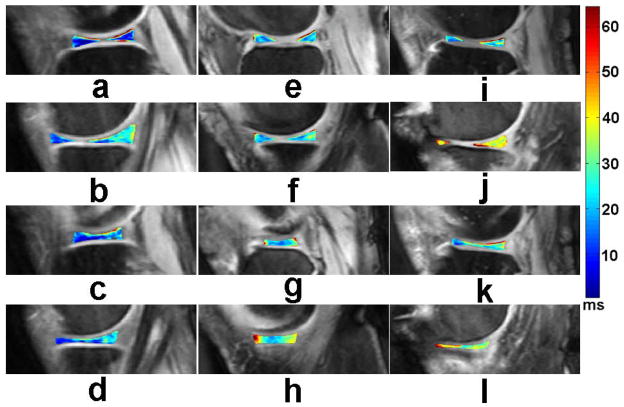
MR imaging of the menisci of the knee has proven useful for more than 10 years (73). Zarins et al (74) suggested that meniscal damage has been implicated in OA progression and is correlated with cartilage degeneration by way of MR T1ρ and T2 measurements. Rauscher and co-workers (75) demonstrated that meniscal T1ρ and T2 values correlate with clinical findings of OA and can be used to differentiate healthy subjects from patients with mild or severe OA. Son et al (76) indicated that both T1ρ and T2 relaxation times correlated strongly with water content and moderately with mechanical properties in osteoarthritic menisci, but not as strongly with glycosaminoglycans (GAGs) or collagen contents alone. They suggested that T1ρ and T2 relaxation times have limited ability to detect compositional variations in degenerate menisci. Bolbos and colleagues (77) demonstrated a strong injury-related association between meniscus and cartilage biochemical changes by quantitatively T1ρ mapping of meniscus and cartilage matrix in patients with anterior cruciate ligament (ACL) injuries. Recent studies (38, 78) suggested that the compartment-specific damage of menisci may be associated with osteoarthritis and T1ρ mapping could be sensitive to meniscus degeneration. Fig. 7 shows representative T1ρ maps of menisci obtained from a healthy control, a minimal (KL2) OA patient, and a severe (KL4) OA patient, respectively.
Fig. 7.
Representative T1ρ maps of menisci in the lateral (a, c, e, g, i, k) and medial (b, d, f, h, j, l) compartments, obtained from a healthy control (a, b, c, d), a minimal (KL2) OA patient (e, f, g, h), and a severe (KL4) OA patient (i, j, k, l), respectively. The color bar on the right shows the range of T1ρ values. The imaging parameters for 3D-T1ρ mapping were the same as those in Fig. 6.
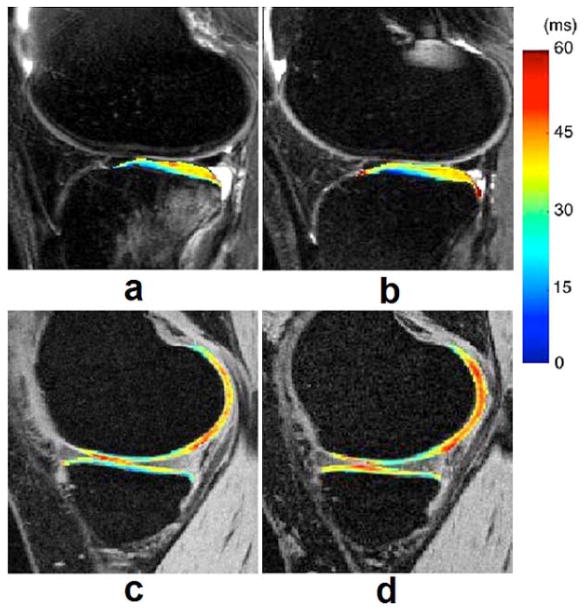
ACL injuries occur mostly in individuals with early-onset of OA with associated pain, functional limitations, and decreased quality of life in the ages between 30 and 50 years (79–81). Clinical reports suggest that patients with ACL-deficient knees have an increased incidence of knee osteoarthritis (OA) compared to uninjured knees (82, 83). Nishioka et al demonstrated that T1ρ values were significantly higher for cartilage pathology than for normal cartilage and that T1ρ mapping technique was able to non–invasively detect cartilage pathology in the ACL–injured knee with a higher detectability than other sequences (84). Li and co-workers (77, 85) suggested that quantitative T1ρ MR imaging can detect the changes of the cartilage matrix in ACL-reconstructed knees as early as 1 year after ACL reconstruction and can offer tools of quantitatively assessing meniscus and cartilage matrix in patients with ACL injuries. Fig. 8 shows representative T1ρ maps of ACL-injured knee at baseline and 1-year follow-up, respectively.
Fig. 8.
T1ρ maps of lateral (a, b) and medial (c, d) side of ACL-injured knee at (a, c) baseline and (b, d) 1-year follow-up. T1ρ values in lateral posterior tibia (LT 3) were elevated significantly in ACL-injured knees at baseline and remained high at 1-year follow-up despite resolution of bone bruise in the LT. T1ρ values in the contacting area of MFC and MT were significantly elevated in ACL-injured knees at 1-year follow-up. Figure reprinted from reference (85), with permission.
Aside from the applications in cartilage and meniscus, T1ρ mapping offers tools to quantitatively evaluate bone marrow edema-like lesions (BMEL) in OA and knee injury (86). Du et al (44) hypothesized that ligament or tendon measurements may have useful pre- and post-operative clinical applications in the future. In their study, ultra-short TE T1ρ imaging has been applied at Achilles tendon and showed increased values in one cadaver specimen with tendon degeneration. Quantitative T1ρ relaxation time measurements are promising biomarkers for evaluation of preventive surgery and for knee repair surgery, which addresses traumatic or degenerative pathologies (87). T1ρ mapping may also be used in postoperative imaging for outcome evaluation of different surgical procedures as well as individual outcome analysis and prediction, and early detection of degenerative changes before distinct morphological changes occur, although only a small number of studies has peen performed to date using T1ρ imaging for evaluation of knee repair procedures (85, 88–97). Fig. 9 shows representative T1ρ and T2 maps 3–6 months and 1 year after mosaicplasty (MOS) surgery, respectively. Specifically, published literature (21, 64) has suggested that T1ρ may provide complementary information in detecting cartilage degeneration when combined with both T2 and (dGEMRIC)-T1 mapping techniques, as is shown in Fig. 10. On the other hand, the reliability of cartilage T1ρ and T2 measurements has been limited to single-vendor studies, Mosher and colleagues (98) performed the reproducibility measurement of quantitative magnetic resonance (MR) imaging biomarkers of the morphology and composition (T1ρ and T2) of knee cartilage in a multi-center and multi-vendor trial involving patients with OA and asymptomatic control subjects and indicated that MR imaging measurements of cartilage morphology, T2, and patellar T1ρ demonstrated moderate to excellent reproducibility in a clinical trial network. One limitation exists that T1ρ’s specificity to cartilage GAG introducing residual dipolar interactions leads to a contribution from the collagen matrix, which complicates the analysis and interpretation of T1ρ.
Fig. 9.
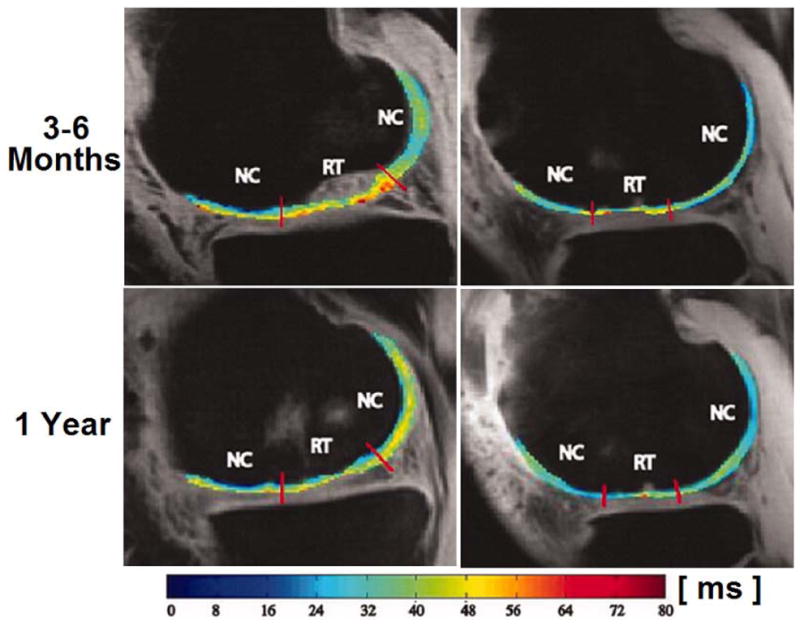
Representative T1ρ (left column) and T2 (right column) maps 3–6 months and 1 year after mosaicplasty (MOS) surgery. Colour bar scale shows T1ρ and T2 values range of distribution. NC, normal cartilage; RT, regenerated tissue. Figure reprinted from reference (88), with permission.
Fig. 10.
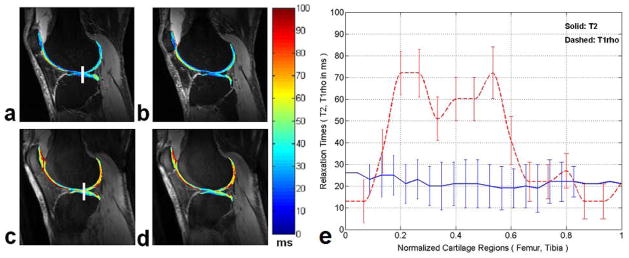
Two representative sagittal T2 (a, b) and T1ρ (c, d) weighted images obtained from an OA subject along with overlaid maps respectively. The relaxation times for the T2 and T1ρ mapping are obvious in different range of values with a distinct higher dynamic range in T1ρ for the OA subject. (e) The profile plots of the T2 and T1ρ relaxation times measured in the same subject as shown in (a) and (c). The vertical rectangular regions of interest (ROIs) were used for profile plotting (solid line for T2 and dashed line for T1ρ respectively). Each point on the profile is an average of 5×5 pixels and error bars show the respective standard deviation. Figure reprinted from reference (64), with permission.
Other Potential Applications
T1ρ mapping offers the potential to identify biochemical damage to MSK system prior to the onset of irreversible tissue loss. As a promising biomarker, it may allow earlier detection of MSK pathology before the development of radiographic evidence of disease (99). Hip deformity such as acetabular dysplasia and cam as well as pincer deformities are thought to be a major cause of hip OA, and T1ρ imaging has a clinically important role in diagnosing and staging chondral damage in the hip (100). Subburaj and others (101–103) analyzed regional variations of T1ρ in hip joint cartilage and suggested that locally regional analysis was more sensitive than global measurements in subjects with and without femoral acetabular impingement. Fig. 11 shows a representative T1ρ mapping example from a subject with mild hip OA (104).
Fig. 11.
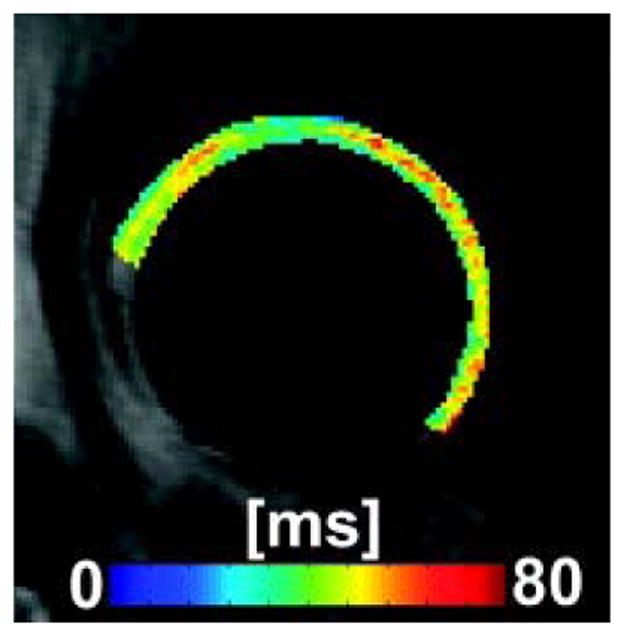
T1ρ map example of a subject with mild hip OA. Figure reprinted from reference (104), with permission.
The studies in T1ρ imaging of the shoulder, wrist, and ankle are relatively sporadic (44, 51, 69, 105). La Rocca Vieira and co-workers (51) offered the baseline T1ρ values of the humeral and glenoid cartilages of healthy subjects and suggested that this work may be useful for quantitative comparison with diseased shoulders as is shown in Fig. 12. Akella et al (105) demonstrated the feasibility of T1ρ MR imaging of human wrist cartilage in vivo with standard clinical scanners.
Fig. 12.
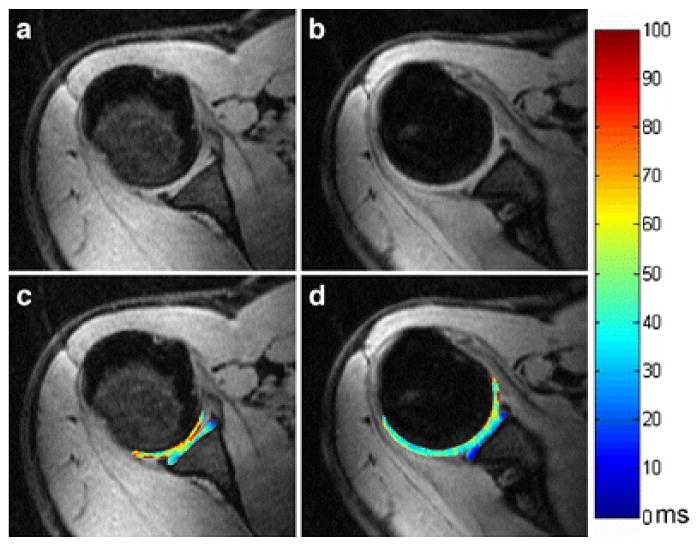
Representative in vivo axial 3D T1ρ-weighted images (a, b) and corresponding maps (c, d) of the shoulder (glenoid and humeral) cartilages in a 32-year-old male asymptomatic volunteer. Figure reprinted from reference (51), with permission.
Degenerative disc disease (DDD) of the intervertebral disc (IVD) is the most common cause of back-associated disability in adults across the world (106) as is shown in Fig. 13. Blumenkrantz et al (107) suggested that in vivo T1ρ quantification of IVD is feasible and could become a clinical way of identifying early degenerative changes in the IVD. Auerbach and co-workers (108) suggested that T1ρ in vivo has strong potential to be a non-invasive biomarker of proteoglycan loss and early disc degeneration. Results from Johannessen et al (109) suggested that T1ρ may offer the tool of diagnosing early degenerative changes in the disc, and T1ρ-weighted MR imaging may provide higher dynamic range than T2. Likewise, Zuo and colleagues (110) indicated that MR T1ρ relaxation time may potentially serve as biomarkers of symptomatic IVD disease.
Fig. 13.
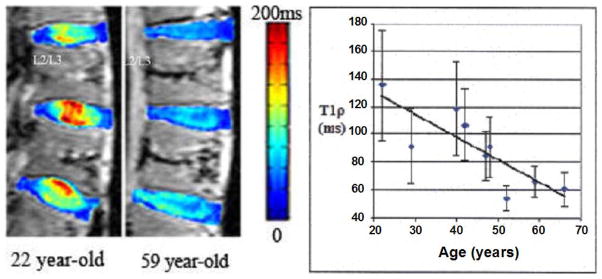
The left image shows a color T1ρ map overlaid on a T1-weighted image (grayscale) of the lumbar region from a 22 year-old and a 59 year-old human cadaver spine. The right plot shows the average T1ρ value of the nucleus pulposus (NP) region for each L2/L3 IVD against its specimen’s age. The standard deviation of all T1ρ values within each NP region was graphed as the error bar. A linear fit of the data points yielded a correlation coefficient of 0.82, which suggests a strong relationship between T1ρ of NP and the specimen’s age. Figure reprinted from reference (106), with permission.
Another application of T1ρ imaging lies in the evaluation of muscle disease. Parkin et al (26) assessed T1ρ mapping of periarticular muscles at the knee. Lamminen and co-workers (111) used T1ρ dispersion for in vivo muscle tissue characterization and found definite statistically significant difference between the relative T1ρ dispersion values of normal and diseased muscle tissue. Dixon and others (50, 112) concluded that spin locking is an effective way of increasing blood-to-myocardium contrast and suggested that T1ρ can offer the same contrast to images as magnetization transfer and T2. Virta et al (113) indicated that T1ρ as well as T2 is more sensitive to the composition of muscle in comparison with T1 and that T1ρ and T2 offer a relatively similar tissue contrast.
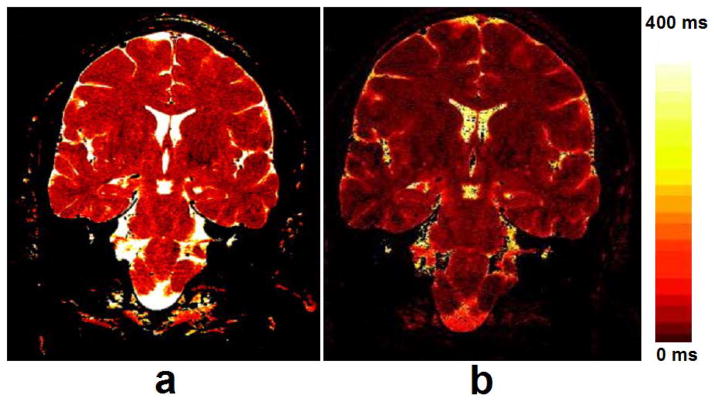
Besides the extensive applications in human MSK system, T1ρ MR spectroscopy and imaging also deal with the detection of tumors, liver and brain diseases, myocardium, blood flow, and Alzheimer’s disease (AD) (46, 50, 111, 114–130) as shown in Fig. 14 (liver), Fig. 15 (myocardium), and Fig. 16 (brain), respectively. Recent studies (119, 126) showed that T1ρ MR imaging is able to detect liver fibrosis, and the degree of fibrosis is correlated with the degree of the T1ρ measurements, suggesting liver T1ρ quantification may play an important role for liver fibrosis early detection and grading. Compared to T1 and T2, T1ρ apprars to have unique capability to distinguish tumor from normal fat and fibrous breast tissues (114). Markkola et al (116) evaluated the potential of T1ρ dispersion and spin lock techniques to differentiate benign and malignant head and neck tumors and suggested that low T1ρ dispersion effect values are characteristic of a benign tumor. T1ρ-weighted imaging performed at low spin-lock strengths quanlitatively depicted tumor borders better than proton-density or T2-weighted imaging and could be useful in treatment planning when combined with other imaging sequences (115, 117). Alzheimer’s disease is the most common form of dementia in the elderly. Borthakur and others (120–123) suggested that T1ρ may potentially constitute an important biomarker of AD.
Fig. 14.
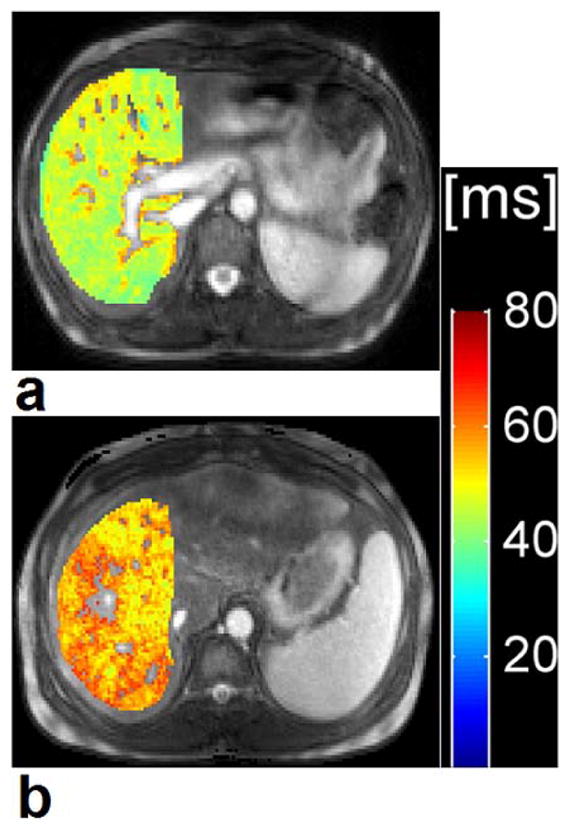
Segmented T1ρ map of a 28-year old healthy control subject (a) and a 45-year old patient with liver cirrhosis Child-Pugh score A (b). T1ρ value of the healthy subject was 49.1 ms and T1ρ value of the patient with liver cirrhosis was 55.7 ms. Colour scale bar shows T1ρ values range of distribution. Figure reprinted from reference (125), with permission.
Fig. 15.
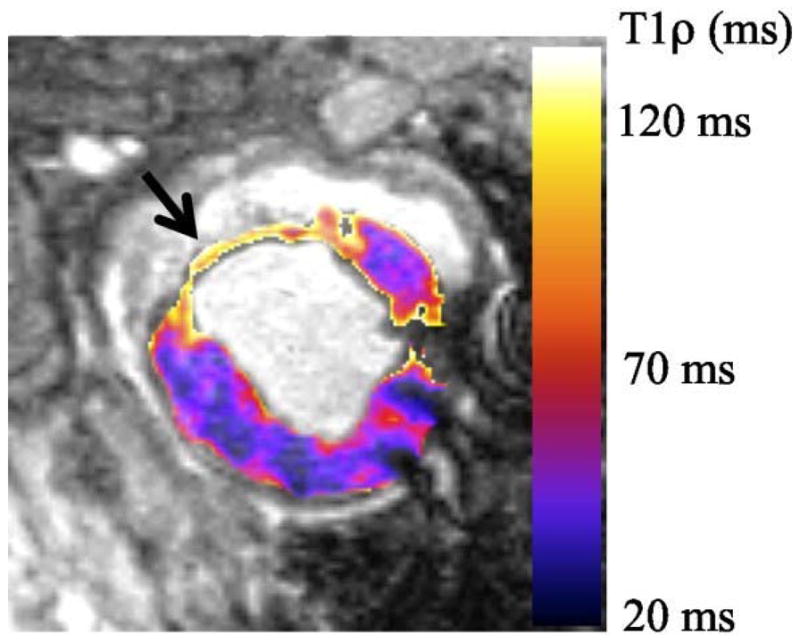
T1ρ relaxation time map from a single animal 8 weeks post-MI. The infarct 1H nuclear relaxation time in vivo are measured T1ρinfarct = 91.7 ms and T1ρmyocardium = 47.2ms. Relaxation time are twice as long in the myocardial infarction than the myocardium, which means that T1ρ-weighted images have high signal intensity at the infarct and low signal intensity in the myocardium. Figure reprinted from reference (132), Open Access article.
Fig. 16.
Images acquired at different TSL and TE values were used to calculate T1ρ (a) and T2 (b) maps, respectively. Note the greater dynamic range of the T1ρ map than the T2 map. The maps were windowed identically from 0–400 msec. Relaxation times greater than 400 msec are assigned the brightest color. Furthermore, pixels for which the linear fit’s correlation coefficient (R2) was less than 0.9 were set to zero, e.g., dark pixels inside the ventricles in the T2 map. Figure reprinted from reference (119), with permission.
Future Prospects
T1ρ-weighted imaging has been extensively used in the past decades to assess pathology of liver, muscle, breast, brain, and tumor (32, 33, 47, 115, 122, 129, 130, 132–134) besides those of human MSK system (9, 34, 36, 38, 44, 47, 53, 62–69, 72–103, 105–110, 124). These studies have demonstrated the potential values of T1ρ imaging for evaluating various physiologic and pathologic states. Aside from the application in early detection of cartilage degeneration, the above-mentioned different T1ρ imaging applications provide evidence that T1ρ is sensitive to slow spin motions in tissue, and with appropriately chosen pulse sequence parameters, T1ρ may show properties of a tissue of interest that are not observable through T1 and T2 imaging. T1ρ-weighted imaging has been applied to a number of disease states and organ systems and has shown promise as a tool for early detection of pathology.
The influencing factors for calculating T1ρ values of MSK tissues like cartilage and meniscus are individual subject variation, regions of interest (ROIs) measured, water content, spin-lock power, pulse sequence parameters, and protocol settings etc. Up to now, despite the promising results in evaluating small cohorts (OA, ACL injury and cartilage repair), the value of individual T1ρ measurements in a clinical setting requires further standardization of image acquisition and post-processing methods, improved spatial resolution, rapid mapping techniques, reproducibility, specificity and validation with reference standard, larger propsective multi-center trials on multi-vendor platforms. Longitudinal changes among healthy controls, OA subjects, and the natural effects of ageing on T1ρ are not yet well evaluated, which is another limitation. Although there still exist other technical challenges for T1ρ imaging such as high SAR (especially at high and ultra high magnetic field strength) and relatively long acquisition time, T1ρ cartilage imaging has the obvious advantages of no contrast agent administration, no RF hardware modification, higher dynamic range compared T2 and the ability to be implemented on any standard clinical scanners (1.5T or 3.0T). The prospect of clinical applications exploiting the information available through T1ρ-weighted imaging is sure to be promising and will be of greatly progressive.
Summary
This review mainly deals with T1ρ MR imaging of human MSK system and summarizes the practical applications of T1ρ MR imaging technique in MSK system. T1ρ imaging in human MSK system can offer clinically significant information associated with biochemical variations in human tissues such as the cartilage of the knee joint. In vivo T1ρ mapping technique has demonstrated its feasibility in a number of cross sectional OA studies and limited number of longitudinal and multi-center trials. In vivo T1ρ mapping needs further cross validation with other imaging modalities such as dGEMRIC, sodium MRI, and gagCEST. Additional studies are warranted to address the issues of sensitivity, specificity, and reproducibility (multi-center and multi-vendor trials) to OA severity, progression as well as prediction of development of OA. T1ρ imaging has extensive prospect and great potential to be a valuable clinically diagnostic measure for the early detection of human MSK pathology and is a promising quantitative biomarker for MSK applications.
Table 1.
History of T1ρ Pulse Sequence Development
| T1ρ Sequence | Publication |
|---|---|
| 2D single-slice T1ρ-weighted fast spin-echo (FSE) sequence | Duvvuri et al. Radiology 2001; 220: 822–826. (Ref. 28) |
| 3D fast gradient-echo (FGRE) T1ρ-weighted sequence | Regatte et al. Acad Radiol 2004; 11: 741–749. (Ref. 34); Borthakur et al. J Magn Reson Imaging 2003; 17: 730–736. (Ref. 39) |
| 2D multi-slice spin-lock (MS-SL) pulse sequence | Wheaton et al. Magn Reson Med 2004; 52: 1453–1458 (Ref. 40); Wheaton et al. J Magn Reson Imaging 2004; 20: 519–525 (Ref. 41). |
| multi-slice spiral T1ρ-weighted imaging pulse sequence | Li et al. Magn Reson Med 2005; 54: 929–936 (Ref. 42). |
| 3D T1ρ-prepared balanced gradient echo (b-GRE) pulse sequence | Witschey et al. J Magn Reson Imaging 2008; 28: 744–754 (Ref. 43). |
| Ultrashort TE T1ρ (UTE T1ρ) sequence | Du et al. Magn Reson Med 2010; 64: 834–842 (Ref. 44). |
Acknowledgments
The authors would like to acknowledge the support by research grants RO1 AR053133, RO1 AR056260, and RO1 AR060238 from the National Institute of Arthritis and Musculoskeletal and Skin Diseases (NIAMS), National Institutes of Health (NIH), USA. This work was equally supported by The Priority Academic Program Development of Jiangsu Higher Education Institutions (PAPD), China.
References
- 1.Felson DT. Epidemiology of hip and knee osteoarthritis. Epidemiol Prev. 1988;10:1–28. doi: 10.1093/oxfordjournals.epirev.a036019. [DOI] [PubMed] [Google Scholar]
- 2.Felson DT. The incidence and natural history of knee osteoarthritis in the elderly. The Farmingham Osteoarthritis Study. Arthritis Rheum. 1995;38:1500–1505. doi: 10.1002/art.1780381017. [DOI] [PubMed] [Google Scholar]
- 3.Guccione AA, Felson DT, Anderson JJ, et al. The effects of specific medical conditions on the functional limitations of elders in the Farmingham Study. Am J Public Health. 1994;84:351–358. doi: 10.2105/ajph.84.3.351. [DOI] [PMC free article] [PubMed] [Google Scholar]
- 4.Borthakur A, Mellon E, Niyogi S, Witschey W, Kneeland JB, Reddy R. Sodium and T1rho MRI for molecular and diagnostic imaging of articular cartilage. NMR Biomed. 2006;19:781–821. doi: 10.1002/nbm.1102. [DOI] [PMC free article] [PubMed] [Google Scholar]
- 5.Xia Y. Magic-angle effect in magnetic resonance imaging of articular cartilage: a review. Invest Radiol. 2000;35:602–621. doi: 10.1097/00004424-200010000-00007. [DOI] [PubMed] [Google Scholar]
- 6.Xia Y, Farquhar T, Burton-Wurster N, Lust G. Origin of cartilage laminae in MRI. J Magn Reson Imaging. 1997;7:887–894. doi: 10.1002/jmri.1880070518. [DOI] [PubMed] [Google Scholar]
- 7.Maroudas AI. Balance between swelling pressure and collagen tension in normal and degenerate cartilage. Nature. 1976;260:808–809. doi: 10.1038/260808a0. [DOI] [PubMed] [Google Scholar]
- 8.Duvvuri U, Goldberg AD, Kranz JK, et al. Water magnetic relaxation dispersion in biological systems: the contribution of proton exchange and implications for the noninvasive detection of cartilage degradation. Proc Natl Acad Sci U S A. 2001;98:12479–12484. doi: 10.1073/pnas.221471898. [DOI] [PMC free article] [PubMed] [Google Scholar]
- 9.Nishioka H, Hirose J, Nakamura E, et al. T1ρ and T2 mapping reveal the in vivo extracellular matrix of articular cartilage. J Magn Reson Imaging. 2012;35:147–155. doi: 10.1002/jmri.22811. [DOI] [PubMed] [Google Scholar]
- 10.Bank RA, Krikken M, Beekman B, et al. A simplified measurement of degraded collagen in tissues: application in healthy, fibrillated and osteoarthritic cartilage. Matrix Biol. 1997;16:233–243. doi: 10.1016/s0945-053x(97)90012-3. [DOI] [PubMed] [Google Scholar]
- 11.Potter HG, Black BR, Chong le R. New techniques in articular cartilage imaging. Clin Sports Med. 2009;28:77–94. doi: 10.1016/j.csm.2008.08.004. [DOI] [PubMed] [Google Scholar]
- 12.Recht MP, Goodwin DW, Winalski CS, White LM. MRI of articular cartilage: revisiting current status and future directions. AJR Am J Roentgenol. 2005;185:899–914. doi: 10.2214/AJR.05.0099. [DOI] [PubMed] [Google Scholar]
- 13.Potter HG, Foo LF. Magnetic resonance imaging of articular cartilage: trauma, degeneration, and repair. Am J Sports Med. 2006;34:661–677. doi: 10.1177/0363546505281938. [DOI] [PubMed] [Google Scholar]
- 14.Durkan MG, Szumowski J, Brown DS, Foss EW, Crawford DC. In vivo MRI of fresh stored osteochondral allograft transplantation with delayed gadolinium-enhanced MRI of cartilage: Protocol considerations and recommendations. Magn Reson Med. 2013;69:1745–1753. doi: 10.1002/mrm.24419. [DOI] [PubMed] [Google Scholar]
- 15.Farr J, Tabet SK, Margerrison E, Cole BJ. Clinical, Radiographic, and Histological Outcomes After Cartilage Repair With Particulated Juvenile Articular Cartilage: A 2-Year Prospective Study. Am J Sports Med. 2014;42:1417–1425. doi: 10.1177/0363546514528671. [DOI] [PubMed] [Google Scholar]
- 16.Brix MO, Stelzeneder D, Chiari C, et al. Treatment of Full-Thickness Chondral Defects With Hyalograft C in the Knee: Long-term Results. Am J Sports Med. 2014;42:1426–1432. doi: 10.1177/0363546514526695. [DOI] [PubMed] [Google Scholar]
- 17.Ulstein S, Arøen A, Røtterud JH, Løken S, Engebretsen L, Heir S. Microfracture technique versus osteochondral autologous transplantation mosaicplasty in patients with articular chondral lesions of the knee: a prospective randomized trial with long-term follow-up. Knee Surg Sports Traumatol Arthrosc. 2014;22:1207–1215. doi: 10.1007/s00167-014-2843-6. [DOI] [PMC free article] [PubMed] [Google Scholar]
- 18.Behrens P, Bitter T, Kurz B, Russlies M. Matrix-associated autologous chondrocyte transplantation/implantation (MACT/MACI)–5-year follow-up. Knee. 2006;13:194–202. doi: 10.1016/j.knee.2006.02.012. [DOI] [PubMed] [Google Scholar]
- 19.Rampichová M, Buzgo M, Křížková B, Prosecká E, Pouzar M, Štrajtová L. Injectable hydrogel functionalised with thrombocyte-rich solution and microparticles for accelerated cartilage regeneration. Acta Chir Orthop Traumatol Cech. 2013;80:82–88. [PubMed] [Google Scholar]
- 20.Mero A, Campisi M, Favero M, et al. A hyaluronic acid-salmon calcitonin conjugate for the local treatment of osteoarthritis: Chondro-protective effect in a rabbit model of early OA. J Control Release. 2014 May 15; doi: 10.1016/j.jconrel.2014.05.008. pii: S0168-3659(14)00311-3. [DOI] [PubMed] [Google Scholar]
- 21.Oei EH, van Tiel J, Robinson WH, Gold GE. Quantitative radiological imaging techniques for articular cartilage composition: Towards early diagnosis and development of disease-modifying therapeutics for osteoarthritis. Arthritis Care Res (Hoboken) 2014 Feb 27; doi: 10.1002/acr.22316. [DOI] [PMC free article] [PubMed] [Google Scholar]
- 22.Blackburn WD, Jr, Chivers S, Bernreuter W. Cartilage imaging in osteoarthritis. Semin Arthritis Rheum. 1996;25:273–281. doi: 10.1016/s0049-0172(96)80037-0. [DOI] [PubMed] [Google Scholar]
- 23.Ling W, Regatte RR, Navon G, Jerschow A. Assessment of glycosaminoglycan concentration in vivo by chemical exchange-dependent saturation transfer (gagCEST) Proc Natl Acad Sci U S A. 2008;105:2266–2270. doi: 10.1073/pnas.0707666105. [DOI] [PMC free article] [PubMed] [Google Scholar]
- 24.Madelin G, Regatte RR. Biomedical applications of sodium MRI in vivo. J Magn Reson Imaging. 2013;38:511–529. doi: 10.1002/jmri.24168. [DOI] [PMC free article] [PubMed] [Google Scholar]
- 25.Pakin SK, Xu J, Schweitzer ME, Regatte RR. Rapid 3D-T1rho mapping of the knee joint at 3. 0T with parallel imaging. Magn Reson Med. 2006;56:563–571. doi: 10.1002/mrm.20982. [DOI] [PubMed] [Google Scholar]
- 26.Pakin SK, Schweitzer ME, Regatte RR. 3D-T1ρ quantitation of patellar cartilage at 3. 0T. J Magn Reson Imaging. 2006;24:1357–1363. doi: 10.1002/jmri.20733. [DOI] [PubMed] [Google Scholar]
- 27.Akella SVS, Regatte RR, Gougoutas AJ, et al. Proteoglycan-induced changes in T1ρ-relaxation of articular cartilage at 4T. Magn Reson Med. 2001;46:419–423. doi: 10.1002/mrm.1208. [DOI] [PubMed] [Google Scholar]
- 28.Duvvuri U, Charagundla SR, Kudchodkar SB, et al. Human knee: in vivo T1(rho)-weighted MR imaging at 1. 5 T-preliminary experience. Radiology. 2001;220:822–826. doi: 10.1148/radiol.2203001662. [DOI] [PubMed] [Google Scholar]
- 29.Duvvuri U, Reddy R, Patel SD, Kaufman JH, Kneeland JB, Leigh JS. T1rho-relaxation in articular cartilage: effects of enzymatic degradation. Magn Reson Med. 1997;38:863–867. doi: 10.1002/mrm.1910380602. [DOI] [PubMed] [Google Scholar]
- 30.Regatte RR, Akella SV, Borthakur A, Kneeland JB, Reddy R. In vivo proton MR three-dimensional T1rho mapping of human articular cartilage: initial experience. Radiology. 2003;229:269–274. doi: 10.1148/radiol.2291021041. [DOI] [PubMed] [Google Scholar]
- 31.Redfield AG. Nuclear magnetic resonance saturation and rotary saturation in solids. Phys Rev. 1955;98:1787–1809. [Google Scholar]
- 32.Link TM. Cartilage Imaging. New York: Springer; 2011. [Google Scholar]
- 33.Charagundla SR. T1rho-weighted magnetic resonance imaging: Principles and diagnostic application. Applied Radiology. 2003;33:32–43. [Google Scholar]
- 34.Regatte RR, Akella SVS, Wheaton AJ, et al. 3D-T1ρ-relaxation mapping of articular cartilage: In vivo assesment of early degenerative changes in symptomatic osteoarthiritic subjects. Acad Radiol. 2004;11:741–749. doi: 10.1016/j.acra.2004.03.051. [DOI] [PubMed] [Google Scholar]
- 35.Regatte RR, Schweitzer ME. Novel contrast mechanisms at 3 tesla and 7 tesla. Semin Musculoskelet Radiol. 2008;12:266–280. doi: 10.1055/s-0028-1083109. [DOI] [PMC free article] [PubMed] [Google Scholar]
- 36.Stahl R, Luke A, Li X, et al. T1rho, T2 and focal knee cartilage abnormalities in physically active and sedentary healthy subjects versus early OA patients--a 3. 0-Tesla MRI study. Eur Radiol. 2009;19:132–143. doi: 10.1007/s00330-008-1107-6. [DOI] [PubMed] [Google Scholar]
- 37.Akella SV, Regatte RR, Wheaton AJ, Borthakur A, Reddy R. Reduction of residual dipolar interaction in cartilage by spin-lock technique. Magn Reson Med. 2004;52:1103–1109. doi: 10.1002/mrm.20241. [DOI] [PubMed] [Google Scholar]
- 38.Wang L, Chang G, Xu J, et al. T1rho MRI of Menisci and Cartilage in Patients with Mild and Severe Osteoarthritis at 3T. Eur J Radiol. 2012;81:2329–2336. doi: 10.1016/j.ejrad.2011.07.017. [DOI] [PMC free article] [PubMed] [Google Scholar]
- 39.Borthakur A, Wheaton A, Charagundla SR, et al. Three-dimensional T1rho-weighted MRI at 1. 5 Tesla. J Magn Reson Imaging. 2003;17:730–736. doi: 10.1002/jmri.10296. [DOI] [PubMed] [Google Scholar]
- 40.Wheaton AJ, Borthakur A, Kneeland JB, Regatte RR, Akella SV, Reddy R. In vivo quantification of T1rho using a multislice spin-lock pulse sequence. Magn Reson Med. 2004;52:1453–1458. doi: 10.1002/mrm.20268. [DOI] [PubMed] [Google Scholar]
- 41.Wheaton AJ, Casey FL, Gougoutas AJ, et al. Correlation of T1rho with fixed charge density in cartilage. J Magn Reson Imaging. 2004;20:519–525. doi: 10.1002/jmri.20148. [DOI] [PubMed] [Google Scholar]
- 42.Li X, Han ET, Ma CB, Link TM, Newitt DC, Majumdar S. In vivo 3T spiral imaging based multi-slice T(1rho) mapping of knee cartilage in osteoarthritis. Magn Reson Med. 2005;54:929–936. doi: 10.1002/mrm.20609. [DOI] [PubMed] [Google Scholar]
- 43.Witschey WR, Borthakur A, Elliott MA, et al. T1rho-prepared balanced gradient echo for rapid 3D T1rho MRI. J Magn Reson Imaging. 2008;28:744–754. doi: 10.1002/jmri.21444. [DOI] [PMC free article] [PubMed] [Google Scholar]
- 44.Du J, Carl M, Diaz E, et al. Ultrashort TE T1rho (UTE T1rho) imaging of the Achilles tendon and meniscus. Magn Reson Med. 2010;64:834–842. doi: 10.1002/mrm.22474. [DOI] [PubMed] [Google Scholar]
- 45.Reddy R, Stolpen AH, Leigh JS. Detection of 17O by proton T1rho dispersion imaging. J Magn Reson B. 1995;108:276–279. doi: 10.1006/jmrb.1995.1133. [DOI] [PubMed] [Google Scholar]
- 46.Mulkern RV, Patz S, Brooks M, Metcalf DC, Jolesz FA. Spin-lock techniques and CPMG imaging sequences: a critical appraisal of T1p contrast at 0. 15 T. Magn Reson Imaging. 1989;7:437–444. doi: 10.1016/0730-725x(89)90398-6. [DOI] [PubMed] [Google Scholar]
- 47.Aronen HJ, Ramadan UA, Peltonen TK, et al. 3D spin-lock imaging of human gliomas. Magn Reson Imaging. 1999;17:1001–1010. doi: 10.1016/s0730-725x(99)00041-7. [DOI] [PubMed] [Google Scholar]
- 48.Buck FM, Bae WC, Diaz E, et al. Comparison of T1rho measurements in agarose phantoms and human patellar cartilage using 2D multislice spiral and 3D magnetization prepared partitioned k-space spoiled gradient-echo snapshot techniques at 3 T. AJR Am J Roentgenol. 2011;196:W174–179. doi: 10.2214/AJR.10.4570. [DOI] [PMC free article] [PubMed] [Google Scholar]
- 49.Witschey WR, Borthakur A, Elliott MA, et al. Spin-locked balanced steady-state free-precession (slSSFP) Magn Reson Med. 2009;62:993–1001. doi: 10.1002/mrm.22092. [DOI] [PMC free article] [PubMed] [Google Scholar]
- 50.Dixon WT, Oshinski JN, Trudeau JD, Arnold BC, Pettigrew RI. Myocardial suppression in vivo by spin locking with composite pulses. Magn Reson Med. 1996;36:90–94. doi: 10.1002/mrm.1910360116. [DOI] [PubMed] [Google Scholar]
- 51.La Rocca Vieira R, Pakin SK, de Albuquerque Cavalcanti CF, Schweitzer M, Regatte R. Three-dimensional spin-lock magnetic resonance imaging of the shoulder joint at 3T: initial experience. Skeletal Radiol. 2007;36:1171–1175. doi: 10.1007/s00256-007-0368-5. [DOI] [PubMed] [Google Scholar]
- 52.Regatte RR, Akella SVS, Borthakur A, Kneeland JB, Reddy R. Proteoglycan Depletion–induced Changes in Transverse Relaxation Maps of Cartilage: Comparison of T2 and T1ρ. Acad Radiol. 2002;9:1388–1394. doi: 10.1016/s1076-6332(03)80666-9. [DOI] [PubMed] [Google Scholar]
- 53.Regatte RR, Akella SVS, Lonner JH, Kneeland JB, Reddy R. T1ρ Relaxation Mapping in Human Osteoarthritis (OA) Cartilage: Comparison of T1ρ With T2. J Magn Reson Imaging. 2006;23:547–553. doi: 10.1002/jmri.20536. [DOI] [PubMed] [Google Scholar]
- 54.Regatte RR, Akella SVS, Borthakur A, Reddy R. Proton Spin-Lock Ratio Imaging for Quantitation of Glycosaminoglycans in Articular Cartilage. J Magn Reson Imaging. 2003;17:114–121. doi: 10.1002/jmri.10228. [DOI] [PubMed] [Google Scholar]
- 55.Taylor C, Carballido-Gamio J, Majumdar S, Li X. Comparison of quantitative imaging of cartilage for osteoarthritis: T2, T1ρ, dGEMRIC and contrast-enhanced computed tomography. Magn Reson Imaging. 2009;27:779–784. doi: 10.1016/j.mri.2009.01.016. [DOI] [PMC free article] [PubMed] [Google Scholar]
- 56.Koskinen SK, Ylä-Outinen H, Aho HJ, Komu MES. Magnetization Transfer and Spin Lock MR Imaging of Patellar Cartilage Degeneration at 1. 0T. Acta Radiol. 1997;38:1071–1075. doi: 10.1080/02841859709172133. [DOI] [PubMed] [Google Scholar]
- 57.Wheaton AJ, Dodge GR, Elliott DM, Nicoll SB, Reddy R. Quantification of Cartilage Biomechanical and Biochemical Properties via T1ρ Magnetic Resonance Imaging. Magn Reson Imaging. 2005;54:1087–1093. doi: 10.1002/mrm.20678. [DOI] [PubMed] [Google Scholar]
- 58.Duvvuri U, Kudchodkar S, Reddy R, Leigh JS. T1ρ relaxation can assess longitudinal proteoglycan loss from articular cartilage in vitro. Osteoarthr Cartilage. 2002;10:838–844. doi: 10.1053/joca.2002.0826. [DOI] [PubMed] [Google Scholar]
- 59.Menezes NM, Gray ML, Hartke JR, Burstein D. T2 and T1rho MRI in articular cartilage systems. Magn Reson Med. 2004;51:503–509. doi: 10.1002/mrm.10710. [DOI] [PubMed] [Google Scholar]
- 60.Mlynárik V, Trattnig S, Huber M, Zembsch A, Imhof H. The Role of Relaxation Times in Monitoring Proteoglycan Depletion in Articular Cartilage. J Magn Reson Imaging. 1999;10:497–502. doi: 10.1002/(sici)1522-2586(199910)10:4<497::aid-jmri1>3.0.co;2-t. [DOI] [PubMed] [Google Scholar]
- 61.Crema MD, Roemer FW, Marra MD, et al. Articular Cartilage in the Knee: Current MR Imaging Techniques and Applications in Clinical Practice and Research. RadioGraphics. 2011;31:37–62. doi: 10.1148/rg.311105084. [DOI] [PMC free article] [PubMed] [Google Scholar]
- 62.Lozano J, Li X, Link TM, Safran M, Majumdar S, Ma CB. Detection of Posttraumatic Cartilage Injury Using Quantitative T1rho Magnetic Resonance Imaging. A Report of Two Cases With Arthroscopic Findings. J Bone Joint Surg Am. 2006;88:1349–1352. doi: 10.2106/JBJS.E.01051. [DOI] [PubMed] [Google Scholar]
- 63.Wang L, La Rocca Vieira R, Rybak LD, et al. Relationship between Knee Alignment and T1rho Values of Articular Cartilage and Menisci in Patients with Knee Osteoarthritis. Eur J Radiol. 2013;82:1946–1952. doi: 10.1016/j.ejrad.2013.05.010. [DOI] [PMC free article] [PubMed] [Google Scholar]
- 64.Wang L, Regatte RR. Quantitative Mapping of Human Cartilage at 3. 0T: Parallel Changes in T2, T1ρ, and dGEMRIC. Acad Radiol. 2014;21:463–471. doi: 10.1016/j.acra.2013.12.010. [DOI] [PMC free article] [PubMed] [Google Scholar]
- 65.Goto H, Iwama Y, Fujii M, et al. A Preliminary Study of the T1rho Values of Normal Knee Cartilage Using 3T-MRI. Eur J Radiol. 2012;81:e796–e803. doi: 10.1016/j.ejrad.2012.03.022. [DOI] [PubMed] [Google Scholar]
- 66.Goto H, Iwama Y, Fujii M, et al. The Natural Degeneration Course in the T1rho Values of Normal Knee Cartilage. Kobe J Med Sci. 2011;57:e155–e170. [PubMed] [Google Scholar]
- 67.Souza RB, Feeley BT, Zarins ZA, Link TM, Li X, Majumdar S. T1rho MRI relaxation in knee OA subjects with varying sizes of cartilage lesions. Knee. 2013;20:113–119. doi: 10.1016/j.knee.2012.10.018. [DOI] [PMC free article] [PubMed] [Google Scholar]
- 68.Li X, Pai A, Blumenkrantz G, et al. Spatial Distribution and Relationship of T1rho and T2 Relaxation Times in Knee Cartilage With Osteoarthritis. Magn Reson Imaging. 2009;61:1310–1318. doi: 10.1002/mrm.21877. [DOI] [PMC free article] [PubMed] [Google Scholar]
- 69.Li X, Benjamin Ma C, Link TM, et al. In vivo T(1rho) and T(2) mapping of articular cartilage in osteoarthritis of the knee using 3T MRI. Osteoarthr Cartilage. 2007;15:789–797. doi: 10.1016/j.joca.2007.01.011. [DOI] [PMC free article] [PubMed] [Google Scholar]
- 70.Li X, Han ET, Busse RF, Majumdar S. In Vivo T1ρ Mapping in Cartilage Using 3D Magnetization-Prepared Angle-Modulated Partitioned k-Space Spoiled Gradient Echo Snapshots (3D MAPSS) Magn Reson Med. 2008;59:298–307. doi: 10.1002/mrm.21414. [DOI] [PMC free article] [PubMed] [Google Scholar]
- 71.Link TM, Stahl R, Woertler K. Cartilage imaging: motivation, techniques, current and future significance. Eur Radiol. 2007;17:1135–1146. doi: 10.1007/s00330-006-0453-5. [DOI] [PubMed] [Google Scholar]
- 72.Bolbos RI, Zuo J, Banerjee S, et al. Relationship between trabecular bone structure and articular cartilage morphology and relaxation times in early OA of the knee joint using parallel MRI at 3T. Osteoarthr Cartilage. 2008;16:1150–1159. doi: 10.1016/j.joca.2008.02.018. [DOI] [PMC free article] [PubMed] [Google Scholar]
- 73.Helms CA. The Meniscus: Recent Advances in MR Imaging of the Knee. Am J Roentgenol. 2002;179:1115–1122. doi: 10.2214/ajr.179.5.1791115. [DOI] [PubMed] [Google Scholar]
- 74.Zarins ZA, Bolbos RI, Pialat JB. Cartilage and Meniscus Assessment Using T1rho and T2 Measurements in Healthy Subjects and Patients with Osteoarthritis. Osteoarthr Cartilage. 2010;18:1408–1416. doi: 10.1016/j.joca.2010.07.012. [DOI] [PMC free article] [PubMed] [Google Scholar]
- 75.Rauscher I, Stahl R, Cheng J, et al. Meniscal measurements of T1rho and T2 at MR imaging in healthy subjects and patients with osteoarthritis. Radiology. 2008;249:591–600. doi: 10.1148/radiol.2492071870. [DOI] [PMC free article] [PubMed] [Google Scholar]
- 76.Son M, Goodman SB, Chen W, Hargreaves BA, Gold GE, Levenston ME. Regional variation in T1rho and T2 times in osteoarthritic human menisci: correlation with mechanical properties and matrix composition. Osteoarthr Cartilage. 2013;21:796–805. doi: 10.1016/j.joca.2013.03.002. [DOI] [PMC free article] [PubMed] [Google Scholar]
- 77.Bolbos RI, Link TM, Ma CB, Majumdar S, Li X. T1rho relaxation time of the meniscus and its relationship with T1rho of adjacent cartilage in knees with acute ACL injuries at 3T. Osteoarthr Cartilage. 2009;17:12–18. doi: 10.1016/j.joca.2008.05.016. [DOI] [PMC free article] [PubMed] [Google Scholar]
- 78.Wang L, Chang G, Bencardino J, et al. T1rho MRI of Menisci in Patients with Osteoarthritis at 3 Tesla: A preliminary Study. J Magn Reson Imaging. doi: 10.1002/jmri.24437. [DOI] [PMC free article] [PubMed] [Google Scholar]
- 79.Lohmander LS, Englund PM, Dahl LL, Roos EM. The Long-term Consequence of Anterior Cruciate Ligament and Meniscus Injuries: Osteoarthritis. Am J Sports Med. 2007;35:1756–1769. doi: 10.1177/0363546507307396. [DOI] [PubMed] [Google Scholar]
- 80.Lohmander LS, Ostenberg A, Englund M, Roos H. High prevalence of knee osteoarthritis, pain, and functional limitations in female soccer players twelve years after anterior cruciate ligament injury. Arthritis Rheum. 2004;50:3145–3152. doi: 10.1002/art.20589. [DOI] [PubMed] [Google Scholar]
- 81.von Porat A, Roos EM, Roos H. High prevalence of osteoarthritis 14 years after an anterior cruciate ligament tear in male soccer players: a study of radiographic and patient-relevant outcomes. Ann Rheum Dis. 2004;63:269–273. doi: 10.1136/ard.2003.008136. [DOI] [PMC free article] [PubMed] [Google Scholar]
- 82.Daniel DM, Stone ML, Dobson BE, Fithian DC, Rossman DJ, Kaufman KR. Fate of the ACL-injured patient. A prospective outcome study. Am J Sports Med. 1994;22:632–644. doi: 10.1177/036354659402200511. [DOI] [PubMed] [Google Scholar]
- 83.Andreiseky G, Whitey LM, Sussman MS, et al. Quantitative MR imaging evaluation of the cartilage thickness and subchondral bone area in patients with ACL-reconstructions 7 years after surgery. Osteoarthr Cartilage. 2009;17:871–878. doi: 10.1016/j.joca.2008.05.024. [DOI] [PubMed] [Google Scholar]
- 84.Nishioka H, Hirose J, Nakamura E, et al. Detecting ICRS grade 1 cartilage lesions in anterior cruciate ligamentinjury using T1rho and T2 mapping. Eur J Radiol. 2013;82:1499–1505. doi: 10.1016/j.ejrad.2013.04.038. [DOI] [PubMed] [Google Scholar]
- 85.Li X, Kuo D, Theologis A, et al. Cartilage in Anterior Cruciate Ligament–Reconstructed Knees: MR Imaging T1ρ and T2—Initial Experience with 1-year Follow-up. Radiology. 2011;258:505–514. doi: 10.1148/radiol.10101006. [DOI] [PMC free article] [PubMed] [Google Scholar]
- 86.Li X, Ma BC, Bolbos RI. Quantitative Assessment of Bone Marrow Edema-Like Lesion and Overlying Cartilage in Knees with Osteoarthritis and Anterior Cruciate Ligament Tear Using MR Imaging and Spectroscopic Imaging at 3 Tesla. J Magn Reson Imaging. 2008;28:453–461. doi: 10.1002/jmri.21437. [DOI] [PMC free article] [PubMed] [Google Scholar]
- 87.Nieminen MT, Nissi MJ, Mattila L, Kiviranta I. Evaluation of chondral repair using quantitative MRI. J Magn Reson Imaging. 2012;36:1287–1299. doi: 10.1002/jmri.23644. [DOI] [PubMed] [Google Scholar]
- 88.Holtzman DJ, Theologis AA, Carballido-Gamio J, Majumdar S, Li X, Benjamin C. T(1rho) and T(2) quantitative magnetic resonance imaging analysis of cartilage regeneration following microfracture and mosaicplasty cartilage resurfacing procedures. J Magn Reson Imaging. 2010;32:914–923. doi: 10.1002/jmri.22300. [DOI] [PMC free article] [PubMed] [Google Scholar]
- 89.Theologis AA, Schairer WW, Carballido-Gamio J, Majumdar S, Li X, Ma CB. Longitudinal analysis of T1rho andT2 quantitative MRI of knee cartilage laminar organization following microfracture surgery. Knee. 2012;19:652–657. doi: 10.1016/j.knee.2011.09.004. [DOI] [PMC free article] [PubMed] [Google Scholar]
- 90.Jungmann PM, Li X, Nardo L, et al. Do cartilage repair procedures prevent degenerative meniscus changes?: Longitudinal T1rho and morphological evaluation with 3. 0-T MRI. Am J Sports Med. 2012;40:2700–2708. doi: 10.1177/0363546512461594. [DOI] [PMC free article] [PubMed] [Google Scholar]
- 91.Haughom B, Schairer W, Souza RB, Carpenter D, Ma CB, Li X. Abnormal tibiofemoral kinematics following ACL reconstruction are associated with early cartilage matrix degeneration measured by MRI T1rho. Knee. 2012;19:482–487. doi: 10.1016/j.knee.2011.06.015. [DOI] [PMC free article] [PubMed] [Google Scholar]
- 92.Theologis AA, Kuo D, Cheng J, et al. Evaluation of bone bruises and associated cartilage in anterior cruciate ligament-injured and reconstructed knees using quantitative T(1rho) magnetic resonance imaging: 1-year cohort study. Arthroscopy. 2011;27:65–76. doi: 10.1016/j.arthro.2010.06.026. [DOI] [PMC free article] [PubMed] [Google Scholar]
- 93.Su F, Hilton JF, Nardo L, et al. Cartilage morphology and T1ρ and T2 quantification in ACL reconstructed knees: A 2-year follow-up. Osteoarthr Cartilage. 2013;21:1058–1067. doi: 10.1016/j.joca.2013.05.010. [DOI] [PMC free article] [PubMed] [Google Scholar]
- 94.Theologis AA, Haughom B, Liang F, et al. Comparison of T1rho relaxation times between ACL-reconstructed knees and contralateral uninjured knees. Knee Surg Sports Traumatol Arthrosc. 2014;22:298–307. doi: 10.1007/s00167-013-2397-z. [DOI] [PMC free article] [PubMed] [Google Scholar]
- 95.Takayama Y, Hatakenaka M, Tsushima H, et al. T1ρ is superior to T2 mapping for the evaluation of articular cartilage denaturalization with osteoarthritis: radiological-pathological correlation after total knee arthroplasty. Eur J Radiol. 2013;82:e192–8. doi: 10.1016/j.ejrad.2012.11.031. [DOI] [PubMed] [Google Scholar]
- 96.Klocke NF, Amendola A, Thedens DR, et al. Comparison of T1ρ, dGEMRIC, and quantitative T2 MRI in preoperative ACL rupture patients. Acad Radiol. 2013;20:99–107. doi: 10.1016/j.acra.2012.07.009. [DOI] [PMC free article] [PubMed] [Google Scholar]
- 97.Wang L, Chang G, Bencardino J, et al. T1rho MRI at 3T of menisci in patients with acute anterior cruciate ligament (ACL) injury. J Magn Reson Imaging. 2014 Feb 26; doi: 10.1002/jmri.24594. [DOI] [PubMed] [Google Scholar]
- 98.Mosher TJ, Zhang Z, Reddy R, et al. Knee articular cartilage damage in osteoarthritis: analysis of MR image biomarker reproducibility in ACRIN-PA 4001 multicenter trial. Radiology. 2011;258:832–842. doi: 10.1148/radiol.10101174. [DOI] [PMC free article] [PubMed] [Google Scholar]
- 99.Sankar WN, Arden N, Kim YJ, et al. Staging of hip osteoarthritis for clinical trials on femoroacetabular impingement. J Am Acad Orthop Surg. 2013;21 (Suppl 1):S33–8. doi: 10.5435/JAAOS-21-07-S33. [DOI] [PubMed] [Google Scholar]
- 100.Kim YJ. Novel cartilage imaging techniques for hip disorders. Magn Reson Imaging Clin N Am. 2013;21:35–44. doi: 10.1016/j.mric.2012.09.003. [DOI] [PubMed] [Google Scholar]
- 101.Subburaj K, Valentinitsch A, Dillon AB, et al. Regional variations in MR relaxation of hip joint cartilage in subjects with and without femoralacetabular impingement. Magn Reson Imaging. 2013;31:1129–1136. doi: 10.1016/j.mri.2013.01.009. [DOI] [PMC free article] [PubMed] [Google Scholar]
- 102.Rakhra KS, Lattanzio PJ, Cárdenas-Blanco A, Cameron IG, Beaulé PE. Can T1-rho MRI detect acetabular cartilage degeneration in femoroacetabular impingement?: a pilot study. J Bone Joint Surg Br. 2012;94:1187–1192. doi: 10.1302/0301-620X.94B9.29981. [DOI] [PubMed] [Google Scholar]
- 103.Beaulé PE, Kim YJ, Rakhra KS, Stelzeneder D, Brown TD. New frontiers in cartilage imaging of the hip. Instr Course Lect. 2012;61:253–262. [PubMed] [Google Scholar]
- 104.Carballido-Gamio J, Link TM, Li X, et al. Feasibility and reproducibility of relaxometry, morphometric, and geometrical measurements of the hip joint with magnetic resonance imaging at 3T. J Magn Reson Imaging. 2008;28:227–235. doi: 10.1002/jmri.21411. [DOI] [PubMed] [Google Scholar]
- 105.Akella SVS, Regatte RR, Borthakur A, Kneeland JB, Leigh JS, Reddy R. T1rho MR Imaging of the Human Wrist in Vivo. Acad Radiol. 2003;10:614–619. doi: 10.1016/s1076-6332(03)80079-x. [DOI] [PubMed] [Google Scholar]
- 106.Wang C, Auerbach JD, Witschey WR, Balderston RA, Reddy R, Borthakur A. Advances in Magnetic Resonance Imaging for the assessment of degenerative disc disease of the lumbar spine. Semin Spine Surg. 2007;19:65–71. doi: 10.1053/j.semss.2007.04.009. [DOI] [PMC free article] [PubMed] [Google Scholar]
- 107.Blumenkrantz G, Li X, Han ET, et al. A feasibility study of in vivo T1rho imaging of the intervertebral disc. Magn Reson Imaging. 2006;24:1001–1007. doi: 10.1016/j.mri.2006.04.013. [DOI] [PubMed] [Google Scholar]
- 108.Auerbach JD, Johannessen W, Borthakur A, et al. In vivo quantification of human lumbar disc degeneration using T1rho-weighted magnetic resonance imaging. Eur Spine J. 2006;15 (Suppl 3):S338–S344. doi: 10.1007/s00586-006-0083-2. [DOI] [PMC free article] [PubMed] [Google Scholar]
- 109.Johannessen W, Auerbach JD, Wheaton AJ, et al. Assessment of human disc degeneration and proteoglycan content using T1rho-weighted magnetic resonance imaging. Spine (Phila Pa 1976) 2006;31:1253–1257. doi: 10.1097/01.brs.0000217708.54880.51. [DOI] [PMC free article] [PubMed] [Google Scholar]
- 110.Zuo J, Joseph GB, Li X, et al. In vivo intervertebral disc characterization using magnetic resonance spectroscopy and T1rho imaging: association with discography and Oswestry Disability Index and Short Form-36 Health Survey. Spine (Phila Pa 1976) 2012;37:214–221. doi: 10.1097/BRS.0b013e3182294a63. [DOI] [PMC free article] [PubMed] [Google Scholar]
- 111.Lamminen AE, Tanttu JI, Sepponen RE, Pihko H, Korhola OA. T1ho dispersion imaging of diseased tissue. Br J Radiol. 1993;66:783–787. doi: 10.1259/0007-1285-66-789-783. [DOI] [PubMed] [Google Scholar]
- 112.Rommel E, Kimmich R. T1rho Dispersion Imaging and Volume-Selective T1rho Dispersion Weighted NMR Spectroscopy. Magn Reson Imaging. 1989;12:390–399. doi: 10.1002/mrm.1910120312. [DOI] [PubMed] [Google Scholar]
- 113.Virta A, Komu M, Lundbom N, Kormano M. T1rho MR Imaging Characteristics of Human Anterior Tibial and Gastrocnemius Muscles. Acad Radiol. 1998;5:104–110. doi: 10.1016/s1076-6332(98)80130-x. [DOI] [PubMed] [Google Scholar]
- 114.Santyr GE, Henkelman RM, Bronskill MJ. Spin locking for magnetic resonance imaging with application to human breast. Magn Reson Med. 1989;12:25–37. doi: 10.1002/mrm.1910120104. [DOI] [PubMed] [Google Scholar]
- 115.Markkola AT, Aronen HJ, Paavonen T, et al. T1rho dispersion imaging of head and neck tumors: a comparison to spin lock and magnetization transfer techniques. J Magn Reson Imaging. 1997;7:873–879. doi: 10.1002/jmri.1880070516. [DOI] [PubMed] [Google Scholar]
- 116.Grohn OHJ, Kettunen MI, Makela HI, et al. Early detection of irreversible cerebral ischemia in the rat using dispersion of the magnetic resonance imaging relaxation time, T1rho. J Cereb Blood Flow Metab. 2000;20:1457–1466. doi: 10.1097/00004647-200010000-00007. [DOI] [PubMed] [Google Scholar]
- 117.Poptani H, Duvvuri U, Miller CG, et al. T1rho imaging of murine brain tumors at 4 T. Acad Radiol. 2001;8:42–47. doi: 10.1016/S1076-6332(03)80742-0. [DOI] [PubMed] [Google Scholar]
- 118.Borthakur A, Wheaton AJ, Gougoutas AJ, et al. In vivo measurement of T1rho dispersion in the human brain at 1. 5 tesla. J Magn Reson Imaging. 2004;19:403–409. doi: 10.1002/jmri.20016. [DOI] [PubMed] [Google Scholar]
- 119.Halavaara JT, Sepponen RE, Lamminen AE, Vehmas T, Bondestam S. Spin Lock and Magnetization Transfer MR Imaging of Focal Liver Lesions. Magn Reson Imaging. 1998;16:359–364. doi: 10.1016/s0730-725x(97)00312-3. [DOI] [PubMed] [Google Scholar]
- 120.Borthakur A, Hulvershorn J, Gualtieri E, et al. A Pulse Sequence for Rapid In Vivo Spin-Locked MRI. J Magn Reson Imaging. 2006;23:591–596. doi: 10.1002/jmri.20537. [DOI] [PMC free article] [PubMed] [Google Scholar]
- 121.Borthakur A, Uryu K, Shively SB, et al. In Vivo T1ρ-weighted MRI of Amyloid Transgenic Mouse Model of Alzheimer’s Disease. Proc Intl Soc Mag Reson Med. 2003;11 [Google Scholar]
- 122.Haris M, Singh A, Cai K, et al. T1 ρ MRI in Alzheimer’s Disease: Detection of Pathological Changes in Medial Temporal Lobe. J Neuroimaging. 2011;21:e86–e90. doi: 10.1111/j.1552-6569.2010.00467.x. [DOI] [PMC free article] [PubMed] [Google Scholar]
- 123.Borthakur A, Sochor M, Davatzikos C, Trojanowski JQ, Clark CM. T1ρ MRI of Alzheimer’s disease. NeuroImage. 2008;41:1199–1205. doi: 10.1016/j.neuroimage.2008.03.030. [DOI] [PMC free article] [PubMed] [Google Scholar]
- 124.Rauscher I, Eiber M, Ganter C, et al. Evaluation of T1ρ as a potential MR biomarker for liver cirrhosis: Comparison of healthy control subjects and patients with liver cirrhosis. Eur J Radiol. 2014;83:900–904. doi: 10.1016/j.ejrad.2014.02.017. [DOI] [PubMed] [Google Scholar]
- 125.Allkemper T, Sagmeister F, Cicinnati V. Evaluation of Fibrotic Liver Disease with Whole-Liver T1ρ MR Imaging: A Feasibility Study at 1.5 T. Radiology. 2014;271:408–415. doi: 10.1148/radiol.13130342. [DOI] [PubMed] [Google Scholar]
- 126.Zhao F, Yuan J, Deng M, Lu PX, Ahuja AT, Wang YX. Further Exploration of MRI Techniques for Liver T1rho Quantification. Quant Imaging Med Surg. 2013;3:308–315. doi: 10.3978/j.issn.2223-4292.2013.12.10. [DOI] [PMC free article] [PubMed] [Google Scholar]
- 127.Zhao F, Deng M, Yuan J, Teng GJ, Ahuja AT, Wang YX. Experimental evaluation of accelerated T1rho relaxation quantification in human liver using limited spin-lock times. Korean J Radiol. 2012;13:736–742. doi: 10.3348/kjr.2012.13.6.736. [DOI] [PMC free article] [PubMed] [Google Scholar]
- 128.Zhao F, Wang YX, Yuan J, et al. MR T1ρ as an imaging biomarker for monitoring liver injury progression and regression: an experimental study in rats with carbon tetrachloride intoxication. Eur Radiol. 2012;22:1709–1716. doi: 10.1007/s00330-012-2419-0. [DOI] [PubMed] [Google Scholar]
- 129.Sirlin CB. Science to practice: Can T1rho imaging be used to diagnose and assess the severity of hepatic fibrosis? Radiology. 2011;259:619–620. doi: 10.1148/radiol.11110547. [DOI] [PubMed] [Google Scholar]
- 130.Wang YX, Yuan J, Chu ES, et al. T1rho MR imaging is sensitive to evaluate liver fibrosis: an experimental study in a rat biliary duct ligation model. Radiology. 2011;259:712–719. doi: 10.1148/radiol.11101638. [DOI] [PubMed] [Google Scholar]
- 131.Witschey WR, Zsido GA, Koomalsingh K, et al. In vivo chronic myocardial infarction characterization by spin locked cardiovascular magnetic resonance. J Cardiovasc Magn Reson. 2012 Jun 15;14:37. doi: 10.1186/1532-429X-14-37. [DOI] [PMC free article] [PubMed] [Google Scholar]
- 132.Markkola AT, Aronen HJ, Ramadan UA, Halavaara JT, Tanttu JI, Sepponen RE. Determination of T1rho values for head and neck tissues at 0. 1T: A comparison to T1 and T2 relaxation times. Mag Reson Imaging. 1998;16:377–383. doi: 10.1016/s0730-725x(98)00013-7. [DOI] [PubMed] [Google Scholar]
- 133.Muthupillai R, Flamm SD, Wilson JM, Pettigrew RI, Dixon WT. Acute myocardial infarction: tissue characterization with T1rho-weighted MR imaging--initial experience. Radiology. 2004;232:606–610. doi: 10.1148/radiol.2322030334. [DOI] [PubMed] [Google Scholar]
- 134.Haris M, Singh A, Cai K, et al. T1rho (T1ρ) MR imaging in Alzheimer’s disease and Parkinson’s disease with and without dementia. J Neurol. 2011;258(3):380–385. doi: 10.1007/s00415-010-5762-6. [DOI] [PMC free article] [PubMed] [Google Scholar]


