Abstract
Disassortative mixing is ubiquitously found in technological and biological networks, while the corresponding interpretation of its origin remains almost virgin. We here give evidence that pruning the largest-degree nodes of a growing scale-free network has the effect of decreasing the degree correlation coefficient in a controllable and tunable way, while keeping both the trait of a power-law degree distribution and the main properties of network's resilience and robustness under failures or attacks. The essence of these observations can be attributed to the fact the deletion of large-degree nodes affects the delicate balance of positive and negative contributions to degree correlation in growing scale-free networks, eventually leading to the emergence of disassortativity. Moreover, these theoretical prediction will get further validation in the empirical networks. We support our claims via numerical results and mathematical analysis, and we propose a generative model for disassortative growing scale-free networks.
Of the different ways in which a system made of many interacting units can be represented and analyzed, the one afforded by complex networks is among the most elegant and general. In the last years, complex networks1,2,3,4,5 have, indeed, provided a valuable representation of a wealth of natural and man-made systems, in fields as diverse as, amongst others, genetics, proteomics and metabolomics2, the study of neurological diseases6, transportation networks7 and theWorld Wide Web8. Specifically, it was found that the vast majority of real-world networks commonly features some properties in the structure of connections between the constituent elements: the so-called small-world property9, the scale-free (SF) character of the degree distribution (the degree of a node being the number of connections established by that node with the rest of the network)10, degree correlation and degree mixing11, and a modular and hierarchical organization12.
In particular, disassortative mixing is ubiquitously observed in biological and technological networks13, and corresponds to a negative degree-degree correlation, i.e. to the tendency of high (low) degree nodes to connect to nodes with low (high) degree. The large body of evidence of such a disassortative organization in real-world networks inherently raises the issue of unveiling the underlying mechanisms regulating the emergence of a such structural property, which, in turns, is known to considerably affect the organization of the network into collective dynamics, such as synchronization14, cooperation behavior15,16 and opinion formation17,18.
In the present work, we show how disassortative mixing emerges in growing SF networks by a simple mechanism in which the graph's nodes may die out during the growing process. As a reference, we consider the Barabási-Albert (BA) model of preferential attachment which is well known to induce a power-law distribution of node's connection degree10. However, the degree correlation of BA model is weak (actually it should be zero in the thermodynamic limit), and often ignored in the literatures4, so that simulations of dynamical processes on BA networks agree substantially with the mean field predictions19,20. Here we show that modifying the BA model with pruning just a tiny proportion of nodes leads to the emergence of substantial properties of negative degree-degree correlation, while the other main topological properties of the network (such as the power-law degree distribution and the size of the giant component) remains almost unaffected.
Results
Before exhibiting the formal results, it seems very instructive to describe the detailed definition of degree-degree correlation coefficient r, which is usually used to evaluate the mixing patterns of networks4. Similar to ref 11, its expression is given by
 |
where M denotes the total number of links in the network, ji and ki are the degrees of the vertices at both ends of the ith edge, and i = 1, 2, …, M.
Figure 1 reports on how the correlation coefficient r behaves as a function of the fraction of removed nodes f in the three different scenarios. One can easily see that when both the direct degree ranking and the random ranking are used for sequentially removing the nodes, the value of correlation coefficient r remains nearly unchanged, as compared to that of the original SF network. At variance, if the nodes are deleted according to the inverse degree ranking (from largest to smallest degrees), the value of r remarkably drops (for more details see also Figure S1 in Supporting Information). Eventually, at extremely small proportion of pruned nodes (f ~ 0.02), the correlation coefficient becomes substantially negative (~−0.23). Importantly, when the average degree and size of the BA networks are adjusted, similar observations are still obtained (see Figure S2 in Supporting Information), which thus suggests removing largest-degree nodes is robust in producing a disassortative mixing pattern in BA networks. Moreover, when examining the degree distribution of the pruned networks [Fig. 1(b)], one can observe that the power-law trait of degree distribution remains unchanged, the differences concentrating on the loss of largest-degree nodes produced by their progressive removal. In Figure S3 of Supporting Information we clarify that such a trend is, actually, proper of growing SF networks, as the scenario occurring for SF networks generated by the configuration model21 is very different. The observation is analogous to producing uncorrelated SF networks based on configuration model22,23, which possesses different bias with BA networks24.
Figure 1.
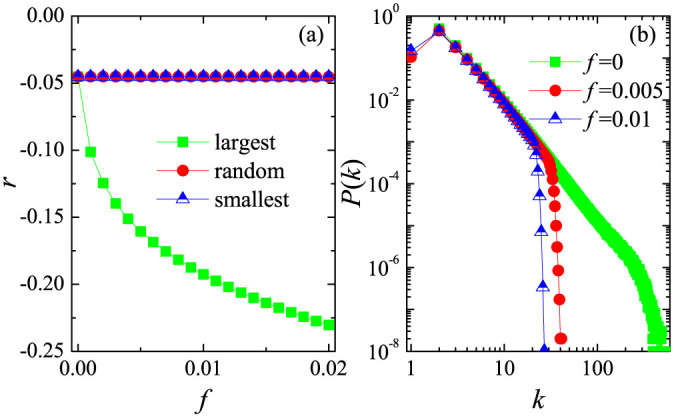
(a) The relation between degree correlation coefficient r and the fraction of removed nodes f. Deleting the largest-degree nodes dramatically decreases the degree correlation. (b) The degree distribution of the networks obtained by removing the largest-degree nodes at f = 0, 0.005, and 0.01. The size of original SF networks is N = 104, and the average degree 〈k〉 = 4. In all panels, data are ensemble averages over 104 independent realizations.
Based on the aforementioned observations, an interesting question naturally poses itself which we plan to address in the following. Namely, if we remove the largest-degree nodes in the empirical networks, how do the mixing patterns change? To answer this question, we repeat similar operations of Fig. 1 on World Wide Web (WWW) and Internet8,25,26, which, as typically technological networks, are famous for the property of power-law degree distribution. Figure 2 features the degree-degree correlation coefficient r in dependence on the fraction of removed nodes f for three different strategies. Though both networks initially possess disassortative mixing patterns, they still unveil qualitatively identical results as Fig. 1(a). It can be observed that removing nodes according to the direct degree ranking and the random ranking has negligible influence on mixing patterns of networks, but the case of inverse degree ranking makes the value of degree-degree correlation coefficient r quickly drop (even if extremely limited nodes are deleted). This empirical finding well validates the theoretical prediction. Combining these achievements, it is thus proved that pruning largest-degree nodes can be regarded as one universally effective method of producing a disassortative mixing pattern in growing SF networks. Here, it is also of particular interest to mention that pruning the largest-degree nodes enhances networks' randomness and make networks shift towards ones with maximum entropy, which is similar to the observation of directed networks27,28. In what follows, we will provide more explanations for this type of anticorrelated behavior.
Figure 2.
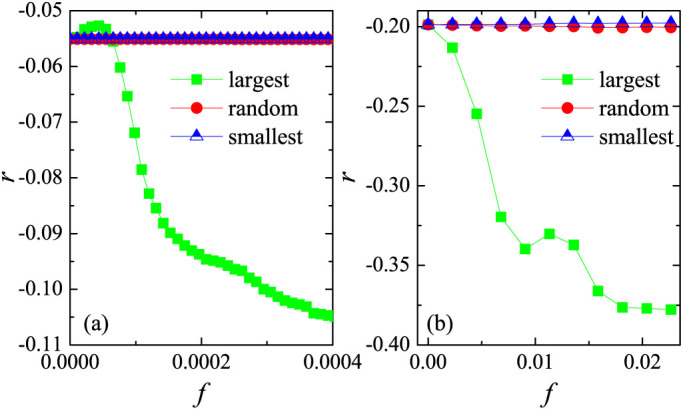
(a) Degree-degree correlation coefficient r in dependence on the fraction of removed nodes f for WorldWideWeb (WWW) (a) and Internet (b). It is clear that pruning a very small fraction of largest-degree nodes could heavily decrease the value of r, which is in agreement with the prediction in Fig. 1.
Furthermore, SF networks are usually vulnerable to attacks targeting the largest-degree nodes29. It is then instructive to monitor the impact of pruning such nodes on the giant connected component of the network. Figure 3(a) reports the size of the giant cluster S, normalized by the network size, and the mean size of other isolated clusters 〈s〉, versus the fraction of removed nodes f. With the increment of f, the giant cluster size S suffers just a very slight decline, while the mean size of isolated clusters remains close to 1.0. Besides, another typical property of complex networks is the clustering coefficient C9,30, which is used to measure the whole connection of networks. Figure 3(b) shows the variance of clustering coefficient C in dependence on the fraction of removed nodes f for three strategies. It is clear that pruning the largest-degree nodes obviously decreases the cluster coefficient C, which means that the fraction of connected triples of nodes decline. These results thus indicate that the disassortative SF networks, resulting from the deletion of largest-degree nodes, still consist of a unique giant cluster with size  , yet slightly low clustering coefficient.
Figure 3.
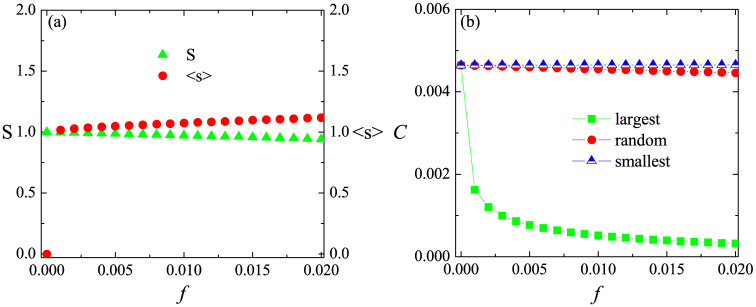
(a) Size of the giant connected component S (normalized to the network size), mean size of isolated clusters 〈s〉, and (b) clustering coefficient C, as functions of the fraction of removed nodes f. Here, it is worth mentioning that we focus on the case of pruning the largest-degree nodes in (a), yet provide a brief comparison of three strategies in (b). Same stipulations as in the Caption of Fig. 1.
In order to gather a deeper understanding of the mechanisms leading to the enhancement of degree correlation, we turn our attention to the average degree of the next neighbors of each network's node. Namely, we call  the degree of the nth neighbor of node i (the mean degree of the neighbors of node i). For degree uncorrelated networks,
  is equal to the average degree of the network, namely,
  . However, for a SF network grown by the BA model, the mean nearest-neighbors degree
  displays a fully non trivial behavior as a function of ki (see Fig. 4(a)). In particular, the average nearest-neighbors degree of large-degree nodes is well above the average degree of the network (red horizontal line in Fig. 4(a)), which means that large-degree nodes tend to connect with large-degree nodes rather than medium-degree (or small-degree) nodes. On its turn, this implies that large-degree nodes tend to contribute to an overall positive degree correlation, i.e., assortative mixing. On the other hand, also most of the small-degree nodes display a value of
  that is above that of 〈k〉, indicating that small-degree nodes are able to form connections with large-degree nodes, thus contributing to a sort of negative degree correlation, i.e., disassortative mixing. The delicate interplay between these two opposite tendencies is therefore responsible for the extremely week degree correlation of the overall network. The situation changes drastically for the network resulting from removing the largest-degree nodes [see Fig. 4(b)]. Now, the average nearest-neighbors degree of large-degree nodes oscillates around the average degree of networks, which implies that the initially positive degree correlation tendencies for these nodes is drastically reduced. As for the set of small-degree nodes, though the average degree of their nearest neighbors reduces a bit, yet they still unveil markedly negative degree correlation, and, as a result, the whole network displays a disassortative mixing pattern.
Figure 4. Mean nearest-neighbors degree  vs. the degree ki of the ith node for (a) BA networks and (b) the resulting disassortative networks when a fraction f = 0.02 of largest-degree nodes are removed.
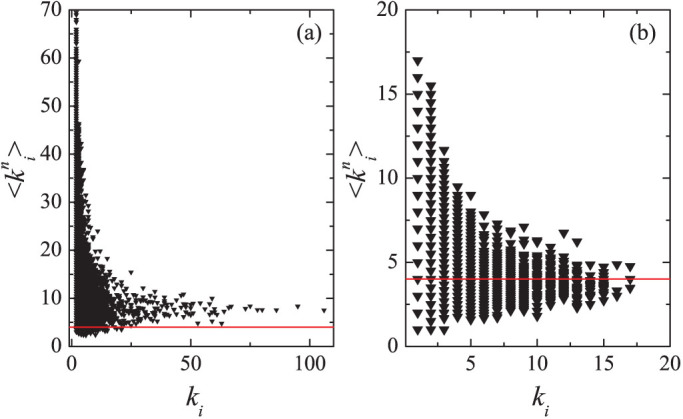
The horizontal red line indicates the average degree 〈k〉 = 4 of original BA networks. All results are obtained for networks with N = 103.
We move now to give a proper analytical ground to our numerical observations. Using the continuum theory10, one can formally derive the degree distribution  of the nearest neighbors of the largest-degree nodes. In BA networks, the time evolution of the degree ki is governed by the equation
 |
With initial condition ki(ti) = m (being ti is the time at which the node i enters into the network), the solution of the above equation is
 |
where β = 1/2. Thus the degree ki of node i evolves following a power law determined by the ratio t/ti.
Now, in order to derive the expression for  , we observe that, at the time at which node i is added to the network, the probability it forms a link with a node having degree kl(ti) is
 |
Thus, according to Eq. (3), we get
 |
The subsequent evolution of the degree of node i is given by
 |
Then, the probability that node i (as neighbor of one of the largest-degree nodes in the network) has a degree  smaller than k is
  , or, equivalently
 |
Finally, the distribution  can be obtained as
 |
The analytical expression for the distribution  is a power low function, with decaying exponent equal to 2, which is in remarkable agreement with the numerical results obtained by us for a finite size BA network, as shown in Fig. 5. As the decay of
  is more moderate than that of the degree distribution, this indicates that the neighborhoods of the largest-degree nodes in the network are mainly formed by other highly connected nodes.
Figure 5.  (see text for definition) and the degree distribution P(k) vs. the degree k.
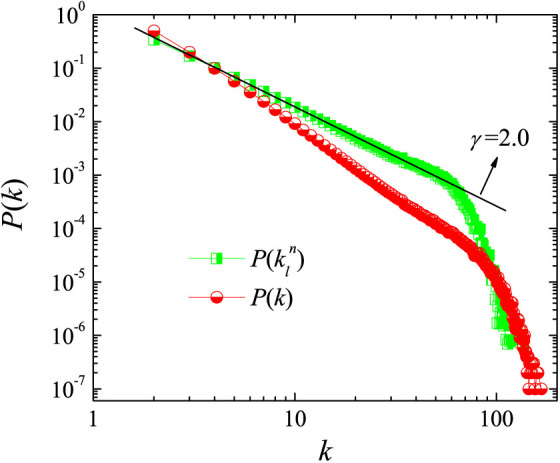
The straight line is drawn accordingly to the analytical predictions of Eq. (8). All results are obtained on BA networks with N = 103, 〈k〉 = 4.
The distribution  can be further used to derive the contribution to the correlation coefficient given by special network's nodes. The degree-degree correlation function is
  , where j and k represent the degree of both ends of one randomly selected edge, and the bar indicates an average over the edges. We also denote
  , where
  is the degree distribution of the ends of a randomly selected edge. Using P(k) = 2m2k−γ with γ = 3, we obtain E = m2(ln kl)2. The contribution to r from the node i (Ri, r = Σi
Ri), can be written as
 |
where  is the degree of the nearest neighbors of node i and M represents the number of edges (2M = Σi
ki). For the largest-degree nodes in the network, the neighbors' mean degree can be derived using the distribution
  . Correspondingly, one obtains
 |
From Eq. (10), it is easy to realize that the contribution to r of the largest-degree nodes R(kl) is positive, and therefore, once such nodes are pruned, the decline of the overall degree-degree correlation becomes a natural consequence.
All this set of evidences allows us to propose a generative model for scale-free networks with tunable and controllable levels of disassortativity. Namely, we modify the standard preferential attachment mechanism, and incorporate the possibility that, for technological and biological networks, the coalescence of each new node into the graph could imply a risk for the already existing structure of connections.
The latter can be realized in the following way. When a new link is formed during the preferential attachment growth, a random node of the existing network with degree larger than a given threshold kth is removed with a fixed probability p (in the following we assume p = 0.1). Fig. 6 reports how the correlation coefficient r for the resulting network depends on kth. Notice that the pruning process here gradually reduces the correlation coefficient and results in the generation of a disassortative mixing pattern associated with a scale-free degree distribution, as shown in the inset of Fig. 6.
Figure 6. The generative model for disassortative scale-free networks.
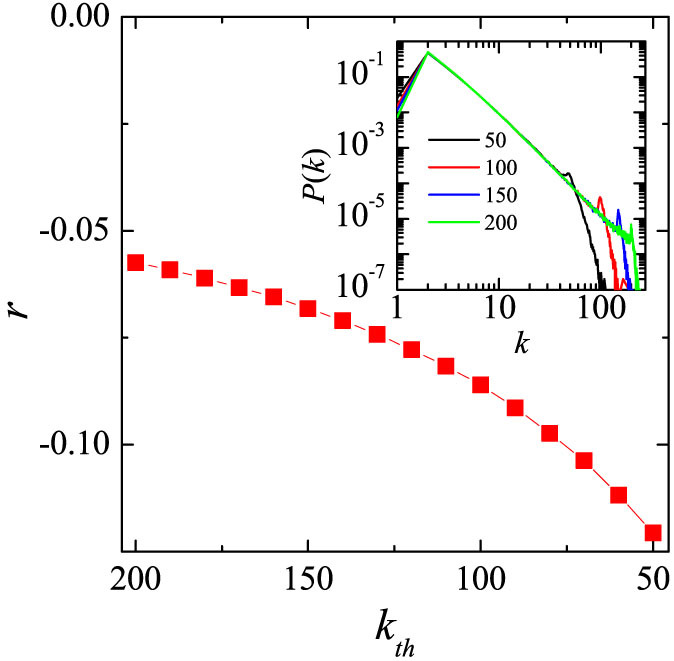
The vertical axis reports the degree correlation coefficient r, and the horizontal axis reports the degree threshold kth above which nodes are removed with probability p = 0.1 during the upgrowth process of networks. The inset reports the degree distributions for different threshold values. All results are obtained on networks with N = 104 and 〈k〉 = 4.
It is worth emphasizing that, at variance with the classical methods where correlation patterns are imprinted by rewiring processes on top of an already formed structure of connections11, here the proposed generative model leads to a tunable and controllable level of disassortative mixing, that however emerges spontaneously during the growth of the graph structure.
Discussion
In summary, we have studied the effect of pruning nodes on the degree correlation in growing scale-free networks. We gave evidence that removing largest-degree nodes remarkably reduces the degree-degree correlation (i.e., it imprints a disassortative mixing pattern) yet keeping a power-law character in the degree distribution, irrespective of whether the removal events take place during or after the growth of the network structure. Moreover, these theoretical observation can get further validation with empirical networks. Our results thus suggest that the negative correlation observed ubiquitously in technological and biological real-world networks can be the effect of spontaneous emergence, due to the possibility that largest-degree nodes are liable to dye out during the growing process of the network's structure.
Methods
Our first step is building a SF network in accordance with the Barabási-Albert algorithm10. Initially, we consider m0 > m fully connected nodes. Time is discrete, and at each step a new node is added, and forms m new links with existing nodes. The probability that a new node at time t establishes a connection with the existing ith node is given by ki(t)/[Σj kj(t)], where ki(t) is the number of connections the ith node forms, at time t, with the rest of the graph. After the network is grown, we start removing sequentially a fraction f of nodes from it. When a node is removed, all its incident links are also removed. As for the sequence of nodes that are being removed, we propose three different strategies: (i) following the inverse degree sequence, i.e. starting from the largest-degree nodes, (ii) following the direct degree sequence, i.e. starting from the smallest-degree nodes, and (iii) following a completely random sequence. As for the degree-degree correlation coefficient r11, its definition has been given in Results.
Author Contributions
S.J.W., Z.W., T.J. and S.B. planned the study, performed the experiments, analyzed the data, developed the theory and wrote the paper.
Supplementary Material
Emergence of disassortative mixing from pruning nodes in growing scale-free networks
Acknowledgments
This work was supported by the NSFC (Grant No. 11305098, 11147020 and 61374169), and the Fundamental Research Funds for the Central Universities (Grant No. GK201302008).
References
- Albert R. & Barabási A. L. Statistical mechanics of complex networks. Rev. Mod. Phys. 74, 47 (2002). [Google Scholar]
- Barabási A. L. & Oltvai Z. N. Network biology: understanding the cell's functional organization. Nat. Rev. Gen. 5, 101–113 (2004). [DOI] [PubMed] [Google Scholar]
- Boccaletti S. et al. The structure and dynamics of multilayer networks. Phys. Rep. in press (2014). [DOI] [PMC free article] [PubMed] [Google Scholar]
- Boccaletti S., Latora V., Moreno Y., Chavez M. & Hwang D. U. Complex networks: Structure and dynamics. Phys. Rep. 424, 175–308 (2006). [Google Scholar]
- Kim H., del Genio C. I., Bassler K. E. & Toroczkai Z. Constructing and sampling directed graphs with given degree sequences. New J. Phys. 14, 023012 (2012). [Google Scholar]
- Bullmore E. & Sporns O. Complex brain networks: graph theoretical analysis of structural and functional systems. Nat. Rev. Neurosci. 10, 186–198 (2009). [DOI] [PubMed] [Google Scholar]
- Cardillo A. et al. Emergence of network features from multiplexity. Sci. Rep. 3, 1344 (2013). [DOI] [PMC free article] [PubMed] [Google Scholar]
- Albert R., Jeong H. & Barabási A. L. Internet: Diameter of the world-wide web. Nature 401, 130–131 (1999). [Google Scholar]
- Watts D. J. & Strogatz S. H. Collective dynamics of ‘small-world' networks. Nature 393, 440–442 (1998). [DOI] [PubMed] [Google Scholar]
- Barabási A. L. & Albert R. Emergence of scaling in random networks. Science 286, 509–512 (1999). [DOI] [PubMed] [Google Scholar]
- Newman M. E. J. Assortative mixing in networks. Phys. Rev. Lett. 89, 208701 (2002). [DOI] [PubMed] [Google Scholar]
- Wang S. J. & Zhou C. S. Hierarchical modular structure enhances the robustness of self-organized criticality in neural networks. New J. Phys. 14, 023005 (2012). [Google Scholar]
- Newman M. E. J. The structure and function of complex networks. SIAM Rev. 45, 167 (2003). [Google Scholar]
- Sorrentino F., Di Bernardo M., Cuellar G. H. & Boccaletti S. Synchronization in weighted scale-free networks with degree-degree correlation. Physica D 224, 123–129 (2006). [Google Scholar]
- Perc M., Gómez-Gardeñes J., Szolnoki A., Floría L. M. & Moreno Y. Evolutionary dynamics of group interactions on structured populations: a review. J. R. Soc. Interface 10, 20120997 (2013). [DOI] [PMC free article] [PubMed] [Google Scholar]
- Wang S., Szalay M. S., Zhang C. & Csermely P. Learning and innovative elements of strategy adoption rules expand cooperative network topologies. PLoS ONE 3, e1917 (2008). [DOI] [PMC free article] [PubMed] [Google Scholar]
- Masuda N., Gibert N. & Redner S. Heterogeneous voter models. Phys. Rev. E 82, 010103(R) (2010). [DOI] [PubMed] [Google Scholar]
- Mobilia M. Does a Single Zealot Affect an Infinite Group of Voters? Phys. Rev. Lett. 91, 028701 (2003). [DOI] [PubMed] [Google Scholar]
- Pastor-Satorras R. & Vespignani A. Epidemic spreading in scale-free networks. Phys. Rev. Lett. 86, 3200 (2001). [DOI] [PubMed] [Google Scholar]
- Bar-Yam Y. & Epstein I. R. Response of complex networks to stimuli. Proc. Natl. Acad. Sci. U. S. A. 101, 4341 (2004). [DOI] [PMC free article] [PubMed] [Google Scholar]
- Bender E. A., Canfield E. & Combin J. The asymptotic number of labeled graphs with given degree sequences. J. Combin. Theory A 24, 296–307 (1978). [Google Scholar]
- Catanzaro M., Boguñá M. & Pastor-Satorras R. Generation of uncorrelated random scale-free networks. Phys. Rev. E 71, 027103 (2005). [DOI] [PubMed] [Google Scholar]
- del Genio C. I., Kim H., Toroczkai Z. & Bassler K. E. Efficient and exact sampling of simple graphs with given arbitrary degree sequence. PLoS ONE 5, e10012 (2010). [DOI] [PMC free article] [PubMed] [Google Scholar]
- Klein-Hennig H. & Hartmann A. K. Bias in generation of random graphs. Phys. Rev. E 85, 026101 (2012). [DOI] [PubMed] [Google Scholar]
- Chen Q. et al. The origin of power laws in Internet topologies revisited. In Proceedings of the 21st Annual Joint Conference of the IEEE Computer and Communications Societies: IEEE Computer Society., London. IEEE Computer Soc. Press (2002).
- Adamic L. A. & Huberman B. A. Power-Law Distribution of the World Wide Web. Science 287, 2115 (2000). [Google Scholar]
- Johnson S., Torres J. J., Marro J. & Muñoz M. A. The entropic origin of disassortativity in complex networks. Phys. Rev. Lett. 104, 108702 (2010). [DOI] [PubMed] [Google Scholar]
- Williams O. & del Genio C. I. Degree correlations in directed scale-free networks. PLoS ONE 9, e110121 (2014). [DOI] [PMC free article] [PubMed] [Google Scholar]
- Albert R., Jeong H. & Barabási A. L. Error and attack tolerance of complex networks. Nature 406, 378–382 (2000). [DOI] [PubMed] [Google Scholar]
- Alon A., Yuster R. & Zwick U. Finding and Counting Given Length Cycles. Algorithmica 17, 209–223 (1997). [Google Scholar]
Associated Data
This section collects any data citations, data availability statements, or supplementary materials included in this article.
Supplementary Materials
Emergence of disassortative mixing from pruning nodes in growing scale-free networks


