

Abstract
Quantification of mRNA in single cells provides direct insight into how intercellular heterogeneity plays a role in disease progression and outcomes. Quantitative polymerase chain reaction (qPCR), the current gold standard for evaluating gene expression, is insufficient for providing absolute measurement of single-cell mRNA transcript abundance. Challenges include difficulties in handling small sample volumes and the high variability in measurements. Microfluidic digital PCR provides far better sensitivity for minute quantities of genetic material, but the typical format of this assay does not allow for counting of the absolute number of mRNA transcripts samples taken from single cells. Furthermore, a large fraction of the sample is often lost during sample handling in microfluidic digital PCR. Here, we report the absolute quantification of single-cell mRNA transcripts by digital, one-step reverse transcription PCR in a simple microfluidic array device called the self-digitization (SD) chip. By performing the reverse transcription step in digitized volumes, we find that the assay exhibits a linear signal across a wide range of total RNA concentrations and agrees well with standard curve qPCR. The SD chip is found to digitize a high percentage (86.7%) of the sample for single-cell experiments. Moreover, quantification of transferrin receptor mRNA in single cells agrees well with single-molecule fluorescence in situ hybridization experiments. The SD platform for absolute quantification of single-cell mRNA can be optimized for other genes and may be useful as an independent control method for the validation of mRNA quantification techniques.
Intercellular heterogeneity plays a role in cell differentiation as well as disease development, progression, and remission or relapse in response to treatment.1−3 Studying mRNA expression at the single-cell level can provide a means to characterize variability in cellular activity and thus study disease etiology and pathology. Standard macroscale methods for quantitative assessment of gene expression are not designed to handle very small volumes and are limited by their sensitivity and accuracy when applied to single-cell analyses.4,5 In response to these challenges, various microfluidic platforms have been developed to measure gene expression in single cells using digital polmerase chain reaction (dPCR). High-throughput platforms, such as the BioMark HD system (Fluidigm), have provided a way to study expression levels of multiple genes in a set of single cells simultaneously.6 However, challenges persist in dealing with the technical variability in single-cell protocols, where uncertainty can be introduced from cell lysis, reverse transcription, preamplification, PCR, and other steps.7 It has been found that when performing microfluidic RNA quantification, using different reagents and protocols can give varying results for each step and that some methods do not work for certain genes.8 It has also been shown that when dealing with the small quantities of mRNA from a single cell, detection of mRNA transcripts at or below 102 copies per cell may be unreliable.9 This unreliability complicates the assessment of the biological variability within single cells and makes the comparison of different preparation methods impractical. Technical advancements are still needed in instances where sensitive and absolute measurement is necessary, such as single-cell gene expression measurements, and in validation of evolving quantitative or semiquantitative gene expression instrumentation.
Digital PCR has been used to perform highly accurate quantitation of DNA or cDNA,10−12 but RNA measurement requires reverse transcription (RT), an additional enzymatic reaction that can introduce error. RNA must be measured indirectly through enzyme-generated cDNA; the efficiency of this RNA-to-cDNA conversion varies between RT enzymes and across the transcriptome.13 Digital PCR platforms, where RNA-to-cDNA conversions are performed prior to digitization, have shown these measurements to be precise under consistent reaction conditions in larger homogenized samples8 and for single cells when compared to quantitative PCR (qPCR).14 However, these techniques demonstrate cDNA quantification and may not reflect the actual quantity of RNA present in the original sample. Digital PCR measurements have thus far not demonstrated absolute quantification of mRNA present in a single cell.
In this study, both RT and PCR occur in digitized volumes without prior reverse transcription or preamplification, hereinafter referred to as one-step digital RT-PCR. A few reports of one-step digital RT-PCR have demonstrated quantification results that agree well with those of other quantitative or semiquantitative methods using RNA standards15 or standard virus quantification methods15−17 to indirectly quantify RNA for comparison with system performance. While digital RT-PCR has been established in general, and analysis of cDNA from a single cell has been carried out using dPCR, direct analysis of mRNA from single cells using digital RT-PCR has not been performed. This is significant as we believe this facilitates the most optimal performance of the RT step and avoids potential bias from a bulk RT step or preamplification.
In this work, we show some of the limitations of using standard qPCR measurements to study single-cell heterogeneity. We then show an absolute quantification method of single-cell gene expression analysis. This method uses the self-digitization (SD) chip platform, a microfluidic device without valves or moving parts that digitizes a high percentage of the sample volume. We assess the performance of our device for one-step digital RT-PCR using two methods. In the first approach, we demonstrate that direct quantification using the digital assay compares well to a qPCR standard curve, validating the general performance of the assay. In the second approach, we compare the direct quantification of single-cell mRNA from the digital assay to another direct RNA counting method, single-molecule FISH (fluorescence in situ hybridization), indicating the accuracy of postdigitization RT.18 We demonstrate that the reverse transcription step can be performed reliably in digitized volumes; this workflow successfully performs single-cell analysis. We also demonstrate that the absolute mRNA quantification in single cells can be accurately performed using digital microfluidics.
Experimental Section
Single-Cell qPCR
Quantitative PCR data shown in Figure 1 were acquired using flow cytometry sorted K562 cells. Single K562 cells were flow-sorted into PCR plates so that the wells were known to contain 1, 10, or 100 cells. Reverse transcription was performed in 10 μL of the high-capacity master mix (Applied Biosystems, Carlsbad, CA), and duplicate reactions were analyzed by qPCR based on duplex hydrolysis probes to simultaneously measure expression levels of the target gene, BCR-ABL, and the control gene, wild-type ABL. The fold change in gene expression was calculated relative to the average of all samples in the category (1, 10, or 100 cells). For extracted RNA experiments, total RNA was extracted from K562 cells using Trizol (Invitrogen, Carlsbad, CA) according to the manufacturer’s protocol. Quantities were assessed by UV absorbance (Nanodrop 2000, Thermo Fisher Scientific, Waltham, MA).
Figure 1.

Traditional qPCR approaches adapted for use in single cells show that, even in homogeneous cell lines using a ΔΔCT calculation to interpret qPCR data, intercellular variability can be observed. The fold difference in expression of BCR-ABL for each cell population was compared to the average BCR-ABL expression of the extracted RNA. For K562 cells, the use of ABL as a control gene and comparison of its expression to BCR-ABL gene expression is a typical approach. As the input cell number decreases, the mean expression value, indicated by a horizontal red line in each group, remains the same as that of extracted control RNA, but the intercellular variability becomes more apparent.
Microfluidic Device Fabrication
Devices were prepared by soft lithography as described previously19 with the following modifications. The main channel height was measured to be 25 ± 1 μm, and the chamber height was 104 ± 3 μm for the serpentine design and 113 ± 5 μm for the bifurcated design as determined by a custom-built white-light interferometer.20 The serpentine device, used in single-cell experiments, contained 1020 chambers, while a bifurcated main channel device, used in dilution series experiments, contained 1024 channels. Details of the device dimensions and assembly are available as Figure S-2 and S-3 (Supporting Information).
Device Loading
The RT-PCR reaction mix was prepared from the CellsDirect one-step qRT-PCR kit (Life Technologies, Carlsbad, CA). A PCR master mix was prepared according to the manufacturer’s guidelines with the addition of bovine serum albumin (Invitrogen) to a final concentration of 3 mg/mL and Tween 20 (Millipore, Darmstadt, Germany) to a final concentration of 0.15% (m/v). The concentration of SuperScript III RT/Platinum Taq mix was doubled from that in the manufacturer’s guidelines. PCR assays for glyceraldehyde-3-phosphate dehydrogenase (GAPDH) and transferrin receptor (TFRC) were purchased from the library of prepared PrimeTime qPCR 5′ nuclease assays available from Integrated DNA Technologies (GAPDH assay Hs.PT.42.1164609, TFRC assay Hs.PT.56a.3164874, IDT, Coralville, IA). PCR assays were purchased with FAM/ZEN/Iowa Black FQ probes. Final primer concentrations were 500 nM forward/reverse primer and 250 nM probe. The lysate mixture was prepared separately. For RNA dilution experiments, 2 μL of RNA diluent (total RNA control (human), Applied Biosystems) was prepared by serial dilution to concentrations of 52, 35, 17, 7, and 1.4 pg/μL in 10 mM Tris buffer, pH 8.0 (1 M Tris, pH 8.0, Ambion, Carlsbad, CA, diluted with UltraPure DNase/RNase-free water, Invitrogen). This RNA sample was added to 6 μL of CellsDirect lysis solution. This RNA mix was incubated according to the manufacturer’s instructions (cell lysis step), and then 3 μL of RNA/lysis mix and 7 μL of RT-PCR master mix were mixed and added to the SD chip inlet.
For single-cell experiments, 0.5 μL of SKBR3 cells (ATCC, Manassas, VA) suspended in 1× PBS (10× phosphate-buffered saline, Sigma-Aldrich, diluted with UltraPure water) was pipetted onto the inside of a lid from a PCR tube (0.2 mL PCR tube strips, BioRad, Hercules, CA). The droplets were inspected with an inverted bright-field microscope (Axio Vert.A1, Zeiss, Oberkochen, Germany) with a 20×, 0.45 NA objective to determine cell quantities. For lids containing a single cell in suspension, 1.6 μL of CellsDirect lysis solution was pipetted into the lid. These lids were again observed with a bright-field microscope, and only lids twice confirmed to contain only a single cell were used in analysis. These lids were capped onto the PCR tube base, stored inverted on ice, and transferred to −80 °C for storage for up to 4 weeks. Frozen samples were thawed on ice, and the droplets were covered with 20 μL of continuous-phase oil mix and incubated according to the manufacturer’s instructions to perform cell lysis. These samples were cooled briefly on ice before 6 μL of master mix was pipetted under the oil layer. The prepared reaction mix was stored on ice and transferred to a 4 °C cold room for device loading.
A continuous oil phase, composed of Abil WE 09 (Evonik Industries, Essen, Germany), Tegosoft DEC (Evonik Industries), and light mineral oil (M8410, Sigma-Aldrich, St. Louis, MO), was prepared within 24 h of device priming. The concentrations were, by weight, 0.075% Abil, 90% Tegosoft, and 9.9% light mineral oil. This continuous phase was pipetted into the inlet and outlet of the device main channel. The device was then placed in a vacuum chamber under vacuum overnight to displace air from the channel and array.
Samples were digitized in a 4 °C cold room. A vacuum manifold formed from poly(methyl methacrylate) was attached via double-sided Kapton tape to the SD chip outlet. Drilled access holes in this piece were used to interface up to four SD chips in parallel to the vacuum pump via connected tubing. In this arrangement, four devices were simultaneously connected to a vacuum pump (DOA-P104-AA, Gast, Benton Harbor, MI) that generated a 575 mmHg vacuum to create a pressure differential along the device channels to drive flow.
Digital RT-PCR
Thermal cycling was performed in an Eppendorf Mastercycler fitted with an in situ adapter (Eppendorf, Hamburg, Germany). A layer of light mineral oil was sandwiched between the in situ adapter and the device. GAPDH or TFRC amplification was performed at two-step thermal cycler conditions to optimize the signal-to-noise ratio: reverse transcription at 50 °C for 35 min, hot start at 95 °C for 2.5 min, denature at 95 °C for 15 s, and anneal/extend at 61 °C for 30 s (GAPDH) or 45 s (TFRC).
Data Processing
Imaging was performed using a variable-mode imager (Typhoon FLA9000, GE Healthcare, Pittsburgh, PA) as described previously.19 Analysis was performed using ImageJ (http://rsbweb.nih.gov). The same rolling ball background subtraction was performed on each image. A macro was written in ImageJ to overlay region-of-interest (ROI) grids on the array to collect the mean and integrated intensities from the center and total area of each chamber. Two such ROI grids were used per image. The first grid covered a small area in the center of the well, 16 × 8 pixels. The mean intensity in the center of the chamber was used to determine PCR-positive status, as chambers typically fall into either a PCR-negative or PCR-positive cluster as seen in Figure 4. Chambers with a mean intensity below a low threshold were considered unfilled and were discarded from analysis. Chambers with mean intensity above a high threshold were discarded due to possible fluorescent fibers or dust that would give inaccurate assessment. A second ROI grid covered the entire chamber area, 48 × 27 pixels, and the total intensity for this area was determined in ImageJ. The ratio of total chamber intensity to mean pixel intensity at the chamber center multiplied by the total chamber pixels was used as a second quality metric. It was found that this value should be near 1 for a fully filled chamber. Chambers with values below a low threshold were considered low volume and discarded from analysis, while chambers with values above a high threshold were discarded due to possible fluorescent fibers or dust. The volume of droplets on the outer edges of the array was found to decrease during thermal cycling; therefore, these volumes were not used in the analyses.
Figure 4.
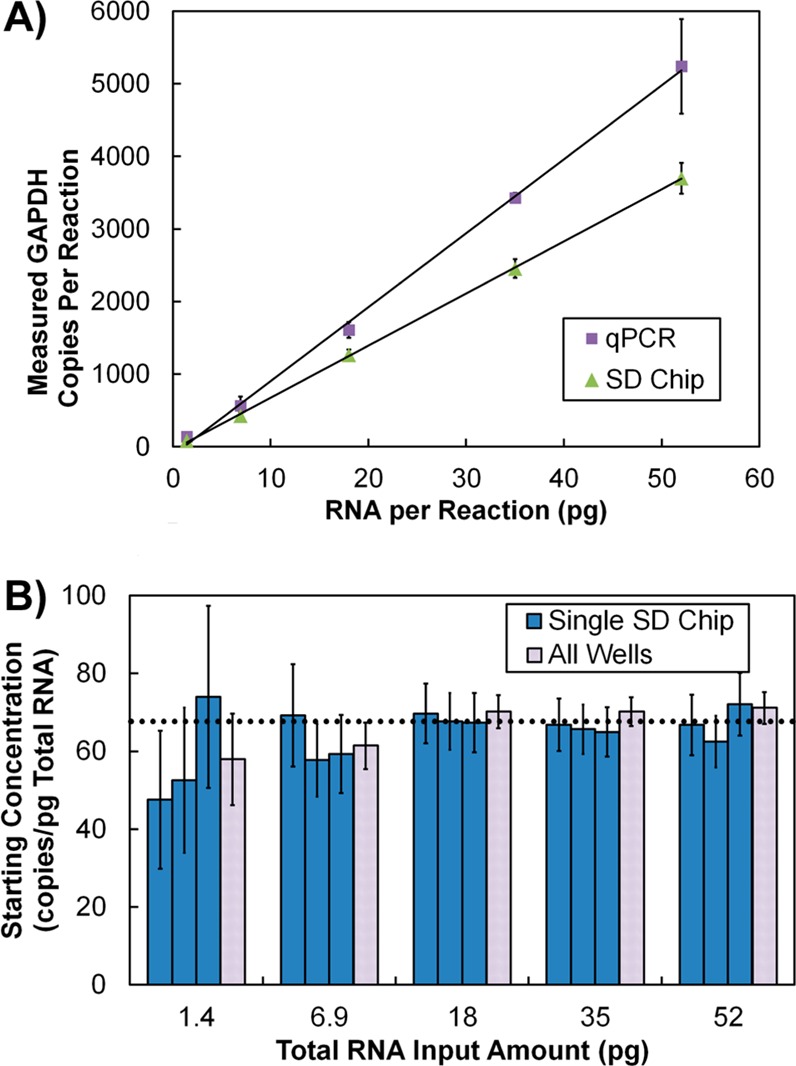
Amplification of GAPDH transcripts from total RNA. (A) Measured GAPDH copies versus total RNA input measured by qPCR or the SD chip. Error bars represent confidence intervals. (B) Estimated GAPDH starting concentration determined by digital RT-PCR at five dilution points. Dark blue bars represent the concentration estimation and 95% confidence interval (CI) for each run; light gray bars represent the concentration and CI estimation for the sum of positive and total chambers for the three SD chips analyzed at each dilution.
The total number of filled volumes, total number of PCR-positive volumes, and volume of the solution analyzed were then used to calculate the concentration of mRNA. This concentration was multiplied by the total volume of the loaded sample to determine the absolute mRNA copy number per sample. Details of this calculation are provided in the Supporting Information.
RNA Standard Curve
An RNA standard curve was generated from total RNA (total RNA control (human), Applied Biosystems). First, the total RNA was reverse transcribed using a combination of random primers and oligo(dT)s (iScript RT supermix, BioRad). The resulting cDNA underwent two rounds of PCR amplification (SsoFast EvaGreen supermix, BioRad) using GAPDH primers that incorporated the T7 sequence. The PCR-amplified cDNA was purified (MiniElute, Qiagen, Germantown, MD), and its purity was confirmed by melt-curve analysis and gel electrophoresis after each round of PCR. From the purified cDNA, a 594 base pair ssRNA standard was generated using a MegaScript kit with TurboDNase treatment (Life Technologies). The resulting RNA standard was purified (MegaClear kit, Life Technologies), confirmed to be a single product by gel electrophoresis, and quantified by UV absorbance (Nanodrop 2000, Thermo Fisher Scientific). Each kit was used according to the manufacturer’s protocol.
Single-Cell FISH
Cells were grown on Lab-Tek chambered cover glass (Thermo Fisher) for 2 days. The cells were washed with 1× PBS and incubated at room temperature in fixation buffer (4% formaldehyde in 1× PBS, Sigma-Aldrich) for 10 min. The cells were washed twice with 1× PBS and stored in 70% ethanol at 4 °C for 1 h. The cells were incubated for 5 min at room temperature with wash buffer (10% formamide, Ambion, in 2× SSC, Ambion) and then overnight in a 37 °C incubator in a hybridization buffer (10% formamide, 2× SSC, 125 nM FISH probes, 10% dextran sulfate, Sigma-Aldrich). TFRC FISH probes were obtained from Biosearch (Stellaris FISH probes, human TFRC with Quasar 570, Biosearch Technologies, San Francisco, CA). The following day, the cells were incubated at 37 °C with wash buffer for 30 min followed by a 30 min, 37 °C incubation with nuclear dye (wash buffer with 5 ng/mL DAPI, Sigma-Aldrich). Before imaging, the cells were washed with 2× SSC and covered with 25 μL of Vectashield mounting medium (Vector Laboratories, Burlingame, CA) and an 18 × 18 mm no. 1 coverslip. The cells were imaged using a Nikon Eclipse Ti inverted microscope fitted with a 60×, 1.4 NA objective. Image stacks were created by manually focusing on image planes containing individual RNA spots, approximately 30 images per cell. Image slices were evaluated using software developed by the Arjun Raj laboratory at the University of Pennsylvania (http://rajlab.seas.upenn.edu/StarSearch/launch.html).
Cell Culture
SKBR3 cells were cultured in McCoy’s 5A medium (ATCC) supplemented with 10% fetal bovine serum, 100 U/mL penicillin, and 100 mg/mL streptomycin. K562 cells were cultured in Dulbecco’s modified Eagle’s medium (ATCC) supplemented with 1× l-glutamine, 10% fetal bovine serum, 100 U/mL penicillin, and 100 mg/mL streptomycin.
Results and Discussion
Real-time qPCR is considered to be the gold standard method for gene expression assays.9 To analyze homogeneous, larger input samples well above the qPCR limit of detection, ΔΔCT calculations are often used. These calculations relate expression of the target gene to that of a control gene in the same sample, and the results are normalized to a uniform input sample.21 This accounts for random changes in the target amount. As the input is reduced to quantities near the limit of detection, the validity of this calculation is questionable. For single-cell measurements, errors are introduced from the variability of sample handling and PCR protocols. Comparisons of target and control genes are no longer relevant at the single-cell level, as cycles of gene expression burst and degradation are known to occur across all genes, including housekeeping or control genes.2,22 As a result of these sources of variability, ΔΔCT calculations tend to compound error in single-cell measurements rather than reduce the contribution of qPCR’s inherent experimental uncertainty.
To demonstrate the specific limitations of ΔΔCT qPCR for single cells, we analyzed populations of a leukemia cell line, called K562, which is known for its high expression of the BCR-ABL gene. BCR-ABL is a fusion gene resulting from a translocation that is the hallmark of chronic myeloid leukemia. Typically, BCR-ABL expression is compared to that of a reference gene, such as wild-type ABL. Traditional qPCR methods were adapted for use with single cells to accurately quantify the fold differences between BCR-ABL and ABL expression levels down to less than single-cell quantities, as defined by typical quality control descriptions (such as linearity of the standard curve for titrated RNA, Figure S-1, Supporting Information). When this assay was applied to populations of cells, we saw that, as the cell number input into the reactions decreased from 100 to a single cell, more apparent variability in BCR-ABL gene expression was observed while the mean of each population size was identical to that observed in extracted, homogenized RNA from these cells (Figure 1). The high variability observed in these single cells shows that, even in cell lines presumed to be homogeneous, the differences in the expression levels of target and control genes are high. Additionally, it is challenging to identify with certainty that the variability demonstrated was truly biological heterogeneity or was due to an unaccounted for artifact. In this way, ΔΔCT comparisons between target and control genes are inappropriate for single-cell assays. Thus, an absolute quantification of gene expression is preferable for single-cell gene expression analysis.
We hypothesized that microfluidic, digital RT-PCR could overcome some of the limitations of standard qPCR for single-cell analysis. We performed these experiments using a microfluidic device, the SD chip. The SD chip was developed to automatically digitize an aqueous plug into discrete volumes in a continuous oil phase without valves or other moving parts.23 This device, made out of poly(dimethylsiloxane) (PDMS), consists of a continuous or branching rectangular main channel with rectangular sample cavities (chambers) evenly distributed along one side of the channel (Figure 2). An aqueous sample plug enters the oil-primed device and fills the main channel and chambers. The aqueous plug is followed by the continuous oil phase, which fills the main channel and traps the aqueous sample into individual volumes with minimal loss to the sample outlet. The SD chip has been previously used for small-molecule crystallization studies23 and for isothermal loop-mediated DNA amplification (LAMP).19 In this study, we extend its use to digital one-step RT-PCR. The SD chip is an excellent platform for a single-cell sample. First, an oil barrier prevents the aqueous sample from contacting the surfaces of the device, minimizing adsorption of the analyte. Second, the design maximizes the amount of sample digitized in the array, which becomes important when the quantity of genetic material is small. Finally, the flexibility in the size and number of sample cavities per device makes the platform amenable to match the dynamic range and resolution requirements for the gene of interest.
Figure 2.
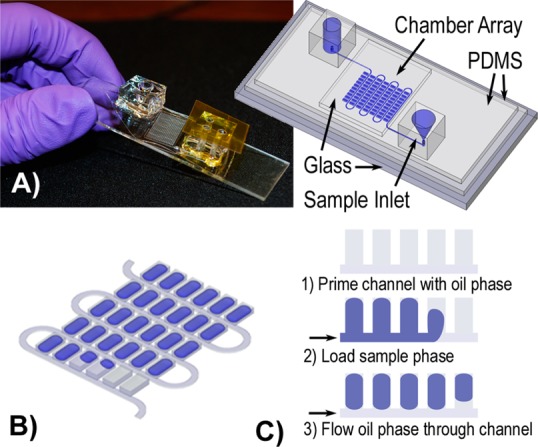
Components of the digital RT-PCR self-digitization chip. (A) Image of the assembled device with a sketch of the chip components. (B) Schematic of the serpentine chip design used for single-cell experiments. The actual devices contain 1020 wells. (C) SD chip filling mechanism.
The implementation of RT-PCR in the SD chip, however, required four notable modifications over the design previously used for isothermal amplification.19 First, since PCR requires higher temperatures than the LAMP reaction, additional measures were necessary to reduce evaporation of the digitized solution through the semipermeable PDMS substrate. Second, the number of chambers had to allow for quantification of low to intermediate abundance transcripts present in a single cell (less than 1000 copies).24 Third, the continuous-phase composition had to be modified to accommodate both viscosity changes and the switch in surfactant for the final PCR mix; the digitized volumes had to be prevented from shifting into the device main channel at the PCR denaturation temperatures. Fourth, modifications to the sample inlet and pressure source had to be made to facilitate sample loading and minimize sample loss in the inlet.
An image and diagram of the device are shown in Figure 2, and assembly details are shown in Figure S-2 (Supporting Information). Notable features of this device compared to its predecessor include (1) a tapered, funnel-like sample inlet, interfaced with the microfluidic channel to minimize dead space, to direct a pipetted sample into the main channel, (2) a thin PDMS microfluidic feature layer sandwiched between the spin-coated PDMS glass microscope slide and the glass coverslip to prevent evaporation above and below the array, and (3) an oil-filled channel surrounding the array which acts as a horizontal evaporation barrier during thermal cycling (Figure S-4, Supporting Information). To fill the device, we found that thermally stable oil–surfactant systems adopted from emulsion PCR systems ensure that the high temperatures achieved during thermal cycling do not cause digitized volumes to enter into the main channel where they might combine with neighboring volumes. Additionally, loading the chip with negative pressure, using a vacuum pump on the outlet versus positive pressure on the inlet, prevented overloading of individual chambers in the compressible PDMS substrate (Figure S-5, Supporting Information). Despite these modifications, small amounts of sample were sometimes observed to remain in the sample inlet, and sample often collected at the sample outlet due to emulsion formation during filling. With these modifications, 86.7% (SD = 3.3%) of the single-cell sample was digitized in the 12 single-cell experiments. With further optimization to the sample inlet and adjustment of surfactant concentrations and solution viscosities, this loading efficiency could theoretically reach 100% in the SD chip.23 In contrast, workflows for high-throughput, single-cell, microfluidic qPCR using preamplification of cDNA before digitization typically use less than 5% of the sample.25 Workflows not incorporating preamplification for single-cell assays, instead performing microfluidic digital PCR of cDNA, often digitize approximately 50% of the sample.14,26
Analysis of postamplification array images showed two distinct intensity clusters for sample volumes corresponding to PCR-negative and PCR-positive reactions (Figure 3). From the proportion of positive to total volumes in the array, application of Poisson statistics allowed us to determine the concentration of molecules on the device.27 The Wilson score method was then used to calculate the 95% confidence intervals about this estimation.28−30 The outermost rows and columns were excluded from analysis because a low chamber volume due to evaporation was indistinguishable from a failure in chamber filling. Imaging the array before and after RT-PCR, as opposed to end-point-only imaging, could allow us to compensate for these changes and analyze these chambers for future experiments. Before and after images of a digitized sample in the full array are shown in Figure S-3 (Supporting Information).
Figure 3.
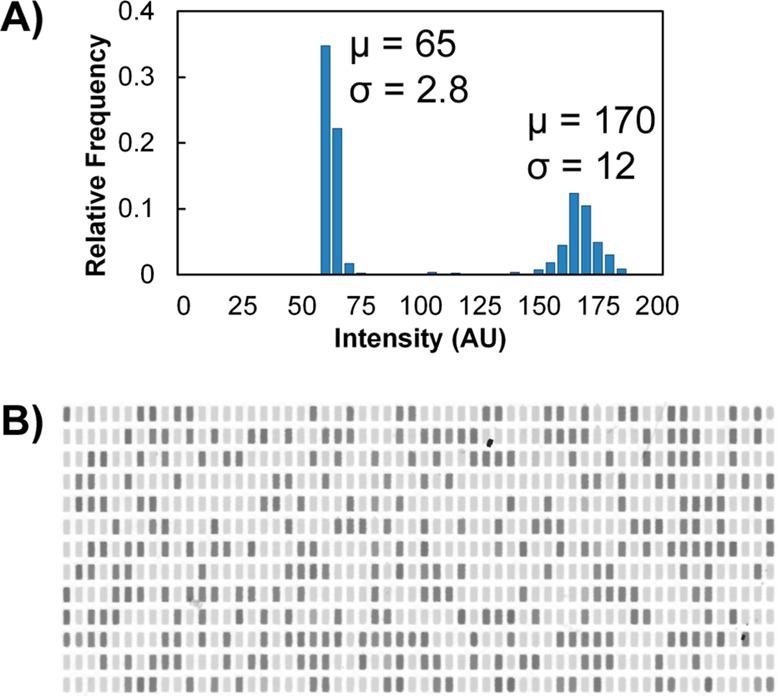
Postamplification well intensity. (A) Typical well intensity distribution for single-cell amplification of TFRC RNA. A high intensity value indicates target amplification. (B) Background-subtracted image of a serpentine array after single-cell digital RT-PCR. Dark volumes indicate target amplification. This image excludes the outermost rows and columns of the array.
A theoretical dynamic range for the device can be determined using Poisson statistics and is dependent on the total volume of sample analyzed and the number and size of digitized volumes. We define the dynamic range from the concentration corresponding to the result of three positives per array volume to three negatives per array volume. These concentrations would be expected to give results corresponding to at least one positive well or one negative well, respectively, 95% of the time. For this design this corresponds to a range of 0.41–680 copies/μL or 3.3–5500 copies per single cell. A detailed description of this calculation is given in the Supporting Information.
The choice of enzyme to perform reverse transcription of RNA to cDNA was essential to assay performance. Ideally, each chamber in the array containing RNA would contain one or more corresponding cDNA molecules after reverse transcription, so that these chambers would yield a positive signal following PCR. For this reason, we chose a reverse transcription enzyme known for high yield and stability.31 A long incubation time was used to allow the enzyme sufficient time for reverse transcription.
We first tested the ability of this device to perform digital and one-step RT-PCR by analyzing a dilution series of total RNA for GAPDH mRNA copy number. The response was linear (R2 = 0.999) and matched closely to that of qPCR using a standard curve of GAPDH RNA. The SD chip indicated slightly lower quantities of GAPDH mRNA in the sample (qPCR, 102 GAPDH copies/pg of total RNA; digital one-step RT-PCR, 71.8 GAPDH copies/pg of total RNA) (Figure 4A). This result is consistent with those of other studies showing that qPCR can yield a higher result than digital PCR or digital RT-PCR.8,10,11 This may result from the fact that the qPCR measurement is dependent on quantification of the RNA standards by UV absorbance; it is known that UV absorbance measurements can overestimate the number of amplifiable template molecules due to the presence of contaminants, damaged RNA, or off-target oligomers.8,10,11
Results from the GAPDH mRNA dilution series were also multiplied by their dilution factors to return to the starting concentration of GAPDH mRNA in the total RNA starting sample (Figure 4B). The final two points in this dilution series fell slightly below the average starting concentration. This may be due to an error in the creation of the dilution series, caused by either pipetting error or a loss of the minute quantities of RNA inside the pipet tips or vessels used to prepare the reagents. These data are significant because they show that any bias between low and high copy numbers of the mRNA transcript is minimal. However, this result does not show that the absolute quantities determined from the analysis reflect the absolute quantities of mRNA present in a single cell.
Having shown that the SD chip’s digital one-step RT-PCR gave results comparable to those of qRT-PCR, we next sought to validate the absolute quantification of mRNA in single cells by comparison with another single-cell mRNA quantification technique, single-molecule mRNA FISH. FISH is independent of the variable efficiency of reverse transcription and PCR and was developed specifically for quantification in single cells. For these reasons, it is an excellent independent validation method. In this method, direct counting of single RNA molecules is performed in a sample of fixed cells by attaching multiple probes labeled with fluorophores along the length of each RNA. With high-resolution fluorescence microscopy, it is possible to identify single RNAs as diffraction-limited spots in a z-stack of images. Challenges with probe design and spatial resolution of fluorescent signals limit the compatibility of this method for highly concentrated transcripts or for those that cluster within the cell.32 We chose to study the TFRC gene, a relevant protein in some cancers such as mantle cell lymphoma.33 The typical intercellular mRNA spatial distribution and concentration for this gene made it an excellent candidate for this study; a well-characterized TFRC FISH assay was commercially available.
We found that results from both methods agreed well, yielding on average 455 (SD = 171, n = 31) copies of TFRC transcripts per single cell using FISH and 442 (SD = 207, n = 12) copies using the SD chip with digital RT-PCR (Figure 5). These values are similar to TFRC values found in HeLa cells using single-molecule FISH.34 We also found that the distributions of TFRC mRNA copy number were similar between the two methods. The statistical error for dRT-PCR data, displayed as 95% confidence intervals, are small compared to the variation in TFRC in these cells. The magnitude of associated theoretical uncertainty per cell in digital PCR is dependent on the total number of volumes analyzed and thus can be reduced to fit the needs of the user by adding more reaction volumes per sample.35,36 Importantly, unlike single-molecule FISH, digital, one-step RT-PCR is not limited by the optical resolution of mRNA transcripts that cluster in vivo. The number of digitized volumes per device also can be scaled to quantify transcripts of any abundance.
Figure 5.

Absolute quantification of TFRC mRNA copies in single cells. (A) Comparison of single-cell TFRC copy number distributions using FISH or the SD chip. Individual single-cell measurements are presented (left) as well as the distribution of mRNA values (right). The dashed line represents the average copy number for each detection method. The histogram bin size is 150 mRNA copies. The average copy numbers, standard deviations, and distributions were similar for the two methods. (B) False-color mRNA FISH image. Nuclei are colored blue, and TFRC mRNA appear as white spots. The scale bar is 10 μm.
Conclusions
The SD chip is a simple device for sample digitization that is compatible with single-cell digital RT-PCR. The device maximizes the fraction of sample digitized into the array, making the design ideal for working with the occasional low mRNA copy numbers present in a single cell. We have demonstrated that digital RT-PCR with reverse transcription performed in the digitized volumes gives a linear response to the mRNA template concentration. Additionally, absolute quantification of mRNA from single cells agrees well with the copy numbers obtained from another absolute mRNA counting technique with the same transcript and cell line.
Counting absolute quantities of mRNA allows us to overcome the need for a reference gene or calibration standard, which is a restriction at odds with the stochastic nature of gene expression at the single-cell level and which introduces technical variability. We feel that this method based on the SD chip can also be valuable as a calibration or validation tool for new mRNA measurement techniques, such as digital systems with RT-PCR protocols, and other single-molecule counting techniques, such as next-generation sequencing platforms or imaging techniques. Validation by an independent device, such as the SD chip, would allow for single-cell expression data to be shared between laboratories even when different instruments and workflows are used.
Further improvement of the SD chip should allow us to digitize a sample up to the previously reported 100% sample digitization.23 This is expected to allow for high precision in quantifying low-concentration samples. For example, DNA or mRNA present in only one or two copies per single cell would be detected in such a device. Digitization of 100% would be important to ensure detection of both copies of a gene pair or to properly quantify a low-abundance gene copy number at a single-cell level. Other future work to improve the SD chip for single-cell genetic analysis will focus on increasing throughput. We recently demonstrated a high-density array for self-digitization of sample volumes that could be adapted for improved copy number resolution in this device.35 Another modification could be a multiple-channel, parallel scheme for the rapid analysis of many cells. The chip could also be used for multiplex gene detection when combined with spectrally resolved probes in each reaction chamber.
Acknowledgments
We gratefully acknowledge support from the National Institutes of Health (Grant R01CA175215) and the Department of Defense CDMRP Program (Grant BC100510).
Supporting Information Available
Additional information as noted in text. This material is available free of charge via the Internet at http://pubs.acs.org.
The authors declare the following competing financial interest(s): D.T.C. and J.E.K. have financial interest in Lamprogen, which has licensed the SD technology from the University of Washington.
Funding Statement
National Institutes of Health, United States
Supplementary Material
References
- Lorthongpanich C.; Cheow L. F.; Balu S.; Quake S. R.; Knowles B. B.; Burkholder W. F.; Solter D.; Messerschmidt D. M. Science 2013, 341, 1110–1112. [DOI] [PubMed] [Google Scholar]
- Raj A.; Peskin C. S.; Tranchina D.; Vargas D. Y.; Tyagi S. PLoS Biol. 2006, 4, e309. [DOI] [PMC free article] [PubMed] [Google Scholar]
- Almendro V.; Cheng Y.-K.; Randles A.; Itzkovitz S.; Marusyk A.; Ametller E.; Gonzalez-Farre X.; Muñoz M.; Russnes H. G.; Helland A.; Rye I. H.; Borresen-Dale A.-L.; Maruyama R.; van Oudenaarden A.; Dowsett M.; Jones R. L.; Reis-Filho J.; Gascon P.; Gönen M.; Michor F.; Polyak K. Cell Rep. 2014, 6, 514–527. [DOI] [PMC free article] [PubMed] [Google Scholar]
- Thompson A. M.; Paguirigan A. L.; Kreutz J. E.; Radich J. P.; Chiu D. T. Lab Chip 2014, 14, 3135–3142. [DOI] [PMC free article] [PubMed] [Google Scholar]
- Bengtsson M.; Hemberg M.; Rorsman P.; Ståhlberg A. BMC Mol. Biol. 2008, 9, 63. [DOI] [PMC free article] [PubMed] [Google Scholar]
- Livak K. J.; Wills Q. F.; Tipping A. J.; Datta K.; Mittal R.; Goldson A. J.; Sexton D. W.; Holmes C. C. Methods 2013, 59, 71–79. [DOI] [PMC free article] [PubMed] [Google Scholar]
- Reiter M.; Kirchner B.; Müller H.; Holzhauer C.; Mann W.; Pfaffl M. W. Nucleic Acids Res. 2011, 39, e124. [DOI] [PMC free article] [PubMed] [Google Scholar]
- Sanders R.; Mason D. J.; Foy C. A.; Huggett J. F. PLoS One 2013, 8, e75296. [DOI] [PMC free article] [PubMed] [Google Scholar]
- Fox B. C.; Devonshire A. S.; Baradez M.-O.; Marshall D.; Foy C. A. Anal. Biochem. 2012, 427, 178–186. [DOI] [PubMed] [Google Scholar]
- Sanders R.; Huggett J. F.; Bushell C. A.; Cowen S.; Scott D. J.; Foy C. A. Anal. Chem. 2011, 83, 6474–6484. [DOI] [PubMed] [Google Scholar]
- White R. A. III; Blainey P. C.; Fan H. C.; Quake S. R. BMC Genomics 2009, 10, 116. [DOI] [PMC free article] [PubMed] [Google Scholar]
- White R. A. III; Quake S. R.; Curr K. J. Virol. Methods 2012, 179, 45–50. [DOI] [PubMed] [Google Scholar]
- Ståhlberg A.; Kubista M.; Pfaffl M. Clin. Chem. 2004, 50, 1678–1680. [DOI] [PubMed] [Google Scholar]
- White A. K.; Heyries K. A.; Doolin C.; VanInsberghe M.; Hansen C. L. Anal. Chem. 2013, 85, 7182–7190. [DOI] [PubMed] [Google Scholar]
- Shen F.; Sun B.; Kreutz J. E.; Davydova E. K.; Du W.; Reddy P. L.; Joseph L. J.; Ismagilov R. F. J. Am. Chem. Soc. 2011, 133, 17705–17712. [DOI] [PMC free article] [PubMed] [Google Scholar]
- Rački N.; Morisset D.; Gutierrez-Aguirre I.; Ravnikar M. Anal. Bioanal. Chem. 2014, 406, 661–667. [DOI] [PMC free article] [PubMed] [Google Scholar]
- Beer N. R.; Wheeler E. K.; Lee-Houghton L.; Watkins N.; Nasarabadi S.; Hebert N.; Leung P.; Arnold D. W.; Bailey C. G.; Colston B. W. Anal. Chem. 2008, 80, 1854–1858. [DOI] [PubMed] [Google Scholar]
- Levesque M. J.; Raj A. Nat. Methods 2013, 10, 246–248. [DOI] [PMC free article] [PubMed] [Google Scholar]
- Gansen A.; Herrick A. M.; Dimov I. K.; Lee L. P.; Chiu D. T. Lab Chip 2012, 12, 2247–2254. [DOI] [PMC free article] [PubMed] [Google Scholar]
- Yen G. S.; Fujimoto B. S.; Schneider T.; Huynh D. T. K.; Jeffries G. D. M.; Chiu D. T. Lab Chip 2011, 11, 974–977. [DOI] [PubMed] [Google Scholar]
- Bustin S. A.; Benes V.; Garson J. A.; Hellemans J.; Huggett J.; Kubista M.; Mueller R.; Nolan T.; Pfaffl M. W.; Shipley G. L.; Vandesompele J.; Wittwer C. T. Clin. Chem. 2009, 55, 611–622. [DOI] [PubMed] [Google Scholar]
- Chubb J. R.; Trcek T.; Shenoy S. M.; Singer R. H. Curr. Biol. 2006, 16, 1018–1025. [DOI] [PMC free article] [PubMed] [Google Scholar]
- Cohen D. E.; Schneider T.; Wang M.; Chiu D. T. Anal. Chem. 2010, 82, 5707–5717. [DOI] [PMC free article] [PubMed] [Google Scholar]
- Carter M. G.; Sharov A. A.; VanBuren V.; Dudekula D. B.; Carmack C. E.; Nelson C.; Ko M. S. H. Genome Biol. 2005, 6, R61. [DOI] [PMC free article] [PubMed] [Google Scholar]
- Devonshire A. S.; Baradez M.-O.; Morley G.; Marshall D.; Foy C. A. Anal. Biochem. 2014, 452, 103–113. [DOI] [PubMed] [Google Scholar]
- Warren L.; Bryder D.; Weissman I. L.; Quake S. R. Proc. Natl. Acad. Sci. U.S.A. 2006, 103, 17807–17812. [DOI] [PMC free article] [PubMed] [Google Scholar]
- Dube S.; Qin J.; Ramakrishnan R. PLoS One 2008, 3, e2876. [DOI] [PMC free article] [PubMed] [Google Scholar]
- Wilson E. B. J. Am. Stat. Assoc. 1927, 22, 209–212. [Google Scholar]
- Newcombe R. G. Stat. Med. 1998, 17, 857–872. [DOI] [PubMed] [Google Scholar]
- Shen F.; Du W.; Kreutz J. E.; Fok A.; Ismagilov R. F. Lab Chip 2010, 10, 2666–2672. [DOI] [PMC free article] [PubMed] [Google Scholar]
- Wacker M. J.; Godard M. P. J. Biomol. Tech.: JBT 2005, 16, 266–271. [PMC free article] [PubMed] [Google Scholar]
- Raj A.; van Oudenaarden A. Annu. Rev. Biophys. 2009, 38, 255–270. [DOI] [PMC free article] [PubMed] [Google Scholar]
- Salaverria I.; Zettl A.; Beà S.; Moreno V.; Valls J.; Hartmann E.; Ott G.; Wright G.; Lopez-Guillermo A.; Chan W. C.; Weisenburger D. D.; Gascoyne R. D.; Grogan T. M.; Delabie J.; Jaffe E. S.; Montserrat E.; Muller-Hermelink H.-K.; Staudt L. M.; Rosenwald A.; Campo E. J. Clin. Oncol. 2007, 25, 1216–1222. [DOI] [PMC free article] [PubMed] [Google Scholar]
- Battich N.; Stoeger T.; Pelkmans L. Nat. Methods 2013, 10, 1127–1133. [DOI] [PubMed] [Google Scholar]
- Schneider T.; Yen G. S.; Thompson A. M.; Burnham D. R.; Chiu D. T. Anal. Chem. 2013, 85, 10417–10423. [DOI] [PMC free article] [PubMed] [Google Scholar]
- Heyries K. A.; Tropini C.; Vaninsberghe M.; Doolin C.; Petriv O. I.; Singhal A.; Leung K.; Hughesman C. B.; Hansen C. L. Nat. Methods 2011, 8, 649–651. [DOI] [PubMed] [Google Scholar]
Associated Data
This section collects any data citations, data availability statements, or supplementary materials included in this article.