

Abstract
Background: Neutrophil CD64 has been shown to be a promising biomarker for bacterial infection and sepsis identification. However, the prognostic value of CD64 in predicting the likelihood of survival for patients in intensive care unit (ICU) is unclear. Methods: A total of 797 patients in the ICU of Xin-Hua Hospital, Shanghai, China were enrolled. We determined the Acute Physiology and Chronic Health Evaluation II (APACHE II) scores from these patients and collected blood samples to measure the levels of neutrophil CD64, thyroid hormone and C-reactive protein (CRP). We assessed the association between APACHE II scores or these biomarkers and mortality of patients in the ICU. Receiver operating characteristic (ROC) curves were generated and the Area Under the Curve (AUC) for each indicator was determined. Results: The AUC for CD64 was 0.752 ± 0.026, which was higher than that of FT3 (0.696 ± 0.028) and CRP (0.672 ± 0.026). APACHE II scores had the highest AUC (0.872 ± 0.018). The level of neutrophil CD64 expression positively associated with CRP and APACHE II, and negatively correlated with FT3. Multiple regression analysis revealed that APACHE II scores (Standard β value = 0.183, P < 0.001), CD64 (Standard β value = 0.518, P < 0.001) or log (CRP) (Standard β value = 1.203, P < 0.001) independently predicted ICU mortality. Conclusion: CD64 had the greatest power for predicting ICU mortality other than APACHE II scores. This result indicates that CD64 may be used as a biomarker to in combination with the use of APACHE II scores to improve the accuracy of predicting mortality outcome for patients in the ICU.
Keywords: Neutrophil CD64, ICU, mortality, predictor
Introduction
The Acute Physiology and Chronic Health Evaluation II (APACHE II) score is one of a number of scoring systems used for classifying the severity of disease in intensive care units (ICU). A large number of studies have shown that the APACHE II scores are significantly associated with patient mortality [1-3]. In addition to the APACHE II scores, studies have shown that the blood levels of C-reactive protein (CRP) and free triiodothyronine 3 (FT3) are independent predictors of ICU mortality [4,5].
Emerging evidence has shown that neutrophil CD64 is a highly sensitive and specific marker for systemic infection and sepsis [6]. CD64 (also known as the Fc-gamma-receptor type 1 or FcγRI) is a membrane-bound high-affinity receptor found on monocytes. It is, however, expressed only at low levels by neutrophils in the healthy host. Neutrophil CD64 expression corresponds to inflammatory responses during infection or tissue injury [7]. Previous studies have indicated that neutrophil CD64 expression may be used as a biomarker for systemic infection and sepsis in adults, neonates and children [6,8-13]. One study suggested that, based on 47 critically ill patients, neutrophil CD64 expression is a reliable indicator for the severity of sepsis and sepsis-associated mortality [14]. Another study showed that, based on 66 patients, CD64 is upregulated in those diagnosed with sepsis and septic shock [15]. Both of these studies, however, suffered from the limitation of a small sample size.
Given that the prognostic value of CD64 in patients admitted to the ICU is still uncertain, we undertook a prospective, observational study of a larger population of unselected patients from an ICU to confirm whether assessment of neutrophil CD64 expression, APACHE II scores and a number of serum biomarkers can be used to accurately predict ICU mortality.
Materials and methods
Participants
Consecutive adult patients admitted to the ICU of Xin-Hua Hospital affiliated with the Shanghai Jiaotong University School of Medicine, between 2011 and 2012, were enrolled in this study. We excluded patients who (1) were younger than 18 years old, (2) pregnant at any stage within the last 6 months, and (3) died or were discharged from the ICU within 4 hours of admission (insufficient time to collect the required dataset). This study was approved by Shanghai Jiaotong University Xin Hua Hospital Ethics Committee (XHEC2011-011) and was carried out in accordance with the Declaration of Helsinki. Owing to the observational nature of this study and the fact that the laboratory indices used here are routinely collected from all patients admitted to our ICU department, the need for written informed consent was waived by the ethical review board.
Blood collection
Blood samples from unselected 797 patients admitted to Xin-Hua Hospital affiliated with Shanghai Jiaotong University between 2011 and 2012 were taken on the first day following admission to the ICU.
Flow cytometry
Blood samples collected from patients were stained with CD64-FITC and CD45-PC5 (Beckman Coulter). CD64 is expressed on neutrophils and monocytes. Exposure of these cells to bacterial cell wall components, such as LPS, result in the upregulation of CD64 and the production of pro-inflammatory cytokines including IFN-γ, TNF-α, IL-8 and IL-12. This indicates that CD64 is excellent biomarker for systemic bacterial infection and potential tissue damage. The instrument used for flow cytometry was a Beckman Coulter FC500. CD64-FITC (clone 22) and CD45-Pc5 (clone Immu 19.2) antibodies from Beckman Coulter were used according to the manufacturer’s instructions. We measured the relative level of CD64 expression by the mean fluorescence intensity (MFI) found on granulocytes divided by the MFI found on lymphocytes. Relative values (ratio) less than 1 indicate normal levels of CD64 expression whereas values equal to or higher than 1 indicate increased levels of CD64 expression. Standard curves were constructed with the use of fluorescent microspheres. Flow cytometry plots showing the gating strategy used for both granulocytes and lymphocytes from a representative health control and an ICU patient are shown in Supplementary Figures 1 and 2.
ELISA
The levels of TSH, TT3, TT4, FT3, and FT4 were measured using the ADVIA Centaur immunoassay system (Siemens Healthcare Diagnostics Inc, Tarrytown, NY, USA). The level of rT3 was measured using the Maglum i1000 Analyzer chemiluminescence immunoassay system (SNIBE Co., Ltd., Guandong, China). The normal range of serum hormone concentrations in our laboratory are defined as 0. 35 to 5.50 mIU/L for TSH, 0.60 to 1.81 ng/ml for TT3, 45 to 109 ng/ml for TT4, 3.5 to 6.5 pmol/L for FT3 and 11. 5 to 22.7 pmol/L for FT4, and 0.16 to 0.95 ng/ml for rT3. Intra-assay coefficients of variation for TSH rangef from 2.1% to 3.8%, 1.45% to 3.18% for TT3; 1.19% to 3.15% for TT4; 2.35% to 3.08% for FT3; 2.23% to 3.3 3% for FT4; and 4.52% for rT3. The level of albumin was measured using the Hitachi 7600-120 analyzer (Hitachi, Tokyo, Japan). Serum CRP levels were measured using the QuikRead CRP test kit (Orion Diagnostica, Espoo, Finland). Intra-assay coefficients of variation ranged from 2% at 140 mg/L to 15% at 9 mg/L.
Study outcome
Demographic and clinical characteristics, including the APACHE II score (which usually ranges from 0 to 71, with higher scores indicating more severe illness), were collected at baseline. Patients were monitored during their hospitalization at the ICU. The primary outcome of this analysis was death in the ICU.
Statistical analysis
Continuous variables are presented as mean values ± SD or medians and ranges, and categorical variables are expressed as percentages. CRP value was logarithmically normalized and is presented as log (CRP) for statistical calculations. Baseline characteristics between survivors and nonsurvivors were compared with an unpaired Student’s t-test or the Mann-Whitney U test for continuous variables and a X2 test or the Fisher’s exact test for categorical variables. Receiver operating characteristic (ROC) curves were used to examine the performance of variables in predicting ICU mortality. The area under the curve (AUC) was calculated from the ROC curve. A statistically derived value based on the Youden’s index that maximized the sum of the sensitivity and specificity was used to define the optimal cutoff value [16]. Univariate logistic regression analyses were performed to examine the association between mortality and each of the predictors separately. We also conducted forward stepwise multivariate logistic regression analysis to determine independent predictors of ICU mortality. Criteria of P < 0.05 for entry and P ≥ 0.10 for removal were imposed in this procedure. Cox & Snell R2 and Nagelkerke R2 correlation coefficients were calculated to assess the goodness of fit of our models [17]. ORs for the continuous variables were described using standardized ORs, which were associated with a 1-SD change in the variable. The increased discriminative predictive value of CD64 levels in addition to the APACHE-II score was examined by calculation of net reclassification improvement (NRI) and integrated discrimination improvement (IDI) indices as described by Pencina et al. [18]. NRI is the net increase vs the net decrease in risk categories among case patients minus that among control participants. It requires that there exist a priori meaningful risk categories (we used less than 10%, 10% to 20% and more than 20% for the risk of ICU death) [4,19]. IDI is the difference in Yates slopes between models, in which the Yates slope is the mean difference in predicted probabilities between case patients and control participants [19]. A two-sided P value less than 0.05 was considered statistically significant. All analyses were performed using SPSS version 13.0 software (SPSS, Inc., Chicago, IL, USA).
Results
Baseline characteristics
A total of 797 consecutive patients (mean age: 67.65 ± 16.99 years) were eligible for enrollment in this study. The mean APACHE-II score was 16.14 ± 8.33 points. A total of 109 patients (13.68%) died during their ICU stay. The levels of TT3, TT4, FT3 and albumin were lower in non-survivors than in survivors (all P < 0.05) (Table 1). There were no significant differences in the levels of hemoglobin, FT4, TSH and rT3 between survivors and non-survivors (P = 0.15, P = 0.99, P = 0.37, P = 0.36, respectively) (Table 1). Compared with survivors, non-survivors were significantly older (71.12 ± 15.98 vs. 67.10 ± 17.09 years, P = 0.022) and had significantly higher APACHE-II scores (27.39 ± 9.68 vs. 14.36 ± 6.52, P < 0.0001), higher levels of CD64 (P < 0.0001) and CRP (P < 0.0001). All baseline clinical and laboratory characteristics of the patients are listed in Table 1.
Table 1.
Baseline clinical and laboratory characteristics of study subjects
| Characteristics | All | Survivors | Nonsurvivors | P values |
|---|---|---|---|---|
| Number | 797 | 688 | 109 | |
| Age (years) | 67.65 ± 16.99 | 67.10 ± 17.09 | 71.12 ± 15.98 | 0.022 |
| Principal diagnosis % | ||||
| infectious | 381 (47.8%) | 319/381 (84%) | 62/381 (16%) | < 0.0001 |
| non-infectious | 416 (52.2%) | 369/416 (88.7%) | 47/416 (11.3%) | < 0.0001 |
| APACHE-II | 16.14 ± 8.33 | 14.36 ± 6.52 | 27.39 ± 9.68 | < 0.0001 |
| CD64 | 1.8 ± 1.81 | 1.62 ± 1.15 | 2.94 ± 1.86 | < 0.0001 |
| Hemoglobin g/L | 343.95 ± 12.95 | 344.21 ± 12.84 | 342.27 ± 13.54 | 0.154 |
| CRP mg/L | 48.00 (0.00 to 160.00) | 46.68 (0.00 to 160.00) | 72.54 (8.00 to 160.00) | < 0.0001 |
| Albumin g/L | 34.58 ± 5.53 | 34.85 ± 5.23 | 32.74 ± 6.99 | 0.005 |
| TT3 ng/ml | 0.85 ± 0.33 | 0.88 ± 0.33 | 0.69 ± 0.32 | < 0.0001 |
| TT4 ng/ml | 83.43 ± 26.30 | 84.51 ± 25.47 | 75.54 ± 30.75 | 0.011 |
| FT3 pmol/L | 3.41 ± 0.70 | 3.46 ± 0.69 | 3.06 ± 0.67 | < 0.0001 |
| FT4 pmol/L | 15.58 ± 3.38 | 15.58 ± 3.31 | 15.58 ± 3.91 | 0.989 |
| TSH uIU/ml | 15.58 (0.00 to 150.00) | 2.08 (0.00 to 150.00) | 3.33 (0.05 to 80.31) | 0.371 |
| rT3 ng/ml | 0.5 (0.06 to 1.87) | 0.51 (0.06 to 1.87) | 0.48 (0.11 to 1.55) | 0.36 |
Usefulness of each indicator in predicting ICU mortality
ROC curves for each indicator were used to calculate the AUC to evaluate the usefulness of each indicator in predicting ICU mortality. The AUC, optimal cutoff value, sensitivity and specificity of each indicator are given in Table 2. CD64 had the greatest power for predicting ICU mortality other than APACHE-II scores. The largest AUC was derived from the use of APACHE-II scores (0.87 ± 0.018). This was followed by neutrophil CD64 expression (0.75 ± 0.026). The AUC for FT3 and CRP levels were 0.70 ± 0.028 and 0.67 ± 0.026, respectively (Figure 1). We performed univariate logistic regression analyses to examine the association between the ICU mortality and each indicator and calculated the standardized coefficient (β) and OR for each variable (Table 3).
Table 2.
Performance of variables in predicting ICU mortality
| Variable | AUC ROC | P value | Cutoff value | Sensitivity (%) | Specificity (%) |
|---|---|---|---|---|---|
| APACHE-II | 0.872 ± 0.018 | < 0.001 | ≥ 1 6.5 | 88.99 | 69.58 |
| CD64 | 0.752 ± 0.026 | < 0.001 | ≥ 1.835 | 60.55 | 80.23 |
| CRP | 0.672 ± 0.026 | < 0.001 | ≥ 37.5 | 67.62 | 63.62 |
| FT3 | 0.696 ± 0.028 | < 0.001 | ≥ 3.295 | 59.59 | 75.86 |
| FT4 | 0.497 ± 0.036 | 0.931 | ≥ 11.67 | 93.82 | 16.09 |
| rT3 | 0.457 ± 0.035 | 0.195 | ≥ 0.645 | 27.06 | 78.37 |
| TSH | 0.388 ± 0.035 | 0.001 | ≥ 51.865 | 3.49 | 99.68 |
| TT3 | 0.312 ± 0.031 | < 0.001 | ≥ 1.75 | 2.33 | 99.52 |
| TT4 | 0.404 ± 0.036 | 0.004 | ≥ 126.7 | 9.3 | 93.8 |
AUC ROC, area under the receiver operating characteristic curve.
Figure 1.
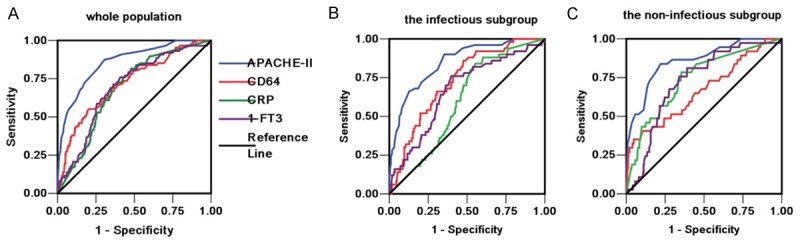
Receiver operating characteristic (ROC) curves for APACHE-II, CD64, CRP and FT3 in the the ICU cohort (A), the infectious subgroup (B) and the non-infectious subgroup (C).
Table 3.
Univariate adds ratios of variables for predicting ICU mortality
| Predictor | Standard β value | OR | 95% CI | P value |
|---|---|---|---|---|
| APACHE-II | 0.183 | 1.201 | 1.163 to 1.239 | < 0.001 |
| CD64 | 0.518 | 1.679 | 1.474 to 1.913 | < 0.001 |
| FT3 | -1.018 | 0.361 | 0.244 to 0.534 | < 0.001 |
| FT4 | -0.001 | 0.999 | 0.935 to 1.068 | 0.988 |
| rT3 | -0.479 | 0.62 | 0.223 to 1.725 | 0.36 |
| TSH | 0.012 | 1.012 | 0.993 to 1.032 | 0.221 |
| TT3 | -2.222 | 0.108 | 0.045 to 0.263 | < 0.001 |
| TT4 | -0.013 | 0.987 | 0.978 to 0.996 | 0.003 |
| Log (CRP) | 1.203 | 3.33 | 2.167 to 5.115 | < 0.001 |
Independent predictive value of CD64
We conducted a forward stepwise multivariate logistic regression analysis to determine independent predictors of ICU mortality. Other than APACHE-II, CD64 was the only independent predictor that entered the prediction models (NRI and IDI indices). We also found that the use of CD64 levels in parallel with APACHE-II scores significantly improved the accuracy in predicting mortality (Table 4). Addition of the CD64 dataset to the APACHE-II scores yielded an NRI of 5.51% (Z value = 2.25, P = 0.024) and an IDI of 3.38% (Z = 3.73, P < 0.001).
Table 4.
Independent predictors of ICU mortality by multivariate logistic regression analysis in all patients (appending models summary)
| Predictor | Standard β value | OR | P value | -2 log-likelihood | Cox & Snell R2 | Nagelkerke R2 |
|---|---|---|---|---|---|---|
| Model I APACHE-II | 0.186 | 1.205 | < 0.001 | 356.66 | 0.201 | 0.385 |
| Final model | ||||||
| CD64 | 0.272 | 1.313 | 0.002 | 347.276 | 0.212 | 0.406 |
| APACHE-II | 0.179 | 1.196 | < 0.001 |
Subgroup analysis
A total of 381 patients were diagnosed with infectious diseases and 416 patients were diagnosed with conditions other than infectious diseases following ICU admission. In the infectious disease subgroup, the AUCs for the levels of FT3, CRP, CD64 and the APACHE II score calculated for use in predicting ICU mortality were 0.67 ± 0.041 (P < 0.001), 0.60 ± 0.037 (P = 0.022), 0.73 ± 0.034 (P < 0.001) and 0.85 ± 0.028 (P < 0.001), respectively (Figure 1B). In the non-infectious disease group, the AUCs for the levels of FT3, CRP, CD64 and the APACHE II score calculated for use in predicting ICU mortality were 0.72 ± 0.039 (P < 0.001), 0.74 ± 0.043 (P < 0.001), 0.67 ± 0.052 (P = 0.001) and 0.86 ± 0.034 (P < 0.001), respectively (Figure 1C).
Patients were further divided into three subgroups based on their age: aged less than 60 (n = 246), 60 to 80 (n = 350) and more than 80 (n = 201). In the subgroup consisting of patients aged less than 60 years old, the AUCs, sensitivities, specificities and cutoff values for CD64 for use in ICU mortality prediction were 0.73 ± 0.055 (P < 0.001), 57.14%, 86.70% and 2.13 pmol/L, respectively. In the subgroup consisting of patients aged 60 to 80, the AUCs, sensitivities, specificities and cutoff values for CD64 for ICU mortality prediction were 0.78 ± 0.038 (P < 0.001), 64.44%, 81.97% and 1.90 pmol/L, respectively. In the subgroup consisting of patients older than 80 years, the AUCs, sensitivities, specificities and cutoff values for CD64 for ICU mortality prediction were 0.74 ± 0.046 (P < 0.001), 75%, 67.37% and 1.59 pmol/L, respectively.
Correlations of CD64 with other variables
In our cohort, the level of CD64 was negatively correlated with albumin (r = -0.25, P < 0.001), TT3 (r = -0.20, P < 0.001), TT4 (r = -0.16, P < 0.001), FT3 (r = -0.29, P < 0.001), FT4 (r = -0.12, P = 0.001), rT3 (r = -0.093, P = 0.014). However, the level of CD64 positively associated with CRP (r = 0.36, P < 0.001) and APACHE-II (r = 0.35, P < 0.001).
Discussion
Neutrophils are a key cellular component of the innate immune system which play an essential role in host defense against infectious agents. Previous studies have suggested that neutrophil CD64 is a biomarker for predicting sepsis progression and mortality in critically ill patients [4,15]. It has been suggested that clinicians may take into account the levels of neutrophil CD64 in their decision to discontinue antimicrobial treatment in the absence of definitive microbiological results [20]. The use of CD64 has been argued to be more superior than the use of CRP [22]. A more recent study has identified that neutrophil CD64 levels were elevated in 25 septic ICU patients compared to 19 systemic inflammatory response syndromes (SIRS) patients and 24 outclinic patients [23]. However, one study found that assessing the levels of neutrophil CD64 alone is not sufficiently sensitive and specific for the diagnosis of sepsis in patients admitted to an emerging department [24]. The reliability in the use of CD64 in predicting ICU mortality is less clear.
We conducted our study with the use of a substantially larger cohort of patients enrolled through our ICU (797 patients consisting of 381 diagnosed with infectious diseases and 416 patients diagnosed with conditions other than infectious diseases). In our cohort, we found that CD64 had the greatest power for predicting ICU mortality other than APACHE II scores. Our study extends previous studies by showing that increased levels of neutrophil CD64 is associated with more favorable outcomes in septic patients [25]. The advantage of using CD64 as opposed to APACHE II scores is that collecting data for CD64 expression from patients is easier and faster than collecting data required for the calculation of the APACHE II score.
When we compared the ability of different indicators to predict mortality in ICU patients who either had an infectious or a non-infectious diagnosis, we find that neutrophil CD64 predicted mortality more accurately in the infectious subgroup compared to the non-infectious subgroup (AUC of the infectious subgroup: 0.73 ± 0.034 vs. AUC of the noninfectious subgroup: 0.67 ± 0.052). This is not surprising given that bacterial and viral infections are responsible for upregulating CD64 expression in immune cells [26,27], which provides an explanation as to why neutrophil CD64 is a superior biomarker for mortality in ICU patients with an infectious diagnosis. Consistently, previous studies revealed that when compared to patients with an underlying infection, those with severe traumatic brain injury or autoimmune conditions, including osteoarthritis and fibromyalgia, have reduced CD64 expression [28,29]. This suggests that other indicators, such as APACHE II scores, are more desirable for use in predicting ICU mortality associated with patients without an infectious underpinning.
We further performed univariate logistic regression analyses to examine the association between ICU mortality for each biomarker and found that the combined use of CD64 expression and APACHE II scores provides far superior accuracy in predicting mortality in patients enrolled in the ICU. These findings align with the previous observation showing that the use of two distinct indicators in parallel, such as the CD64-CRP combination, provides a more accurate diagnosis for sepsis [30]. In the subgroup analysis, further stratification of patients based on age indicates that the AUC for CD64 is highest in those aged 60-80 compared to other age groups, suggesting that CD64 as the greatest predictive power for ICU mortality for individuals in this age group.
The pathophysiological mechanism underlying the association of higher CD64 levels and unfavorable outcomes in ICU patients is unknown. We speculate that many of the patients admitted to the ICU have SIRS. The cause of SIRS can both be infectious or non-infectious, including pancreatitis and acute lung injury. Previous studies have found that CD64 expression is increased in patients with SIRS compared to healthy controls and those in the ICU without SIRS [31]. In addition, septic patients are reported to have an even higher expression of CD64 compared to SIRS individuals [31]. Lewis et al. [32] reported that CD64 expression is not upregulated in patients with localized infections without SIRS or those with non-infective SIRS. Therefore, it is likely that CD64 expression increases with the severity of SIRS.
The APACHE II classification system is a well-established scoring system which is highly useful for characterizing the diverse and heterogeneous nature of ICU patient groups. Well-defined classification of these patients provides a prognostic prediction models for use in patient care and management [33]. The ability to classify patients groups based on severity of illness allows researchers to use a personalized approach to treat critically ill patients and to better understanding of how disease severity of individual patients influences outcome. Furthermore, outcome data from a carefully described group of patients provides a methodology to evaluate the use of hospital resources and to compare the efficacy of ICU between different hospitals over time [33]. For example, it has been argued that the expected death rates derived from APACHE II scores can be compared with actual death rates as a method to evaluate efficacy of therapies [34]. Our study shows that the combined use of CD64 with other physiological parameters currently associated with APACHE II scoring system improves accuracy of its assessment, which we hope will further fine-tuning this existing scoring system, resulting in better management for a wider range of critically ill patients. Future studies could focus on investigating the pathogenic events that result in increased neutrophil CD64 expression in patients diagnosed with infectious and non-infectious diseases.
Conclusion
In our cohort consisting of 797 ICU patients, we found that CD64 had the greatest power for predicting ICU mortality other than APACHE II scores. CD64 provides superior capability to predict ICU mortality compared to CRP. In addition, the combined use of CD64 levels and APACHE II scores significantly improved the accuracy in predicting ICU mortality. Overall, CD64 is a useful biomarker for assessing the health status of patients enrolled in the ICU.
Acknowledgements
It was supported by 2013-2014 National clinical key specialty construction project.
Disclosure of conflict of interest
None.
Supporting Information
References
- 1.Naved SA, Siddiqui S, Khan FH. APACHE-II score correlation with mortality and length of stay in an intensive care unit. J Coll Physicians Surg Pak. 2011;21:4–8. [PubMed] [Google Scholar]
- 2.Zali AR, Seddighi AS, Seddighi A, Ashrafi F. Comparison of the acute physiology and chronic health evaluation score (APACHE) II with GCS in predicting hospital mortality of neurosurgical intensive care unit patients. Glob J Health Sci. 2012;4:179–84. doi: 10.5539/gjhs.v4n3p179. [DOI] [PMC free article] [PubMed] [Google Scholar]
- 3.Su YY, Li X, Li SJ, Luo R, Ding JP, Wang L, Cao GH, Wang DY, Gao JX. Predicting hospital mortality using APACHE II scores in neuro critically ill patients: a prospective study. J Neurol. 2009;256:1427–33. doi: 10.1007/s00415-009-5129-z. [DOI] [PubMed] [Google Scholar]
- 4.Wang F, Pan W, Pan S, Wang S, Ge Q, Ge J. Usefulness of N-terminal pro-brain natriuretic peptide and C-reactive protein to predict ICU mortality in unselected medical ICU patients: a prospective, observational study. Crit Care. 2011;15:R42. doi: 10.1186/cc10004. [DOI] [PMC free article] [PubMed] [Google Scholar]
- 5.Wang F, Pan W, Wang H, Wang S, Pan S, Ge J. Relationship between thyroid function and ICU mortality: a prospective observation study. Critical Care. 2012;16:R11. doi: 10.1186/cc11151. [DOI] [PMC free article] [PubMed] [Google Scholar]
- 6.Groselj-Grenc M, Ihan A, Pavcnik-Arnol M, Kopitar AN, Gmeiner-Stopar T, Derganc M. Neutrophil and monocyte CD64 indexes, lipopolysaccharide-binding protein, procalcitonin and C-reactive protein in sepsis of critically ill neonates and children. Intensive Care Med. 2009;35:1950–1958. doi: 10.1007/s00134-009-1637-7. [DOI] [PubMed] [Google Scholar]
- 7.Davis BH, Olsen SH, Ahmad E, Bigelow NC. Neutrophil CD64 is an improved indicator of infection or sepsis in emergency department patients. Arch Pathol Lab Med. 2006;130:654–661. doi: 10.5858/2006-130-654-NCIAII. [DOI] [PubMed] [Google Scholar]
- 8.Bhandari V, Wang C, Rinder C, Rinder H. Hematologic profile of sepsis in neonates: neutrophil CD64 as a diagnostic marker. Pediatrics. 2008;121:129–134. doi: 10.1542/peds.2007-1308. [DOI] [PubMed] [Google Scholar]
- 9.Cardelli P, Ferraironi M, Amodeo R, Tabacco F, De Blasi RA, Nicoletti M, Sessa R, Petrucca A, Costante A, Cipriani P. Evaluation of neutrophil CD64 expression and procalcitonin as useful markers in early diagnosis of sepsis. Int J Immunopathol Pharmacol. 2008;21:43–49. doi: 10.1177/039463200802100106. [DOI] [PubMed] [Google Scholar]
- 10.Dilli D, Oğuz ŞS, Dilmen U, Köker MY, Kızılgün M. Predictive values of neutrophil CD64 expression compared with interleukin-6 and C-reactive protein in early diagnosis of neonatal sepsis. Clin Lab Anal. 2010;24:363–370. doi: 10.1002/jcla.20370. [DOI] [PMC free article] [PubMed] [Google Scholar]
- 11.Ng PC, Li G, Chui KM, Chu WC, Li K, Wong RP, Chik KW, Wong E, Fok TF. Neutrophil CD64 is a sensitive diagnostic marker for early-onset neonatal infection. Pediatr Res. 2004;56:796–803. doi: 10.1203/01.PDR.0000142586.47798.5E. [DOI] [PubMed] [Google Scholar]
- 12.Nuutila J, Hohenthal U, Laitinen I, Kotilainen P, Rajamäki A, Nikoskelainen J, Lilius EM. Simultaneous quantitative analysis of FcγRI (CD64) expression on neutrophils and monocytes: a new, improved way to detect infections. Immunol Methods. 2007;328:189–200. doi: 10.1016/j.jim.2007.09.002. [DOI] [PubMed] [Google Scholar]
- 13.Icardi M, Erickson Y, Kilborn S, Stewart B, Grief B, Scharnweber G. CD64 index provides simple and predictive testing for detection and monitoring of sepsis and bacterial infection in hospital patients. Clin Microbiol. 2009;47:3914–3919. doi: 10.1128/JCM.00628-09. [DOI] [PMC free article] [PubMed] [Google Scholar]
- 14.Livaditi O, Kotanidou A, Psarra A, Dimopoulou I, Sotiropoulou C, Augustatou K, Papasteriades C, Armaganidis A, Roussos C, Orfanos SE, Douzinas EE. Neutrophil CD64 expression and serum IL-8: Sensitive early markers of severity and outcome in sepsis. Cytokine. 2006;36:283–290. doi: 10.1016/j.cyto.2007.02.007. [DOI] [PubMed] [Google Scholar]
- 15.Hsu KH, Chan MC, Wang JM, Lin LY, Wu CL. Comparison of Fcgamma receptor expression on neutrophils with procalcitonin for the diagnosis of sepsis in critically ill patients. Respirology. 2011;16:152–160. doi: 10.1111/j.1440-1843.2010.01876.x. [DOI] [PubMed] [Google Scholar]
- 16.Youden WJ. Index for rating diagnostic tests. Cancer. 1950;39:32–35. doi: 10.1002/1097-0142(1950)3:1<32::aid-cncr2820030106>3.0.co;2-3. [DOI] [PubMed] [Google Scholar]
- 17.Nagelkerke N. A note on a general definition of the coefficient of determination. Biometrika. 1991;78:691–692. [Google Scholar]
- 18.Pencina MJ, D’Agostino RB Sr, D’Agostino RB Jr, Vasan RS. Evaluating the added predictive ability of a new marker: from area under the ROC curve to reclassification and beyond. Stat Med. 2008;27:157–172. doi: 10.1002/sim.2929. [DOI] [PubMed] [Google Scholar]
- 19.Cook NR, Ridker PM. Advances in measuring the effect of individual predictors of cardiovascular risk: the role of reclassification measures. Ann Intern Med. 2009;150:795–802. doi: 10.7326/0003-4819-150-11-200906020-00007. [DOI] [PMC free article] [PubMed] [Google Scholar]
- 20.Hoffmann JJ. Neutrophil CD64: a diagnostic marker for infection and sepsis. Clin Chem Lab Med. 2009;47:903–916. doi: 10.1515/CCLM.2009.224. [DOI] [PubMed] [Google Scholar]
- 21.Dimoula A, Pradier O, Kassengera Z, Dalcomune D, Turkan H, Vincent JL. Serial determinations of neutrophil CD64 expression for the diagnosis and monitoring of sepsis in critically Ill patients. Clin Infect Dis. 2014;58:820–829. doi: 10.1093/cid/cit936. [DOI] [PubMed] [Google Scholar]
- 22.Hoffmann JJ. Neutrophil CD64: a diagnostic marker for infection and sepsis. Clin Chem Lab Med. 2009;47:903–916. doi: 10.1515/CCLM.2009.224. [DOI] [PubMed] [Google Scholar]
- 23.Gerrits JH, McLaughlin PM, Nienhuis BN, Smit JW, Loef B. Polymorphic mononuclear neutrophils CD64 index for diagnosis of sepsis in postoperative surgical patients and critically ill patients. Clin Chem Lab Med. 2013;51:897–905. doi: 10.1515/cclm-2012-0279. [DOI] [PubMed] [Google Scholar]
- 24.Gámez-Díaz LY, Enriquez LE, Matute JD, Velásquez S, Gómez ID, Toro F, Ospina S, Bedoya V, Arango CM, Valencia ML, De La Rosa G, Gómez CI, García A, Patiño PJ, Jaimes FA. Diagnostic accuracy of HMGB-1, sTREM-1, and CD64 as markers of sepsis in patients recently admitted to the emergency department. Acad Emerg Med. 2011;18:807–15. doi: 10.1111/j.1553-2712.2011.01113.x. [DOI] [PubMed] [Google Scholar]
- 25.Danikas DD, Karakantza M, Theodorou GL, Sakellaropoulos GC, Gogos CA. Epub Prognostic value of phagocytic activity of neutrophils and monocytes in sepsis. Correlation to CD64 and CD14 antigen expression. Clin Exp Immunol. 2008;154:87–97. doi: 10.1111/j.1365-2249.2008.03737.x. [DOI] [PMC free article] [PubMed] [Google Scholar]
- 26.Gilbody J, Lipman MC, Johnson MA, Atkins M, Poulter LW. Progression of HIV disease is associated with increased expression of Fc gammaRI and CR1 on alveolar macrophages. Clin Exp Immunol. 1997;107:31–6. doi: 10.1046/j.1365-2249.1997.d01-908.x. [DOI] [PMC free article] [PubMed] [Google Scholar]
- 27.Fjaertoft G, Håkansson LD, Pauksens K, Sisask G, Venge P. Neutrophil CD64 (FcgammaRI) expression is a specific marker of bacterial infection: a study on the kinetics and the impact of major surgery. Scand J Infect Dis. 2007;39:525–35. doi: 10.1080/00365540601113693. [DOI] [PubMed] [Google Scholar]
- 28.Allen E, Bakke AC, Purtzer MZ, Deodhar A. Neutrophil CD64 expression: distinguishing acute inflammatory autoimmune disease from systemic infections. Ann Rheum Dis. 2002;61:522–5. doi: 10.1136/ard.61.6.522. [DOI] [PMC free article] [PubMed] [Google Scholar]
- 29.Fitrolaki DM, Dimitriou H, Kalmanti M, Briassoulis G. BMC Pediatr. CD64-Neutrophil expression and stress metabolic patterns in early sepsis and severe traumatic brain injury in children. BMC Pediatr. 2013;13:31. doi: 10.1186/1471-2431-13-31. [DOI] [PMC free article] [PubMed] [Google Scholar]
- 30.Dimoula A, Pradier O, Kassengera Z, Dalcomune D, Turkan H, Vincent JL. Serial determinations of neutrophil CD64 expression for the diagnosis and monitoring of sepsis in critically Ill patients. Clin Infect Dis. 2014;58:820–9. doi: 10.1093/cid/cit936. [DOI] [PubMed] [Google Scholar]
- 31.Qureshi SS, Lewis SM, Gant VA, Treacher D, Davis BH, Brown KA. Increased distribution and expression of CD64 on blood polymor-phonuclear cells from patients with the systemic inflammatory response syndrome (SIRS) Clin Exp Immunol. 2001;125:258–65. doi: 10.1046/j.1365-2249.2001.01596.x. [DOI] [PMC free article] [PubMed] [Google Scholar]
- 32.Lewis SM, Treacher DF, Bergmeier L, Brain SD, Chambers DJ, Pearson JD, Brown KA. Plasma from patients with sepsis up-regulates the expression of CD49d and CD64 on blood neutrophils. Respir Cell Mol Biol. 2009;40:724–32. doi: 10.1165/rcmb.2008-0252OC. [DOI] [PubMed] [Google Scholar]
- 33.Knaus WA, Draper EA, Wagner DP, Zimmerman JE. APACHE II: a severity of disease classification system. Crit Care Med. 1985;13:818–29. [PubMed] [Google Scholar]
- 34.Knaus WA, Le Gall JR, Wagner DP, Draper EA, Loirat P, Campos RA, Cullen DJ, Kohles MK, Glaser P, Granthil C, Mercier P, Nicolas F, Nikki P, Shin B, Snyder JV, Wattel F, Zimmerman JE. A comparison of intensive care in the U. S.A. and France. Lancet. 1982;2:642–6. doi: 10.1016/s0140-6736(82)92748-9. [DOI] [PubMed] [Google Scholar]
Associated Data
This section collects any data citations, data availability statements, or supplementary materials included in this article.